Article

Wildfires Dynamics in Siberian Larch Forests

by
Evgenii I. Ponomarev
1,2,
Viacheslav I. Kharuk
1,2,* and
Kenneth J. Ranson
3
1
V.N. Sukachev Institute of Forest, Siberian Branch of Russian Academy of Sciences, Krasnoyarsk 660036, Russia
2
Siberian Federal University, Krasnoyarsk 660041, Russia
3
NASA Goddard Space Flight Center, Greenbelt, Maryland 20771, USA
*
Author to whom correspondence should be addressed.
Forests 2016, 7(6), 125; https://doi.org/10.3390/f7060125
Submission received: 29 February 2016 / Revised: 5 June 2016 / Accepted: 8 June 2016 / Published: 17 June 2016

Abstract

:
Wildfire number and burned area temporal dynamics within all of Siberia and along a south-north transect in central Siberia (45°–73° N) were studied based on NOAA/AVHRR (National Oceanic and Atmospheric Administration/ Advanced Very High Resolution Radiometer) and Terra/MODIS (Moderate Resolution Imaging Spectroradiometer) data and field measurements for the period 1996–2015. In addition, fire return interval (FRI) along the south-north transect was analyzed. Both the number of forest fires and the size of the burned area increased during recent decades (p < 0.05). Significant correlations were found between forest fires, burned areas and air temperature (r = 0.5) and drought index (The Standardized Precipitation Evapotranspiration Index, SPEI) (r = −0.43). Within larch stands along the transect, wildfire frequency was strongly correlated with incoming solar radiation (r = 0.91). Fire danger period length decreased linearly from south to north along the transect.  Fire return interval increased from 80 years at 62° N to 200 years at the Arctic Circle (66°33’ N), and to about 300 years near the northern limit of closed forest stands (about 71°+ N). That increase was negatively correlated with incoming solar radiation (r = −0.95).

1. Introduction

Siberia is within the region of observed and predicted future accelerated climate change [1]. Increased air temperature may lead to an increase in wildfire frequency and burned area. According to some previous publications, the annual burned area in Russia was estimated as 4 to 20 MHa [2,3]. According to official data, the annual burned area was 0.55–2.4 MHa (http://www.gks.ru; [4]). More than 70% and up to 90% (i.e., 2–14 MHa annually) of the total area burned in Russia occurred in Siberia [3,5]. The majority (>50%) of wildfires in Siberia were observed in larch (Larix sibirica, L. gmelinii), because it dominated forest communities and due to its low crown closure which spread surface fires. The dense lichen and moss ground cover can support severe groundfires covering up to several million hectares. Due to the shallow root zone (limited by permafrost) those wildfires were mostly stand-replacing fires [6]. Thus, the largest area of stand-replacement fires (0.58 MHa) in the last decade occurred in Yakutia (Northeast Siberia) [7]. Non stand-replacement fires were most common in the forests of southern Siberia. Gauthier et al. (2015) found that at high-latitude areas in Canada and Siberia the mean annual fraction burned was similar and ranges within 2%–2.5% of the forested area [8].
The Siberian taiga is expected to become more prone to forest fires [3,9]. This may result in an increase in both fire frequency and carbon emissions, and may convert this area to a source for greenhouse gases [1]. Surprisingly, the important issue of climate impact on the wildfires and burns dynamics in Siberia has been discussed in only a few papers [3,5,7,10,11]. It was also shown that the occurrence of extreme fire events in Central Siberia and the Trans-Baikal region were related to soil moisture and precipitation anomalies [5,10]. Recently, Ponomarev and Kharuk [11] showed an increase in both fire frequency and size of the burned area in the Altai-Sayan region of southern Siberia [11].
The goal of this paper is an analysis of climate impacts during recent decades on fire frequency and burned area in Siberia. We sought answers to the following questions:
(i)
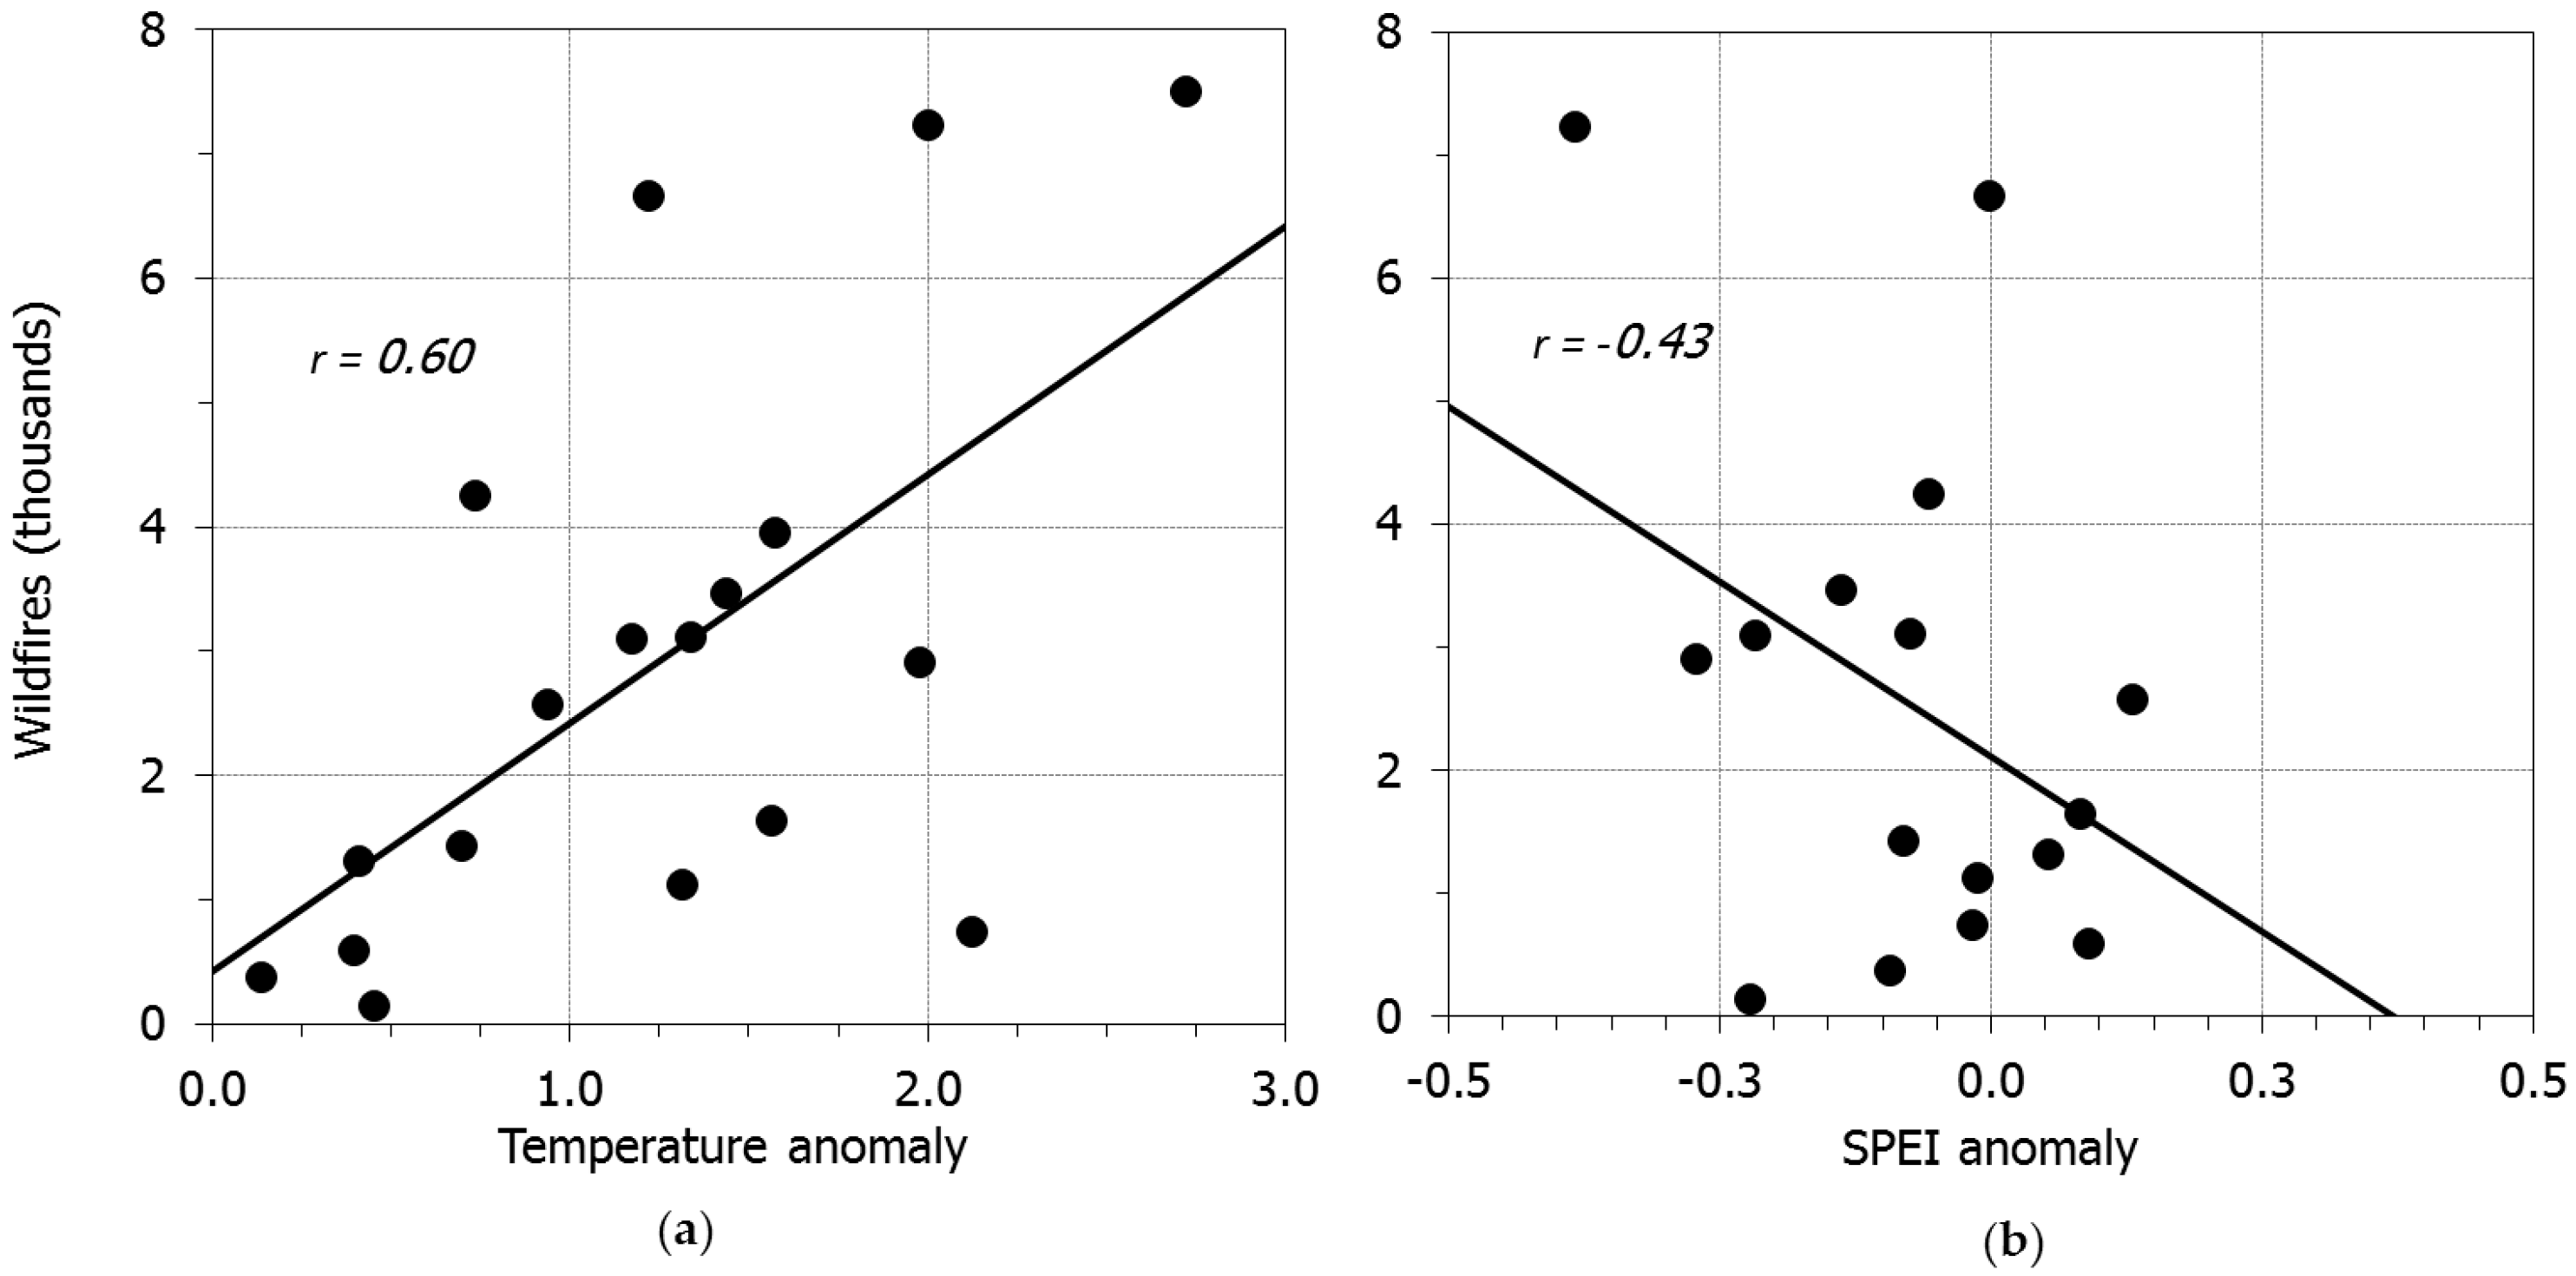
what is the fire frequency and burned area within (a) all of Siberia and (b) along a “south-north” gradient? How do these relate to climate variables?
(ii)
what is the fire return interval dependence on the “south-north” climatic gradient?

2. Materials and Methods

2.1. Study Area

The study covered the whole territory of Siberia. In addition, a south-north transect was selected for detailed analysis as shown in Figure 1. The whole Siberia polygon covers 1000 MHa with a forested area of about 600 MHa. Maps of forest types (with 1000 m spatial resolution) within the area were derived from the forest map of Bartalev et al., 2011 [12].
The territory of Siberia includes the following forest types: Light coniferous taiga composed of larch (50%), Scots pine (Pinus sylvestris) (about 18%) and mixed stands; “dark coniferous stands” composed of fir (Abies sibirica), spruce (Picea obovata), and Siberian pine (Pinus sibirica) (area < 17% of total), and deciduous/mixed forests (Betula sp., Populus tremula) (about 10% of total area). Forests dominated by larch (Larix sibirica, L. gmelinii) range over an area 270–300 MHa; the area of Scots pine was 120 MHa, dark coniferous were about 100 MHa and mixed forests about 77 MHa.
Within the “south-north” transect we considered wildfires within larch forests only. This was done for consistency, i.e., excludes the impact of different forests types on the fire patterns along the south-north transect. The transect area is divided into six zones with a width of 5-degrees latitude (Figure 1). The transect length was 2900 km with an area of about 400 MHa. The transect includes the known range larch stands—from the southern border in Mongolia to northern boundary of closed forests (about 72°+ N).

2.2. Methods

The Sukachev Institute of Forest wildfires database was used in this study. This database was generated based on National Oceanic and Atmospheric Administration’ Advanced Very High Resolution Radiometer (NOAA/AVHRR) (1996–2003) and Terra/Aqua/MODIS (Moderate Resolution Imaging Spectroradiometer) (2003–2015) scenes acquired directly by Sukachev Institute of Forest receiving station. The database contains daily wildfire information over all of Siberia. Both satellites used have similar overlapping characteristics. Thus, we used similar (1000 m) pixel size and wavelength bands. In earlier studies (e.g., Loboda et al., 2004 [13]) it was shown that burned area estimation based on NOAA/AVHRR and Terra/MODIS sensors were highly correlated. We processed satellite scenes using threshold-based software “Fire Processor 4.03” which was elaborated in the Sukachev Forest Institute. A threshold method was used for detecting “active pixels” based on reflectance in near-infrared (0.8–0.9 µm) and emission in medium-infrared (3.5–4.0 µm) and long wave infrared (11–12 µm) spectral bands. The method used enables detection of each wildfire based on only one satellite record. Typically, for large-scale fires, 50–100 satellite records were used in the analysis.
Annual polygonal layers for the years 1996–2015 were obtained using GIS software (ESRI ArcGIS). All active fire pixel data were preprocessed and aggregated into fire polygons based on spatial and temporal thresholds. The resulting wildfire database also included wildfires’ coordinates, date, area burned, and energy characteristics.
Landsat/TM/ETM scenes with higher (pixel size = 30 m) resolution were used for burned area correction. For this purpose, a sample size of 5% of the total burned area in Siberia was used. Based on the comparison of Landsat vs. AVHRR/MODIS burned area, the regression equations were generated to correct AVHRR/MODIS estimates. The latter were used for the burned area database correction. Along with this, a geometric correction of the fire polygons was also performed [14].
A larch cover map was obtained from a vegetation map (consisting of areas with larch presence >80%) [12]. The map was used to locate wildfires within larch forests. Every burn polygon was intersected with layer of Larch forest polygons in the GIS. Only part of a burn included in the Larch class was used for further analysis. Then, the burned area was normalized with respect to the larch area within each transect cell (i.e., the burned area was divided by the larch area).
The following parameters were calculated:
(a) Normalized wildfires number (NFN) for areas with larch only, defined as:
NFN =   n N × 100 %
where n—fires number within given latitude range; N—total fires number within transect for areas with larch only.
(b) Relative fire frequency (RFF, number of fires per 105 ha per given time interval), defined as:
R F F = n S L a r c h   ×   t   ×   10 5
where n—number of fires within the latitude zone for areas with larch only; Slarch—larch forests area within the latitude zone, t—time interval, 105—normalizing coefficient.
(c) Relative burned area (RBA, %):
R B A = S b u r n e d ( i ) S L a r c h   ×   t   ×   100 %
where Sburned—total larch burned area within given latitude zone (i); Slarch (i)—area of larch forests within given latitude zone (i), t—time interval.
The “effective” fire danger period was used in this study, which was defined as the time interval in which 90% of burns occurred.
Monthly averaged air temperature and precipitation data (0.5° × 0.5° cell size) for the whole of Siberia were taken from Climatic Research Unit (http://www.cru.uea.ac.uk; [15,16]). Monthly drought index SPEI (Standardized Precipitation Evapotranspiration Index) data were obtained from SPEI Global Drought Monitor (http://sac.csic.es/spei/map/maps.html; [17]; grid cell size was 0.5° × 0.5°). SPEI was calculated as the difference between precipitation (P) and potential evapotranspiration (PET) [18]:
SPEI i = P i PET i
Solar radiation values were taken from the Solar Radiation and Climate of the Earth database at (http://www.solar-climate.com; [19]). The data were averaged with 1-degree latitude resolution. Data were corrected with respect to solar zenith angle, daylight length and air mass impact along meridian.
Along with satellite data, fire return intervals (FRI) were analyzed within the northern portion of the transect (62°–71°+ N). FRI were calculated based on the dendrochronology analysis of samples taken from trees with visual evidence burn on the bole. FRI was defined as the time interval between consecutive stand-replacing fires. In spite of periodic wildfires, some old trees (>300 year) were present with several fire-scars. Trees were sampled until at least 12 samples were collected. In this study we used earlier obtained data on FRI in northern larch forests [6,20,21] which were analyzed against insolation along the meridian. Test sites where FRI data were obtained are shown on Figure 1.
ESRI ArcGIS software was used for GIS analysis. Statsoft Statistica was used for statistical analysis.

3. Results and Discussion

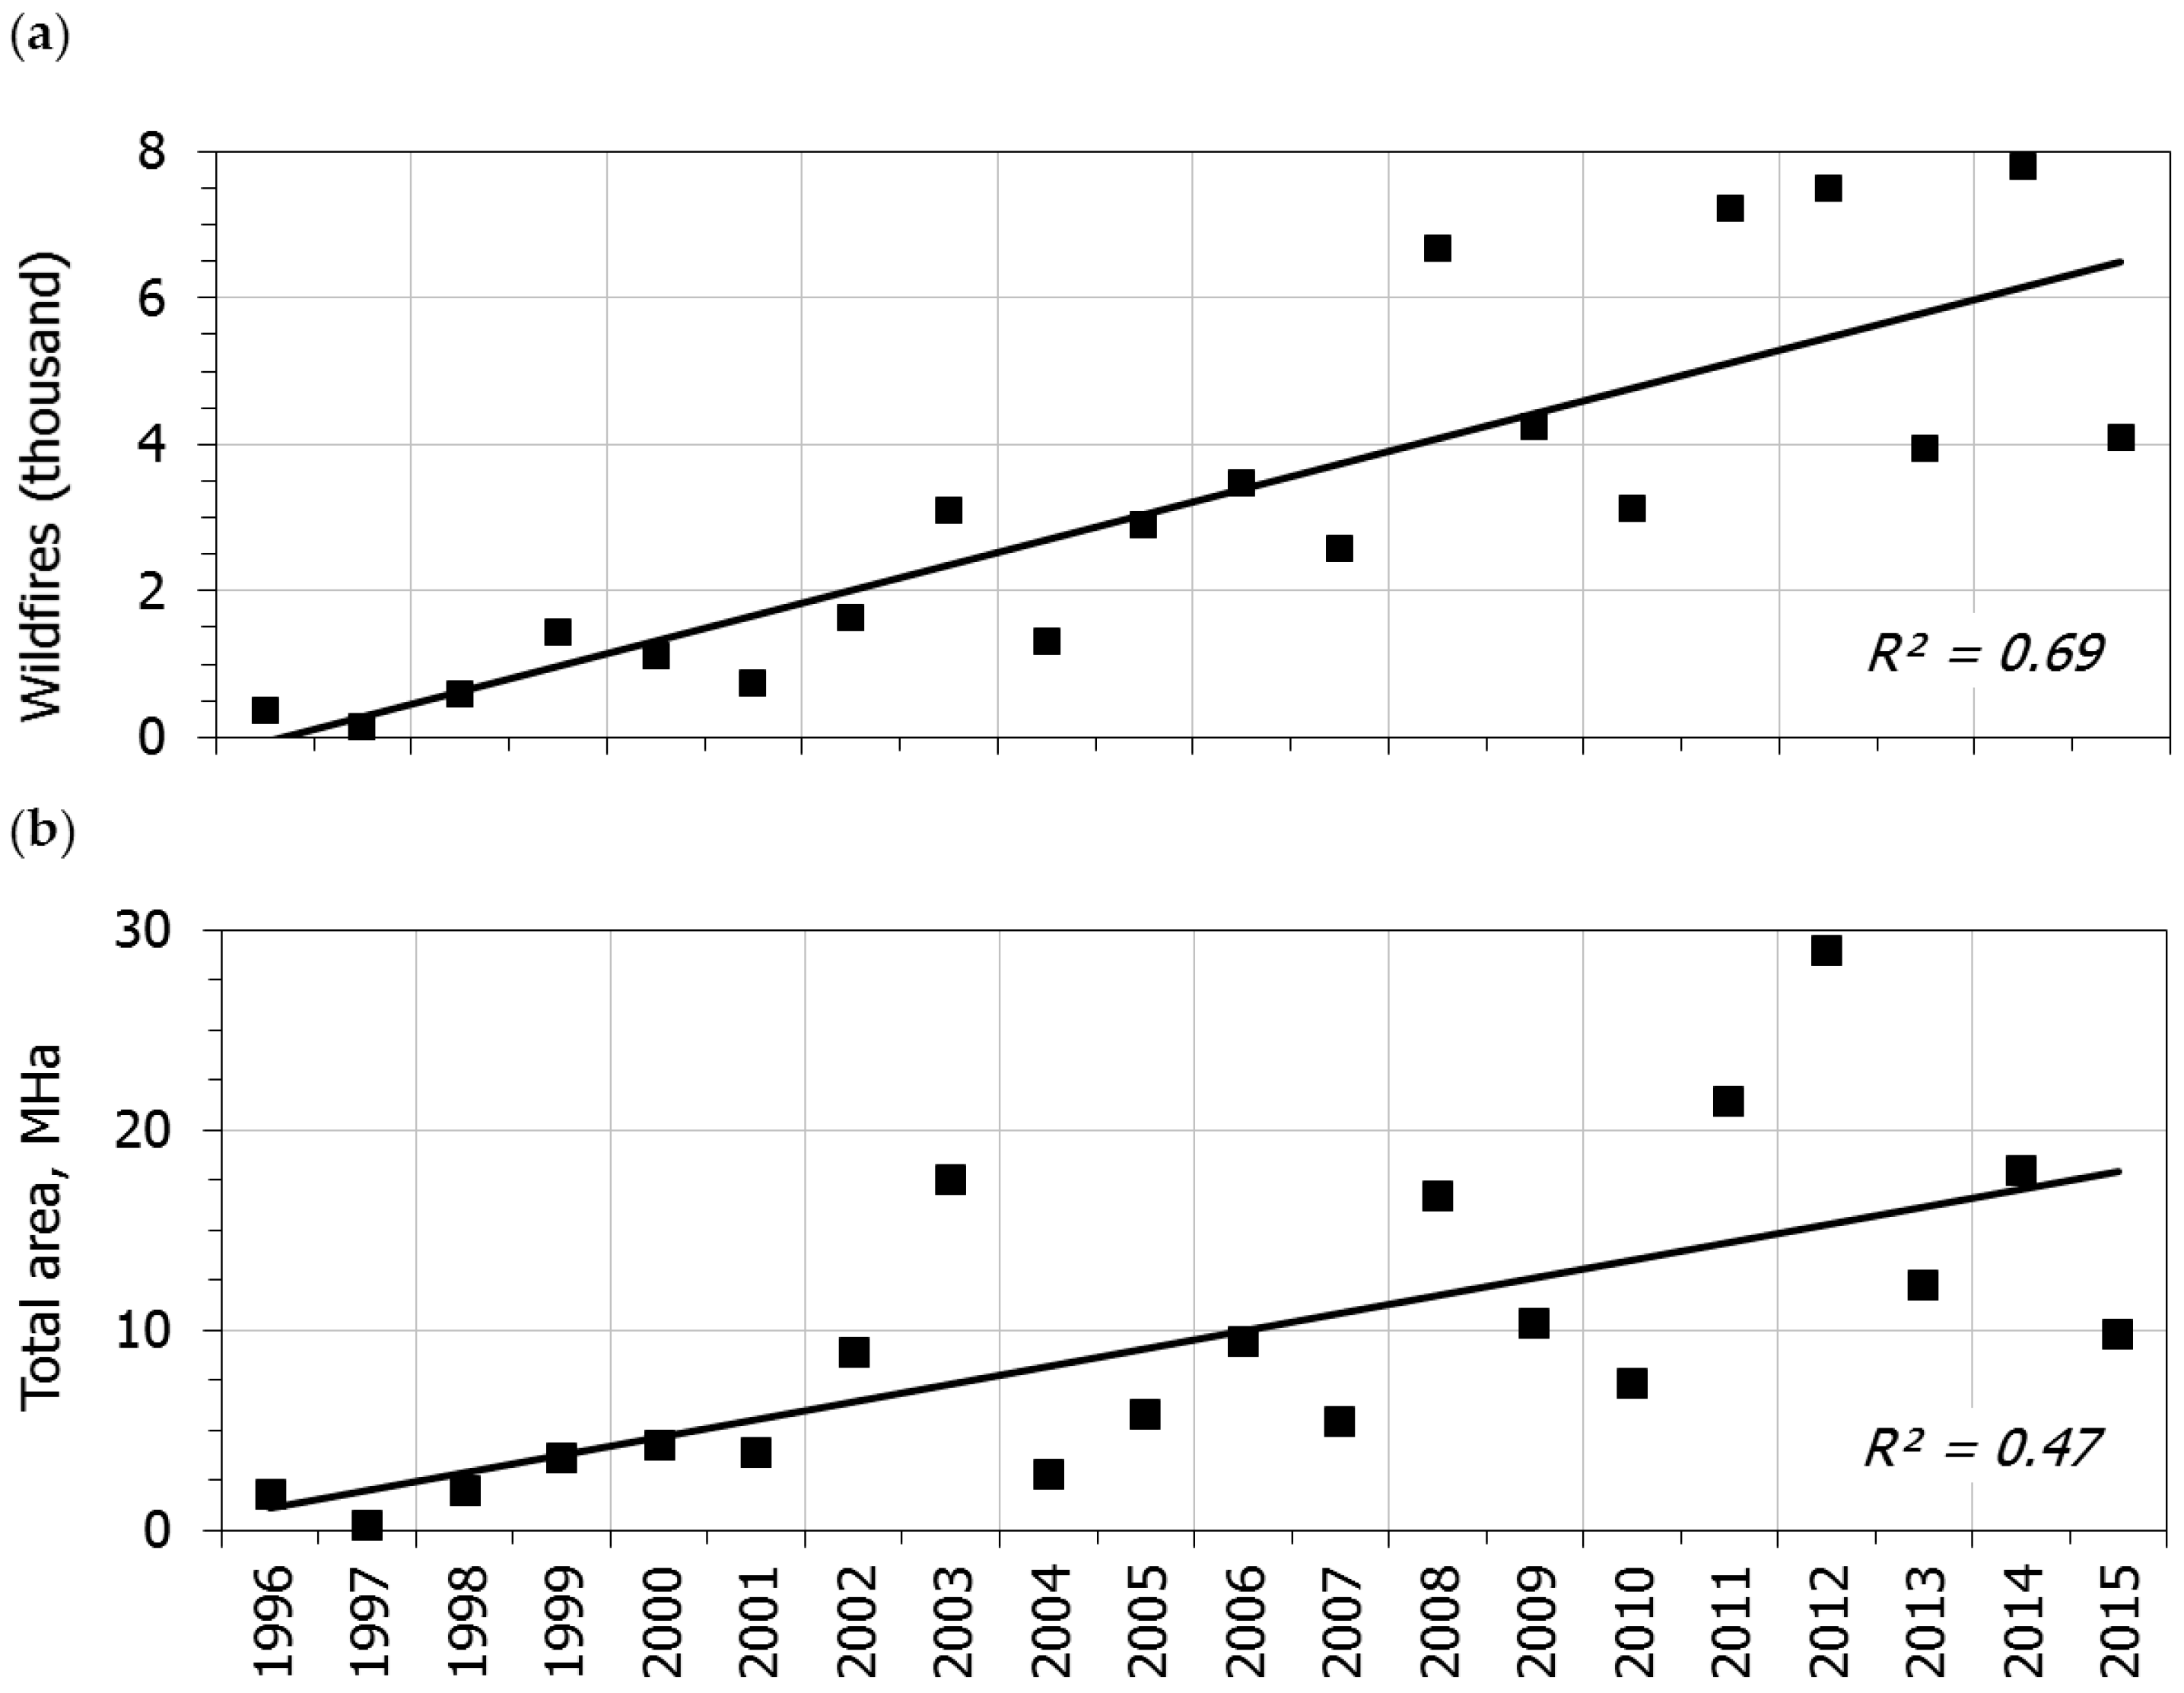
3.1. Long-Term Wildfire Statistics

Long-term statistics of annual wildfires area and the number of fires in Siberia showed a positive trend (R2 = 0.69 and 0.47, respectively; p < 0.05) (Figure 2). The correlation of annual burned area with air temperature anomalies was the highest during the June–July period (r = 0.67); correlation with temperature anomalies during the whole fire season (April–September) was lower (r = 0.56). Similarly, correlations between wildfires numbers and air temperature anomalies were higher for June–July (r = 0.60 vs. r = 0.55 for April–September) (Figure 3).
Correlation with long-term precipitation anomalies within all Siberia was non-significant, also these correlations should be significant at a smaller scale.

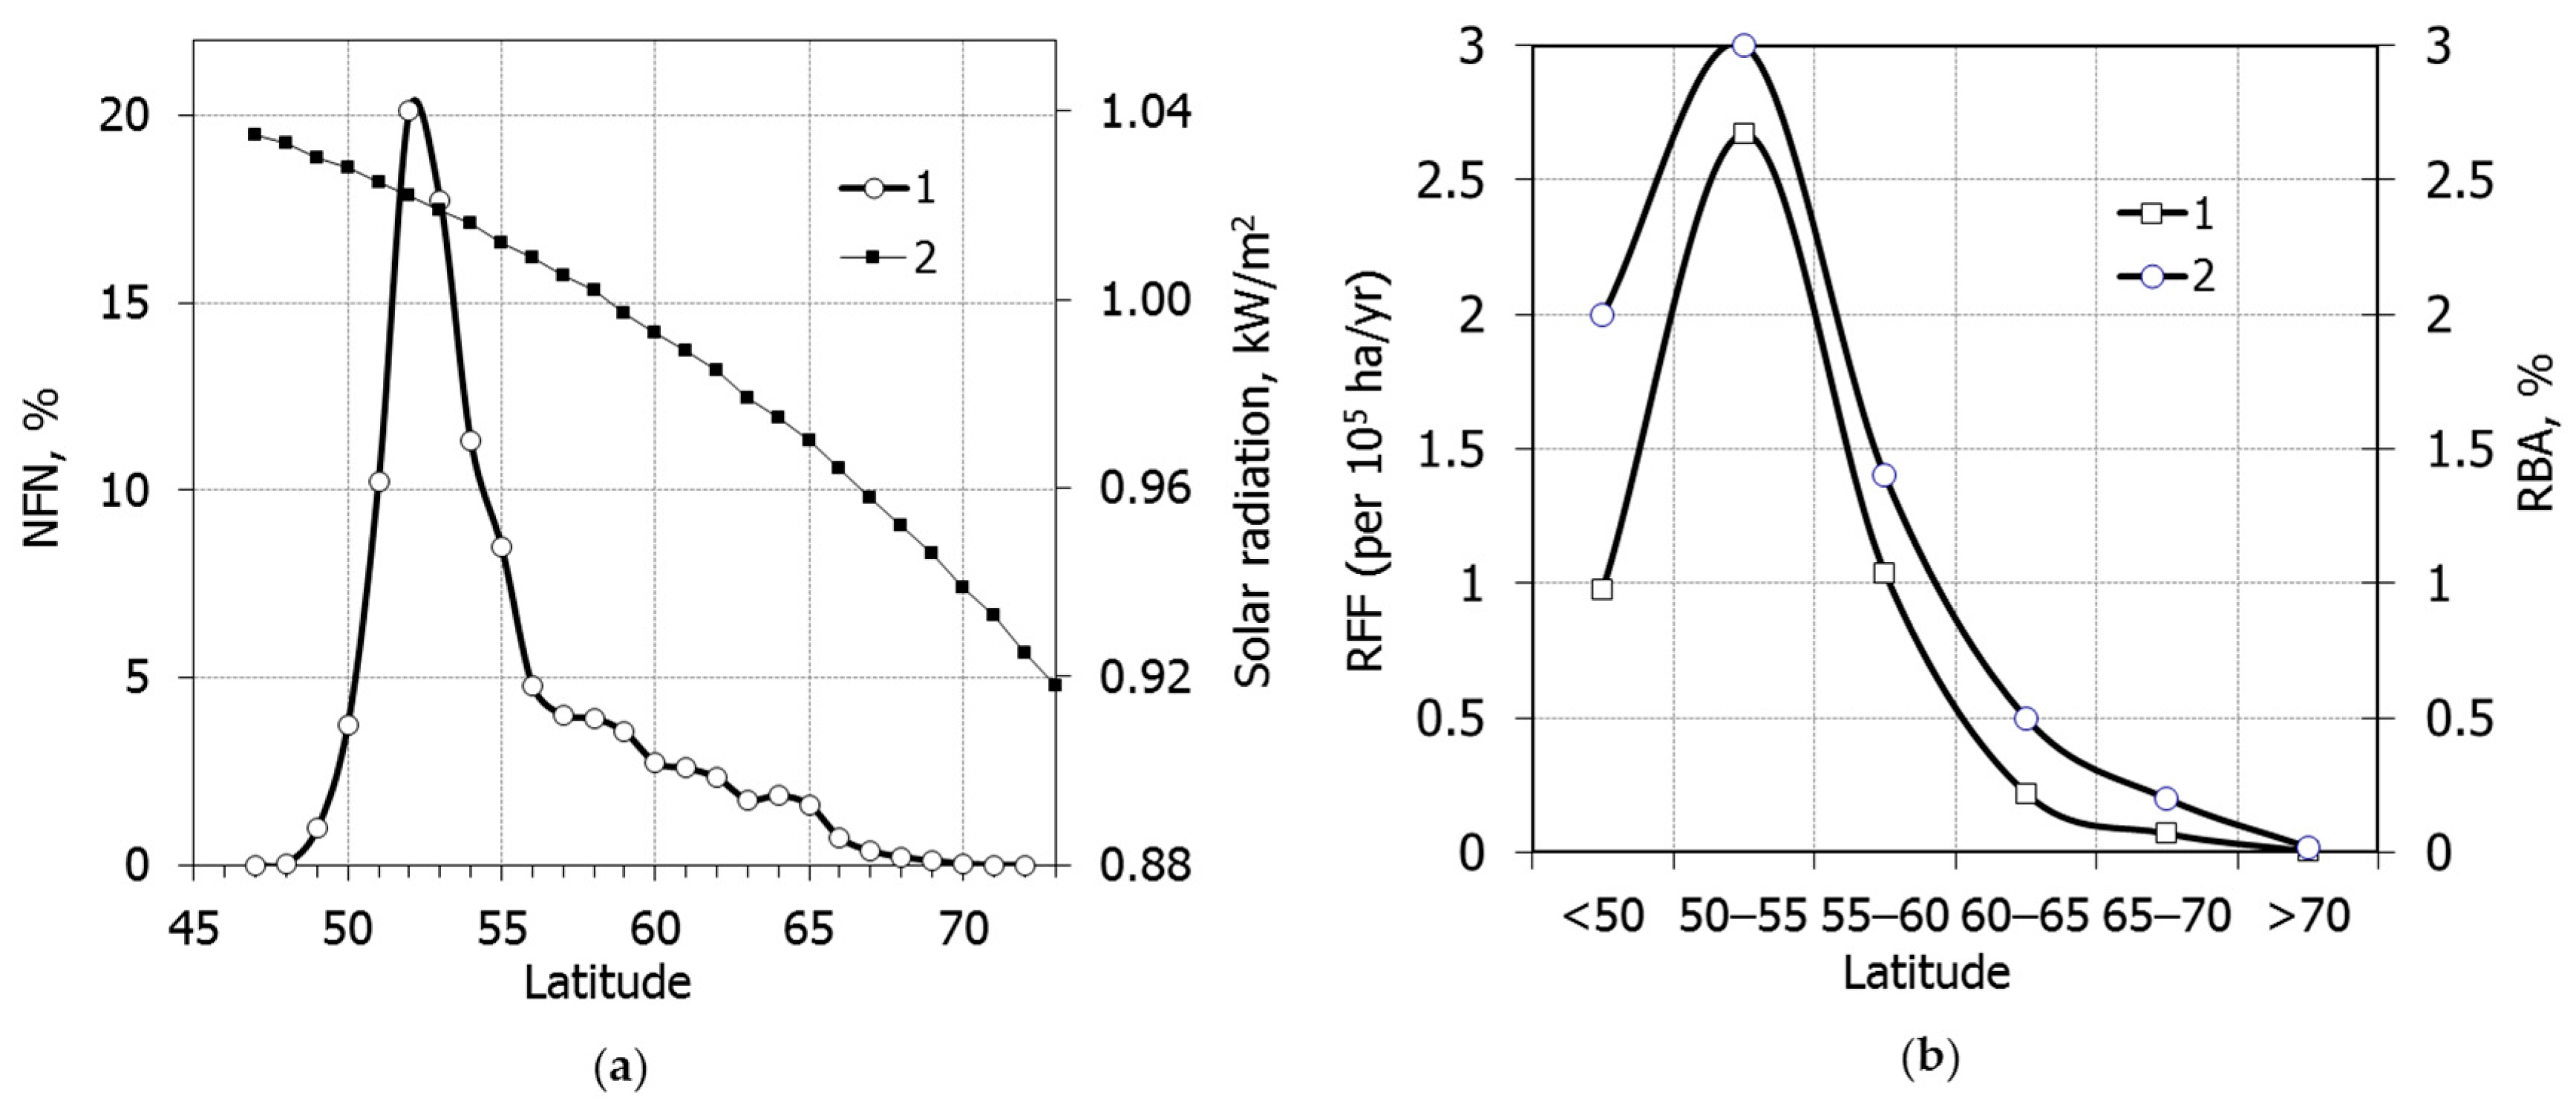
3.2. Wildfires vs Latitude along Transect

The wildfires distribution along latitude was a quasi-normal type (Figure 4). The fire location maximum was observed at about 52° N with an exponential decrease as latitude increased (Figure 4a). The distribution of wildfires number along the south-north transect (52°–71° N range) was strongly correlated with incoming solar radiation along the latitudinal gradient (r = 0.81; Figure 4a). Wildfires number (as well as relative fire frequency and relative burned area; Figure 4b) showed an exponential decrease southward (latitude range <52°), which is attributed to the extreme topography of the high southern mountains, which is atypical of the northward area. However, along with dependence on solar radiation, fire frequency was also linked to the level of anthropogenic impact [22]. The relative burned area (RBA) and relative fire frequency (RFF) were correlated with solar radiation (r = 0.87 and r = 0.89, respectively) and were strongly decreased from south to north along the transect (Figure 4b). Mean RBA for the transect is 1.19%. In western Canada, for comparison, RBA was reported to be 0.56% [19]. RFF at high (60°+ N) latitudes (0.065–0.22 per 105 ha fires/year) were similar to the fire frequency value for western Canada (about 0.09 per 105 ha/year) [23], and considerably higher for the southern part of the transect (0.98–2.67) (Figure 4b).
The spatial and temporal variations of relative fire frequency and relative burned area along the transect is shown on Figure 5. The seasonal histogram of relative fire frequency and burned area had two maximums within the range 45°–55° N (corresponding to spring-early summer and to late summer-early fall; both maxima are statistically significant based on Fisher’s criteria). Northward of 55° N, seasonal fire frequency and burned area distributions become unimodal (Figure 5a,b).

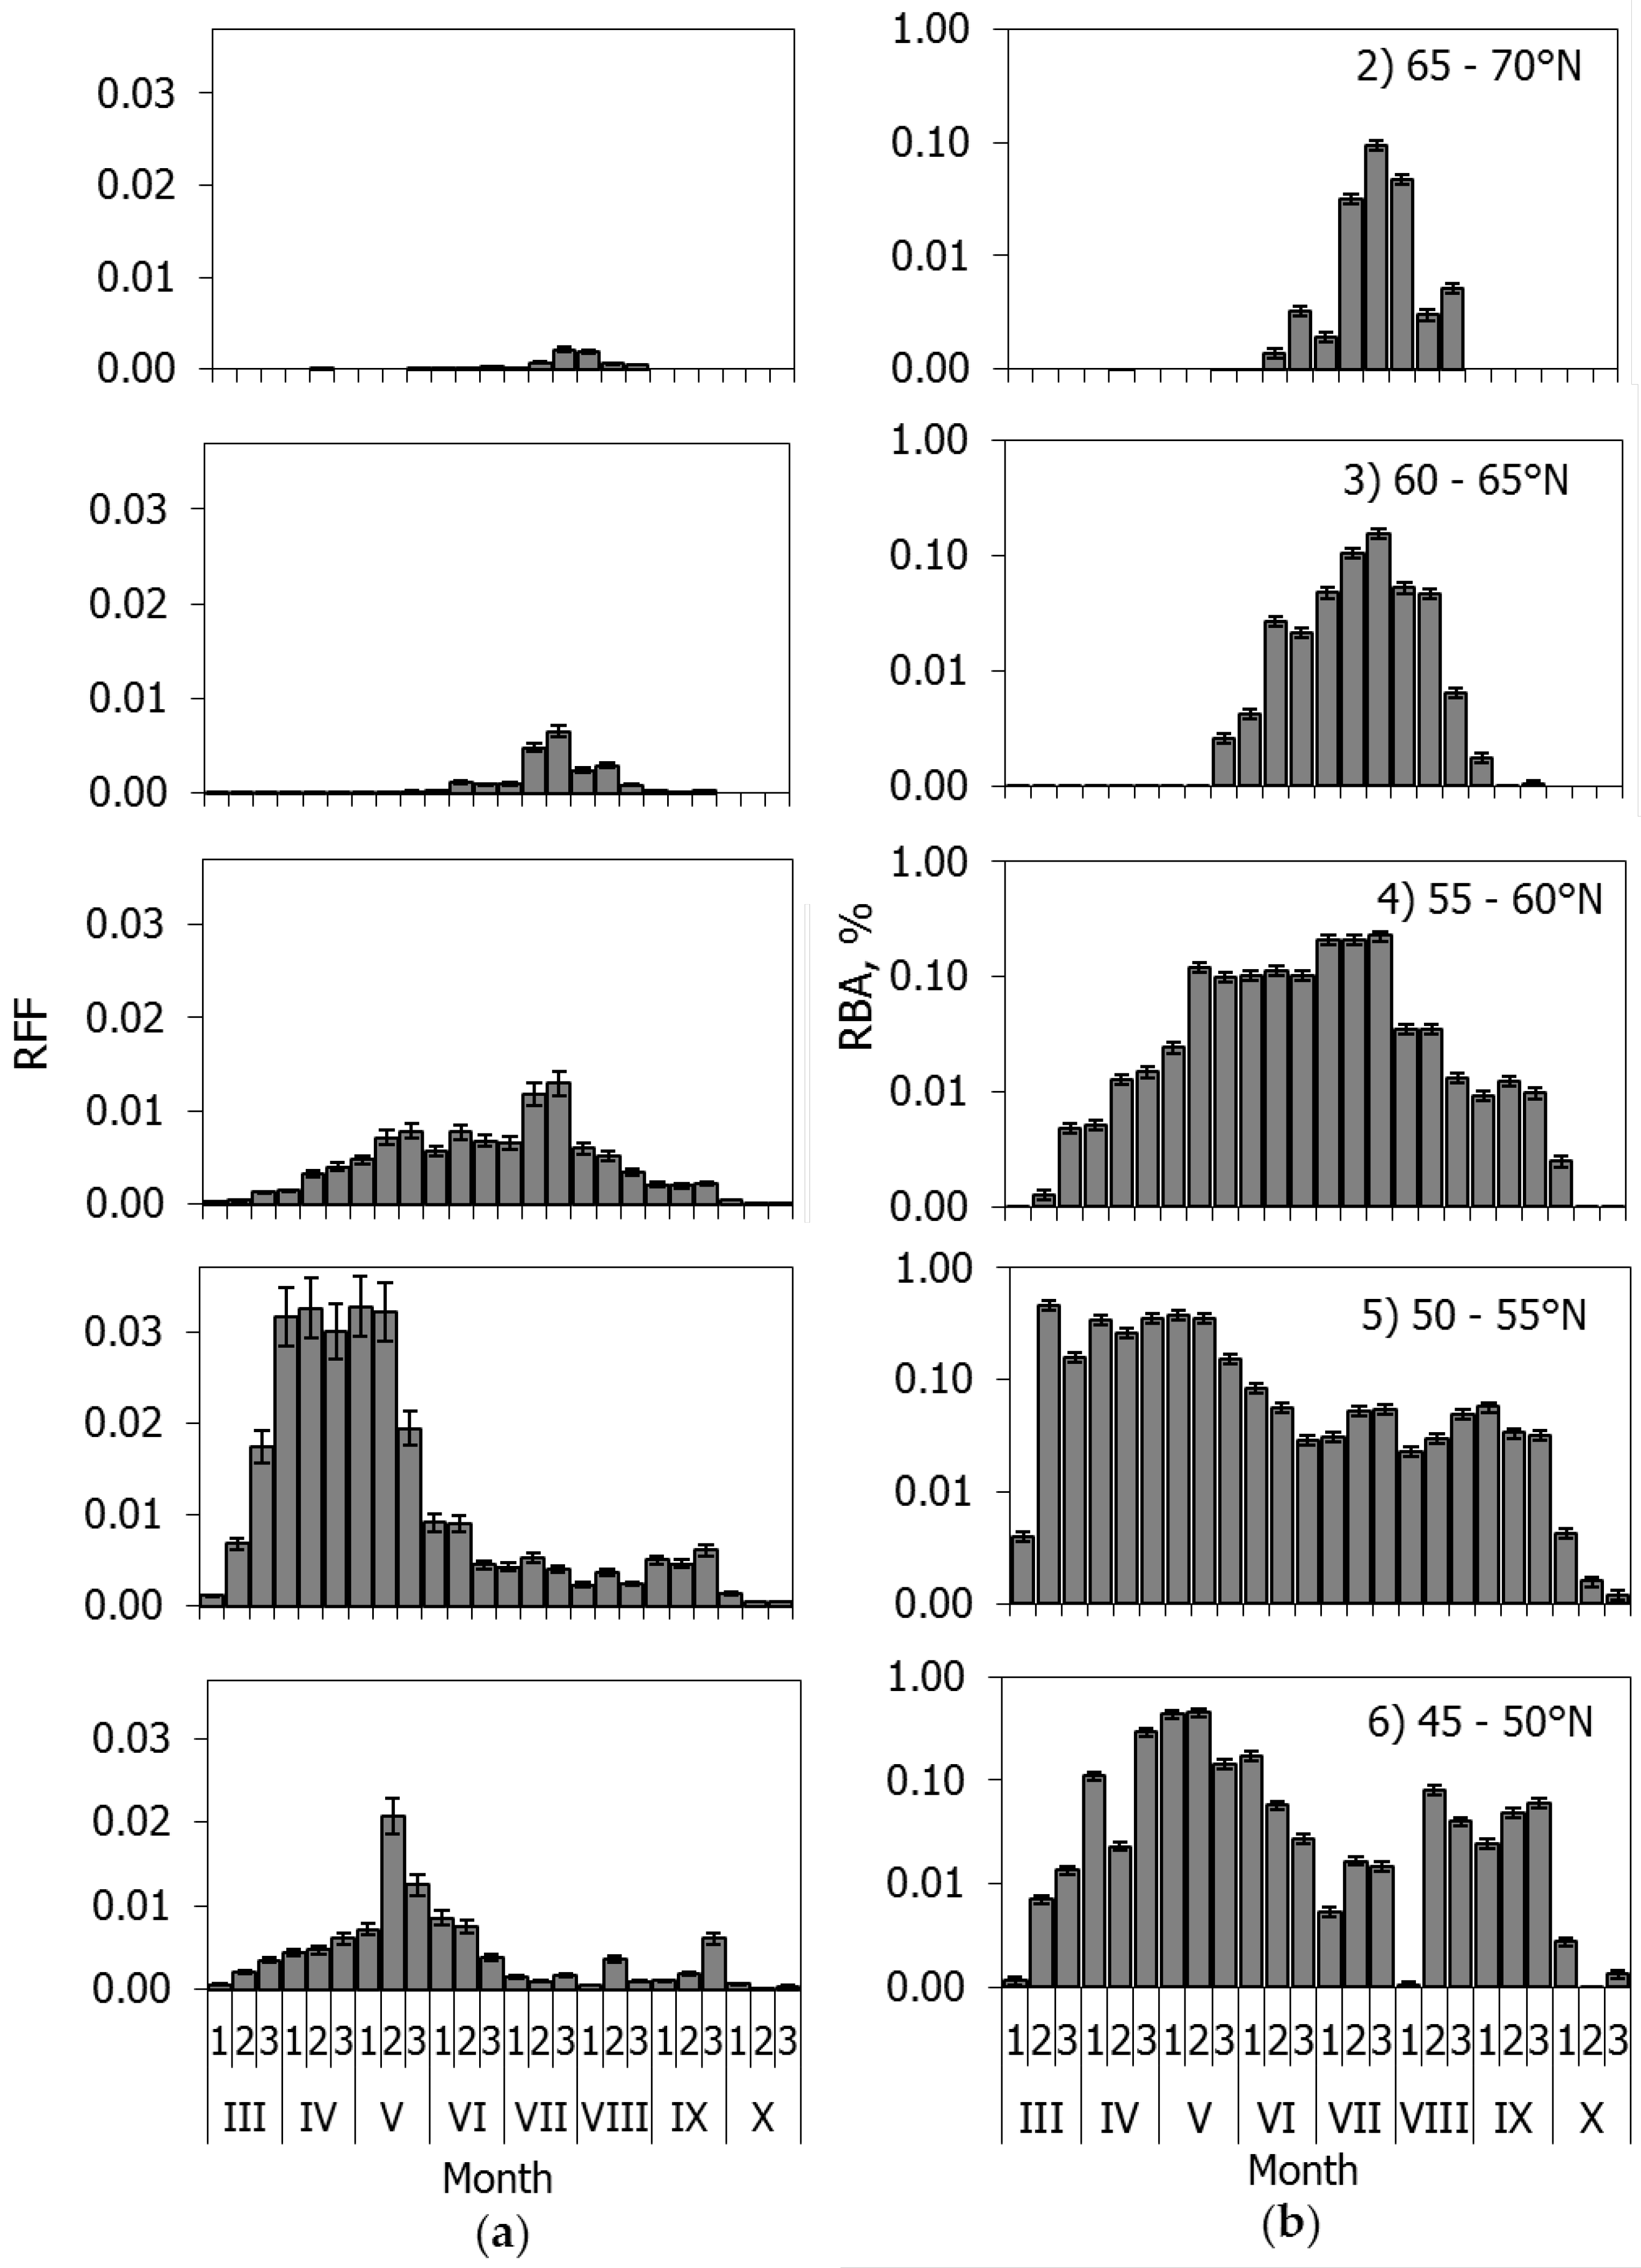
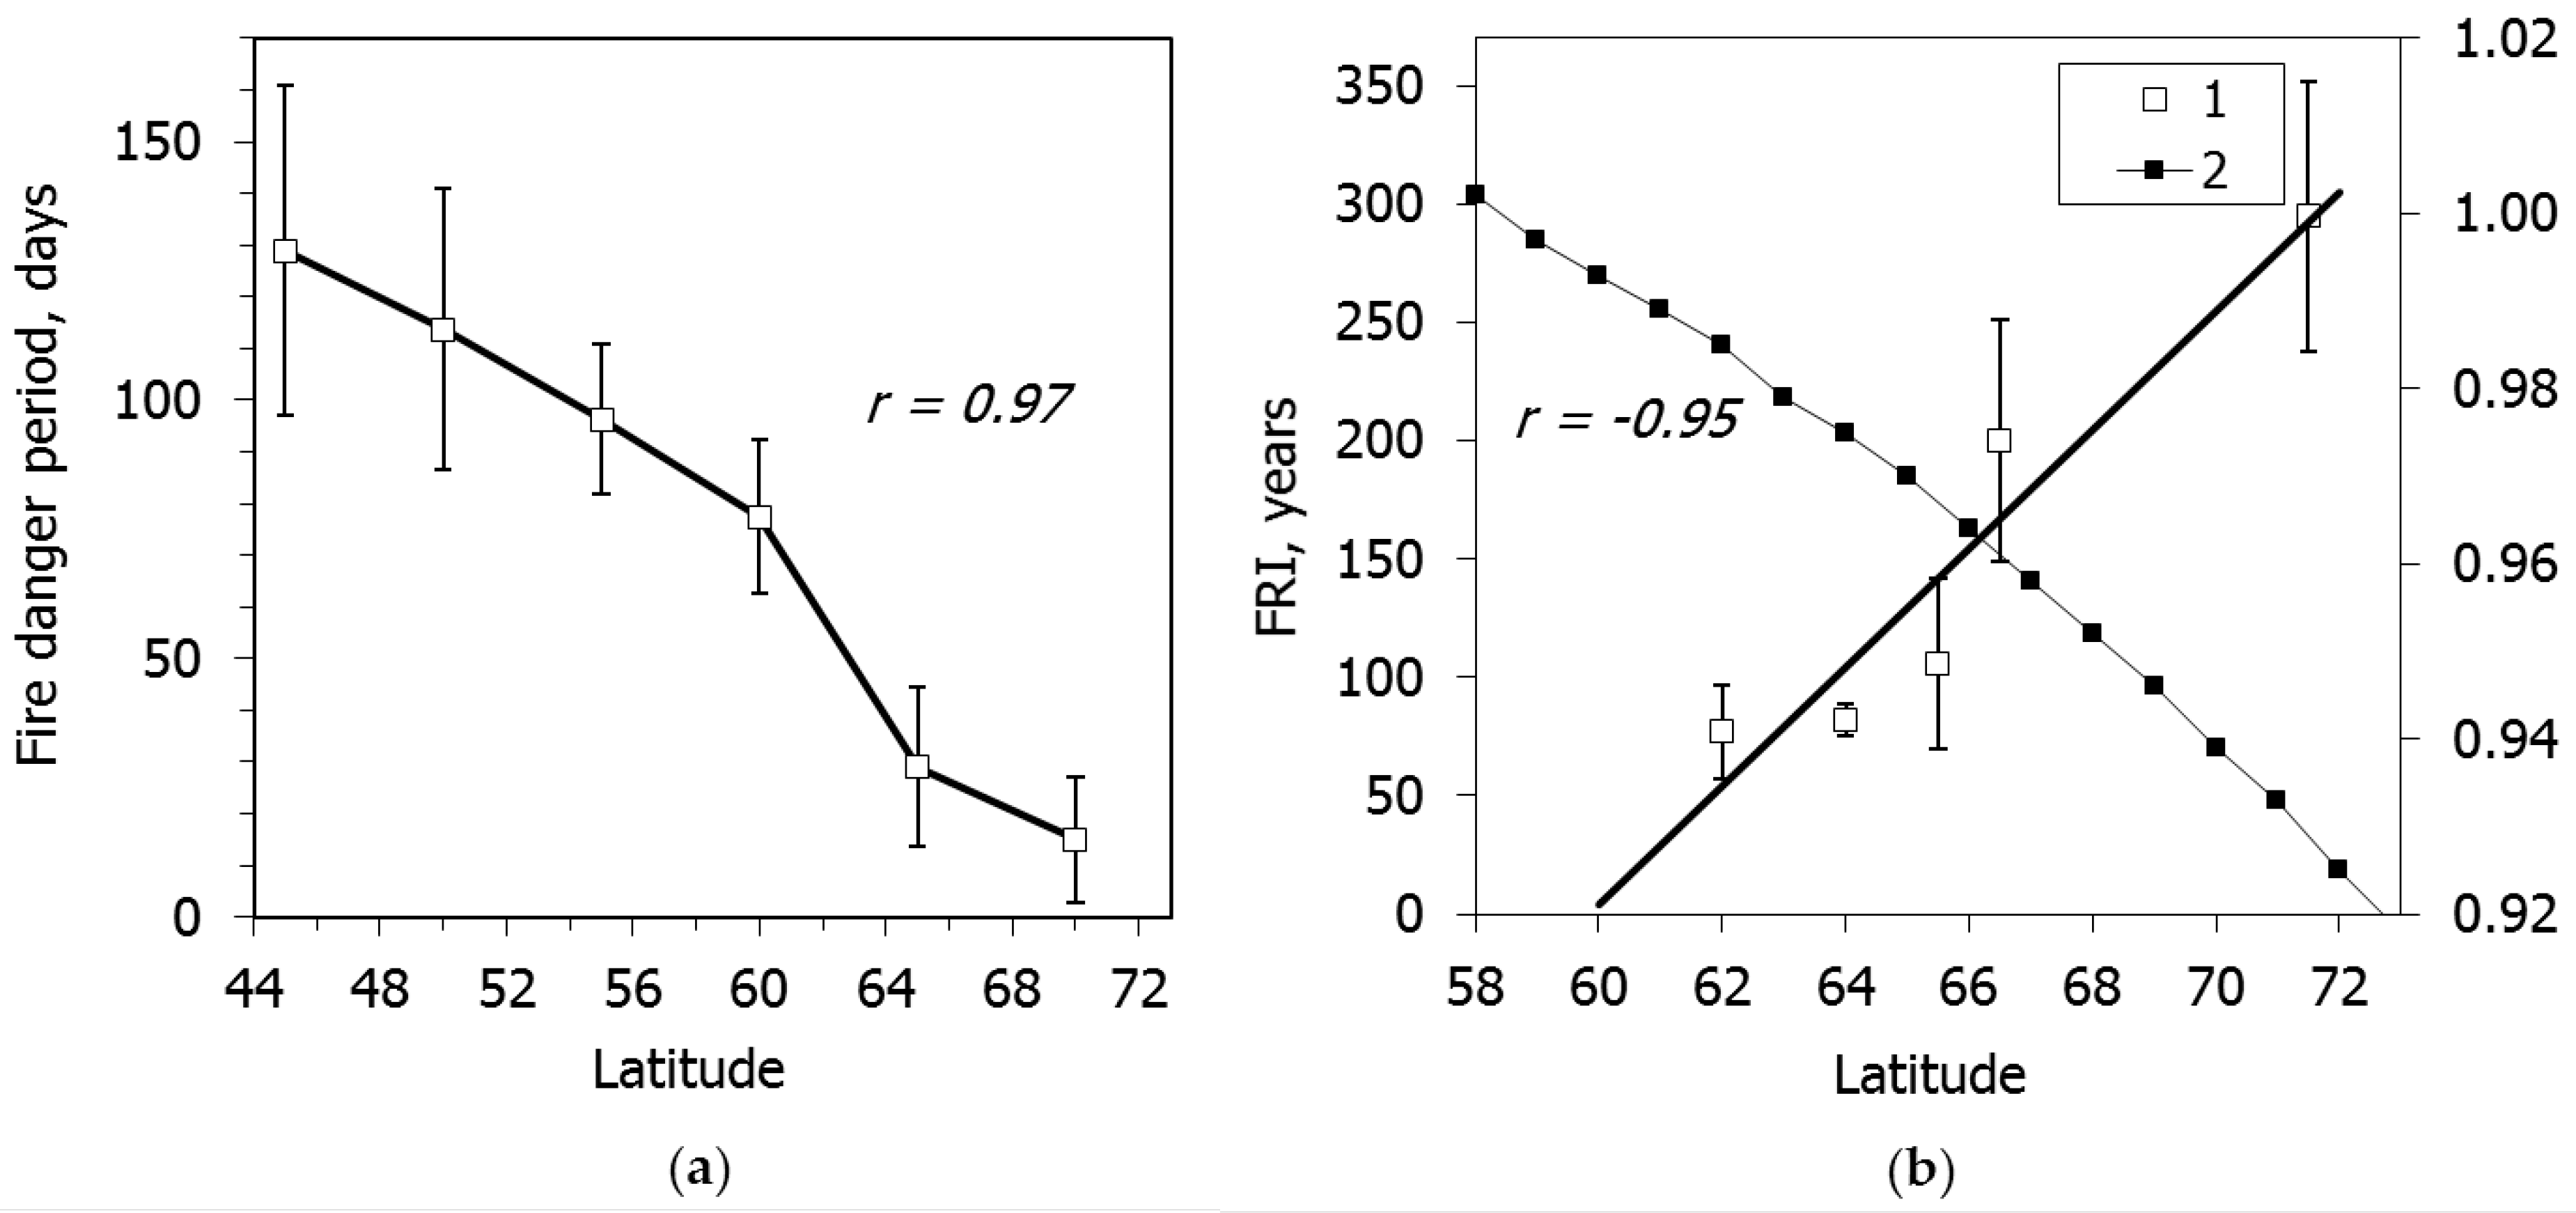
3.3. Fire Danger Period and Fire Return Intervals

Along the south-north transect the fire danger period decreased from 130 (±32) days in the south to 29 (±10) days in the north (Figure 6a). That decrease is strongly correlated with incoming solar radiation (r = 0.97), as well as the number of wildfires, RBA and RFF (Figure 4). Meanwhile, we did not find significant temporal trend in fire danger period duration which was characterized by high variability. For example, the date of the first fire varied by up to 30 days.
The fire return interval (we obtained earlier [6,20,21]) increased along the latitudinal gradient (Figure 6b). It varied from 80 years at 64° N to about 200 years at the latitude of the Arctic Circle. The maximum values (about 300 years) were detected for stands at the northern limit of closed larch stands (i.e., 71°+ N). That increase was negatively correlated with incoming solar radiation (r = –0.95). For a south-north transect in western Canadian forests (about 60°–70° N 90°–130° W), de Groot et al., 2013 found an FRI value of about 180 years [23], which was similar to FRI in Siberia at the latitude of the Arctic Circle. However, no FRI dependence on the latitude was studied in that paper.

4. Conclusions

The main conclusion is that the number of fires, fire frequency, burned area and the fire danger period, as well as fire return intervals along a south-north transect in Siberia were strongly correlated with incoming solar radiation (r = 0.81–0.97). The fire frequency and burned area distributions along the transect were bimodal within 45°–55° N and unimodal at higher latitudes. The fire frequency exponentially decreased northward, whereas fire return intervals increased from 80 years at 62° N to 200 years at the Arctic Circle, and to about 300 years near the northern limit of closed stands (about 71°+ N).
The second main conclusion is that climate-induced fire frequency and burned area are increasing within Siberian forests. During recent decades, positive trends were observed for both number of wildfires (R2 = 0.69) and size of burned areas (R2 = 0.47). Wildfire frequency was also correlated with air temperature anomalies and drought index, SPEI. This result is similar to observations within the North American portion of boreal forests [24,25], and supports the hypothesis of climate-driven increase of fire frequency in boreal forests with the possible turning of boreal forests from carbon sink to а carbon source.

Acknowledgments

The work was supported by Russian Science Foundation (project #14-24-00112). Field measurements and K.J. Ranson’s activities were supported by NASA’s Earth Science Division.

Author Contributions

E.I. Ponomarev processed satellite database on wildfires, V.I. Kharuk suggested the idea of studies and processed data on fire return interval; E.I. Ponomarev, V.I. Kharuk and K.J. Ranson analyzed data and wrote the paper.

Conflicts of Interest

The authors declare no conflict of interest.

Abbreviations

The following abbreviations are used in this manuscript:
NOAANational Oceanic and Atmospheric Administration
AVHRRAdvanced Very High Resolution Radiometer
MODISModerate Resolution Imaging Spectroradiometer
TMThe Landsat Thematic Mapper
ETMEnhanced Thematic Mapper
GISGeographic Information System
RFFrelative fire frequency
RBArelative burned area
SPEIThe Standardized Precipitation Evapotranspiration Index
PETpotential evapotranspiration
NIRnear-infrared
MIRmid-infrared
TIRthermal infrared
FRIfire return interval

References

  1. IPCC. Climate Change 2014: Impacts, Adaptation, and Vulnerability. Summaries, Frequently Asked Questions, and Cross-Chapter Boxes. In A Contribution of Working Group II to the Fifth Assessment Report of the Intergovernmental Panel on Climate Change; Field, C.B., Barros, V.R., Eds.; World Meteorological Organization: Geneva, Switzerland, 2014; p. 190. [Google Scholar]
  2. Conard, S.G.; Sukhinin, A.I.; Stocks, B.J.; Cahoon, D.R.; Davidenko, E.P.; Ivanova, G.A. Determining effects of area burned and fire severity on carbon cycling and emissions in Siberia. Clim. Chang. 2002, 55, 197–211. [Google Scholar] [CrossRef]
  3. Shvidenko, A.Z.; Schepaschenko, D.G. Climate Change and Wildfires in Russia. Contemp. Probl. Ecol. 2013, 6, 50–61. [Google Scholar] [CrossRef]
  4. Federal State Statistics Service. Available online: http://www.gks.ru (accessed on 29 February 2016).
  5. Forkel, M.; Thonicke, K.; Beer, C.; Cramer, W.; Bartalev, S.; Schmullius, C. Extreme fire events are related to previous-year surface moisture conditions in permafrost-underlain larch forests of Siberia. Environ. Res. Lett. 2012, 7, 1–9. [Google Scholar] [CrossRef]
  6. Kharuk, V.I.; Ranson, K.J.; Dvinskaya, M.L.; Im, S.T. Wildfires in northern Siberian larch dominated communities. Environ. Res. Lett. 2011, 6, 1–7. [Google Scholar] [CrossRef]
  7. Krylov, A.; McCarty, J.L.; Potapov, P.; Loboda, T.; Tyukavina, A.; Turubanova, S.; Hansen, M.C. Remote sensing estimates of stand-replacement fires in Russia, 2002–2011. Environ. Res. Lett. 2014, 9, 1–8. [Google Scholar] [CrossRef]
  8. Gauthier, S.; Bernier, P.; Kuuluvainen, T.; Shvidenko, A.Z.; Schepaschenko, D.G. Boreal Forest Health and Global Change. Science 2015, 349, 819–822. [Google Scholar] [CrossRef] [PubMed]
  9. Goldammer, J.G.; Stocks, B.J.; Sukhinin, A.I.; Ponomarev, E.I. Current Fire Regimes, Impacts and the Likely Changes-II: Forest Fires in Russia–Past and Current Trends. In Vegetation Fires and Global Change: Challenges for Concerted International Action: A White Paper Directed to the United Nations and International Organizations; Goldammer, J.G., Ed.; Global Fire Monitoring Center (GFMC)/Kessel Publishing House: Eifelweg, Germany, 2013; pp. 51–79. [Google Scholar]
  10. Bartsch, A.; Balzter, H.; George, C. The influence of regional surface soil moisture anomalies on forest fires in Siberia observed from satellites. Environ. Res. Lett. 2009, 4, 1–9. [Google Scholar] [CrossRef]
  11. Ponomarev, E.I.; Kharuk, V.I. Wildfire Occurrence in Forests of the Altai–Sayan Region under Current Climate Changes. Contemp. Probl. Ecol. 2016, 9, 29–36. [Google Scholar] [CrossRef]
  12. Bartalev, S.A.; Egorov, V.A.; Ershov, D.V.; Isaev, A.S.; Loupian, E.A.; Plotnikov, D.E.; Uvarov, I.A. Satellite mapping of vegetation in Russia using MODIS spectroradiometer data. Mod. Problems Remote Sens. Earth Sp. 2011, 8, 285–302. (In Russian) [Google Scholar]
  13. Loboda, T.V.; Csiszar, I.A. Estimating Burned Area from AVHRR and MODIS: Validation Results and Sources of Error. In Proceedings of the 2nd Open All-Russia Conference: Current Aspects of Remote Sensing of Earth from Space, Moscow, Russia, 16–18 November 2004; Space Research Institute: Moscow, Russia, 2004; pp. 415–421. [Google Scholar]
  14. Ponomarev, E.I.; Shvetsov, E.G. Satellite detection of forest fires and geoinformation methods of results calibrating. Stud. Earth from Sp. 2015, 1, 84–91. (In Russian) [Google Scholar] [CrossRef]
  15. Harris, I.; Jones, P.D.; Osborn, T.J.; Lister, D.H. Updated high-resolution grids of monthly climatic observations—The CRU TS3.10 Dataset. Int. J. Climatology 2014, 34, 623–642. [Google Scholar] [CrossRef] [Green Version]
  16. Climatic Research Unit. Available online: http://www.cru.uea.ac.uk (accessed on 29 February 2016).
  17. SPEI Global Drought Monitor. Available online: http://sac.csic.es/spei/map/maps.html (accessed on 29 February 2016).
  18. Vicente-Serrano, S.M.; Beguería, S.; López-Moreno, J.I. A Multi-scalar drought index sensitive to global warming: The Standardized Precipitation Evapotranspiration Index–SPEI. J. Climate 2010, 23, 1696–1718. [Google Scholar] [CrossRef]
  19. The Solar Radiation and Climate of the Earth. Available online: http://www.solar-climate.com (accessed on 29 February 2016).
  20. Kharuk, V.I.; Ranson, K.J.; Dvinskaya, M.L. Wildfires dynamic in the larch dominance zone. Geophys. Res. Lett. 2008, 35, 1–5. [Google Scholar] [CrossRef]
  21. Kharuk, V.I.; Ranson, K.J.; Dvinskaya, M.L. Fire return intervals within the northern boundary of the larch forest in Central Siberia. Int. J. Wildland Fire 2013, 22, 207–211. [Google Scholar] [CrossRef]
  22. Kovacs, K.; Ranson, K.J.; Sun, G.; Kharuk, V.I. The relationship of the Terra MODIS fire product and anthropogenic features in the Central Siberian landscape. Earth Interactions 2004, 8, 1–25. [Google Scholar] [CrossRef]
  23. De Groot, W.J.; Cantin, A.S.; Flannigan, M.D.; Soja, A.J.; Gowman, L.M.; Newbery, A. A comparison of Canadian and Russian boreal forest fire regimes. For. Ecol. Manag. 2013, 294, 23–34. [Google Scholar] [CrossRef]
  24. Girardin, M.P.; Ali, A.A.; Carcaillet, C.; Mudelsee, M.; Drobyshev, I.; Hely, C.; Bergeron, Y. Heterogeneous response of circumboreal wildfire risk to climate change since the early 1900s. Glob. Chang. Biol. 2009, 15, 2751–2769. [Google Scholar] [CrossRef]
  25. Flannigan, M.; Cantin, A.S.; de Groot, W.J.; Wotton, M.; Newbery, A.; Gowman, L.M. Global wildland fire season severity in the 21st century. For. Ecol. Manag. 2013, 294, 54–61. [Google Scholar] [CrossRef]
Figure 1. Study area and forest map. 1–6: 5-degree latitudinal zones within the south-north transect. Background: forest map [11].
Forests 07 00125 g001
Figure 2. Temporal trends in number of wildfires (a); (R2 = 0.69) and burned areas (b); (R2 = 0.47) in Siberia (p < 0.05). Linear trends are shown by a solid line.
Forests 07 00125 g002
Figure 3. Correlation between wildfire numbers and June–July air temperature (a) (r = 0.60) and April–September Standardized Precipitation Evapotranspiration Index (SPEI) (b) (r = −0.43) anomalies for the forested area in Siberia.
Forests 07 00125 g003
Figure 4. (а) Wildfires number (normalized) distribution along transect (1) and incoming solar radiation (2). Correlation between these two datasets is r = 0.81. (b) Distribution of relative fire frequency (RFF; 1) and relative burned area (RBA; 2). Wildfires parameters correlations with incoming solar radiation are r = 0.81 (for wildfires number), r = 0.87 (for RBA) and r = 0.89 (for RFF) (within 52°–71° N range). Analyzed period was 1996–2015 year.
Forests 07 00125 g004
Figure 5. Seasonal distribution of the relative fire frequency (a) and relative burned area (b) along the transect (see Figure 1). Bars were calculated for mean 10-day period (numbered 1 to 3) from March (III) to October (X) (mean for period 1996–2015). Note: within transect zone 1 (70°+ N) only one wildfire (in 3rd decade of July) was detected (not shown on the graph).
Forests 07 00125 g005
Figure 6. (a) Fire danger period dependence on latitude (correlation with solar radiation is r = 0.97); (b) fire return interval (FRI) dependence on (1) latitude and (2) incoming solar radiation (r = −0.95; p < 0.05). Bars show 95% confidence level.
Forests 07 00125 g006

