Article

Public Opinions and Use of Various Types of Recreational Infrastructure in Boreal Forest Settings

Norwegian Institute for Nature Research (NINA), Human Dimension Department, Fakkelgården, Lillehammer NO-2624, Norway
*
Author to whom correspondence should be addressed.
Forests 2016, 7(6), 113; https://doi.org/10.3390/f7060113
Submission received: 13 April 2016 / Revised: 15 May 2016 / Accepted: 23 May 2016 / Published: 31 May 2016

Abstract

:
We have investigated public preferences for use intensity and visual quality of forest recreational infrastructure. Forest infrastructure covers five classes, along a continuum from unmarked paths to paved walkways. Altogether, 39 sites were categorized into the five classes and measured with automatic counters. A sample of 545 respondents living in southeastern and middle Norway were asked to rate 15 forest scenes and 35 preconceptions of recreational settings. The path scenarios were depicted as digitally calibrated photos that systematically displayed physical path feature in boreal, semi-natural settings. Survey participants showed a clearly greater preference for photos and preconceptions of forests settings containing minor elements of forest infrastructure; unmarked paths received the highest score and forest roads/walkways/bikeways the lowest. We identified a clear mismatch between public preferences for forest infrastructure and the intensity of use; the less appreciated infrastructure was the most used. Planning and management has to consider these different needs for recreational infrastructure, and we propose an area zoning system that meets the different segments of forest visitors.

1. Introduction

Active outdoor recreation appears to be a cost-effective means for improving public health [1,2,3]. Urban forests, in the sense of forests and wooded lands close to densely populated areas, only constitute a small percentage of the total forest area of Fennoscandia (including Finland, Norway and Sweden). It may be assumed that the quality of these forests and woodlands are of particular importance to urban dwellers for everyday recreation [4,5]. People choose their areas for outdoor recreation by a number of criteria, including distance from residence, accessibility, environmental preferences, previous experience, and the degree of attachment to a given area [6,7,8,9,10].
Accessibility, both physical and mental, seems to be a key factor for many forest recreationists [8,11,12], but accessibility in terms of presence of and preferences for recreational and forest infrastructure is less studied. Some of the numerous Fennoscandian quantitative surveys about public preferences for forest structures include questions related to forest infrastructure [13,14]. Results indicate that forest visitors ideally prefer a moderately prepared forest path for walking, although most forest visitors actually walk on forest roads [7,14,15,16]. A photo showing an easy footpath through a mature pine stand received a top score compared to all other forest scenes in two nation-wide Swedish surveys [17], while a photo of a forest road in a man-made spruce stand with a roe deer on the roadside received a top score in a Danish survey [18,19]. There is, however, a lack of research that specifically addresses public preferences for various sorts of trails and roads in a forest [20], even though most people actually follow such lines or corridors in the landscape. This suggests a more dedicated look into this topic.
The principle of common access rights to all uncultivated land in Norway [21] is undisputable. Norway is an interesting case in terms of public preferences for forest infrastructure, because recreational users are free to choose whatever forest environment they want and are not bound to any kind of infrastructure by law. Despite this, actual visitor use is strongly linked to infrastructure and facilities [22] in forest areas. Roads, marked trails, campsites and bridges will attract and concentrate visitors in particular areas. Such infrastructure can, however, negatively impact those who are seeking more undisturbed experiences due to factors like solitude, remoteness and isolation in wilderness areas [23,24]. One way to overcome the diverging and even conflicting needs and preferences for infrastructure among forest visitors is to differentiate the recreational area planning and management [11]. We suggest here a conceptualization along the infrastructure continuum that is based on the ROS (Recreation Opportunity Spectrum) model, and its special attention to the managerial, physical and social dimensions [25,26].
A total of 37% of the land area in Norway is covered by forests, and forest is the most common environment around Norwegian communities and towns [27]. Doing outdoor recreation in nearby forests is a part of national strategies to stimulate physical activity and enhance public health [28]. In this context, developing recreational infrastructure in nearby forests is regarded to be crucial in reaching national goals concerning public physical activity, and several national programs to develop such infrastructure have been initiated in the last years. In addition, there seems to be a tendency to uniform and standardize the design of facilities for outdoor recreation and also a universal development to satisfy all kind of users. However, most of the development of recreational infrastructure is in line with the Nordic outdoor traditions and includes simple measurements like signs, maps, and marked paths [27]. These kinds of measurements are carried out in most places where people live in numerous villages and cities in Norway, and the question is how people perceive such measurements.
Another main driver for development of uniformed infrastructure for recreational use is the establishment of a dense forest road network in literally all forestland in Norway. Basic adaptation to recreation within the frame of sustainable forestry is obligational for all forest owners in Norway, specified by “Programme for the Endorsement of Forest Certification documents” [29]. Forest roads are mainly developed for harvesting of forest resources and silviculture for forest production, but in recent years, roads with a combined purpose of forestry operations and recreational activities have been constructed. Combined forest roads are constructed narrower, with curves that are more adapted to the terrain and a road body and environment that are more aesthetically attractive by, for example, keeping green road shoulders, shallow ditches, and conserve a natural environment and large trees along the roads, as well as recreational facilities and easy access to marked paths.
The aim of the present study is to investigate public preferences for recreational infrastructure in semi-natural boreal forest settings and to compare these preferences with the actual use of such infrastructure. Forest infrastructure, depicted using photos or verbal preconceptions, is pre-ordered along a continuum ranging from forest roads to small unmarked paths. Our main research questions are: What are the general public preferences along the continuum for forest recreational infrastructure? Is it possible to identify differences in preferences for different recreational user groups? Do the general preferences for forest infrastructure correspond with the actual use of such infrastructure?

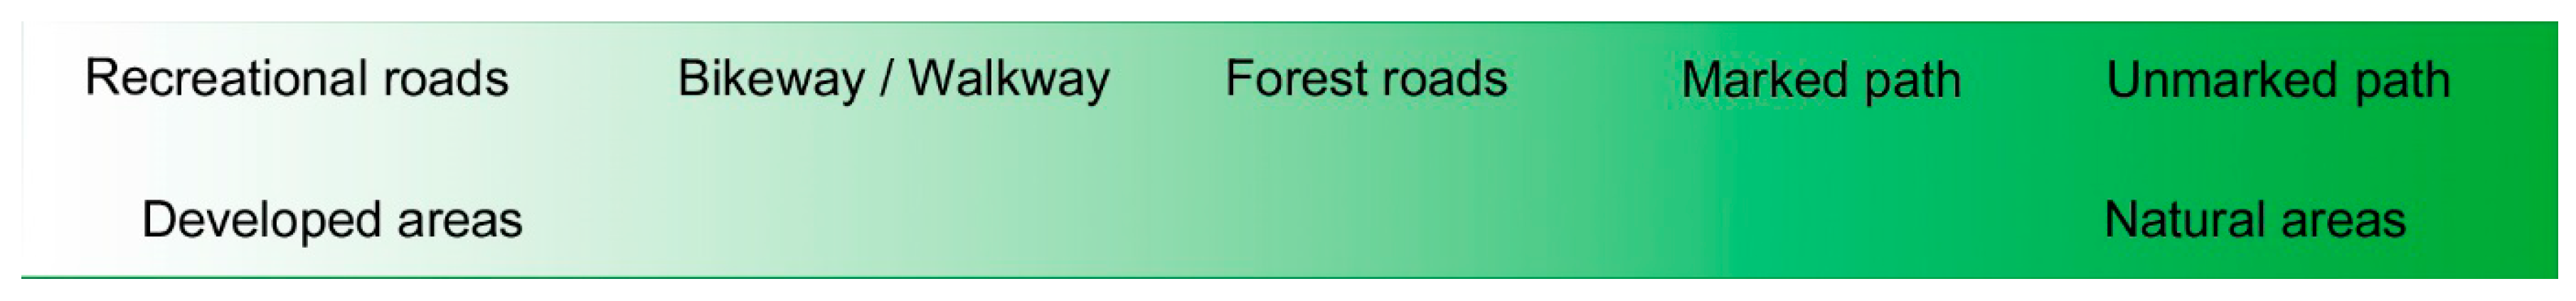
Recreation along the Infrastructure Continuum

Reasons for visiting natural areas can be as diverse as the visitors themselves [25,30]. The Recreation Opportunity Spectrum (ROS) has been widely used as a management framework to guide provision of diverse recreation opportunities [31,32,33]. For example, the ROS classification have been introduced for recreational planning of Oslo urban forests [22], and ROS mapping have been used as the basic element for modeling recreational opportunities to serve ecosystem services in urban proximate areas at a European scale [34]. The Recreation Opportunity Spectrum, originally developed as a tool for planning, and managing recreation opportunities, has been adopted for reclassification of the land cover according to the range of opportunities available and the proximity to the potential users. The ROS planning system for outdoor recreation areas emerged in public forests in North America from a need to take a diversity of recreational users and campers into account [25,26]. The concept is based on an activity–opportunity definition of recreation, implying that users are seeking opportunities for activities, experiences, and benefits. The central assumption of the method is that a visitor chooses to perform a certain activity in an appropriate environment to obtain a desired experience [33]. Ideally, a continuum of experiences in demand should match a continuum of supplied forest settings in the area in question. These settings may range from primitive to urban settings, which are then assessed according to a standard set of principles and definitions. Three dimensions of settings are considered [11]: physical (including biophysical and cultural-historical resources, and human-induced changes as permanent buildings and infrastructure), social (including users and their behaviors, type of activity, and amount of interaction between users), and managerial (including movable attributes, on-site presence, services offered, and regulations/rules). The resulting number of recreation opportunity classes depends on the landscape qualities, the recreational needs that are recognized, the management goals and the planner. When applying the ROS, the landscapes can, e.g., be zoned in primitive, semi-primitive non-motorized, semi-primitive motorized, rustic, concentrated, and modern urbanized classes [26]. Two elements are particularly important in determining ROS classes: remoteness (e.g., large undisturbed areas far away from infrastructure in the primitive end of the spectrum) and degree of naturalness (evidence of human activity) [23]. A third element is social experience, and the possibilities to experience solitude, authentic nature, challenge, and self-reliance, often associated by a wilderness experience [24,33]. The concept of primitive or wilderness areas is in this paper not used in its original meaning, but as a solitude nature experience in natural forests patches in an urban forest setting. Adaptations of the originally six classes [26] to Norwegian forest settings correspond to a high degree, except for the classes including use of motorized vehicles [22]. In Norway, there are strong restrictions on using motorized transport in outfields. However, in most forests, a dense network of forest roads gives access both for industrial or recreational purposes. Thus, the two classes, Semi-primitive motorized and Rustic, can be regarded quite synonymous to the use of forest roads in rural Norway, also including access for private cars most places. Based on the originally ROS classification, we identify five ROS classes: Urban, Concentrated, Rustic, Semi-primitive and Primitive. In these five ROS classes, we identify five associated infrastructure characteristics that are the classes tested out in our survey (Figure 1): Recreational roads, bikeway/walkway, forest roads, marked path and unmarked paths.
Our recreational trail classes are modified from the National Trail Management Class System [35]. US Forest Service Trail Classes is a spectrum, along a continuum from Trail Class 1 to 5, with no definite borders between the classes (Table 1). Classes 1 and 2 in the US Forest Service system correspond to unmarked path and Class 3 in the same system corresponds to marked path. Bikeway/walkway correspond to Class 4 and recreational roads to Class 5. A special case in the Fennoscandian boreal forests is a dense network of forest roads originally developed for forest harvesting and silviculture, but also intensively used by recreationists. The forest roads often function as transfer distances in order to reach the path system in the forests, but they are also of special importance for the visitor’s security, easy access or for special activities or passability needs (elderly people, bicyclist, using a perambulator, using a wheelchair, etc.). Among some visitors, forest roads are also quite controversial because the road network continuously tends to expand and sometimes replace existing paths or reduce the part of the forested area with high recreational value.

2. Material and Methods

Our empirical data materials are based on two different data sources. To identify the public general preferences for infrastructure we carried out a national survey using photos and verbal preconceptions representing the five ROS classes defined. To describe the actual use of varying infrastructure along the five ROS classes, we installed automatic counters at 39 different sites in urban forest areas in southeastern Norway.

2.1. National Web-Survey

We performed an Internet survey with a Questback web-based questionnaire in cooperation with RESPONSE, a professional polling company. The survey targeted residents of southeastern and middle Norway who were 16 years of age or older. These parts of the country belong to the boreal and boreonemoral zones where native Norway spruce (Picea abies) dominates the forest landscape, occurring either alone or together with Scots pine (Pinus silvestris) and birch (Betula spp.). The sample frame was derived from a survey panel consisting of about 150,000 volunteers who are continuously tested by the polling company to be representative of Norway’s general population. In May 2011, we sent user-unique invitations with information about the study and link to a website, to private e-mail addresses that were randomly selected from the sample frame until we had attained a desired number of about 500 respondents. We received answers from 545 respondents. In all, 82% were residents in densely populated areas; that is, agglomerations with more than 200 inhabitants where the distance between houses as a rule does not exceed 50 m. This corresponds well with the proportion of such residents in the Norwegian population, 80% [36].
The questionnaire asked participants to evaluate 15 color photographed forest settings and 35 verbal preconceptions, rating them from 1 to 7 (1 = “I do not like it at all” and 7 = “I like it very much”) by asking the question “What would you prefer to meet in the forest?” (Table A1). The survey also included background questions addressing the respondent’s gender, age, residence postal code, outdoor recreation activities, frequency of recreation in forests, and membership of relevant NGOs. We selected the photos and preconceptions in cooperation with a multidisciplinary reference group consisting of forest researchers, managers of urban woodlands, representatives of forest owners’ associations, NGOs promoting outdoor recreation, and the Ministry of Food and Agriculture. The photos included different types of trail infrastructure, ranging from simple tracks via graveled footpaths to graveled forest roads (Figure 1, Table 1). Trail beds ranged from narrow unmarked paths, where only one pedestrian may pass at a time, via medium narrow marked paths, where two pedestrians can pass each other, to wide walkways, bikeways or roads where three or more pedestrians can walk side by side. Paths had been designed for walking, hiking and cycling; the bike-/walkways and recreational roads even for wheelchairs and prams; the forest roads primarily for light timber transport with tractors or lorries or heavier timber transport with trailers, but also for walking, bicycling, etc. All photos were taken in boreal forest settings in Norway during summer and under fairly equal light conditions. Our photos were pre-classified, three photos in each ROS class: Recreational roads, bikeway/walkway, forest roads, marked path and unmarked path (Figure 1).
We presented photos individually to survey participants, who were then asked to rate each according to how much they liked the forest/infrastructure scene in the photo. We did not provide the photos with any informational texts. The verbal preconceptions were produced in style with a Danish survey [18,19] and covered attitudes to social conditions in five ROS classes (number of hikers, bicyclists, runners, horse riders, groups of people, and cars), and finally verbal preconception concerning recreational infrastructure, each graded in five categories from “low” to “high” of the respective aspect (Table 2, Table A1). In the analyses of preferences for recreational infrastructure along the ROS classes, we included all the photos (three in each classes) and the preconceptions (six in each classes).
We used general linear models (t-tests, one-way ANOVA) to test for variation in preference scores among different visual stimuli. The data met distribution assumptions for the tests we employed. We defined significance at α = 0.05, and used IBM SPSS (v. 22, International Business Machines Corporation, New York City, NY, USA) for all analyses.
The survey population of our study is fairly representative for the target population (Table 3), but with an underrepresentation of the youngest (16–19 years) and the oldest (55+). People with higher education are overrepresented. Regarding type of activities, there is an overrepresentation of people taking ordinary trampling trips and fishing trips in forest and lowlands, however, the respondents may have included their hiking and fishing in mountain areas when answering the questions [37]. People never doing recreational activities in nature are also underrepresented.

2.2. Automatic Counters

The most used counting system in Scandinavia (several hundred counters in use) and in the United Kingdom (more than 2000 counters in use) is currently a pyroelectric sensor that contains a lens that is sensitive to heat radiation emitted by human bodies (Eco-Counter model: Eco Twin, Middle range Pyro Lens, hereafter named counters). Norwegian Institute of Nature Research has used automatic counters measuring approximately 200 sites in Norway in the last years, some of them in forests close to where people live [38]. An important challenge with automatic counting systems is their accuracy, since all types of counters are subject to counting errors [39,40,41]. Counter accuracy is subject to qualitative errors, caused by movements that do not represent actual visitors, and technical errors, caused by characteristics of the counter and the installation site [42]. The counter accuracy for the counter we used in this study is within acceptable 5% level for the counter in both winter and summer situations [38].
We have selected recreational forests close to five towns/cities in southeastern Norway for studying the differences in terms of visitor volume along the ROS categories defined in our study. The case areas are the recreational, urban forest areas adjacent to the cities of Moss, Oslo, Vestby, Brumunddal and Lillehammer, altogether 39 counting sites. All sites were measured and categorized in accordance to standards defined in Table 1. The measurement period is set to standard three summer month, July, August and September, presented with max, min, mean and total persons passing (In/Out) during the chosen period (Table 4), as well as key information of the infrastructure ROS classes, forest vegetation, and shortest distance to urban areas. Mean distance to urban areas of the sites is defined as the shortest distance from the automatic counter to the closest resident in the urban area and show minor differences between the five classes: Recreational road (905 m), walkways/bikeways (340 m), forest roads (465 m), marked paths (1850 m) and unmarked paths (990 m).

3. Results

3.1. Photos

The mean score for each of the 15 photos is shown in Table A1. The highest mean scores (mean value 5.6–5.4) were awarded to the three forest scenes that include a simple, narrow path (photos A, C and B), and the one that contained a wide, disused forest road now overgrown with short grass (photo N). Even photo E and F, depicting a graveled walkway, received a preference score higher than 5. The two forest scenes with graveled forest roads designed for heavy timber transport, photos M and O, were given the lowest scores (mean value 3.4). However, photo N depicting an old overgrown forest road, but still a forest road, received a mean score of 5.46, and only photos A and C (unmarked paths) received higher score value. All photos of forest scenes that contained obviously graveled footpaths or graveled trails designed for combinations of hiking, cycling and light timber transport received scores from 5.1 to 3.8; that is, they were judged as fairly attractive, neutral or slightly unattractive. Photo D, the narrow boardwalk through a moist mixed forest, also received a rather low score, of 3.7; ranking as number 13 of the 15 photos.

3.2. Verbal Preconceptions

Of the five preconceptions related to the sorts of trails and roads respondents would like to meet/use during the trip in the forest, “marked path” received the highest overall mean score (mean value 5.9), seconded by “unmarked path” (mean value 4.9), while “paved recreational road” were given the poorest score (mean value 1.6). The options “graveled walkway conjunction to marked path”, and “forest road detour marked path” achieved acceptable mean scores (mean value 4.0–4.5).
As for the preconceptions related to meeting cyclists and runners during their trip in the forest, the option of meeting none received the highest mean score (mean value 5.4 and 5.0, respectively), meeting one or two received average mean scores (mean value 4.2–3.7), while meeting five or ten was less appreciated (mean score 3.1–2.6). To meet horse riders in the forest are even less appreciated than to meet cyclists and runners, e.g., to meet ten riders achieved the mean score 1.8. When it comes to groups of people, to meet one family on a forest trip received the highest mean score (4.9), and even higher than to meet no families (mean score 4.7). To meet one hiker during a forest trip received the highest rate (4.9); to meet no hikers was not an option for the respondents. It is not appreciated to meet a car in the forest; “five cars passing at a forest road” received the mean value of 2.1, and only to meet “10 horse riders” (1.8) and “paved recreational road” (1.6) received lower scores, when all the 35 preconceptions are compared.

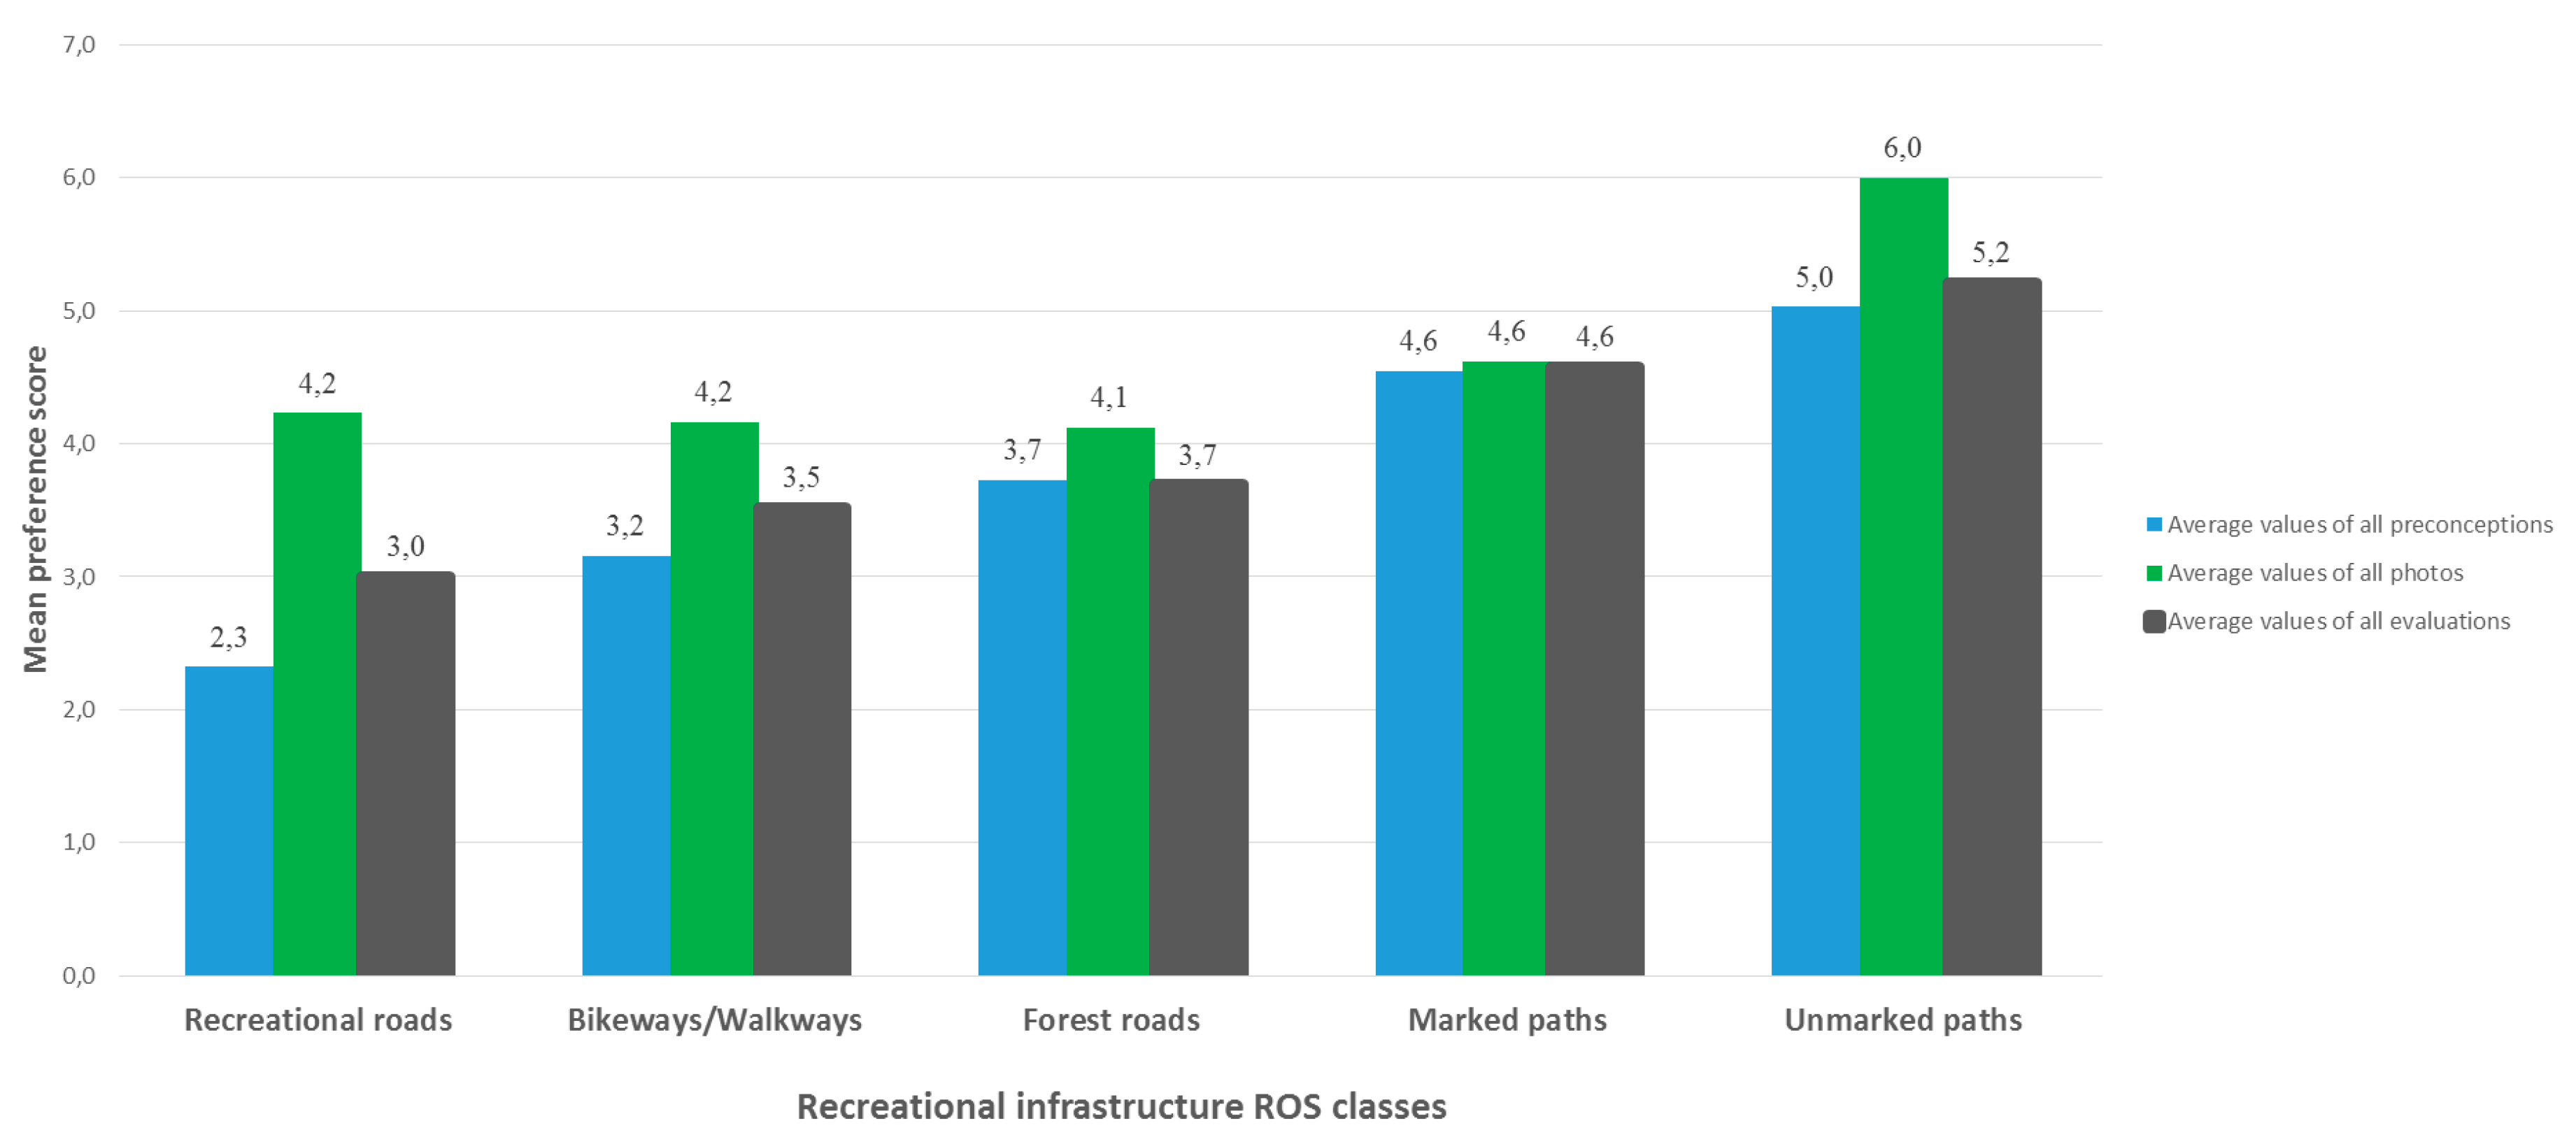
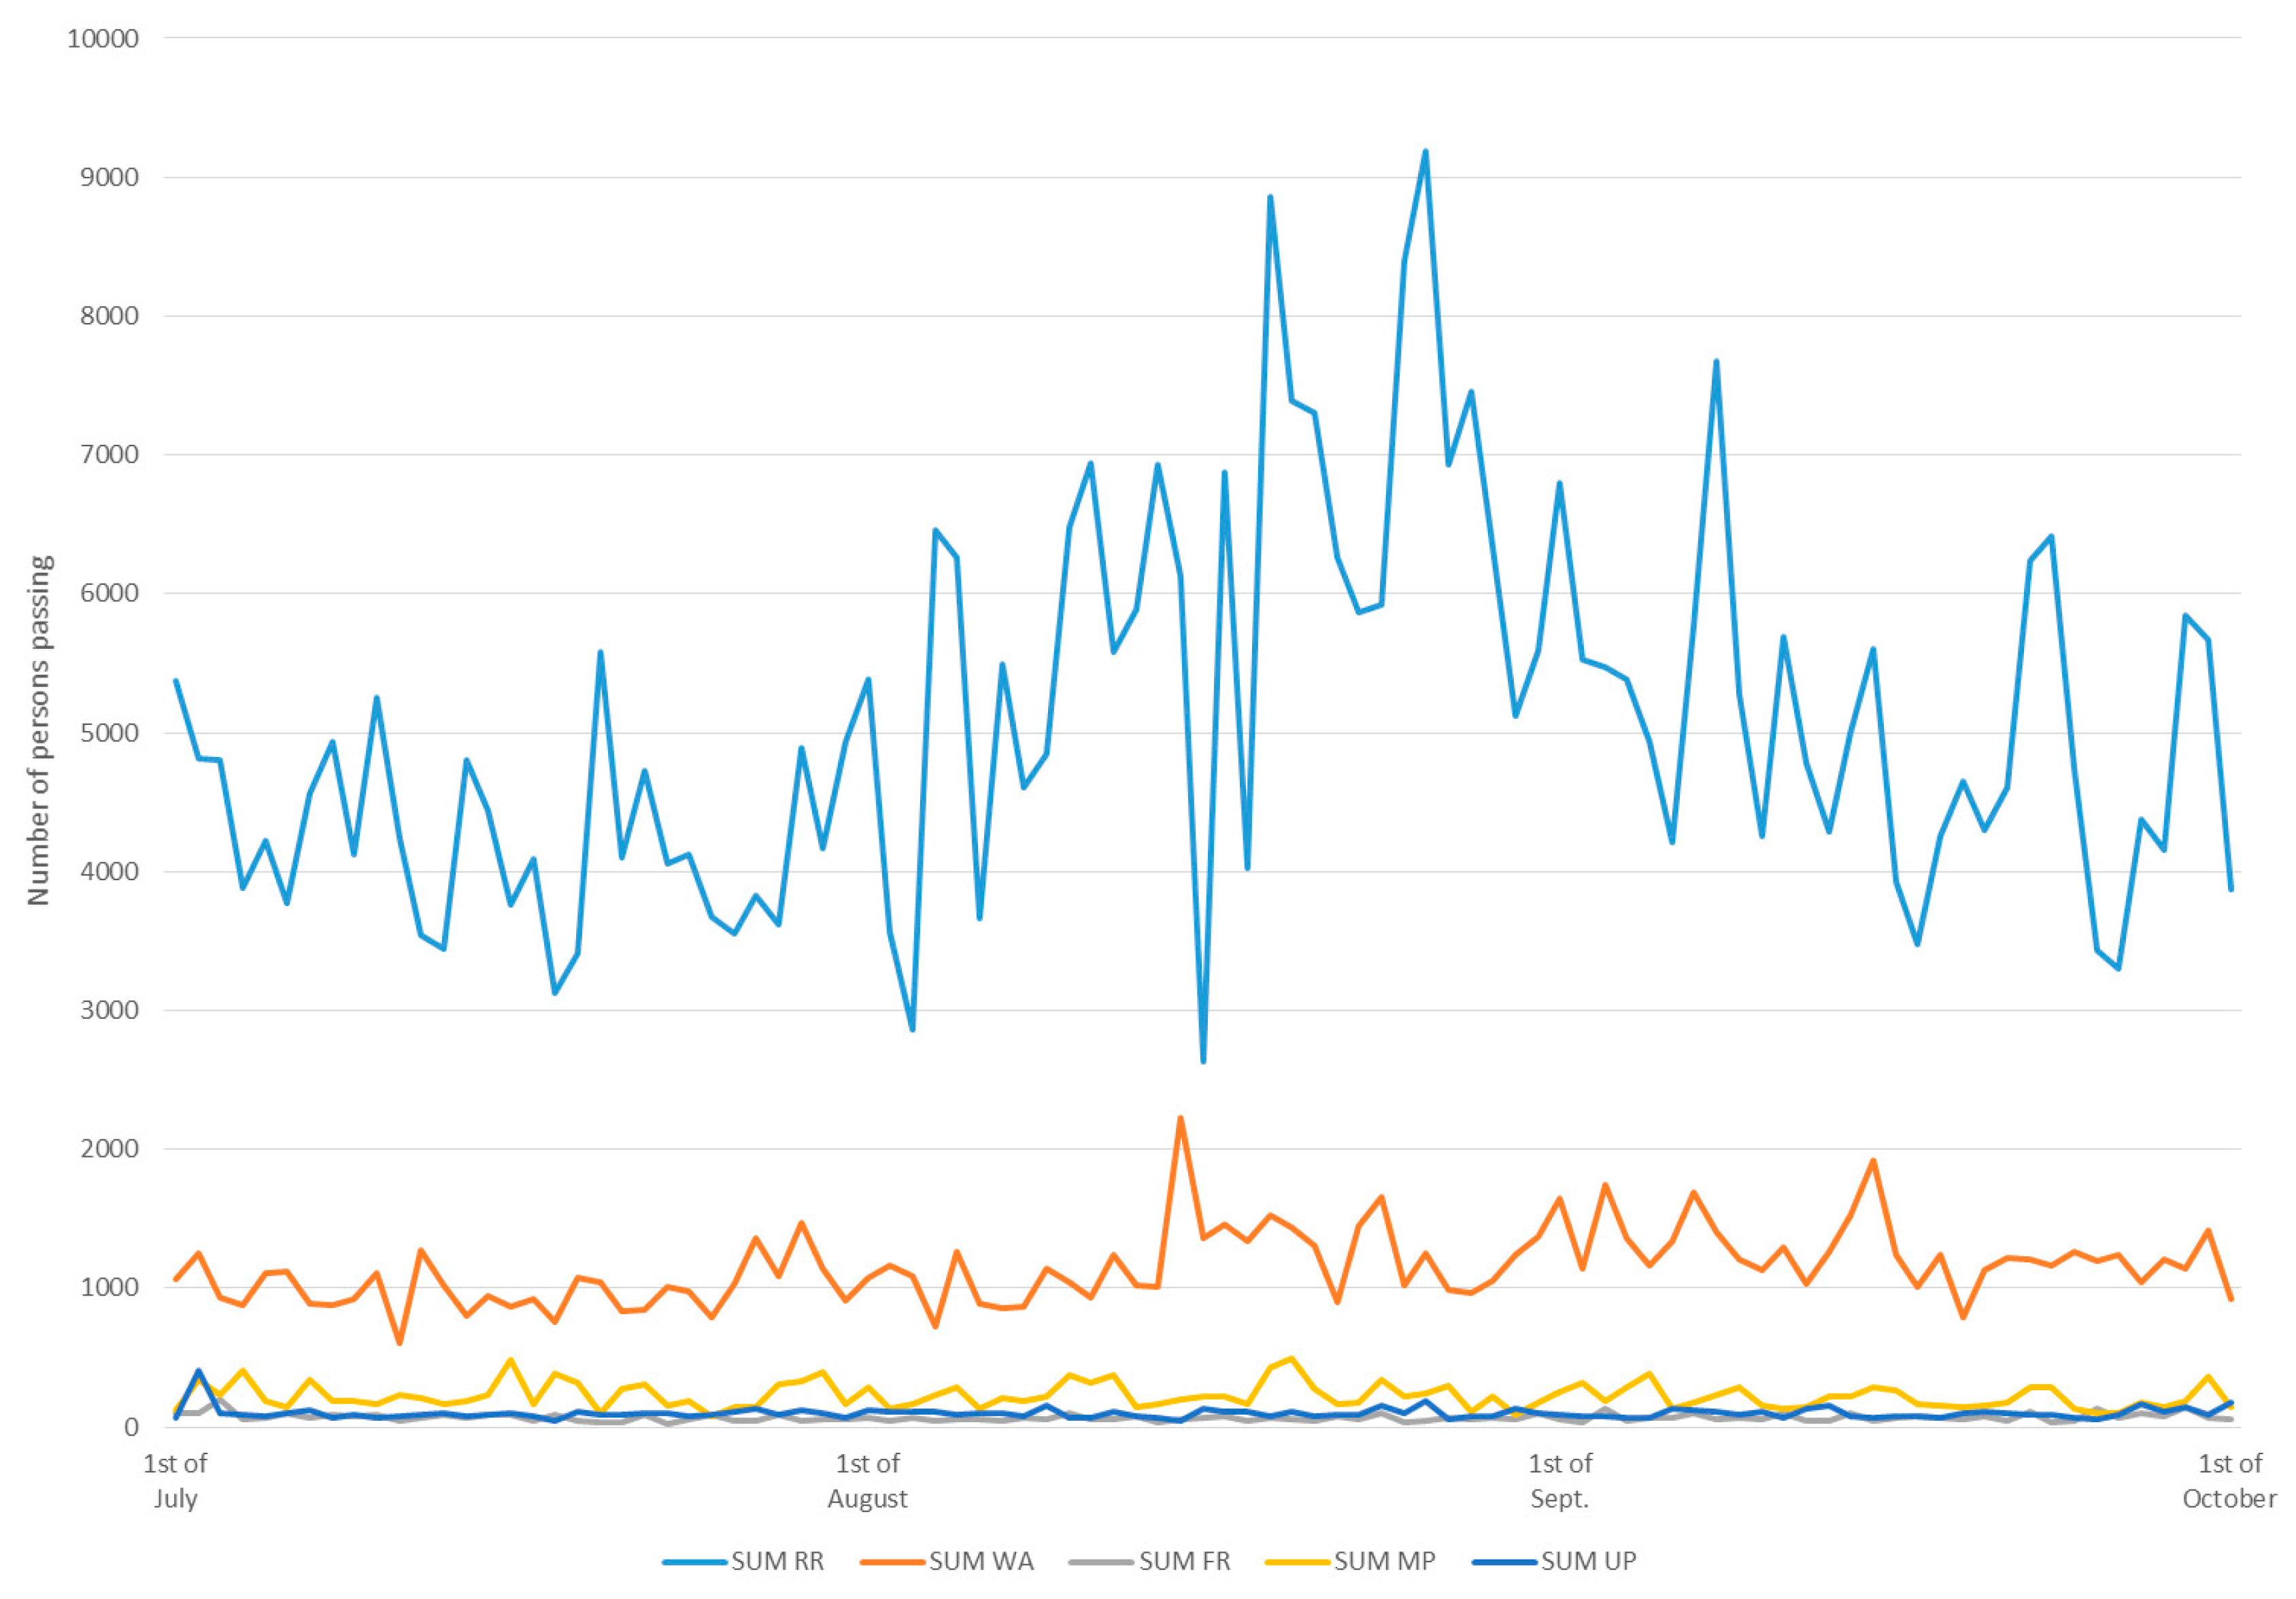
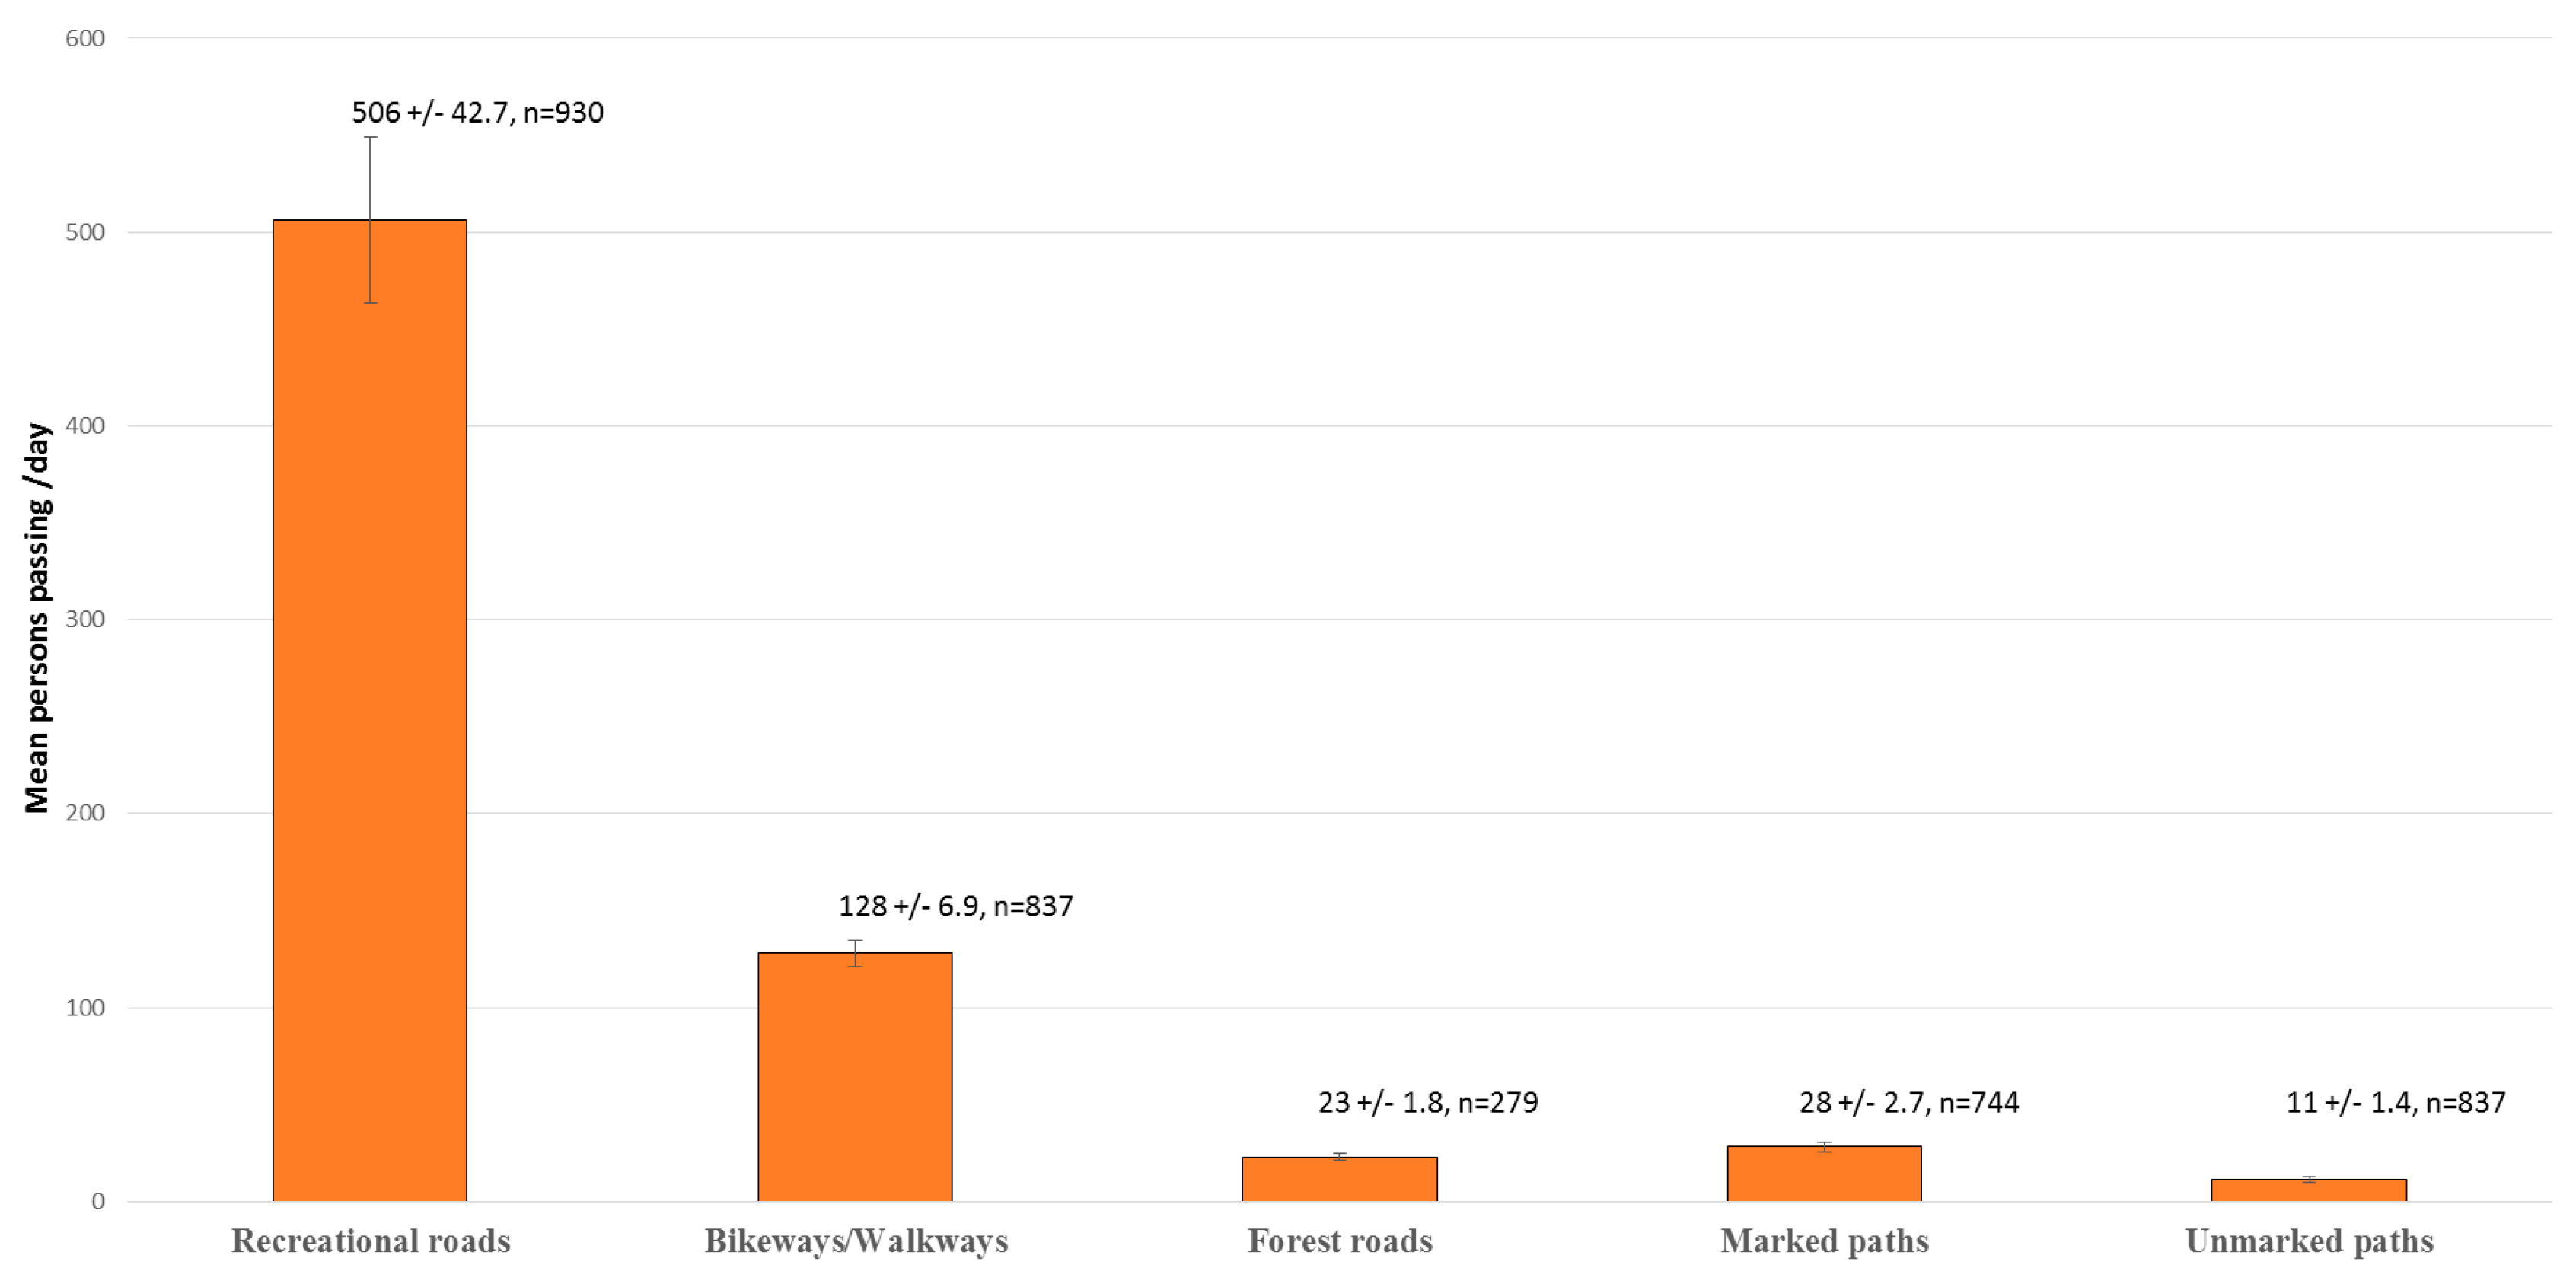
3.3. Preferences and Actual Use, along the Infrastructure Continuum

Mean preference scores for photos and preconceptions along the five ROS classes show similar trends: the scores increase towards the undeveloped end of the infrastructure continuum (Figure 2). For the photos, the mean scores are quite similar for the three classes recreational roads, bikeways/walkways and forest roads, but the class forest roads show a much larger standard deviation than recreational roads and bikeways/walkways because photo N is given a very high mean score.
Data from automatic counters at 39 sites (mean and daily use, for all days and sites) close by urban areas in southern-Norway show a trend along the recreational infrastructure continuum from recreational roads in the developed end to unmarked paths in the more primitive areas (Figure 3). Recreational roads have the highest mean number of people passing the counters per day (506 persons/day), and unmarked paths received the lowest number (11 persons/day) (Figure 4).
Survey data on people’s preferences from the national survey along the recreational infrastructure continuum show an opposite and increasing trend from developed areas to natural areas. All values and all classes differ significantly.

4. Discussion

4.1. Preferences for Forest Infrastructure

Photos of a newly establish forest roads (photo M) and a forest road including a log pile of fresh timber (photo O) received the lowest preference score of all the photos. Forest roads are very common in Norwegian forested landscapes and most recreational visitors are used to traces and tracks after harvesting and silviculture. However, obvious traces from forest operations and forest structures associated with even-aged forestry, like clear-cuts, even-aged young forests and forest roads are not well appreciated among recreational visitors [7,14,15]. An increasing presence of such structures in forest landscape was the main reason behind severe conflicts between forestry and recreation in Fennoscandia in the 1960s–1970s [43], and further on. However, the visual character of a forest road depends on many factors, like the curvature, ditches, road surface, vegetation, etc. [14], and the overgrown old forest road was given one of the highest scores in our material. The respondents might experience this kind of forest road as extensively used for forestry including a more untouched landscape, less motorized traffic and may also be a road leading to, for example, summer pastures?
In recent years, forest roads have been restored and developed in urban forests in Norway into roads that are better adapted to recreational purposes. Recreational roads were given a medium preference score in our material and even quite similar mean score values concerning the infrastructure classes bikeways/walkways and forest roads. The photos of recreational roads show curving and well-adapted roads in a recreational friendly forest scene. Even though the photos of recreational roads do not show any people, these road environments may be experienced by the respondents who often have a high amount of different visitors, which they do not want to meet in the forest (e.g., groups of people, many people biking, and many people riding). Interestingly, photo D, a walkway designed only for recreational purposes showing a narrow boardwalk through a closed forest, was given one of the lowest scores of all the photos; same as reported by [13]. A similar rating was given a quite wide bikeway in a parklike forest setting (photo I). The present survey indicates that also prepared walkways/bikeways and recreational roads that are partly or primarily designed for hikers and cyclists are visually perceived as human interventions in line with obvious traces from forest operations and the presence of forest roads. It seems to be a universal trend that increased presence of human induced elements in photos decrease the preference value [44]; photos that show different kinds of and amounts of human intervention like recreational measurements, forestry operations or technical installations like roads and buildings are given low preference scores in the general populations [14]. This may be the reasons why these three infrastructure classes altogether were the least preferred, when we consider the photo preference scores.
Our results confirm that forest recreationists ideally prefer unmarked or marked paths in the forests that are not heavily prepared [7,14,16], and they do not want to meet other visitors—hikers, cyclists, horse riders, runners or groups of people. A narrow path will keep the visitor closer to the forest environment and nature, and enhance a more bodily nature experience including exercises like jump, bend down, climb, etc. [9,45,46]. This is especially important for children, and a path can provide more unstructured environments and opportunities for discovery and play for children [47]. Children prefer, to a large extent, to play in nature-like spaces or spaces including natural elements, because it offers a diversity of opportunities for play, activities and for exploration [47,48].
The population’s ideal picture on how a forest should look like and the answer on the question “What would I like to meet in the forest?” often contrast what is available for them in their neighborhood. Urban forests in Norway are dominated by forest roads and forestry for production purposes [27], or a high amount of recreational facilities around the largest cities [49]. To meet cars in the forest is the most distracting element for the respondents.
Norway holds the old and important principle of free public access to uncultivated land, including forests. Public access to nature is enforced through the Outdoor Recreation Act [21]. This means that the general public may use the forests for recreational activities and sports at any time of year. Motorized recreational activity is prohibited off-road, and this may be one of the reasons why the respondents in Norway are very negative to meet motorized vehicles in forest settings.
Ideally, most people want to walk along simple unmarked or marked paths in the forests, but when it comes to actual use, a larger proportion walk along forest roads and walkways. Forest roads are for example more commonly used by the visitors than marked and unmarked paths, probably due to several reasons: First of all, forest roads tend to follow the land form where access, walking and driving is easy, and thereby represent the most accessible and first-choice route; hence, forest roads often replace old heritage routes or paths in the landscape. Secondly, many use forest roads as a main entrance to the forest and as a transport distance to reach attractions or paths deeper into the forests. Thirdly, it is for many, easy and practical to travel along roads, and the visitors may use different kind of vehicles, bring the pram, or meet special transportation needs as wheelchair. In addition, most of the developed recreational tracks where we have counted visitors are located quite close to densely populated areas, where the high social capacity of the established tracks is a most essential aspect. For some it is also associated to be more secure to walk along a forest road than a path, and easier to find the way [22]. Another aspect is tied to a finding from Moss in Norway [50]: the population was asked were they actually made their walks (both for transport and leisure purposes) and where they would have liked to walk, if they could choose: either along roads or streets in the built-up area, or in the surrounding green areas. About half of their actual walks were in the built-up areas and the rest in the green areas, but 80% said that they would prefer the green areas if they could freely choose. So, when registering actual behavior one must always consider availability and the actual options for those being studied: the simple path, the recreation road, or the paved road in the city center.

4.2. Management Implications

We identify a clear mismatch between people’s preferences measured by photos and preconceptions, and actual use of forest infrastructure measured by automatic counters; the most developed recreational infrastructures where most used, but least preferred. Oppositely, unmarked paths were the most appreciated forest infrastructure, but also the least used. We may conclude that the ROS-class associated with unmarked trails in natural settings including few other visitors of any kind is the idealistic area for forest visitation and experience. Similar studies from North America [33] and from New Zealand [31,51] support that ROS classes in the natural end of the continuum are preferred by the majority of the populations. Similar results are described from Finland [52,53], who found that wilderness areas are highly appreciated by the population as a mental image, but most of them never have or will visit such areas. For many of the respondents in Finland it was important to know that such areas exist, and that they have the possibility to visit if they want or need to. Similarly, studies on tourist preferences showed that wilderness is a concept and term that have been formed by the branding of Iceland as a wilderness tourist destination, and that wilderness largely is a social mental construction [54]. Both studies are mainly focusing the natural end of the continuum and they are not studying the whole continuum from developed areas to natural environment [52,54].
In Norway today, there is a national public health strategy, including stimulation of physical activity and development of marked paths, simple signs and information all over the country, and especially infrastructure like roads, tracks and bikeways/walkways in neighboring green areas around densely populated areas [28]. A management strategy with upgraded recreational infrastructure in urban forests [27] may be out of step with peoples “main” preferences for marked and unmarked paths in natural forest setting. However, these new kinds of measurements can be adapted to fit people’s preferences, generally by keeping the facilities at a low level, leaving as few traces as possible, and adapting the facilities to the local nature environment [55]. There is, however, a danger of an “upgrading spiral” in recreational forest areas, because better facilities mean more visitors that again need more facilities. Therefore, it is important that local managers are aware of the need for differentiation along the ROS-continuum, and conserve some “not-managed” areas including only unmarked paths. Instead of letting visitors meet the same level and standard of facilities at every entrance point (similarity), there is a need for larger differentiation to keep the opportunities for different experience for the visitors [11].
Area zoning in different recreational classes have some places been established as a solution, and for example in the urban forests of Oslo a kind of zoning including service areas at main entrances, special considerations in intensively used areas and areas of natural forests without recreational facilities have been established by law [22]. A framework and methodology for inventory of urban natural forests for recreational purposes was developed in 2011, potential areas were assessed during 2011 and the first four large areas were protected by law in 2013 [22]. Protection of this kind of areas in an urban proximity is quite unique in both a Nordic and European context, and raises the question of what kind of users these areas attract. A Finnish researcher associated such natural areas with: natural forests, roadless, remote, peaceful, quietness and activities like picking berries and mushrooms, fishing, hunting and hiking [52,53]. These natural forests are “quiet” areas and include less disturbing factors like facilities, other visitors (hikers, cyclist, horse riders, runners and group of people) or motorized vehicles. In accordance with our results, natural forested areas with only simple unmarked paths will be attractive for many visitors from the general population, but—also according to our findings—only a few of them will actually visit and use these areas.

4.3. Limitations

Despite the preference, research has gained adequate knowledge to guide forest management in recreational sensitive areas and urban forests, they also have obvious methodological limitations [14]. The most used stimuli, photos, give strong focus on the visual aspects of the forest interior and give a one-dimensional presentation [15,16,56]. We presented each photo and preconceptions “as is”, as an entity. Each photo scene included some type of trail, path, walkways, or different kinds of roads, and we left respondents free to analyze and judge the scene. Our sample is, however, partly biased; people that are highly educated are overrepresented and people that never do recreational activities are underrepresented (Table 3), but it is unclear how these biases influenced the evaluation of different forest infrastructure settings. Additionally, youth and children were not asked in our study, and we do not know how their evaluations would have influenced aggregated preference score.
Walking or cycling involve much more than the visual aspect of a trail as depicted in a photo or verbal; it involves the entire human body [9,45]. We might have received other answers if we had asked the respondents specifically how much they would have liked or disliked to move along the depicted trails, as a single visitor or as a member of a group, on foot, on a bike, or when pushing a pram. In other words, our study did not differentiate between what kinds of infrastructures the respondents would like for what kind of activities they want to carry out. We might have received other answers on the question we asked in the survey: “What would you prefer to meet in the forest?” if we at same time had wanted them to differentiate between activities like walking, biking, riding or paddling. However, walking in natural settings is indisputably the most common recreational activity among the Norwegian population (Table 3), and even higher figure in our survey, so the most of our respondents may have think about walking when answering our questionnaire. A similar question could be asked for the purpose of a forest visit for any respondent and this could be very different and vary from day to day, during life, and depending on factors like season, weather conditions and personal situation.
Responses to the set of verbal preconceptions related to trails and trail standards also reflect a general dislike among average forest visitors towards obvious technical interventions in a forest, at least when sitting at home in front of a computer. The two options related to graveled trails included entrance to a marked path, probably rewarding the graveled trail options with higher scores than they would have had if standing alone, because marked trails are highly appreciated. The preconception set related to meeting cyclists, horse riders, runners, hikers, cars and groups of people during their forest trip may be somewhat ambiguous because neither the length of the forest visit nor the quality of the trails used when meeting the given number of these visitor groups are specified. They do however suggest that meeting many cyclists, horse riders, runners, hikers, cars and groups of people are perceived as a nuisance.

5. Conclusions

Forests and wildlands are important for outdoor recreation. To be able to manage high quality forest environments for recreation, there is a need to understand people’s environmental preferences. Results from preference studies can be useful in planning of social values in multiple-use forest management, in combination with other objectives, e.g., timber production and protection of biodiversity. Inevitably, surveying forest infrastructure preferences involves simplifications of people’s experiences and theirs expectations of forest environments. Such abstractions can make it possible to render general guidelines for maintaining and increasing the recreational value of a forest, for example in the context of rural forest management, development of urban forests, or in providing scenic landscapes for tourists. We have identified increasing preference scores along the infrastructure continuum from “recreational roads” to “unmarked paths”. However, what people prefer does not correspond with the majority of actual recreational use; the most used infrastructures were the less appreciated infrastructures. This mismatch should not be interpreted as if we have unreliable findings; rather the findings should be used as guidelines for the management of forest infrastructure. Firstly, the manager should primarily develop and maintain infrastructure in the natural end of the continuum, but combined with knowledge about the social capacity and need. There should be harmony between the selected infrastructure and the local intensity of use, in order to avoid oversized (and less preferred) infrastructure. Secondly, the manager should provide “close-to-nature” and site adapted infrastructure design, to de-emphasize the negative experiences of over-developed infrastructure. These adaptations may include well-adapted curves to landscape form, to develop natural preferred forest structures close to the infrastructure body, and even to vary the road or path surfacing adapted to local use and users’ needs.

Acknowledgments

The authors would like to thank two anonymous referees for valuable comments and John Gunnar Dokk for assistance in collecting data for this project. This project received funding from The Research Council of Norway projects: “Testing and adapting recreational planning systems to urban woodlands (184126)” and “Integrating value diversity in the assessment of urban ecosystem services from nature-based solutions in cities (SIS URBAN)”.

Author Contributions

Vegard Gundersen: writing the paper, running data analyses and coordinating the research; Odd Inge Vistad: writing the paper and contributed to the interpretation of the results.

Conflicts of Interest

The authors declare no conflict of interest.

Appendix

Table A1. Mean score, standard deviation (S.D.) and number of respondents who provided preference scores for 15 images and 25 verbal preconceptions of recreational infrastructure and use of this infrastructure in boreal forest setting.
StimulinMinMaxMeanStd. D.
Forests 07 00113 i001Photo A.542175.631.469
Forests 07 00113 i002Photo B.543175.411.517
Forests 07 00113 i003Photo C.542175.561.372
Forests 07 00113 i004Photo D.541173.631.681
Forests 07 00113 i005Photo E.544175.121.422
Forests 07 00113 i006Photo F.541175.121.461
Forests 07 00113 i007Photo G.544174.701.603
Forests 07 00113 i008Photo H.541174.001.626
Forests 07 00113 i009Photo I.544173.781.683
Forests 07 00113 i010Photo J.543174.231.665
Forests 07 00113 i011Photo K.542174.031.615
Forests 07 00113 i012Photo L.543174.441.552
Forests 07 00113 i013Photo M.543173.451.780
Forests 07 00113 i014Photo N.542175.461.403
Forests 07 00113 i015Photo O.544173.441.630
Cyclists10 cyclists473172.621.873
5 cyclists469173.111.791
2 cyclists461173.821.786
1 cyclist462174.201.852
No cyclists478175.412.072
Groups of people10 families on a forest trip494172.852.059
5 families on a forest trip473173.291.873
2 families on a forest trip477174,261.734
1 family on a forest trip477174.941.684
No families457174.662.450
Runners10 runners490172.621.955
5 runners476172.951.861
2 runners473173.711.890
1 runners466174.141.941
No runners456175.062.267
Horse riders10 riders476171.811.409
5 riders471172.081.556
2 riders476172.861.927
1 rider479173.442.101
No riders476175.262.255
Hikers50 hikers482172,401.843
20 hikers477172,921.951
10 hikers474173.662.004
5 hikers487174.561.798
1 hiker475174.921.963
Recreational infrastructurePaved recreational road514171.621.250
Graveled walkway with junctions to marked path519174.441.798
Forest road with junctions to marked path512174.041.719
Marked path527175.881.350
Unmarked path514174.871.963
CarsNo motor cars516176.231.561
No motor cars516176.231.561
Five cars passing at a forest road504172.101.413
No motor cars516176.231.561
n, number of respondents; Min, Minimum value; Max, Maximum value; Mean, Mean value; Std. D., Standard deviation.

References

  1. Park, J.J.; O’Brien, L.; Roe, J.; Thompson, C.W.; Mitchell, R. The natural outdoors and health: Assessing the value and potential contribution of secondary public data sets in the UK to current and future knowledge. Health Place 2010, 17, 269–279. [Google Scholar] [CrossRef] [PubMed]
  2. Poudyal, N.C.; Hodges, D.G.; Bowker, J.M.; Cordell, H.K. Evaluating natural resource amenities in a human life expectancy production function. For. Policy Econ. 2009, 11, 253–259. [Google Scholar] [CrossRef]
  3. Shafer, C.S.; Lee, B.K.; Turner, S. A tale of three greenway trails: User perceptions related to quality of life. Landsc. Urban Plan. 2000, 49, 163–178. [Google Scholar] [CrossRef]
  4. Konijnendijk, C.C.; Ricard, R.M.; Kenney, A.; Randrup, T.B. Defining urban forestry: A comparative perspective of North America and Europe. Urban For. Urban Green. 2006, 4, 93–103. [Google Scholar] [CrossRef]
  5. Rydberg, D.; Falck, J. Urban forestry in Sweden from a silvicultural perspective: A review. Landsc. Urban Plan. 2000, 47, 1–18. [Google Scholar] [CrossRef]
  6. Hörnsten, L.; Fredman, P. On the distance to recreational forests in Sweden. Landsc. Urban Plan. 2000, 51, 1–10. [Google Scholar] [CrossRef]
  7. Jensen, F.S. Forest recreation. In Multiple-Use Forestry in the Nordic Countries; Hytönen, M., Ed.; METLA (The Finnish Forest Research Institute): Helsinki, Finland, 1995; pp. 245–269. [Google Scholar]
  8. Koppen, G.; Sang, Å.O.; Tveit, M.S. Managing the potential for outdoor recreation: Adequate mapping and measuring of accessibility to urban recreational landscapes. Urban For. Urban Green. 2014, 13, 71–83. [Google Scholar] [CrossRef]
  9. Skår, M. Experiencing nature in everyday life. Ph.D. Thesis, Norwegian University of Life Sciences, Ås, Norway, 2010. [Google Scholar]
  10. Torbidoni, E.I.F.; Grau, H.R.; Camps, A. Trail preferences and visitor characteristics in Aigüestortes i Estany de sant Maurici national park, Spain. Mt. Res. Dev. 2005, 25, 51–59. [Google Scholar] [CrossRef]
  11. Arnberger, A.; Eder, R. The influence of age on recreational trail preferences of urban green-space visitors: A discrete choice experiment with digitally calibrated images. J. Environ. Plan. Manag. 2011, 54, 891–908. [Google Scholar] [CrossRef]
  12. Dumont, B.; Roovers, P.; Gulinck, H. Estimation of off-track visits in a nature reserve: A case study in central Belgium. Landsc. Urban Plan. 2005, 71, 311–321. [Google Scholar] [CrossRef]
  13. Eriksson, L.; Nordlund, A.M.; Olsson, O.; Westrin, K. Recreation in different forest settings: A scene preference study. Forests 2012, 3, 923–943. [Google Scholar] [CrossRef]
  14. Gundersen, V.; Frivold, L.H. Public preferences for forest structures: A review of quantitative surveys from Finland, Norway and Sweden. Urban For. Urban Green. 2008, 7, 241–258. [Google Scholar] [CrossRef]
  15. Karjalainen, E. The Visual Preferences for Forest Regeneration and Field Afforestation—Four Case Studies in Finland. Ph.D. Thesis, Finnish Forest Research Institute, Helsinki, Finland, 2006. [Google Scholar]
  16. Ribe, R.G. The aesthetics of forestry: What has empirical preference research taught us? Environ. Manag. 1989, 13, 55–74. [Google Scholar] [CrossRef]
  17. Lindhagen, A.; Hornsten, L. Forest recreation in 1977 and 1997 in Sweden: Changes in public preferences and behaviour. Forestry 2000, 73, 143–151. [Google Scholar] [CrossRef]
  18. Jensen, F.S.; Koch, N.E. Friluftsliv i Skovene 1976/77–1993/94.; Forskningscentret for Skov & Landskab: Hørsholm, Denmark, 1997. [Google Scholar]
  19. Koch, N.E. Forest recreation in Denmark. Part IV. The preferences of the population with regard to the forests and the appearance of the open landscape. Forstl. Forsøgsvæs. Dan. 1988, 41, 243–516. [Google Scholar]
  20. Dorwart, C.E.; Moore, R.L.; Leung, Y.-F. Visitors’ perceptions of a trail environment and effects on experiences: A model for nature-based recreation experiences. Leis. Sci. 2009, 32, 33–54. [Google Scholar] [CrossRef]
  21. Outdoor Recreation Act. Lov om Friluftslivet; LOV 1957-06-28 nr 16; Klima-og Miljødepartementet: Oslo, Norway, 1957. [Google Scholar]
  22. Gundersen, V.; Tangeland, T.; Kaltenborn, B.P. Planning for recreation along the opportunity spectrum: The case of Oslo, Norway. Urban For. Urban Green. 2015, 14, 210–217. [Google Scholar] [CrossRef]
  23. Boller, F.; Hunziker, M.; Conedera, M.; Elsasser, H.; Krebs, P. Fascinating remoteness: The dilemma of hiking tourism development in peripheral mountain areas. Mt. Res. Dev. 2010, 30, 320–331. [Google Scholar] [CrossRef]
  24. Hendee, J.C.; Stankey, G.H.; Lucas, R.C. Wilderness Management, 2nd ed.; American Press Fulcrum Publishing: Golden, CO, USA, 1990. [Google Scholar]
  25. Clark, R.N.; Stankey, G.H. The Recreation Opportunity Spectrum: A Framework for Planning, Management and Research; U.S. Department of Agriculture, Forest Service, Pacific Northwest Forest and Range Experiment Station: Missoula, MT, USA, 1979.
  26. Driver, B.L.; Brown, P.J. The Recreation Opportunity Spectrum Concept and Behavioural Information in Outdoor Recreation Resource Supply Inventories: A Rationale; U.S. Department of Agriculture, Forest Service, Rocky Mountain Forest and Range Experiment Station: Fort Collins, CO, USA, 1978.
  27. Gundersen, V.; Frivold, L.H.; Myking, T.; Øyen, B.H. Management of urban recreational woodlands: The case of Norway. Urban For. Urban Green. 2006, 5, 73–82. [Google Scholar] [CrossRef]
  28. Ministry of Environment. Nasjonal Strategi for et Aktivt Friluftsliv; En Satsing på Friluftsliv i Hverdagen 2014–2020; Ministry of Environment: Oslo, Norway, 2013; pp. 1–24.
  29. PEFC. Forest Certification in Norway. Available online: http://www.pefcnorway.org/ (accessed on 14 April 2016).
  30. Shafer, E.L. The Average Camper Who Doesn’t Exist; U.S. Department of Agriculture, Forest Service, Northeast Forest Experiment Station: Upper Darby, PA, USA, 1969.
  31. Joyce, K.; Sutton, S. A method for automatic generation of the recreation opportunity spectrum in New Zealand. Appl. Geogr. 2009, 29, 409–418. [Google Scholar] [CrossRef]
  32. Raadik, J.; Cottrell, S.P.; Fredman, P.; Ritter, P.; Newman, P. Understanding recreational experience preferences: Application at Fulufjellet national park, Sweden. Scand. J. Hosp. Tour. 2010, 10, 231–247. [Google Scholar] [CrossRef]
  33. Ribe, R.G. Scenic beauty perceptions along the ROS. J. Environ. Manag. 1990, 42, 199–221. [Google Scholar] [CrossRef]
  34. Zulian, G.; Paracchini, M.L.; Maes, J.; Liquete, C. Estimap: Ecosystem Services Mapping at European Scale; Institute for Environment and Sustainability, Joint Research Centre, European Commission: Brussel, Belgium, 2013. [Google Scholar]
  35. US Forest Service. Trail Fundamentals. Available online: http://www.fs.fed.us/recreation/programs/trail-management/trail-fundamentals/ (accessed on 14 April 2016).
  36. Statistics Norway. Sports and Outdoor Activities, Survey on Living Conditions. Available online: https://www.ssb.no/kultur-og-fritid/statistikker/fritid/hvert-3-aar/2014-12-18 (accessed on 14 April 2016).
  37. Dervo, B.K.; Skår, M.; Köhler, B.; Øian, H.; Vistad, O.I.; Andersen, O.; Gundersen, V. Outdoor Recreation in Norway in 2014: State of the Art and Challenges for the Future; Norwegian Institute for Nature Research: Trondheim, Norway, 2014. [Google Scholar]
  38. Andersen, O.; Gundersen, V.; Wold, L.C.; Stange, E. Monitoring visitors to natural areas in wintertime: Issues in counter accuracy. J. Sustain. Tour. 2013, 22, 550–560. [Google Scholar] [CrossRef]
  39. Pettebone, D.; Newman, P.; Lawson, S.R. Estimating visitor use at attraction sites and trailheads in Yosemite national park using automated visitor counters. Landsc. Urban Plan. 2010, 97, 229–238. [Google Scholar] [CrossRef]
  40. Ross, J. Visitor Counters in Parks: Management Practice for Counter Calibration; Department of Conservation: Wellington, New Zealand, 2005.
  41. Yang, H.; Ozbay, K.; Bartin, B. Enhancing the quality of infrared-based automatic pedestrian sensor data by nonparametric statistical method.Transportation research record. J. Transp. Res. 2011, 2264, 11–17. [Google Scholar] [CrossRef]
  42. Kajala, L.; Almik, A.; Dahl, R.; Diksaite, L.; Erkkonen, J.; Fredman, P.; Jensen, F.S.; Karoles, K.; Sieväinen, T.; Skov-Petersen, H.; et al. Visitor Monitoring in Nature Areas—A Manual Based on Experiences from the Nordic and Baltic Countries; Swedish Environmental Protection Agency: Stockholm, Sweden, 2007. [Google Scholar]
  43. Hellstrom, E. Conflict cultures—Qualitative comparative analysis of environmental conflicts in forestry. Silva Fen. Monogr. 2001, 2, 2–109. [Google Scholar]
  44. Kaplan, R.; Kaplan, S. The Experience of Nature: A Psychological Perspective; Cambridge University Press: Cambridge, UK, 1989. [Google Scholar]
  45. Bischoff, A. Stier, Mennesker og Naturopplevelser; Novus Forlag: Oslo, Norway, 2015. [Google Scholar]
  46. Skar, M.; Wold, L.C.; Gundersen, V.; O’Brien, L. Why do children not play in nearby nature? Results from a Norwegian survey. J. Adv. Educ. Outdoor Learn. 2016. [Google Scholar] [CrossRef]
  47. Skar, M.; Gundersen, V.; O’Brien, L. How to engage children with nature: Why not just let them play? Child. Geogr. 2016. [Google Scholar] [CrossRef]
  48. Fjørtoft, I. The natural environment as a playground for children: The impact of outdoor play activities in pre-primary school children. Early Child. Educ. J. 2001, 29, 111–117. [Google Scholar] [CrossRef]
  49. Gundersen, V.; Frivold, L.H.; Löfström, I.; Jørgensen, B.B.; Falck, J.; Øyen, B.H. Urban woodland management—The case of 13 major Nordic cities. Urban For. Urban Green. 2005, 3, 189–202. [Google Scholar] [CrossRef]
  50. Thorén, K.H.; Wold, L.C.; Vistad, O.I.; Skår, M.; Gundersen, V.; Bærum, K.M.; Nordh, H.; Skjeggedal, T. Å gå i nærmiljøet i Moss—Hvem, når og hvorfor ikke? Om NFR-prosjektet nærtur, og noen foreløpige resultater. In Proceedings of Forskning i Friluft 2015, Lillehammer, Norway, 27–28 January 2015; Norsk Friluftsli: Oslo, Norway, 2015. [Google Scholar]
  51. Kliskey, A.D. Linking the wilderness perception mapping concept to the recreation opportunity spectrum. Environ. Manag. 1998, 22, 79–88. [Google Scholar] [CrossRef]
  52. Hallikainen, V. The Finnish Wilderness Experience; The Finnish Forest Research Institute: Rovaniemi, Finland, 1998. [Google Scholar]
  53. Hallikainen, V. The Finnish “social wilderness”. In Wilderness within the Context of Larger Systems, Proceedings of the Wilderness Science in a Time of Change Conference, Missoula, MT, USA, 23–27 May 2000; McCool, S.F., Cole, D.N., Borrie, W.T., O’Loughlin, J., Eds.; Department of Agriculture, Forest Service, Rocky Mountain Research Station: Ogden, UT, USA, 2000; Volume 2. [Google Scholar]
  54. Sæþórsdóttir, A.D. Planning nature tourism in Iceland based on tourist attitudes. Tour. Geogr. 2011, 12, 25–52. [Google Scholar] [CrossRef]
  55. Wimpey, J.F.; Marion, J.L. The influence of use, environmental and managerial factors on the width of recreational trails. J. Environ. Manag. 2010, 91, 2028–2037. [Google Scholar] [CrossRef] [PubMed]
  56. Haakenstad, H. Forest Management in an Area of Outdoor Life. An Investigation of Public Opinion about Oslomarka; Agricultural University of Norway: Ås, Norway, 1972. [Google Scholar]
Figure 1. Five classes of recreational infrastructure continuum.
Forests 07 00113 g001
Figure 2. Mean preference score for 5 × 3 photos (green bars) and 5 × 7 verbal preconception (blue bars) based on 4671–5115 evaluation (1 to 7 Likert scale) within each ROS class. Black bars depict the sum of all evaluation of photos and preconceptions. All values and classes differ significantly (p < 0.05, SE < 0.031 for all). See Table A1 for preference score details.
Forests 07 00113 g002
Figure 3. Sum of persons passing each day during 94 days in the months July, August and September as indicated by sum of counting sites in each ROS class. RR = Recreational roads; WA = walkways/bikeways; FR = Forest roads; MP = Marked path; UP = Unmarked path.
Forests 07 00113 g003
Figure 4. Mean number of persons passing per day during 94 days in the months July, August and September along the recreational infrastructure continuum, documented at 39 counting sites in urban areas in southeastern Norway. Legend: Mean value ± 2 Standard Error. See Table 4 for counting sites details.
Forests 07 00113 g004
Table 1. Descriptions of the five infrastructure classes along the recreational continuum from developed to natural areas [35].
Recreational RoadBikeway/WalkwayForest RoadMarked PathUnmarked Path
TreadCommonly hardened, graveled or asphalt. Width, 3.0 to maximum 4.0 mWide and smooth Width, 1.0 to maximum 3.0 mWide and graveled Width, minimum 4.0 mObvious and continuousIntermittent Indistinct Narrow and rough
ObstaclesNo obstacles, grades typically <8%.No obstacles exist, grades typically <12%, vegetation cleared outside of trailway.No obstacles, grades <10%.Infrequent.Obstacles continuous or occasionally present
Constructed FeaturesStructures frequent or continuousStructures frequent and substantialRoad structures, bridges etc.Trail structures may be common and substantialMinimal to non-existent
SignsWide variety of signage is presentWide variety of signs likely presentDirectional signs and signs at junctions to pathsDirectional signsNo signs
Typical Rec. Environment/ExperienceRecreation environment can be highly Modified. Non-motorizedRecreation environment, may be Modified. Non-motorizedRecreation environment, rural and modified by forestry, motorized.Recreation environment natural, primarily unmodifiedNatural, unmodified
Table 2. Mode-specific standards of quality for 15 photos and 35 preconceptions used in our study (see Table A1). There are three photos within each ROS class. Preconceptions concern varying numbers of different recreationalists in each ROS class. For details regarding questions used in the survey, see text and Table A1.
Indicators/Density of UseRange of Opportunities (ROS-Classes)
UrbanConcentratedRusticSemi-PrimitivePrimitive
Mode specific MeasuresPhotos and PreconceptionsInfrastructureRecreational roadsWalkways/bikewaysForest roadsMarked pathsUnmarked paths
Preconceptions# of Cyclists10521No
# of Runners10521No
# of Horse riders10521No
# of Hikers50201051
# of Groups of people10521No
# of CarsNoNo5NoNo
Table 3. The representativity of the survey population (n = 545). Percentages of present survey sample compared with the national population.
ThemeCategoriesPresent Survey (%)Statistics Norway [35]Diff. (%)
GenderMale48.349.7−1.4
Female51.750.31.4
Age classes (year) (2011)16–192.98.2−5.3
20–3430.623.76.9
35–5437.935.22.7
55+28.532.9−4.4
Highest level of education (2011)Below upper secondary education7.931.3−23.4
Upper secondary education36.643.4−6.8
Higher education, short (<4 year)35.119.615.5
Higher education, long (>4 year)20.25.814.4
Unknown or no completed education0.20.10.1
Type of recreation activities (2007)Walking in forest and wildland92.779.313.4
Picking berries and mushrooms42.243.7−1.5
Hunting7.03.13.9
Paddling or rowing15.414.21.2
Biking in natural settings40.043.2−3.2
Riding in natural settings5.56.5−1
Skiing in forest and wildland or in the mountain44.446.2−1.8
Skating on natural lakes and watercourses6.19.4−3.3
Downhill skiing or snowboarding in ski slopes20.416.93.5
Mountain climbing, white water paddling or other kind of demanding sports3.94.8−0.9
Mountain biking or dog sledding7.211.9−4.7
Go swimming, sun-bathing69.470.3−0.9
Recreational fishing44.634.210.4
Other activities29.532.1−2.6
How often in average did you visit the forest in leisure time? (2007)Daily6.17−0.9
3–4 a week9.790.7
1–2 a week32.8248.8
1–2 a month29.5218.5
Rarer than every month20.2182.2
Never1.721−19.3
Table 4. Key information for recreational infrastructure sites where automatic counting have taken place in urban forests in southeastern Norway and the actual use of these infrastructure expressed by max, min, mean per day and sum during the period of 1 July to 1 October in the municipalities of Moss, Vestby, Brumunddal, Lillehammer and Oslo.
MunicipalityPlaceYearROS 1Forest 2Distance Urban 3 (m)MaxMinMean Per DaySum
MossKulpe2014RRM26652832155.514,461
MossNøkkeland north2014FRC17674426.62476
MossNøkkeland south2014WAC1102762896.78990
MossLauersbakken2014RRC2321331968.16335
MossNoreødegården2014RRM7856572681.17542
MossVenemsbukken2014RRM22452621146.24301
MossMøllerås2014MPC29593025.02329
MossKilsbakken2014MPC3663611063.55901
MossRetterstedet2014WAC28542612126.611,777
MossRøysås2014UPC20157421.82026
MossNespark west2015WAB551962473.96872
MossTorbjørnsrød2015FRC46262425.32351
MossNespark main ent.2015RRB45214251479.544,591
MossNespark. north2015WAC501691964.45988
MossKambo2015RRM16127574172.616,050
VestbyKolås2015UPM5861901.9174
VestbyHølen2015UPC8444005.1478
VestbyEmmerstad2015FRC756128016.71557
VestbyPepperstad2015UPC1261501.4132
BrumunddalSveum2015WAC7756217262.824,438
BrumunddalUldvaren north2015UPC6452803.6337
BrumunddalVanntårnet2015WAC432107946180.816,812
BrumunddalMinka2015UPB2453141450.14663
BrumunddalUldvaren south2015UPC14534508.3776
LillehammerKanalen2012RRC18522112103358.933,378
LillehammerØfsdalsfossen2012MPC4921201013.71271
LillehammerMesnaelva2012WAC37798649188.617,540
LillehammerTverrløypa2012WAM262512385.97989
LillehammerKjærlighetsstien2012MPM59872456.65261
OsloNøklevann2013RRC1323171284548.851,042
OsloRundvannsåsen2013WAC1652253371.66659
OsloLutdalen2013MPC2745138427.62566
OsloHauktjern2013MPC24773708.0749
OsloDølerudåsen2013MPC165249011.61083
OsloSmørholtet2013MPC228383018.91762
OsloPuttjern2013UPC17822105.6522
OsloSpinneren2013UPC3029901.7161
OsloSognsvann-øst2013RRM9783268941761.7163,838
OsloSognsvann-vest2013RRM117235732591392.1129,466
1 FR, Forest road; RR, Recreational road; WA, Walkway/Bikeway; MP, Marked path; UP, Unmarked path; 2 C, Conifer forest; B, Broadleaved forest; M, Mixed forest, all within boreal or boreonemoral forest zone; 3 Shortest distance along recreational infrastructure to the urban border defined by Statistics Norway 2015 (in meter).

