Article

The Effects of Disturbance History on Ground-Layer Plant Community Composition in British Columbia

1
Department of Geography, Simon Fraser University, 8888 University Drive, Burnaby, BC V5A 1S6, Canada
2
Department of Forest Ecosystems and Society, Oregon State University, 336 Richardson Hall, Corvallis, OR 97331, USA
*
Author to whom correspondence should be addressed.
Forests 2016, 7(5), 109; https://doi.org/10.3390/f7050109
Submission received: 29 February 2016 / Revised: 6 May 2016 / Accepted: 13 May 2016 / Published: 21 May 2016

Abstract

:
Plant communities are sensitive to perturbations and may display alternative recovery pathways depending on disturbance history. In sub-boreal lodgepole pine forests of central interior British Columbia, Canada, fire and logging are two widespread landscape disturbances that overlap in many regions. We asked whether cumulative, short-interval disturbance from logging and fire resulted in different ground-layer plant communities than resulted from fire alone. Using field-collected data, we compared the taxonomic composition and functional traits of 3-year old plant communities that were either harvested 6-to-13 years prior, or not harvested prior to being burned in a large stand-replacing fire. The taxonomic composition diverged between the two treatments, driven primarily by differences in a few key indicator species such as Petasites frigidus and Vaccinium membranaceum. Analysis of individual species’ morphological traits indicated that only a few species vary in size in relation to disturbance history. Our data suggest that a history of forest harvest leaves a subtle footprint on post-fire ground-layer plant communities at early stages of succession.

Graphical Abstract

1. Introduction

Plant communities are complex aggregations of many species and are structured in part by the disturbances they experience. Ground-layer plant communities in British Columbia’s (BC) central interior sub-boreal spruce forests experience a complex suite of disturbance regimes, primarily in the form of wildfire, logging, and insect outbreak. Wildfire is the most prominent abiotic disturbance in the region [1], is particularly important for recruitment of fire-adapted trees such as lodgepole pine (Pinus contorta var. latifolia Engelm. ex S. Watson) [1], and contributes to heterogeneity in ground-layer plant communities [2,3]. Forest harvest is a relatively new disturbance to the region but has become increasingly prominent since industrial, clear-cut logging began rapidly intensifying in the late 1970s. Mechanical disturbance and changes in light availability resulting from the harvest of trees can influence community composition by promoting species that benefit from this disturbance [4,5]. The frequency and spatial extent of fire and forest harvest in BC result in a high likelihood that many areas will be affected by both disturbances close in time.
Landscape disturbance from fire and forest harvest have distinct effects on the biophysical characteristics of forests that can differentially affect the plant composition of early seral communities. Ground-layer plant communities in recently harvested areas are compositionally distinct from understory plant communities in those recently burned [3]. The effects of fire on vegetation vary according to factors including fire intensity and depth of burn into the soil. Burn severity can be described as the degree to which the biotic landscape has been affected by fire [6] and high severity burns can result in the consumption of seeds, roots, rhizomes, or other regenerative and reproductive plant structures. This removal of reproductive biomass may result in greater emphasis on outside colonization during community recovery [7]. Severe fire can also alter the physical and chemical properties of soils such as pH [8,9], nutrient availability [10], and hydrophobicity [11], thereby altering the ecological theatre in which communities reassemble. In contrast, the harvest of timber involves the use of heavy machinery and may result in soil compaction and damage of above-ground vegetative structures but should otherwise leave most non-merchantable species, below-ground vegetative structures, and soil seed banks relatively intact, resulting in higher initial post-disturbance ground-layer richness and cover relative to fire [3,12]. Communities that have experienced logging begin succession with a greater proportion of species associated with mature understory communities while burned sites begin succession with more specialized, fire-associated plants [13]. Logging generally does not result in direct chemical changes to the environment, as occurs through the combustion of organic matter, though site preparation or management may facilitate processes such as soil leaching [14,15].
Early seral plant communities can exhibit distinct responses to multiple disturbances occurring at short-intervals. Communities that experience multiple, successive disturbances before being able to fully recover may experience compound disturbance (sensu Paine et al. 1998) [16] where the outcome of a prior disturbance affects the ecological outcome of a subsequent disturbance. Buma and Wessman [17] found that, in subalpine forests, blowdown can interact with fire to increase fire severity (linked disturbances) and can negatively impact conifer seedling regeneration (a compound disturbance effect). Similarly, Harvey et al. [18] found that in Douglas-fir dominated montane forests, beetle outbreak severity was not directly linked to fire severity, but the two disturbances had compounding effects that could result in either increased or decreased tree regeneration depending on the treatments. Pidgen and Mallik [19] studied the effects of fire and logging on ground-layer communities in boreal forests and found communities that were burned and those that were logged were more similar to each other than to communities that experienced both burning and logging. Kurulok and Macdonald [5] found that boreal forest communities that had been salvage logged after fire contained more weedy, shade intolerant species compared to communities that were not salvage logged after fire.
Functional traits of an organism are considered relevant to its response to the environment and/or its effects on the ecosystem [20] and are what is acted on by disturbance and environmental pressures [21,22]. It is possible to measure individual and species response to differences in environmental conditions by testing for differences in obvious morphological traits such as height, horizontal spread, and leaf area. Both forest harvest and wildfire have been shown to filter the functional trait composition of plant communities. For example, forest harvest tends to favor ruderal annuals and tall, shade-intolerant forbs compared to communities in more mature forests [23]. Furthermore, retention-cut areas, logged areas with small patches of trees intentionally left intact, have been shown to maintain a greater abundance of shade-tolerant species than clear-cut logged areas [24]. The impact of fire often includes shifts in the dominance of certain plant life-forms, for example an increase in the abundance of forbs and a decrease in the dominance of shrubs after severe fire [25]. Similarly, smaller statured plants whose buds are at or near the soil surface tend to increase after fire whereas larger, taller plants with structures that project far into the air on stems tend to decrease after fire [26]. When thinking about the cumulative outcome of multiple disturbances, it is interesting to consider how disturbance history filters traits of the community as a whole, but also whether particular species exhibit differences in their traits according to disturbance history.
In this study, we explore the effects of disturbance history on the taxonomic composition and functional traits of early seral plant communities after a severe wildfire event. We compare communities developing on sites that had been harvested (LOGGED) prior to being burned, to those that were not harvested (UNLOGGED). We examine two alternative hypotheses. (1) Disturbance history has an effect on the composition of early seral plant communities following high severity fire because of differences in environmental conditions these disturbances impose. In particular, we predict that three years post-fire, communities that establish in sites that were UNLOGGED prior to being burned will have more shade-tolerant individuals, associated with partial shading effects from the standing dead trees. These individuals would also be generally taller or have greater basal area than species in the LOGGED sites and would have larger leaves. Alternatively, (2) disturbance history does not have a strong effect on the composition of early seral plant communities after fire. In this scenario, the fire acts to “reset” the landscape and plant communities that develop after the fire do not differ between the LOGGED and the UNLOGGED sites.

2. Materials and Methods
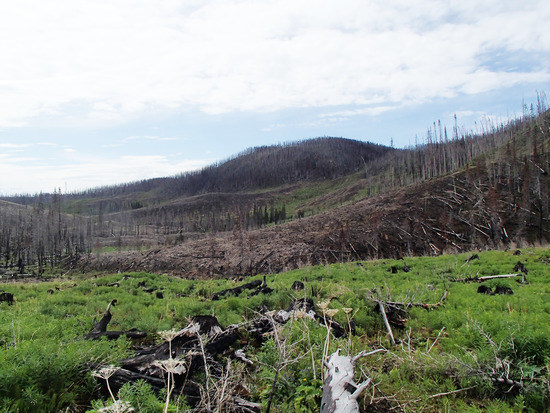
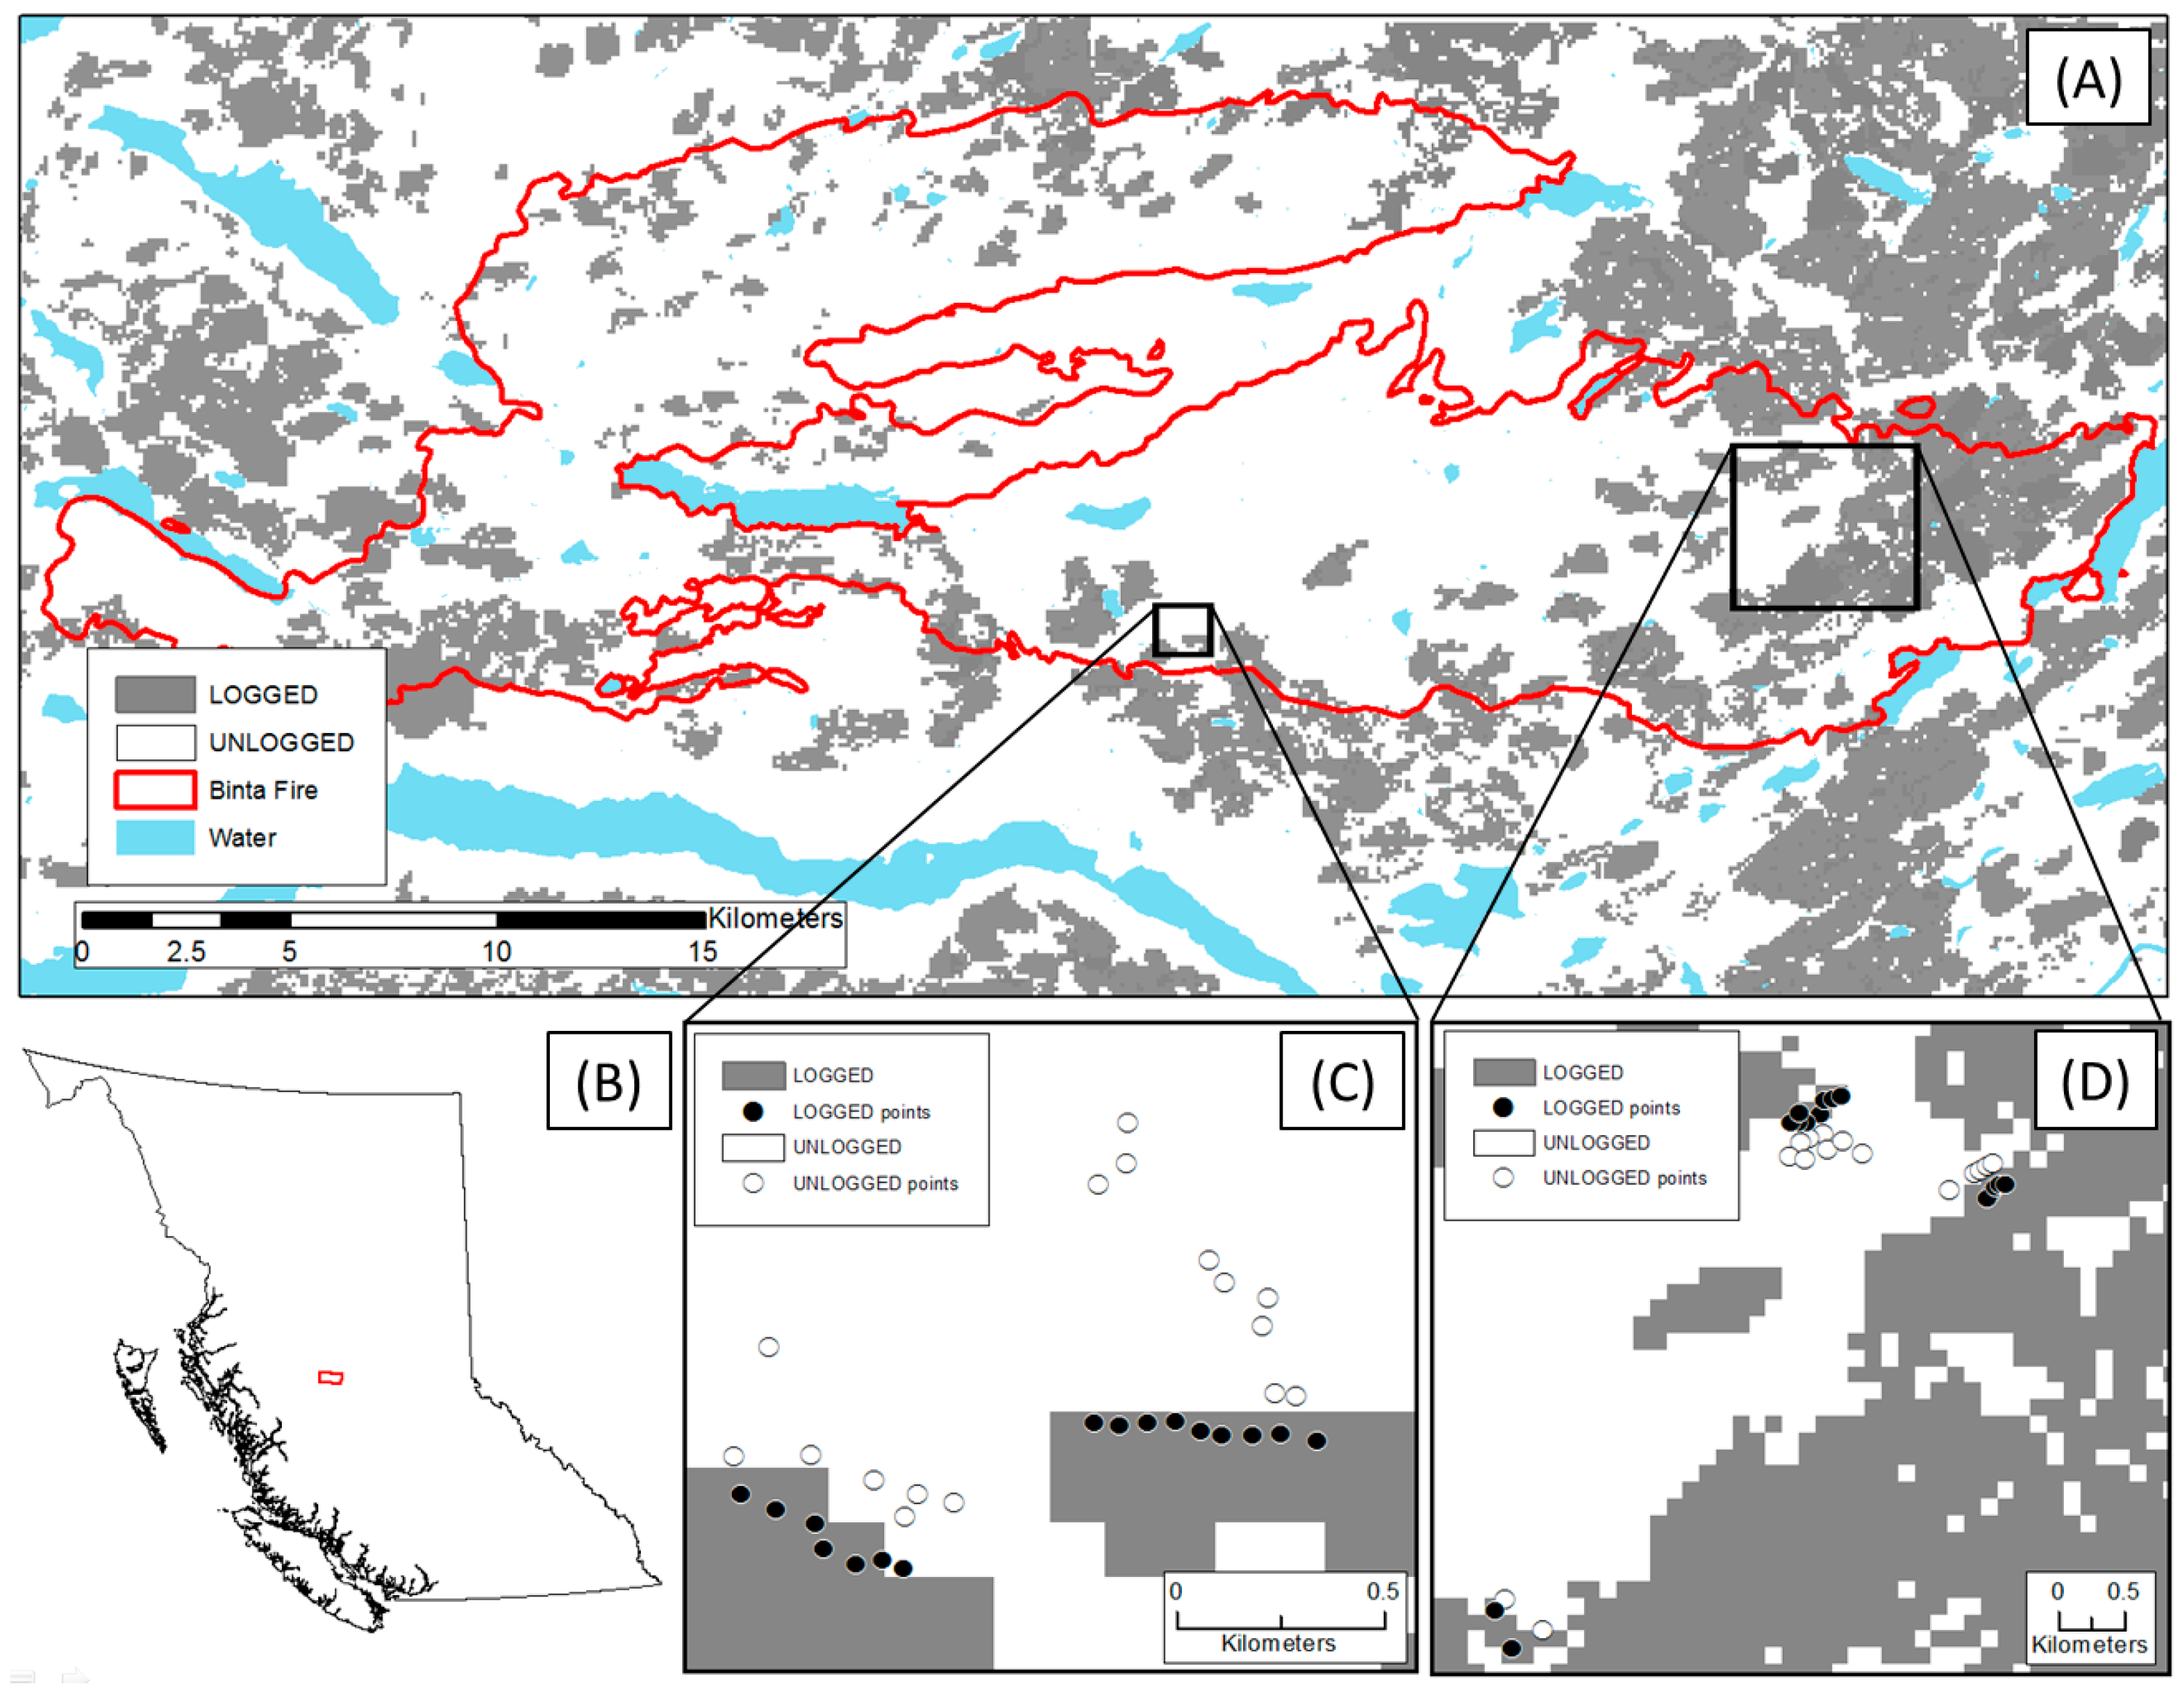
2.1. Study Area

The study was conducted in central interior British Columbia within the sub-boreal spruce biogeoclimatic zone, moist-cool 2 variant [27] that generally experiences cold winters and short, temperate summers with a mean of 116 frost-free days. This biogeoclimatic zone receives a mean precipitation of 574.4 mm annually and a mean precipitation of 229.4 mm during the growing season [28,29]. The study region was burned in a 39,000 ha lightning-caused, stand-replacing fire, called the Binta fire, in the summer of 2010 (Figure 1). The fire burned from late July to late August and was allowed to burn out naturally following initial suppression [30]. The burned area is situated in the Prince George Timber Supply Area, a region dominated by lodgepole pine forests that had been severely affected by the mountain pine beetle (Dendroctonus ponderosae Hopkins) outbreak that peaked in 2004–2005. Prior to the fire, forest stands were dominated by dead, grey-phase mountain pine beetle-killed lodgepole pine interspersed with hybrid interior white spruce (Picea glauca Moench Voss × engelmannii Parry ex Engelm.) and sub-alpine fir (Abies lasiocarpa Hook. Nutt). Hardwood species, such as trembling aspen (Populus tremuloides Michx.), are also present in the region though are generally sparse. The forests in our study region have an extensive history of forest harvest that has primarily been done through clear-cutting followed by natural regeneration when possible, or through restocking of lodgepole pine and interior white spruce from nursery trees in subsequent years following harvest [31].
The mosaic of disturbances in this region provides us with a natural experiment that has two “treatments” with which we can test our hypotheses. Our LOGGED treatment was comprised of sites that had been logged between 6 and 13 years prior to being burned in the Binta fire and our UNLOGGED treatment was comprised of sites that had not been logged prior to being burned. Also, it is important to note that the sample sites were affected by the recent mountain pine beetle outbreak and experienced extensive lodgepole pine mortality before being burned. The recent outbreak is unprecedented in its extent and severity in BC and has resulted in >90% adult lodgepole pine mortality in our study region, based on aerial observation data [32]. The spatial extent of the recent outbreak means that mountain pine beetle-affected forests are the new norm in BC; unaffected areas are much less common than affected ones. The ground-layer plant communities generally are not directly affected by the outbreak and remain largely the same [33], although they may experience release when the dead lodgepole pine drop their needles and open up the canopy.

2.2. Data Collection

2.2.1. Site and Sample Point Selection

The study design consisted of 31 pairs of sample points: 31 LOGGED sample points paired with 31 UNLOGGED points. The paired points were distributed across two sample sites, hereafter referred to as the EAST and the WEST sites that were approximately 15 km apart (Figure 1). Sites were considered as EAST and WEST sites because of possible differences due to spatial distance between them, which was confirmed during analyses. Suitable potential sample sites in the LOGGED and UNLOGGED treatments were selected a priori using a Geographic Information System (GIS) (ArcGIS 10.2.1; Environmental Systems Research Institute, Redlands, CA, USA) with supporting data layers including burn severity, logging history, and mountain pine beetle kill. Burn severity was estimated using the difference in normalized burn ratio (dNBR [6]) and sampling was restricted to “high” burn severity areas. The dNBR calculations for the Binta fire were done using images from Landsat Thematic Mapper 5 and 7 (WRS2 Path 50 Row 22) taken on 23 July 2010 and 3 August 2011. Logging history for the region was extracted from the Ministry of Forest, Lands and Natural Resource Operations (MFLNRO) Vegetation Resources Inventory [34] and used in conjunction with a 1-km harvest history raster layer (provided by Marvin Eng, BC Forest Practices Board, Victoria, BC, Canada). Estimates of mountain pine beetle kill were obtained from the MFLNRO infestation project [35], based upon aerial observation data integrated into a spatial model of beetle kill severity. Sampling sites were restricted to areas estimated to have >75% cumulative mountain pine beetle kill.
Sample points were selected in the field within the pre-selected sample sites. We sampled 15 paired points in the EAST site and 16 paired points in the WEST site (Figure 1). To maintain broadly comparable data points in this natural experiment, sample points were restricted to areas with a slope of <5 degrees, that were generally south-facing. We ground-truthed all sample points to confirm that they had been burned under high severity conditions and had 100% adult tree mortality at the time of sampling. Location data were collected using a Garmin GPSMAP 78s handheld GPS unit.
We used a systematic sampling design and ensured that all sample points were at least 50 m from all other points, and at least 100 m from the boundary between the LOGGED and UNLOGGED treatments. By necessity, sampling was done in areas with relatively well-maintained logging roads. Some of our sample points were replanted following the Binta fire but none received chemical or mechanical treatment before or after planting [36].

2.2.2. Plant Community Data

We collected plant community data from the 31 pairs of points three years after fire, between 16 June and 25 July 2013. The community composition at each sample point was measured using 3 m radius circular plots. Paired points were sampled on the same day. All vascular plants and bryophytes within each plot were identified to the species level and recorded, with the exception of Salix spp. and graminoids. Salix was identified to the genus level and grasses and sedges were combined into groups because they could not be reliably identified to the species level. Lichens were generally absent from our study areas. Species abundance was estimated using a line intercept method with three, 3 m transects each running North, South-East, and South-West from the center of each sampling point. Abundance was estimated by determining how much each species crossed each transect, in centimeters, and dividing that by the total length, 300 cm. We took the average of the three transects to obtain a point-level estimate. Plant biomass samples were collected at a random point along each transect using a 0.5 m2 sample frame. The biomass was separated into three categories: grasses, shrubs, and forbs. Plant biomass was oven dried and weighed using a precision balance.
We collected height, length (plant spread as viewed from above, measured along the longest axis), and width (plant spread as viewed from above, measured perpendicular to length), and leaf area data for all vascular plant species except tree seedlings, Salix spp., and graminoids. Salix spp. was excluded because they were rare and we could not identify individuals to the species level. We excluded the graminoids because of uncertainties with attributing trait values to grasses and comparing them with the traits values of our other groups. Ten individuals of each species present at each point were sampled, if possible. All individuals of a species were sampled if there were fewer than 10 individuals. We collected three to ten leaves, depending on species, from each individual. Leaf sample numbers were based on Cornelissen et al. (2003)’s suggestion of a minimum of 20 leaves total per species for leaf area estimates [37]. Leaf area was calculated by scanning leaves using an IRIScan Book 2 handheld scanner with image analysis using ImageJ software [38].
We quantified lodgepole pine regeneration by counting the number of seedlings that were present in each 3 m radius sample point. We distinguished between natural regeneration and seedlings that were likely planted based on seedling age and whether or not the seedling appeared to be regularly spaced relative to other lodgepole pine seedlings.

2.2.3. Environmental Variables

We characterized the environment at each sample point based on nine biophysical attributes in addition to our treatment-level characterization of LOGGED vs. UNLOGGED. Attributes included: canopy cover, wind speed, soil moisture, soil temperature, soil pH, soil nitrogen content, slope, aspect, and elevation. Canopy cover measurements were taken at the time of vegetation sampling. Wind speed, soil moisture, and soil temperature were measured within a span of 10 days from 27 July to 5 August 2013, with a goal to collect a snapshot of pair-wise comparable characteristics with minimal seasonal variation. Points that were paired together were sampled on the same day.
We used canopy cover as a proxy to describe the amount of exposure to winds, rain, sun, and other climate effects to which each plot was subjected; it was essentially a measure of cover from charred snags that remained standing post-fire. We measured canopy cover by taking a photograph at the center of each sample point with a camera held 1 m off the ground and pointed straight up. Canopy photos were analyzed using ImageJ software [38] to determine the percentage of the sky that was obstructed by the canopy. The wind speed at each sample point was measured using a Kestral 3500 Weather Meter at ground level, oriented east-west. We recorded the maximum wind speed and the average wind speed over a 30-min interval.
Soil samples were taken by creating boreholes 1.5 m away from the center of each sample point in the South, North-East, and North-West directions, for a total of three boreholes. We used a soil auger and collected the soil from approximately 5 cm–20 cm depth. For each sample point, we took 30 g of soil from each borehole and combined them to create an aggregate point-level sample for analysis. Soils were air-dried and stored for Nitrogen (NH4N and NO3N) and pH analysis in the lab. Soil pH was measured using 0.01 M CaCl2 solution [39]. Soils were processed in February 2014 and analyzed by BC MFLNRO Analytics Lab in Victoria, BC. Soil moisture and temperature were sampled by inserting a Hanna 99121 probe parallel to the surface into each borehole 5–10 cm down for a total of three estimates at each sample point. We tested how much soil temperature and moisture varied diurnally (data not shown) in our study area. Our analyses suggested that soil moisture variability over the season was much larger than diurnal variability. As such, time-of-day should have negligible effects on the sample and our paired-design should capture variation at the appropriate temporal scale.
Slope and aspect at each point was estimated using a compass with built-in clinometer and were primarily used to ensure that the difference in slope and aspect between sample points was minimized. Elevation was extracted from GPS waypoint data.

2.3. Analysis

2.3.1. Community Richness, Diversity, and Evenness

We tested for differences in species richness, diversity, and evenness between the LOGGED and UNLOGGED treatments as well as between the EAST and WEST sites. Note, preliminary analyses found that the EAST and WEST sites differed in terms of diversity and community composition and so we performed our analyses on the EAST and the WEST sites individually as well as globally (EAST and WEST sites combined, n = 62; 31 pairs) for all remaining analyses. Species richness was calculated as the total number of species—excluding Salix spp., tree seedlings, and graminoids—that were present at each sample point. We calculated species diversity using the Shannon-Wiener index and species evenness was measured using Pielou’s evenness index. Species diversity was calculated using the “Vegan” package in R [40]. We tested for differences in these community metrics between treatments using paired t-tests, performed using the functions in base R [41], and for differences between the EAST and WEST sites using unpaired t-tests with the “fdr” adjustment for multiple comparisons [42].

2.3.2. Differences in Community Composition

We tested whether the composition of early seral communities differed between the LOGGED and UNLOGGED treatments using blocked multi-response permutation procedures (MRBP) and analysis of similarity (ANOSIM). The two analyses are conceptually similar but each include nuanced differences, described below, such that we decided to use them as two complementary tests. We performed the MRBP and ANOSIM analyses on our EAST and WEST sample sites individually as well as testing for differences between EAST and WEST, and tested our treatments globally (EAST and WEST sites combined, n = 62; 31 pairs) to capture potential differences associated with spatial location. MRBP is a variation of the more widely used multi-response permutation procedures (MRPP) and allowed us to incorporate our paired sample design in analysis. We tested for differences in within- and between-group heterogeneity (agreement) between the two treatments using squared-Euclidian dissimilarity matrix with 9999 permutations. MRBP tests were performed using PC-ORD 5 [43]. ANOSIM does not allow for blocking based on sampling structure but does support the use of more ecologically meaningful distance metrics for the construction of a dissimilarity matrix. A Jaccard dissimilarity matrix derived from the abundance of different species within each sample point was used to rank similarities between our sample points. We tested these ranks against a null-distribution model derived from 99,999 permutations of the Jaccard dissimilarity matrix to assess the statistical significance of these rankings. Tests were conducted using the Vegan package [40]. The Jaccard index was used because it is a metric index that is rank-order similar [40].
We tested for a difference in lodgepole pine regeneration, with and without seedlings observed after the fire that were likely planted, as well as the relative biomass of grasses, shrubs, and forbs between the LOGGED and UNLOGGED treatments using paired t-tests with “fdr” adjustments for multiple comparisons [42].

2.3.3. Indicator Species Analysis

We explored differences in community membership between the LOGGED and UNLOGGED treatments using indicator species analysis (ISA). ISA links species to specific treatments or environmental conditions based on their abundance in certain sites. We used ISA to generate two statistics: species indicator value and a coefficient of association (Pearson’s phi coefficient of association). Indicator value indices are used to assess whether or not the presence of a species is a good predictor of a prevailing site condition. The indices can be decomposed to get an estimate of the positive predictive value of the species (component A): the probability that the point belongs to a certain group if the species is found. The second component (component B) is the fidelity of the species: the probability that the species will be found within a point belonging to a given group [44,45]. In contrast, Pearson’s phi coefficient of association (correlation) is used to assess the preference of species for particular points among a set of a priori points or treatments [45,46]. We performed indicator species analyses on the species in the LOGGED and UNLOGGED treatments in the EAST and WEST sample sites as well as globally. The tests were done using the “indicspecies” package in R [45]. Both the indicator value and Pearson’s phi coefficient were calculated for all species and were tested with Monte Carlo permutation tests using 9999 randomizations.

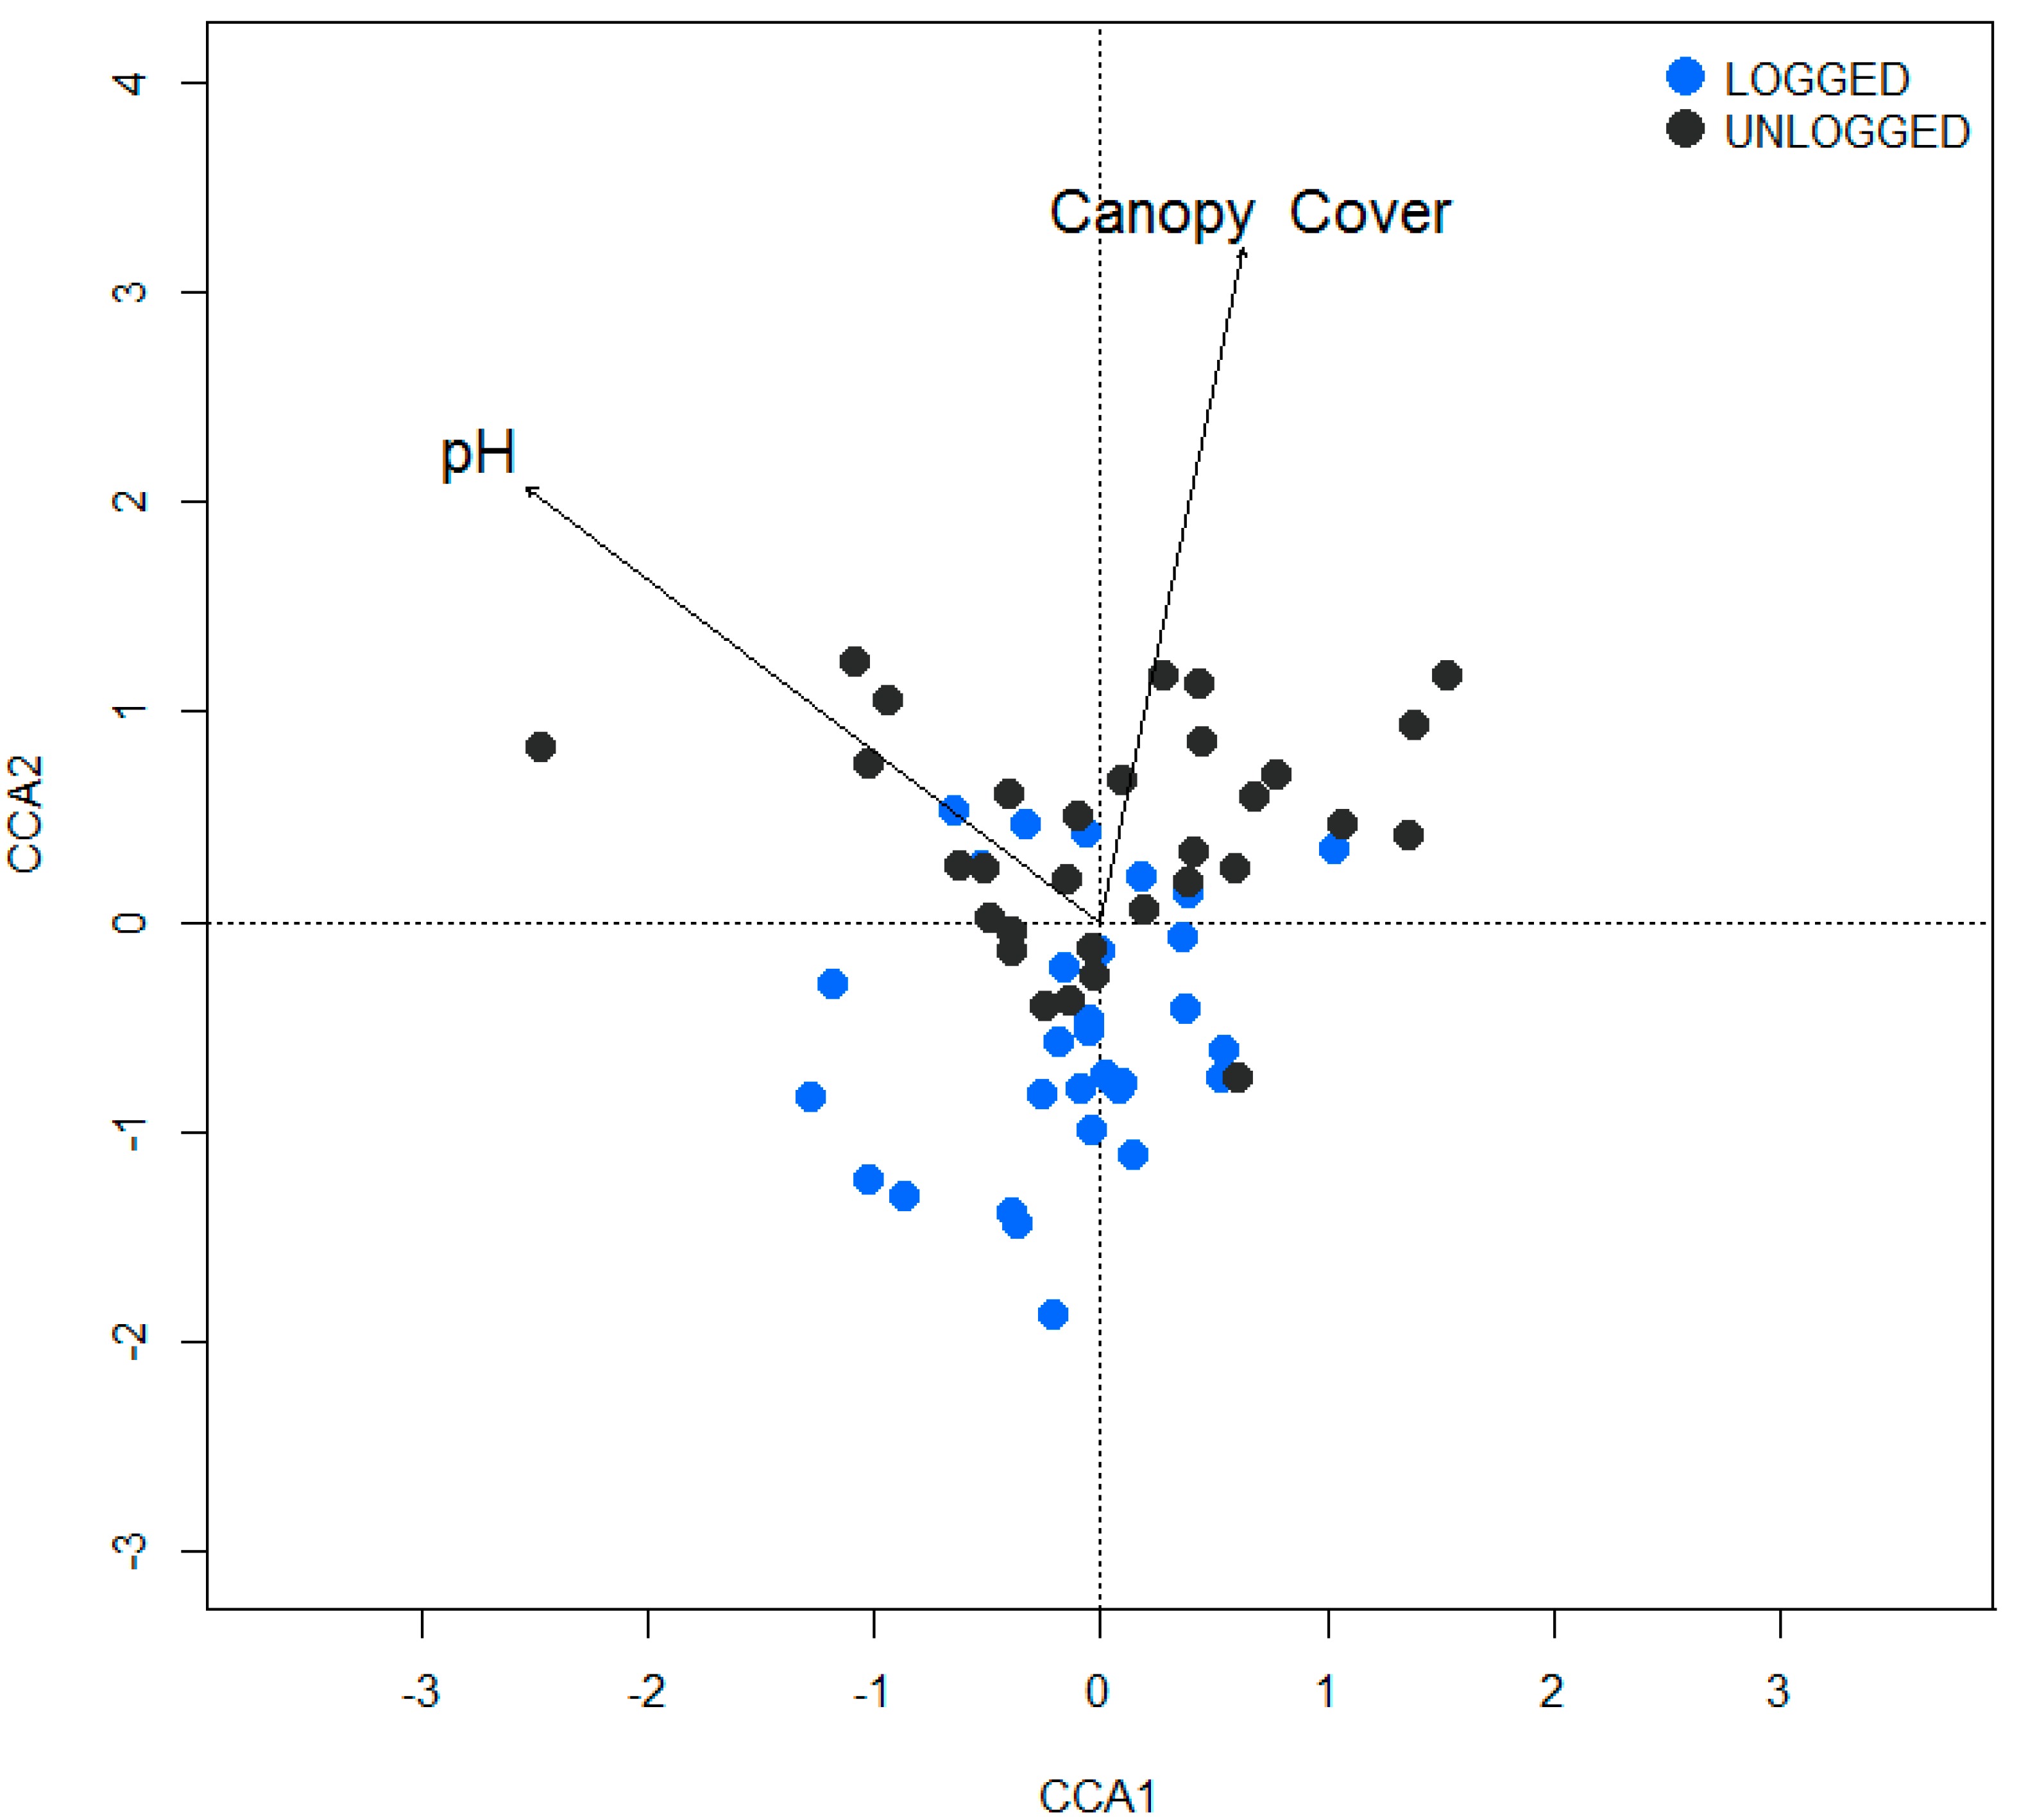
2.3.4. Canonical Correspondence Analysis

We used canonical correspondence analysis (CCA) to visualize and test the differences in community composition among sample points and their relation to the environmental variables that were measured. CCA does not allow for paired sample designs so sample points were treated as independent. We applied a forward selection method, beginning with an intercept-only model, to inform our choices for variables that would be used to constrain the final model. The significance of the final suite of constraints was determined using an ANOVA-like permutation test (function “anova.cca” in the ‘Vegan’ package for R) with 9999 permutations. CCA gives relatively high weight to species with low total abundance and so emphasizes the distinctiveness of samples that contain several rare species [47,48,49]. The CCA was performed using the “Vegan” package in R [40] using Bray-Curtis dissimilarity matrices, which are semimetric, as recommended by Oksanen et al. [40] with scaling 3 and 9999 permutations.

2.3.5. Trait Analyses

We looked for differences in morphological traits between our LOGGED and UNLOGGED treatments that may correspond to a response by the individuals of the species to their local microclimates. We performed comparisons of the height, length, width, and leaf area of all species that were found in >50% of the sample points in our study as well as any species that were identified as indicator species and were found in both treatments. Analyses were done globally, and not separated into EAST and WEST sites because we were comparing within species and had no reason to expect differences between the sites. The traits were tested using unpaired Welch two sample t-tests whereas biomass was tested using paired t-tests. All p-values were corrected using the “fdr” method [42] to control for multiple comparisons.

3. Results

3.1. Community Richness, Diversity, and Evenness

We observed 42 plant species, or species groups, and eight of these were found in >50% of all sample points. Two species, Chamerion angustifolium var. angustifolium (L.) Holub (fireweed) and Ceratodon purpureus Hedw. Brid. (fire moss), were found in >75% of the points. Seven vascular species were found in >50% of the sample points in the LOGGED treatments and seven in the UNLOGGED treatment (Table 1). There was no statistical difference in species richness (t = 0.683, df = 30, p = 0.499), species diversity (t = −1.187, df = 30, p = 0.244), or species evenness (t = −1.439, df = 30, p = 0.161) between the LOGGED and the UNLOGGED treatments at either the EAST or the WEST sites or globally. Species diversity (t = −2.6786, df = 59.666, p-value = 0.001) and evenness (t = −2.0758, df = 59.919, p-value = 0.04221) differed between the EAST and the WEST sample sites, though species richness (t = −1.5322, df = 55.367, p-value = 0.1312) did not.

3.2. Community Composition

ANOSIM results confirmed differences in community composition between the EAST and the WEST sites (R = 0.193, p < 0.001, permutations = 99,999). Plant species composition differed between the LOGGED and UNLOGGED treatments in the EAST and the WEST sites as well as globally. Within-group agreement values (A) for the MRBP tests were positive and significant for both the EAST (T = −2.149, A = 0.023, p = 0.032) and WEST (T = −4.142, A = 0.039, p = 0.002) sample sites and globally (T = −3.973, A = 0.007, p < 0.001). ANOSIM results confirmed the outcomes for the EAST (R = 0.114, p = 0.021, permutations = 99,999) and WEST (R = 0.135, p = 0.003, permutations = 99,999) sites and globally (R = 0.097, p < 0.001, permutations = 99,999). Both analyses detected a weaker effect size when analyzing the global dataset than the EAST and the WEST sites individually. There was more natural lodgepole pine regeneration in the UNLOGGED sites (mean = 10.62) than in the LOGGED sites (mean = 3.00) (t = −4.038, df = 31, p < 0.001) and this difference persisted when planted seedlings were included (t = −3.507, df = 31, p = 0.001).
The biomass of grasses and forbs did not differ significantly between the two treatments but shrub biomass was greater in the UNLOGGED treatment than in the LOGGED treatment (Table 2).

3.3. Indicator Species Analysis

We detected a total of seven indicator species and nine species that were strongly correlated with either the LOGGED or UNLOGGED treatment using ISA. Most of the species identified had high indicator values but demonstrated low site fidelity (Table 3). The forb Petasites frigidus var. vitifolius Greene Cherne (sweet coltsfoot), an indicator species for the LOGGED treatment, was the only species identified as an indicator species in both the EAST and the WEST sample sites as well as globally. We also found three species that were strongly correlated with the UNLOGGED treatment, though were not identified as indicator species (Table 3). Of these, the shrub Vaccinium membranaceum Douglas ex Torr. (black huckleberry) was consistently found to be strongly correlated with the UNLOGGED treatment.

3.4. Canonical Correspondence Analysis

There was a noticeable difference in community composition between the LOGGED and UNLOGGED treatments as visualized by the CCA ordination (Figure 2). The clustering of points within treatments and the separation between treatments was most readily seen in the global analysis (Figure 2) though similar patterns were present in the EAST and WEST (Figure S1) sites. The final CCA models consisted of soil pH (CaCl2) and canopy cover in descending order of importance. When tested individually within the ANOVA using permutation tests, soil pH (F = 2.294, df = 1, p = 0.012) and canopy cover (F = 1.745, df = 1, p = 0.043) were the only environmental factors that were statistically significant at the p = 0.05 level. The final CCA ordinations of environmental constraints were significant for both the EAST (pseudo-F = 1.759, df = 27, p = 0.009, permutations = 9999) and the WEST (pseudo-F = 1.613, df = 29, p = 0.043, permutations = 9999) study sites as well as globally (pseudo-F = 2.127, df = 59, p = 0.004, permutations = 9999). The first and second axes explained 7.7% and 6.7% of the variation, respectively, in the EAST site, 11.3% and 3.2% of the variation in the WEST site, and 7.1% and 4.8% of the variation globally.

3.5. Trait Differences

Most species did not differ in terms of their height, length, width, and leaf area between the LOGGED and UNLOGGED treatments. Of the five most frequently observed species in our study, only Chamerion angustifolium (fireweed) and Spiraea betulifolia Pall. (birchleaf spirea) differed in stature with both species exhibiting smaller values of height, length, width, and leaf area in the LOGGED versus UNLOGGED treatment (Table 4). The indicator species did not differ in stature between the LOGGED and UNLOGGED treatments.

4. Discussion

The composition of early seral plant communities growing in burned landscapes differs according to whether or not the area was harvested prior to the fire. Our comparison of the LOGGED (forest harvest + fire) and UNLOGGED treatments (no harvest + fire) illustrates subtle differences in the taxonomic composition of ground-layer plant communities, primarily driven by a small number of indicator species that showed high predictive value but were not consistently detected across the sample points. The composition of these post-fire communities is correlated with variation in the environment, including canopy cover and soil pH. We also found differences in trait values displayed by C. angustifolium and S. betulifolia between the two treatments, suggesting environmental differences between LOGGED and UNLOGGED sites are sufficient to elicit differences in the growth of at least some species in these communities. These differences were consistent between the EAST and WEST study sites despite differences in community composition between the two sites. Although severe fire events may “reset” a landscape, the legacy from previous disturbances, such as logging, appears to exert enough of an effect to influence community assembly and composition early in post-fire succession.
Communities in the LOGGED and UNLOGGED treatments shared many of the more common and abundant species but were distinguished by a suite of less common indicator species. Two species, C. angustifolium (fireweed) and C. purpureus (fire moss), were the most dominant species in terms of cover and abundance in all sample points across all combination of sample sites and disturbance history, and comprised an average of 37% and 24%, respectively, of the total abundance recorded at each sample point. Fireweed and fire moss are globally distributed species that are strongly associated with early establishment in fire-prone environments [50,51]. Of the 42 species that were observed, six were identified as indicator species. In general, the LOGGED treatment appeared to be distinguished by hardy, aggressive species that thrive in heavily disturbed landscapes. For example, Petasites frigidus does well on gravelly slopes and roadsides [52] and Rubus idaeus L. has been noted as being especially common after burnings, clearings, and other disturbances [53]. Similarly, Taraxacum officinale F.H. Wigg. and a number of species of Hieracium are known to thrive in areas with extensive anthropogenic disturbance [54,55,56]. Species that were correlated with the UNLOGGED treatment were more varied in their environmental associations but tend to be forest-understory-associated species. Some are associated with more moderate site conditions; for example, Vaccinium membranaceum generally prefers moist, acidic soil conditions [57] and Cornus canadensis L. does well under cooler soil conditions [58]. In contrast, C. angustifolium and Arnica cordifolia Hook. are known to tolerate and do well in a broad range of site conditions [59,60,61] but may be less adapted for more extreme conditions. Despite broad similarities in species pools among treatments, disturbance history appears to favor the success of certain species over others, leading to discernible differences in community composition. We also detected greater lodgepole pine regeneration in the UNLOGGED treatment than in the LOGGED treatment. This is unsurprising and likely due to the removal of lodgepole pine’s aerial seed bank through harvesting in the LOGGED sites.
There was a consistent tendency for the sample points in the LOGGED treatment to separate from the UNLOGGED treatment in our CCA ordination. Soil pH had a significant influence on the composition of the plant communities in our study, though interestingly, there was not a significant difference in soil pH between our LOGGED and UNLOGGED sites (Table S1). Soil pH can be linked to overall soil nutrient conditions [62] and strongly influence plant community composition and diversity [63,64]. This influence on community composition does not correspond directly to logging history in our study because logging does not normally alter soil pH levels. Logging history may have indirectly affected soil pH, however, if it had affected fire behavior. The primary environmental driver visually distinguishing the two treatments was canopy cover, which in this case broadly describes the presence and influence of standing dead trees. Though not biologically active themselves, these legacies (i.e. stands of dead trees) can influence their local microclimates by altering light availability [3], mitigating wind exposure [65], and delaying soil drying [66,67]. The standing dead trees in our sample sites may provide more moderate microclimates for early seral plants by providing some measure of shade and by buffering wind.
The species richness, diversity, and evenness of the early seral communities did not differ between our LOGGED and UNLOGGED treatments. Similar results have been reported in studies of fire in the boreal forest of central and eastern North America [19,68] where it was the abundance of different species in the study that differed between treatments, such as different levels of fire severity [68] or different combinations of fire and logging [19]. Overall species richness and diversity in our study area may be more closely linked to broader influences such as the proximity to unburned areas, differences in environmental conditions such as light or moisture availability, or the degree of human activity on nearby logging roads than to more local constraints such as competition or resource availability. Communities that establish early on in succession are derived from a combination of surviving seeds from soil or aerial seedbanks (seeders) or root structures (resprouters) within the community and seed input from outside sources [69]. However, the ability for a number of generalists to thrive in both treatments means that these influences are likely to affect both the LOGGED and UNLOGGED treatments in similar ways resulting in overall similar suites of species establishing and, by extension, similarities in aggregate indices. Sample points that are closer together spatially are also expected to experience similar environmental conditions and to share propagule sources so that the spatial proximity of our paired points likely contributes to their broad similarities in aggregate community indices or in community composition.
The differences in environmental conditions between the treatments may promote variation in the morphological traits of species between the treatments that can be especially apparent if the species respond plastically to their environment. Of the five most common species in our study, two species, C. angustifolium and S. betulifolia, were both generally larger in the UNLOGGED treatment than in the LOGGED. The differences in size could be due to the species being better adapted for one treatment over the other but this is unlikely given the high abundance of both species in both LOGGED and UNLOGGED sites. We propose that C. angustifolium and S. betulifolia are instead exhibiting a plastic response to the two treatments which would suggest the optimal mean trait values for these species are different for the LOGGED and UNLOGGED treatments, with lower amounts of light in the UNLOGGED, driven by standing snags and canopy cover, resulting in increased plant height, width, length, and leaf area. This pattern of increased plant size in the UNLOGGED sites was consistent among all of the most common species that were not indicator species, though not significantly so. At the same time, however, many species found in both treatments that show low variability in their morphological traits appear to be successful in both treatments. This would suggest that environmental pressures are not strongly acting on these species or that these successful and abundant species are insensitive to the level of variation in environmental variables between the treatments. At this stage of recovery, the outcomes of the Binta fire were the most prominent effects driving individual species response. The communities were generally sparsely occupied at the time of study, but environmental pressures and competition may become a greater influence over time if species that can make better use of certain site conditions become more prominent. If competition becomes a stronger influence as succession progresses then species with more advantageous morphological trait values may become more dominant, resulting in greater divergence in trait values (and composition) between communities with different disturbance histories. If, however, competition does not become a strong driving force in these communities then we may expect to see convergence in the two treatments as species distribute themselves freely between the LOGGED and UNLOGGED sites. In either case, any effects of disturbance history may only become apparent after the communities have sufficiently recovered from the most recent disturbance.
We found that shrub biomass was greater in communities that were not harvested prior to being burned. Previous work on the effects of forest harvest on understory communities has shown that shrubs tend to become as abundant or more abundant shortly after harvest than they were prior to harvest [5,70,71]. While we don’t know whether shrubs differed in abundance between our treatments before fire, our work suggests that the combination of harvesting plus fire in quick succession has a compounding negative effect on shrub recovery.
The mountain pine beetle outbreak that swept across British Columbia prior to the Binta fire resulted in 90% adult lodgepole pine mortality in our study region, and has created a landscape of standing dead trees. There are few direct impacts of mountain pine beetle on non-target organisms and as such, the effects of mountain pine beetle infestation on forest floor community composition are expected to act indirectly. Ground-layer vegetation remains intact and in some cases certain species may do better, in terms of increased size or abundance, in light of the increase in available resources [72,73]. Previous research in mountain pine beetle affected forests suggests that this increased light availability can enable the increased abundance of some well adapted ground layer plant species, but otherwise has there are few changes in community composition in terms of species presence or absence [33]. This means that the mountain pine beetle outbreak could have appreciably influenced the ground-layer communities in our study prior to the Binta fire, thereby altering response to future disturbance. Based on what we have seen of the effects of logging history, we expect that any effects of the mountain pine beetle outbreak on future disturbance outcomes would be similarly nuanced.
Our work in this region three years after the Binta fire suggests that disturbance history can have discernable effects on species membership and traits in early seral communities; it is interesting to consider the possibility of differences persisting over time. This early divergence in composition may lead to persistent differences between communities with different disturbance histories if it becomes stable or self-perpetuating (see alternative stable states [74,75,76]). Differences in community composition can affect higher trophic levels if important fruit-bearing plants, such as Vaccinium or Rubus, experience shifts in abundance at broader scales due to the steady increase in logged + burned areas and the resulting increase in opportunity for plant communities to experience short-interval disturbances. The decrease in natural lodgepole pine regeneration in the LOGGED sites relative to UNLOGGED sites may also lead to shifts in ground-layer community composition, if only because reduced seedling density potentially leaves more space for other species to establish. In BC’s lodgepole pine forests, broadcast burning has been used in the past for site preparation to maximize the recruitment of merchantable timber species following forest harvest, with the assumption that it mimics the natural fire disturbance regime of the system [77,78]. While we fully support the use of fire for landscape management, our work highlights that the effects of harvest persists through fire, leaving a fingerprint on ground-layer plant communities that differs from what we would expect from fire alone. Further work is needed to better understand the effects of disturbance history and potential compounding effects on forest community development, structure, and function in lodgepole pine ecosystems.

Supplementary Materials

The following are available online at https://www.mdpi.com/1999-4907/7/5/109/s1, Figure S1: East and West site CCA ordination plots; Table S1: Comparisons of environmental variables between LOGGED and UNLOGGED sites.

Acknowledgments

We would like to thank Kathy Ma and Katie Goodwin for their assistance in collecting data for this project. We would also like to extend our gratitude to Elizabeth Elle and Sybille Haeussler for their comments and suggestions during the writing process. This project received funding from Simon Fraser University, the Pacific Institute for Climate Solutions graduate fellowship to Michael Ton, and The Natural Sciences and Engineering Research Council of Canada (DG 418376 to MAK).

Author Contributions

Michael Ton and Meg Krawchuk conceived of and designed the study; Michael Ton performed the study, analyzed the data, and wrote the paper; Meg Krawchuk contributed substantially to the interpretation of the results and to writing the paper.

Conflicts of Interest

The authors declare no conflict of interest. The funding sponsors had no role in the design of the study; in the collection, analyses, or interpretation of data; in the writing of the manuscript, and in the decision to publish the results.

Abbreviations

The following abbreviations are used in this manuscript:
ANOSIMAnalysis of similarity
ANOVAAnalysis of variance
BCBritish Columbia
CCACanonical correspondence analysis
dNBRDifference in normalized burn ratio
GISGeographic information system
MFLNROMinistry of Forest, Lands and Natural Resource Operations
MRBPBlocked multi-response permutation procedure
MRPPMulti-response permutation procedure

Appendix A

A list of all species included in the paper with authority names.
Abies lasiocarpa Hook. Nutt
Arnica cordifolia Hook.
Aster foliaceus Lindl. ex DC.
Ceratodon purpureus Hedw. Brid.
Chamerion angustifolium var. angustifolium (L.) Holub
Cornus canadensis L.
Dendroctonus ponderosae Hopkins
Hieracium gracile Hook.
Petasites frigidus var. vitifolius Greene Cherne
Picea glauca Moench Voss × engelmannii Parry ex Engelm.
Pinus contorta var. latifolia Engelm. ex S. Watson
Polytrichum juniperinum Hedw.
Populus tremuloides Michx.
Rosa acicularis Lindl.
Rubus idaeus L.
Spiraea betulifolia Pall.
Taraxacum officinale F.H. Wigg.
Vaccinium membranaceum Douglas ex Torr.

References

  1. Clark, D.F.; Antos, J.A.; Bradfield, G.E. Succession in sub-boreal forests of West-Central British Columbia. J. Veg. Sci. 2003, 14, 721–732. [Google Scholar] [CrossRef]
  2. De Grandpre, L.; Gagnon, D.; Bergeron, Y. Changes in the Understory of Canadian Southern Boreal Forest after Fire. J. Veg. Sci. 1993, 4, 803–810. [Google Scholar] [CrossRef]
  3. Hart, S.; Chen, H. Fire, logging, and overstory affect understory abundance, diversity, and composition in boreal forest. Ecol. Monogr. 2008, 78, 123–140. [Google Scholar] [CrossRef]
  4. Selmants, P.C.; Knight, D.H. Understory plant species composition 30–50 years after clearcutting in southeastern Wyoming coniferous forests. For. Ecol. Manag. 2003, 185, 275–289. [Google Scholar] [CrossRef]
  5. Kurulok, S.E.; Macdonald, S.E. Impacts of postfire salvage logging on understory plant communities of the boreal mixedwood forest 2 and 34 years after disturbance. Can. J. For. Res. 2007, 37, 2637–2651. [Google Scholar] [CrossRef]
  6. Key, C.H.; Benson, N.C. Landscape Assessment (LA) Sampling and Analysis Methods; USDA Forest Service: Odgen, UT, USA, 2006.
  7. Cuddington, K. Legacy Effects: The Persistent Impact of Ecological Interactions. Biol. Theory 2012, 6, 203–210. [Google Scholar] [CrossRef]
  8. Macadam, A.M. Effects of broadcast slash burning on fuels and soil chemical properties in the Sub-boreal Spruce Zone of central British Columbia. Can. J. For. Res. 1987, 17, 1577–1584. [Google Scholar] [CrossRef]
  9. Arocena, J.M.; Opio, C. Prescribed fire-induced changes in properties of sub-boreal forest soils. Geoderma 2003, 113, 1–16. [Google Scholar] [CrossRef]
  10. Knicker, H. How does fire affect the nature and stability of soil organic nitrogen and carbon? A review. Biogeochemistry 2007, 85, 91–118. [Google Scholar] [CrossRef]
  11. Huffman, E.L.; MacDonald, L.H.; Stednick, J.D. Strength and persistence of fire-induced soil hydrophobicity under ponderosa and lodgepole pine, Colorado Front Range. Hydrol. Processes 2001, 15, 2877–2892. [Google Scholar] [CrossRef]
  12. Reich, P.B.; Bakken, P.; Carlson, D.; Frelich, L.E.; Friedman, S.K.; Grigal, D.F. Influence of Logging, Fire, and Forest Type on Biodiversity and Productivity in Southern Boreal Forests. Ecology 2001, 82, 2731–2748. [Google Scholar] [CrossRef]
  13. Rees, D.C.; Juday, G.P. Plant species diversity on logged versus burned sites in central Alaska. For. Ecol. Manag. 2002, 155, 291–302. [Google Scholar] [CrossRef]
  14. Mannerkoski, H.; Finér, L.; Piirainen, S.; Starr, M. Effect of clear-cutting and site preparation on the level and quality of groundwater in some headwater catchments in eastern Finland. For. Ecol. Manag. 2005, 220, 107–117. [Google Scholar] [CrossRef]
  15. Piirainen, S.; Finér, L.; Mannerkoski, H.; Starr, M. Carbon, nitrogen and phosphorus leaching after site preparation at a boreal forest clear-cut area. For. Ecol. Manag. 2007, 243, 10–18. [Google Scholar] [CrossRef]
  16. Paine, R.; Tegner, M.; Johnson, E. Compounded perturbations yield ecological surprises. Ecosystems 1998, 1, 535–545. [Google Scholar] [CrossRef]
  17. Buma, B.; Wessman, C.A. Disturbance interactions can impact resilience mechanisms of forests. Ecosphere 2011, 2, 1–13. [Google Scholar] [CrossRef]
  18. Harvey, B.J.; Donato, D.C.; Romme, W.H.; Turner, M.G. Influence of recent bark beetle outbreak on fire severity and postfire tree regeneration in montane Douglas-fir forests. Ecology 2013, 94, 2475–2486. [Google Scholar] [CrossRef] [PubMed]
  19. Pidgen, K.; Mallik, A.U. Ecology of Compounding Disturbances: The Effects of Prescribed Burning After Clearcutting. Ecosystems 2013, 16, 170–181. [Google Scholar] [CrossRef]
  20. Diaz, S.; Cabido, M. Vive la difference: Plant functional diversity matters to ecosystem processes. Trends Ecol. Evol. 2001, 16, 646–655. [Google Scholar] [CrossRef]
  21. Diaz, S.; Cabido, M.; Casanoves, F. Plant functional traits and environmental filters at a regional scale. J. Veg. Sci. 1998, 9, 113–122. [Google Scholar] [CrossRef]
  22. Keddy, P.A. Assembly and response rules: Two goals for predictive community ecology. J. Veg. Sci. 1992, 3, 157–164. [Google Scholar] [CrossRef]
  23. Decocq, G.; Aubert, M.; Dupont, F.; Alard, D.; Saguez, R.; Wattez-Franger, A.; De Foucault, B.; Delelis-Dusollier, A.; Bardat, J. Plant diversity in a managed temperate deciduous forest: Understorey response to two silvicultural systems. J. Appl. Ecol. 2004, 41, 1065–1079. [Google Scholar] [CrossRef]
  24. Lachance, É.; Pothier, D.; Bouchard, M. Forest Structure and Understory Plant Communities Inside and Outside Tree Retention Groups in Boreal Forests. Ecoscience 2013, 20, 252–263. [Google Scholar] [CrossRef]
  25. Donato, D.C.; Fontaine, J.B.; Robinson, W.D.; Kauffman, J.B.; Law, B.E. Vegetation response to a short interval between high-severity wildfires in a mixed-evergreen forest. J. Ecol. 2009, 97, 142–154. [Google Scholar] [CrossRef]
  26. Delitti, W.; Ferran, A.; Trabaud, L.; Vallejo, V.R. Effects of fire recurrence in Quercus coccifera L. shrublands of the Valencia Region (Spain): I. plant composition and productivity. Plant Ecol. 2005, 177, 57–70. [Google Scholar] [CrossRef]
  27. Pojar, J.; Klinka, K.; Meidinger, D.V. Biogeoclimatic ecosystem classification in British Columbia. For. Ecol. Manag. 1987, 22, 119–154. [Google Scholar] [CrossRef]
  28. Picketts, I.M.; Werner, A.T.; Murdock, T.Q. Climate Change in Prince George: Summary of Past Trends and Future Projections; University of Northern British Columbia: Prince George, BC, Canada, 2009. [Google Scholar]
  29. Reynolds, G. Climatic Data Summaries for the Biogeoclimatic Zones of British Columbia; Ministry of Forests Research Branch: Victoria, BC, Canada, 1989; (unpublished report).
  30. BC Ministry of Forests, Lands and Natural Resource Operations. Summary of Previous Fire Seasons: 2010 Fire Season. Available online: http://bcwildfire.ca/History/SummaryArchive.htm#2010 (accessed on 1 April 2014).
  31. DeLong, C.; Tanner, D.; Jull, M.J. A Field Guide for Site Identification and Interpretation for the Northern Rockies Portion of the Prince George Forest Region: Land Management Handbook; No. 29; Ministry of Forests: Victoria, BC, Canada, 1993.
  32. BC Ministry of Forests, Lands and Natural Resource Operations. Mid-Term Timber Supply: Prince George Timber Supply Area; Ministry of Forests, Lands and Natural Resource Operations: Prince George, BC, Canada, 2012.
  33. Edwards, M.; Krawchuk, M.A.; Burton, P.J. Short-interval disturbance in lodgepole pine forests, British Columbia, Canada: Understory and overstory response to mountain pine beetle and fire. For. Ecol. Manag. 2015, 338, 163–175. [Google Scholar] [CrossRef]
  34. BC Ministry of Forests, Lands and Natural Resource Operations. Vegetation Resource Inventory; Ministry of Forests, Lands and Natural Resource Operations: Victoria, BC, Canada, 2013.
  35. Walton, A. Provincial-Level Projection of the Current Mountain Pine Beetle Outbreak: Update of the Infestation Projection Based on the Provincial Aerial Overview Surveys of Forest Health Conducted from 1999 through 2012 and the BCMPB Model (Year 10); BC Forest Service: Powell River, BC, Canada, 2013. [Google Scholar]
  36. Harris, C.; (BC Ministry of Forests, Lands and Natural Resource Operations, Victoria, BC, Canada). Personal communication, 2015.
  37. Cornelissen, J.H.C.; Lavorel, S.; Garnier, E.; Díaz, S.; Buchmann, N.; Gurvich, D.E.; Reich, P.B.; ter Steege, H.; Morgan, H.D.; Heijden, M.G.A.; et al. A handbook of protocols for standardised and easy measurement of plant functional traits worldwide. Aust. J. Bot. 2003, 51, 335–380. [Google Scholar] [CrossRef]
  38. Schneider, C.A.; Rasband, W.S.; Eliceiri, K.W. NIH Image to ImageJ: 25 years of image analysis. Nat. Methods 2012, 9, 671–675. [Google Scholar] [CrossRef] [PubMed]
  39. Murray, D. Measuring pH in Water or CaCl2 Using a pH Meter; SFU Geography: Burnaby, BC, Canada, 2011. [Google Scholar]
  40. Vegan: Community Ecology Package, version 2.2-1; 2015; Available online: https://cran.r-project.org/web/packages/vegan/ (accessed on 12 January 2015).
  41. R: A Language and Environment for Statistical Computing, version 3.1.1; 2014; Available online: https://cran.r-project.org (accessed on 10 July 2014).
  42. Benjamini, Y.; Hochberg, Y. Controlling the False Discovery Rate—A Practical and Powerful Approach. J. R. Stat. Soc. Ser. B-Methodol. 1995, 57, 289–300. [Google Scholar]
  43. PC-ORD: Multivariate Analysis of Ecological Data, version 5; MjM Software Design: Glaneden Beach, OR, USA, 2011.
  44. Dufrene, M.; Legendre, P. Species assemblages and indicator species: The need for a flexible asymmetrical approach. Ecol. Monogr. 1997, 67, 345–366. [Google Scholar] [CrossRef]
  45. De Cáceres, M.; Legendre, P. Associations between species and groups of sites: Indices and statistical inference. Ecology 2009, 90, 3566–3574. [Google Scholar] [CrossRef] [PubMed]
  46. De Cáceres, M.; Font, X.; Oliva, F. Assessing species diagnostic value in large data sets: A comparison between phi-coefficient and Ochiai index. J. Veg. Sci. 2008, 19, 779–788. [Google Scholar] [CrossRef]
  47. McCune, B.; Grace, J.B. Analysis of Ecological Communities, 3rd ed.; MjM Software Design: Glaneden Beach, OR, USA, 2002. [Google Scholar]
  48. Faith, D.P.; Minchin, P.R.; Belbin, L. Compositional dissimilarity as a robust measure of ecological distance. Vegetatio 1987, 69, 57–68. [Google Scholar] [CrossRef]
  49. Minchin, P.R. An evlauation of the relative robustness of techniques for ecoloigcal ordination. Vegetatio 1987, 69, 89–107. [Google Scholar] [CrossRef]
  50. Moss, E. The ecology of Epilobium angustifolium with particular reference to rings of periderm in the wood. Am. J. Bot. 1936, 23, 114–120. [Google Scholar] [CrossRef]
  51. Thomas, P.A.; Proctort, M.C.F.; Maltby, E. The Ecology of Severe Moorland Fire on the North York Moors: Chemical and Physical Constraints on Moss Establishment from Spores. J. Ecol. 1994, 82, 457–474. [Google Scholar] [CrossRef]
  52. Cherniawsky, D.M.; Bayer, R.J. Systematics of North American Petasites (Asteraceae: Senecioneae). III. A taxonomic revision. Can. J. Bot. 1998, 76, 2061–2075. [Google Scholar] [CrossRef]
  53. Favorite, J.; Anderson, M.K. Plant Guide: American Red Raspberrry Rubus idaeus L.; United States Department of Agiculture: Washington, DC, USA, 2003.
  54. Scott, N.A.; Saggar, S.; McIntosh, P.D. Biogeochemical impact of Hieracium invasion in New Zealand’s grazed tussock grasslands: Sustainability implications. Ecol. Appl. 2001, 11, 1311–1322. [Google Scholar] [CrossRef]
  55. Cavieres, L.A.; Quiroz, C.L.; Molina-Montenegro, M.A.; Muñoz, A.A.; Pauchard, A. Nurse effect of the native cushion plant Azorella monantha on the invasive non-native Taraxacum officinale in the high-Andes of central Chile. Perspect. Plant Ecol. Evol. Syst. 2005, 7, 217–226. [Google Scholar] [CrossRef]
  56. Wilson, L.M. Key to Identification of Invasive and Native Hawkweeds (Hieracium spp.) in the Pacific Northwest; Ministry of Forests and Range: Kamloops, BC, Canada, 2007.
  57. Stevens, M.; Anderson, M.K. Plant Guide: Black Huckleberry Vaccinium Membranaceum; United States Department of Agiculture: Washington, DC, USA, 2000.
  58. Wherry, E.T. Temperature relations of the bunchberry, Cornus canadensis L. Ecology 1934, 15, 440–443. [Google Scholar] [CrossRef]
  59. Myerscough, P.J. Epilobium angustifolium L. J. Ecol. 1980, 68, 1047. [Google Scholar] [CrossRef]
  60. Kao, R.H. Origins and widespread distribution of co-existing polyploids in Arnica cordifolia (Asteraceae). Ann. Bot. 2008, 101, 145–152. [Google Scholar] [CrossRef] [PubMed]
  61. Young, D.R.; Smith, W.K. Influence of sunlight on photosynthesis, water relations, and leaf structure in the understory species Arnica cordifolia. Ecology 1980, 61, 1380–1390. [Google Scholar] [CrossRef]
  62. Härdtle, W.; von Oheimb, G.; Friedel, A.; Meyer, H.; Westphal, C. Relationship between pH-values and nutrient availability in forest soils—The consequences for the use of ecograms in forest ecology. Flora 2004, 199, 134–142. [Google Scholar] [CrossRef]
  63. Pearsall, W.H. The pH of natural soils and its ecological significance. J. Soil Sci. 1952, 3, 41–51. [Google Scholar] [CrossRef]
  64. Marage, D.; Gégout, J.C. Importance of soil nutrients in the distribution of forest communities on a large geographical scale. Glob. Ecol. Biogeogr. 2009, 18, 88–97. [Google Scholar] [CrossRef]
  65. Flesch, T.K.; Wilson, J.D. Wind and remnant tree sway in forest cutblocks. Agric. For. Meteorol. 1999, 93, 229–242. [Google Scholar] [CrossRef]
  66. Purdon, M.; Biais, S.; Bergeron, Y. Initial response of understorey vegetation to fire severity and salvage-logging in the southern boreal forest of Québec. Appl. Veg. Sci. 2004, 7, 49–60. [Google Scholar] [CrossRef]
  67. Childs, S.W.; Flint, L.E. Effect of shadecards, shelterwoods, and clearcuts on temperature and moisture environments. For. Ecol. Manag. 1987, 18, 205–217. [Google Scholar] [CrossRef]
  68. Wang, G.G.; Kemball, K.J. Effects of fire severity on early development of understory vegetation. Can. J. For. Res. 2005, 35, 254–262. [Google Scholar] [CrossRef]
  69. Lanta, V.; Lepš, J. How does surrounding vegetation affect the course of succession: A five-year container experiment. J. Veg. Sci. 2009, 20, 686–694. [Google Scholar] [CrossRef]
  70. Quinby, P.A. First-year impacts of shelterwood logging on understory vegetation in an old-growth pine stand in central Ontario, Canada. Environ. Conserv. 2000, 27, 229–241. [Google Scholar] [CrossRef]
  71. Zenner, E.K.; Kabrick, J.M.; Jensen, R.G.; Peck, J.E.; Grabner, J.K. Responses of ground flora to a gradient of harvest intensity in the Missouri Ozarks. For. Ecol. Manag. 2006, 222, 326–334. [Google Scholar] [CrossRef]
  72. Stone, W.E.; Wolfe, M.L. Response of understory vegetation to variable tree mortality following a mountain pine beetle epidemic in lodgepole pine stands in Northern Utah. Vegetatio 1996, 122, 1–12. [Google Scholar] [CrossRef]
  73. Kovacic, D.A.; Dyer, M.I.; Cringan, A.T. Understory biomass in ponderosa pine following mountain pine beetle infestation. For. Ecol. Manag. 1985, 13, 53–67. [Google Scholar] [CrossRef]
  74. Law, R.; Morton, D.R. Alternative Permanent States of Ecological Communities. Ecology 1993, 74, 1347–1361. [Google Scholar] [CrossRef]
  75. Beisner, B.; Haydon, D.; Cuddington, K. Alternative stable states in ecology. Front. Ecol. Environ. 2003, 1, 376–382. [Google Scholar] [CrossRef]
  76. Fukami, T.; Nakajima, M. Community assembly: Alternative stable states or alternative transient states? Ecol. Lett. 2011, 14, 973–984. [Google Scholar] [CrossRef] [PubMed]
  77. Parminter, J. Burning Alternatives Panel: A Review of Fire Ecology, Fire History and Prescribed Burning in Southern British Columbia; Fire Ecologist Protection Branch: Victoria, BC, Canada, 1991. [Google Scholar]
  78. Kranabetter, J.M.; Macadam, A.M. Ten-Year Results from Operational Broadcast Burning Trials in Northwestern British Columbia; Ministry of Forests: Victoria, BC, Canada, 1998.
Figure 1. The Binta fire study area (A) located in central interior British Columbia, Canada. (B) Sample points were collected at two sites, the WEST (C) site with 16 LOGGED points paired with 16 UNLOGGED points; and the EAST (D) site with 15 LOGGED points paired with 15 UNLOGGED.
Forests 07 00109 g001
Figure 2. Biplot results from the canonical correspondence analysis (CCA) of early seral plant community composition. The biplot shows the ordination of all sample points in the LOGGED (blue) and UNLOGGED (black) treatments and was produced using scaling 2.5. The CCA was constrained using soil pH (pH) and canopy cover.
Forests 07 00109 g002
Table 1. Species observed in over 50% of the sample points in the LOGGED and UNLOGGED treatments ordered from most to least common. Frequency observed indicates the number of sample points, out of 31, where the species was found. Abundance indicates the mean abundance as percent coverage of the species among plots within the treatment. See appendix A complete list of species included in the paper with authority names.
LOGGED TreatmentUNLOGGED Treatment
SpeciesFrequency ObservedAbundance (%)SpeciesFrequency ObservedAbundance (%)
Chamerion angustifolium3022.0Chamerion angustifolium3129.2
Ceratodon purpureus2917.6Ceratodon purpureus2918.4
Cornus canadensis230.5Polytrichum juniperinum285.4
Spiraea betulifolia223.8Cornus canadensis251.7
Polytrichum juniperinum203.5Arnica cordifolia243.0
Petasites frigidus162.0Vaccinium membranaceum232.3
Rubus idaeus160.5Spiraea betulifolia225.1
Vaccinium membranaceum160.1Rosa acicularis161.1
Table 2. Results for paired t-tests of mean dried biomass of different growth forms in the LOGGED and UNLOGGED treatments. The column p.adjusted contains the adjusted p-values using the “fdr” method to control for multiple comparisons.
Growth FormMean Biomass (g) LOGGEDMean Biomass (g) UNLOGGEDp-Valuep.adjusted
Grass1.480.730.2420.242
Shrub1.053.500.0000.001
Forb9.0712.560.0990.148
Table 3. Species with significant indicator values.
SiteTreatmentSpeciesABTest Statisticp-ValuePearson’s rp-Value
EASTLOGGEDAster foliaceus1.0000.4000.6320.0170.3840.017
Petasites frigidus1.0000.3330.5770.0460.2040.039
UNLOGGEDVaccinium membranaceum----0.4870.002
Chamerion angustifolium----0.4540.011
WESTLOGGEDPetasites frigidus0.8150.6880.7490.030--
Taraxacum officinale1.0000.3750.6120.0170.3380.019
UNLOGGEDArnica cordifolia0.90990.87500.8920.0100.4350.008
Vaccinium membranaceum0.90310.75000.8230.006--
GlobalLOGGEDRubus idaeus0.8480.5160.6620.048--
Petasites frigidus0.8450.5160.6600.0070.2740.028
Taraxacum officinale0.9000.4840.6600.0020.2400.002
Hieracium gracile1.0000.1940.4400.0240.3270.024
UNLOGGEDVaccinium membranaceum0.9580.7420.8430.0010.360<0.001
Cornus canadensis----0.233<0.050
The indicator value, A, ranges from 0 to 1 with 1 meaning the species is a perfect indicator for that treatment based on the data. The site fidelity, B, indicates the probability that the species will be present if a plot in that treatment were sampled. Pearson’s correlation coefficient, r, can range from −1 to 1 with −1 indicating perfect negative correlation, 0 indicating no correlation, and 1 indicating perfect positive correlation with that treatment. Significant Pearson’s r values indicate species preference for a particular treatment. Only significant indicator values or significant Pearson’s r values are included in this table.
Table 4. Results from t-tests comparing quantitative traits between the LOGGED and UNLOGGED treatments. (A) Shows the results for species that were found in >50% of the sample points, and includes the only indicator species detected in the UNLOGGED treatment, Vaccinium membranaceum; (B) Shows the results for the remaining indicator species (all are indicator species for the LOGGED treatment). Significant p-values for our unpaired t-tests with “fdr” adjustment at the α = 0.05 level are bolded.
SpeciesLOGGED MeanUNLOGGED MeanAdjusted p-Values
Height
(cm)
Length
(cm)
Width
(cm)
Leaf Area
(cm2)
Height
(cm)
Length
(cm)
Width
(cm)
Leaf Area
(cm2)
HeightLengthWidthLeaf Area
AChamerion angustifolium25.315.314.19.640.419.718.414.10.0150.0010.0020.002
Cornus canadensis3.74.33.67.43.74.53.88.40.5050.7190.7190.451
Vaccinium membranaceum5.17.25.41.75.88.96.81.80.5050.3170.2360.719
Spiraea betulifolia15.516.513.24.124.522.317.16.30.0010.0050.0220.003
Arnica cordifolia11.78.35.89.312.110.17.613.40.9760.1330.0950.095
BAster foliaceus21.213.210.911.322.015.313.311.70.9570.1710.3350.829
Petasites frigidus6.514.710.724.55.812.89.918.00.6840.6560.7310.236
Taraxacum officinale12.819.615.138.917.314.37.823.40.4510.6760.0950.440
Rubus idaeus8.012.49.59.68.012.59.29.90.9870.9870.9760.979

