Article

Spatial Variation in Tree Density and Estimated Aboveground Carbon Stocks in Southern Africa

1
International Center for Tropical Agriculture (CIAT), Chitedze Agricultural Research Station, P.O. Box 158, Lilongwe 00265, Malawi
2
5600 Lukanga Rd, Kalundu, Lusaka 10101, Zambia
3
Columbia University, Lamont Campus, 61 Route9W, Lamont Hall, 2G, P.O. Box 1000, Palisades, NY 10964, USA
4
ICRAF West and Central Africa, Sahel Node, BPE 5118 Bamako, Mali
*
Author to whom correspondence should be addressed.
These authors contributed equally to this work.
Forests 2016, 7(3), 57; https://doi.org/10.3390/f7030057
Submission received: 15 December 2015 / Revised: 3 February 2016 / Accepted: 16 February 2016 / Published: 4 March 2016

Abstract

:
Variability in woody plant species, vegetation assemblages and anthropogenic activities derails the efforts to have common approaches for estimating biomass and carbon stocks in Africa. In order to suggest management options, it is important to understand the vegetation dynamics and the major drivers governing the observed conditions. This study uses data from 29 sentinel landscapes (4640 plots) across the southern Africa. We used T-Square distance method to sample trees. Allometric models were used to estimate aboveground tree biomass from which aboveground biomass carbon stock (AGBCS) was derived for each site. Results show average tree density of 502 trees·ha−1 with semi-arid areas having the highest (682 trees·ha−1) and arid regions the lowest (393 trees·ha−1). The overall AGBCS was 56.4 Mg·ha−1. However, significant site to site variability existed across the region. Over 60 fold differences were noted between the lowest AGBCS (2.2 Mg·ha−1) in the Musungwa plains of Zambia and the highest (138.1 Mg·ha−1) in the scrublands of Kenilworth in Zimbabwe. Semi-arid and humid sites had higher carbon stocks than sites in sub-humid and arid regions. Anthropogenic activities also influenced the observed carbon stocks. Repeated measurements would reveal future trends in tree cover and carbon stocks across different systems.

1. Introduction

Woody plants in forests, croplands and rangelands of southern Africa play crucial socio-economic and ecological functions [1,2]. In addition to being a larger pool of terrestrial carbon sink, biomass is the chief source of energy for more than 80% of the population and replenishes soil fertility in traditional farming systems [3]. However, the functions of tree and plants are challenged due to various natural and anthropogenic disturbances. In addition to ecological limits, woody biomass stocks vary across landscapes as a result of land cover and land use changes associated with anthropogenic activities [4,5]. In order to suggest management options, it is important to understand the biomass and carbon stock dynamics and the major drivers governing the observed condition.
Different approaches have been used to estimate carbon stock and understand drivers of biomass distribution and extraction [6,7,8]. The T-square method, as used in ecological surveys and lately in health, is more robust in estimating populations [9,10]. The errors associated with sample size and topographic differences can be resolved by estimating distribution and density at larger landscape/stand level [6]. The recent approach of using sentinel sites, which are representative landscapes geo-referenced for spatial and temporal change detection facilitate baseline analysis and monitoring [11,12]. Sentinel landscapes are designed to have hierarchical organization so that variability within and between different spatial scales can be assessed [12,13].
The appropriate approach to estimate aboveground biomass and derive associated aboveground biomass carbon stock (AGBCS) is through on-site destructive sampling, which is not only time-consuming but also not suitable for diverse tropical systems and wide geographical areas [14]. In situations where destructive sampling is not feasible, it may be possible to use allometric equations developed for similar site and environmental conditions to estimate AGBCS [7,14,15]. At present, there are several equations developed using data from similar/same ecoregions at stand, forest, national, eco-regional and global levels. The use of inventory data at national and regional scale is, however, challenging due to unjustified selection of appropriate biomass estimation or allometric equations [6]. It is thus paramount to select equations that are developed for and based on similar ecological conditions and tree stands. Through the use of Akaike information criteria (AIC) and Root Mean Square Error (RMSE), it will be possible to evaluate the explanatory power of the equations selected and decide whether they can be a good approximation to the area of interest [15].
The objective of this study was therefore to build an approach and construct a baseline for estimating tree density and carbon stocks across different sites and eco-zones of Southern Africa. The specific objectives are to (1) adapt distance methods for unbiased estimation of tree density at landscape level, (2) estimate aboveground biomass and carbon stocks for plots and sentinel sites using models selected by information criteria, and (3) determine variability in tree density, measured height and diameter, and estimated biomass carbon stocks within and across sentinel sites. Understanding spatial variability of carbon stock across land use and eco-zones can play a crucial role in the design of management strategies. This can also facilitate “carbon-saving” credit schemes and provide necessary incentives.

2. Materials and Methods

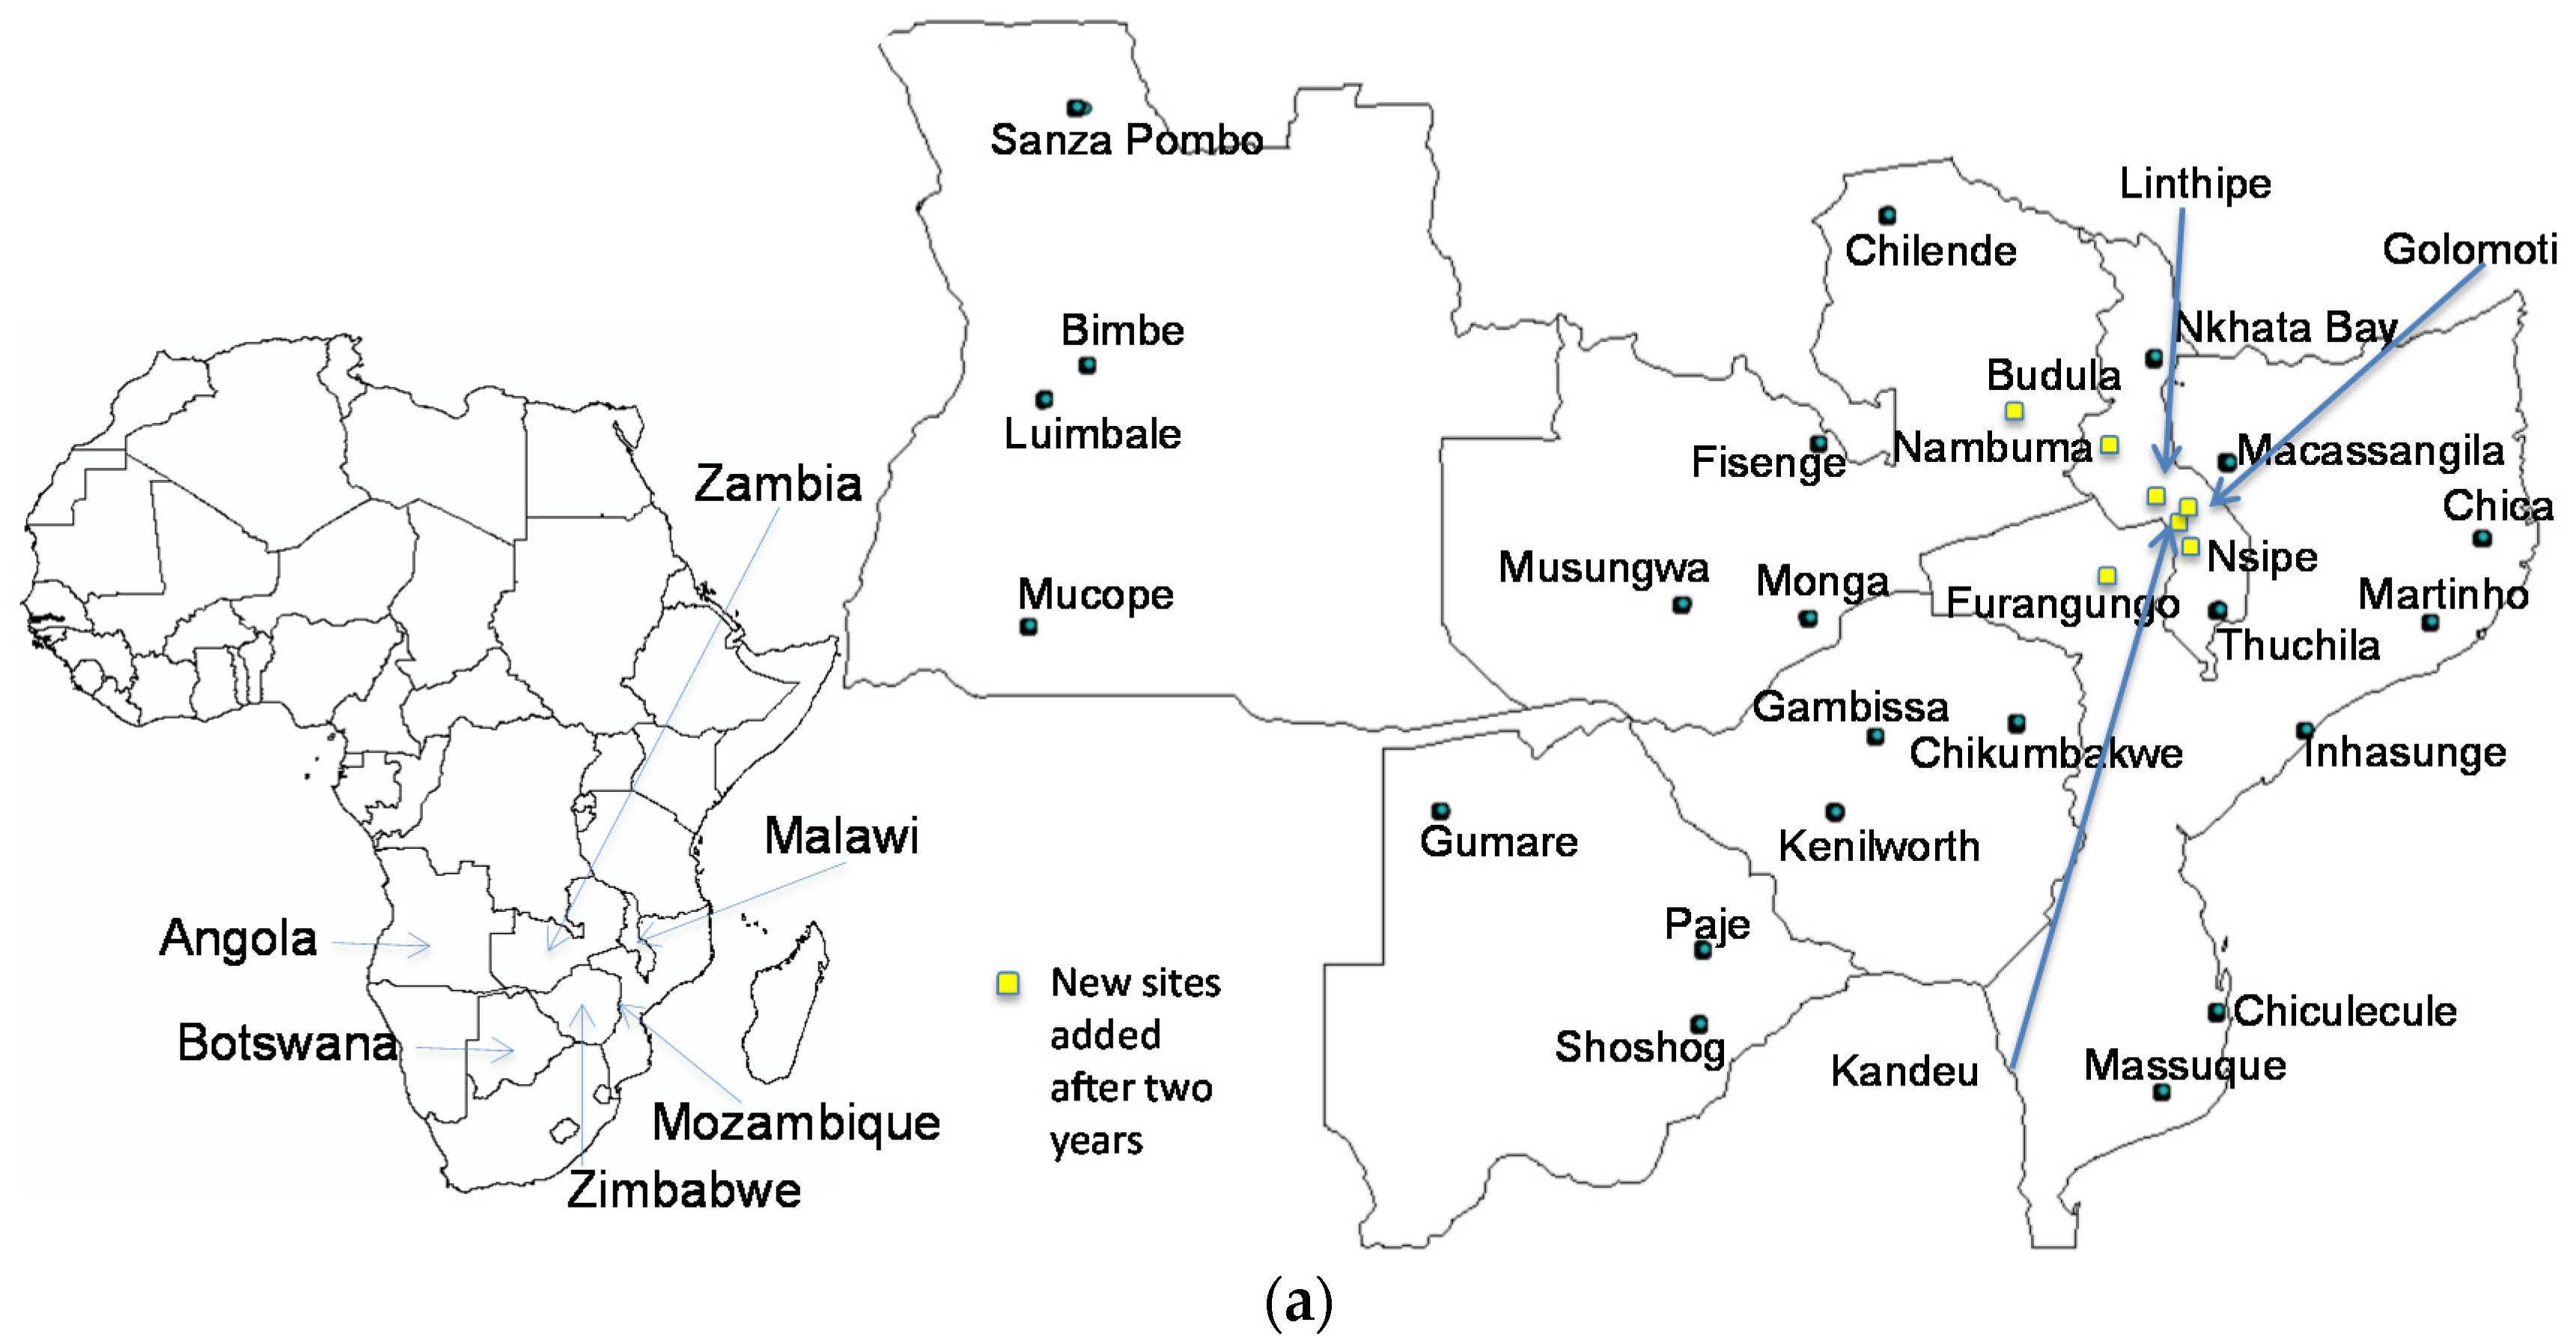
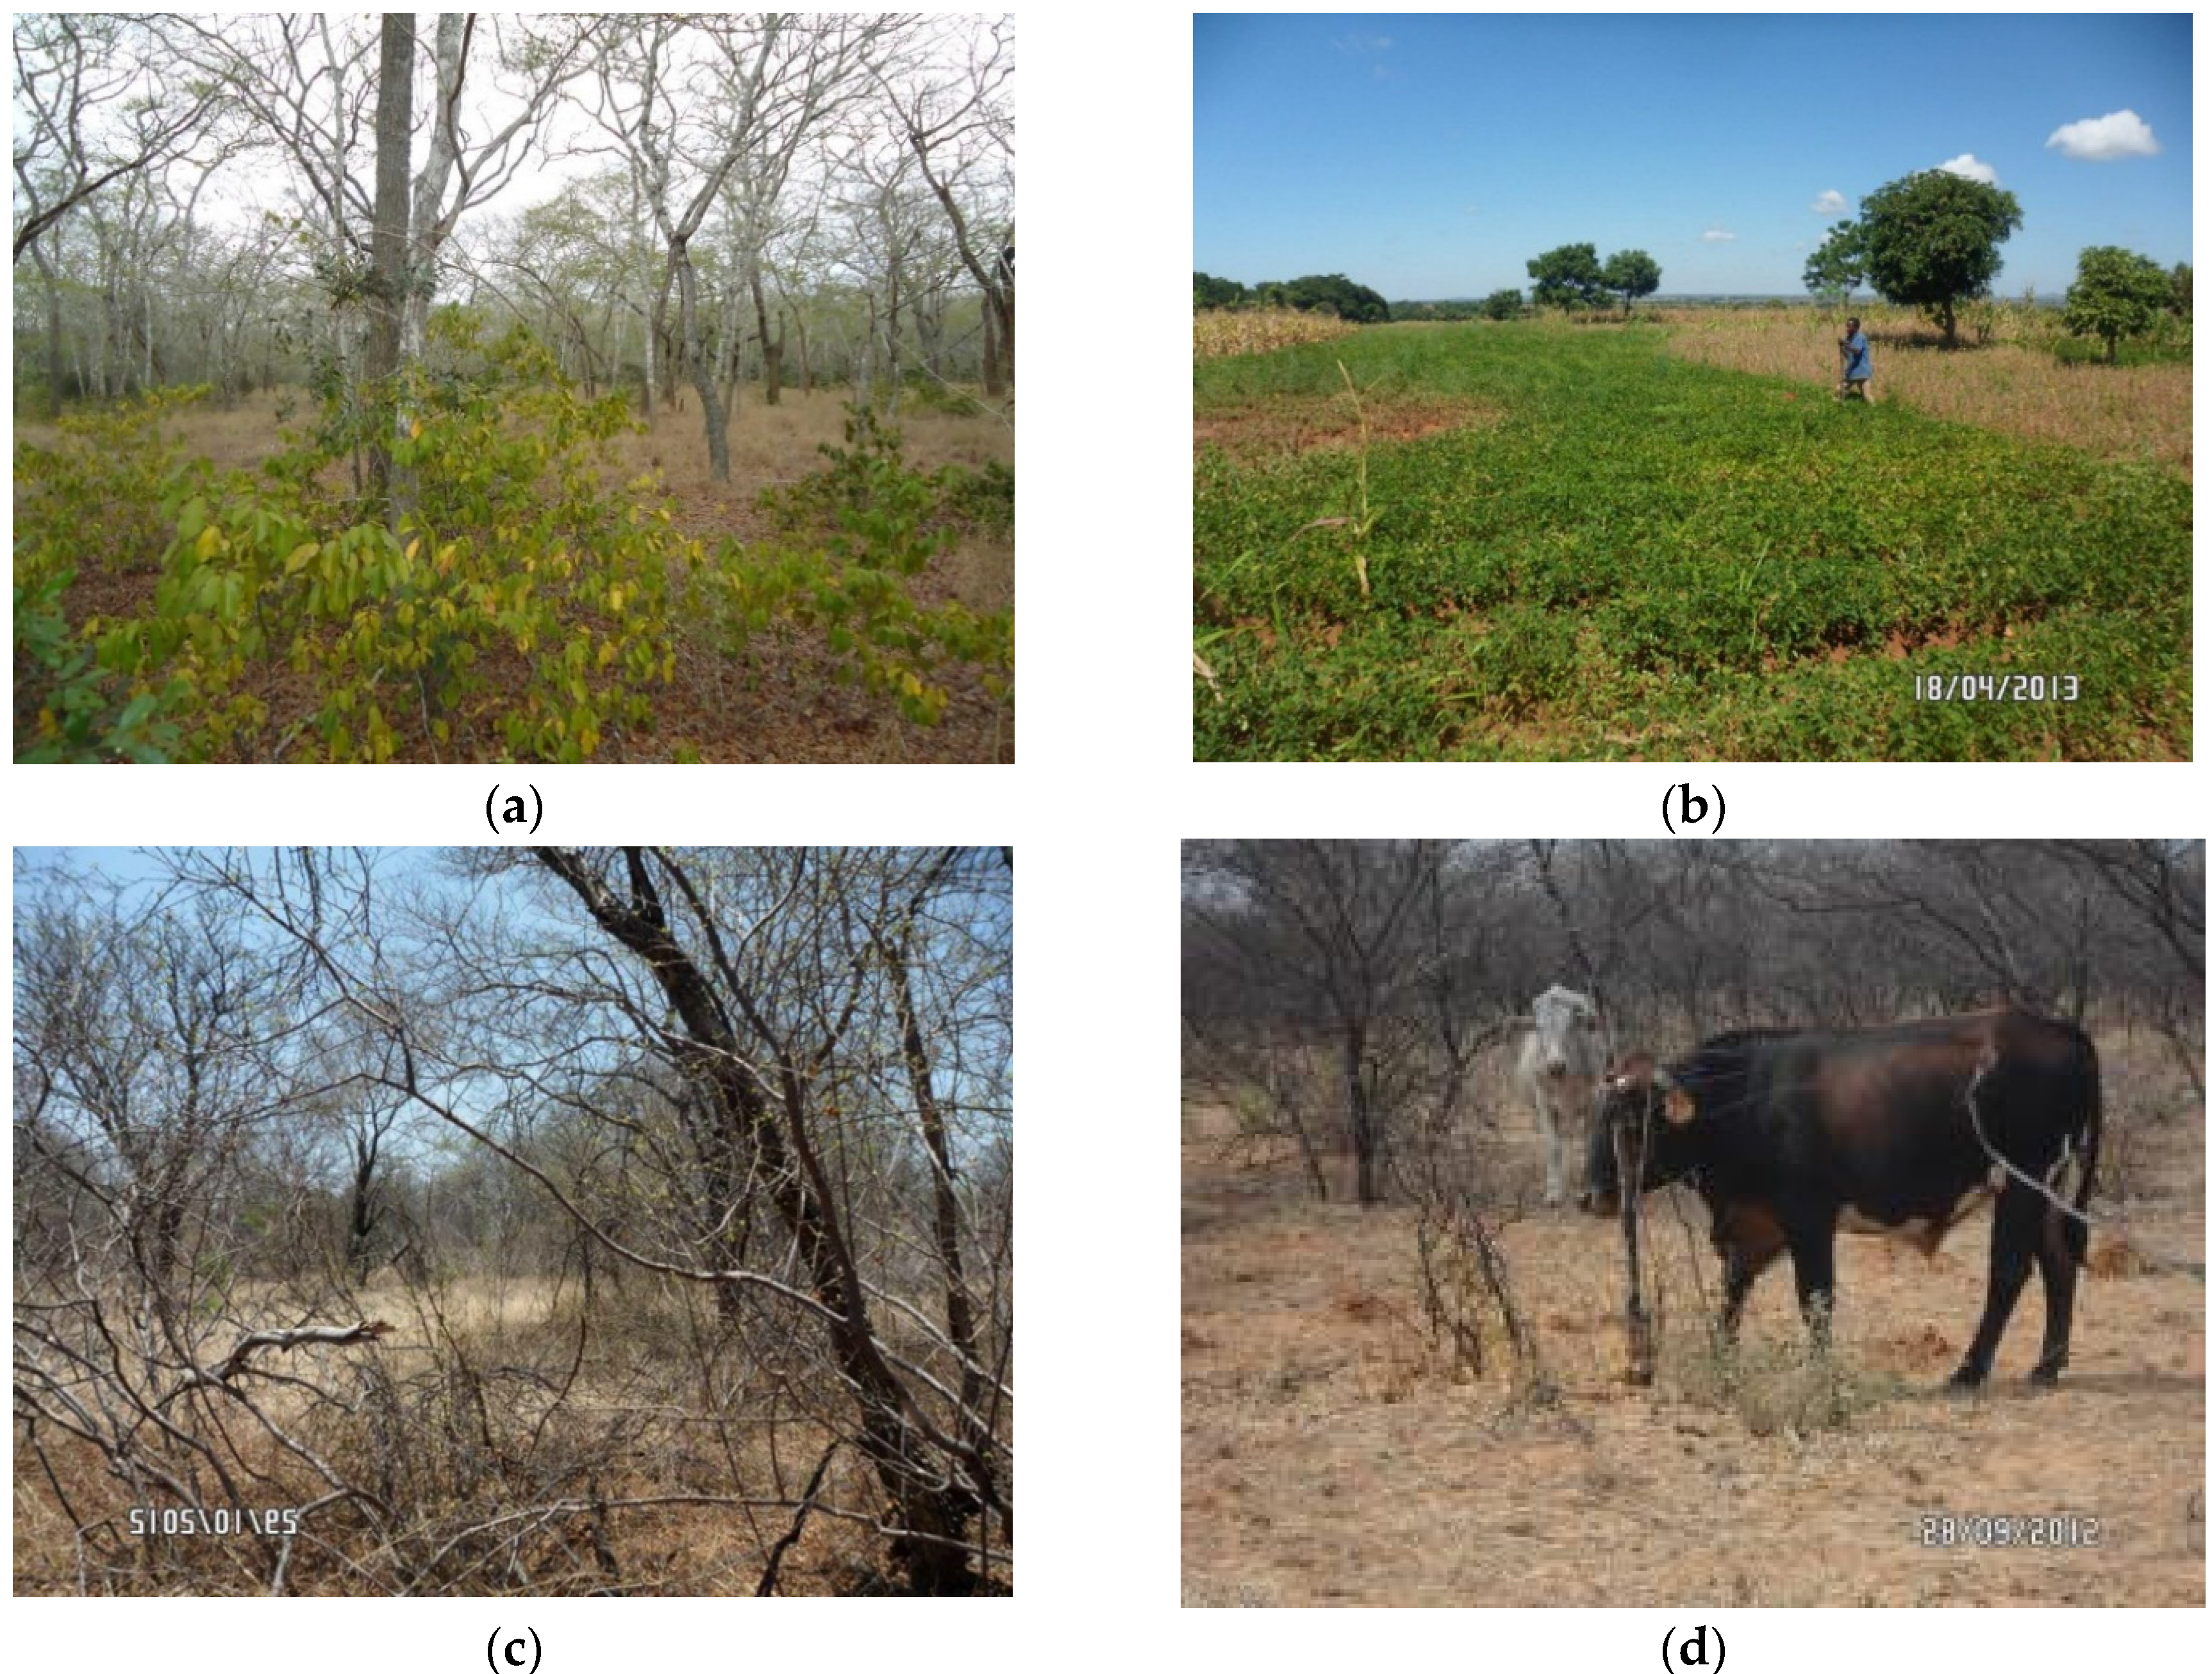
2.1. Description of the Study Area

The study covered 29 sentinel sites located in Angola, Botswana, Malawi, Mozambique, Zambia, and Zimbabwe covering four eco-zones; i.e., arid, semi-arid, and sub-humid to humid climate (Figure 1a,b and Table 1). The eco-zones defined by the quotient between yearly positive precipitation and yearly positive temperature were used as primary clustering units as they show the bio-climatic gradient [16].
The sampled areas fall within the Zambezian phytochoria in Southern Africa [17] with dominant woody vegetation assemblages including not only the miombo, Burkea/Terminalia/Combretum, Mopane woodlands (plates 1a,b,f respectively), and Acacia/Combretum, but also the transition to the Guinea-Congolia in the west and Zanzibar-Inhambane to the east. Areas under cultivated and left fallow contained a mixture or predominance of exotic fruit and firewood species. Cocoa and palm trees were found along water fringes of Inhambane in Mozambique (Plate 1g) and Musungwa in Zambia (Plate 1h) sites, respectively (Table 1). A few sampling points in Nkhatabay, Malawi, were within a plantation of rubber trees, Hevea brasiliensis.

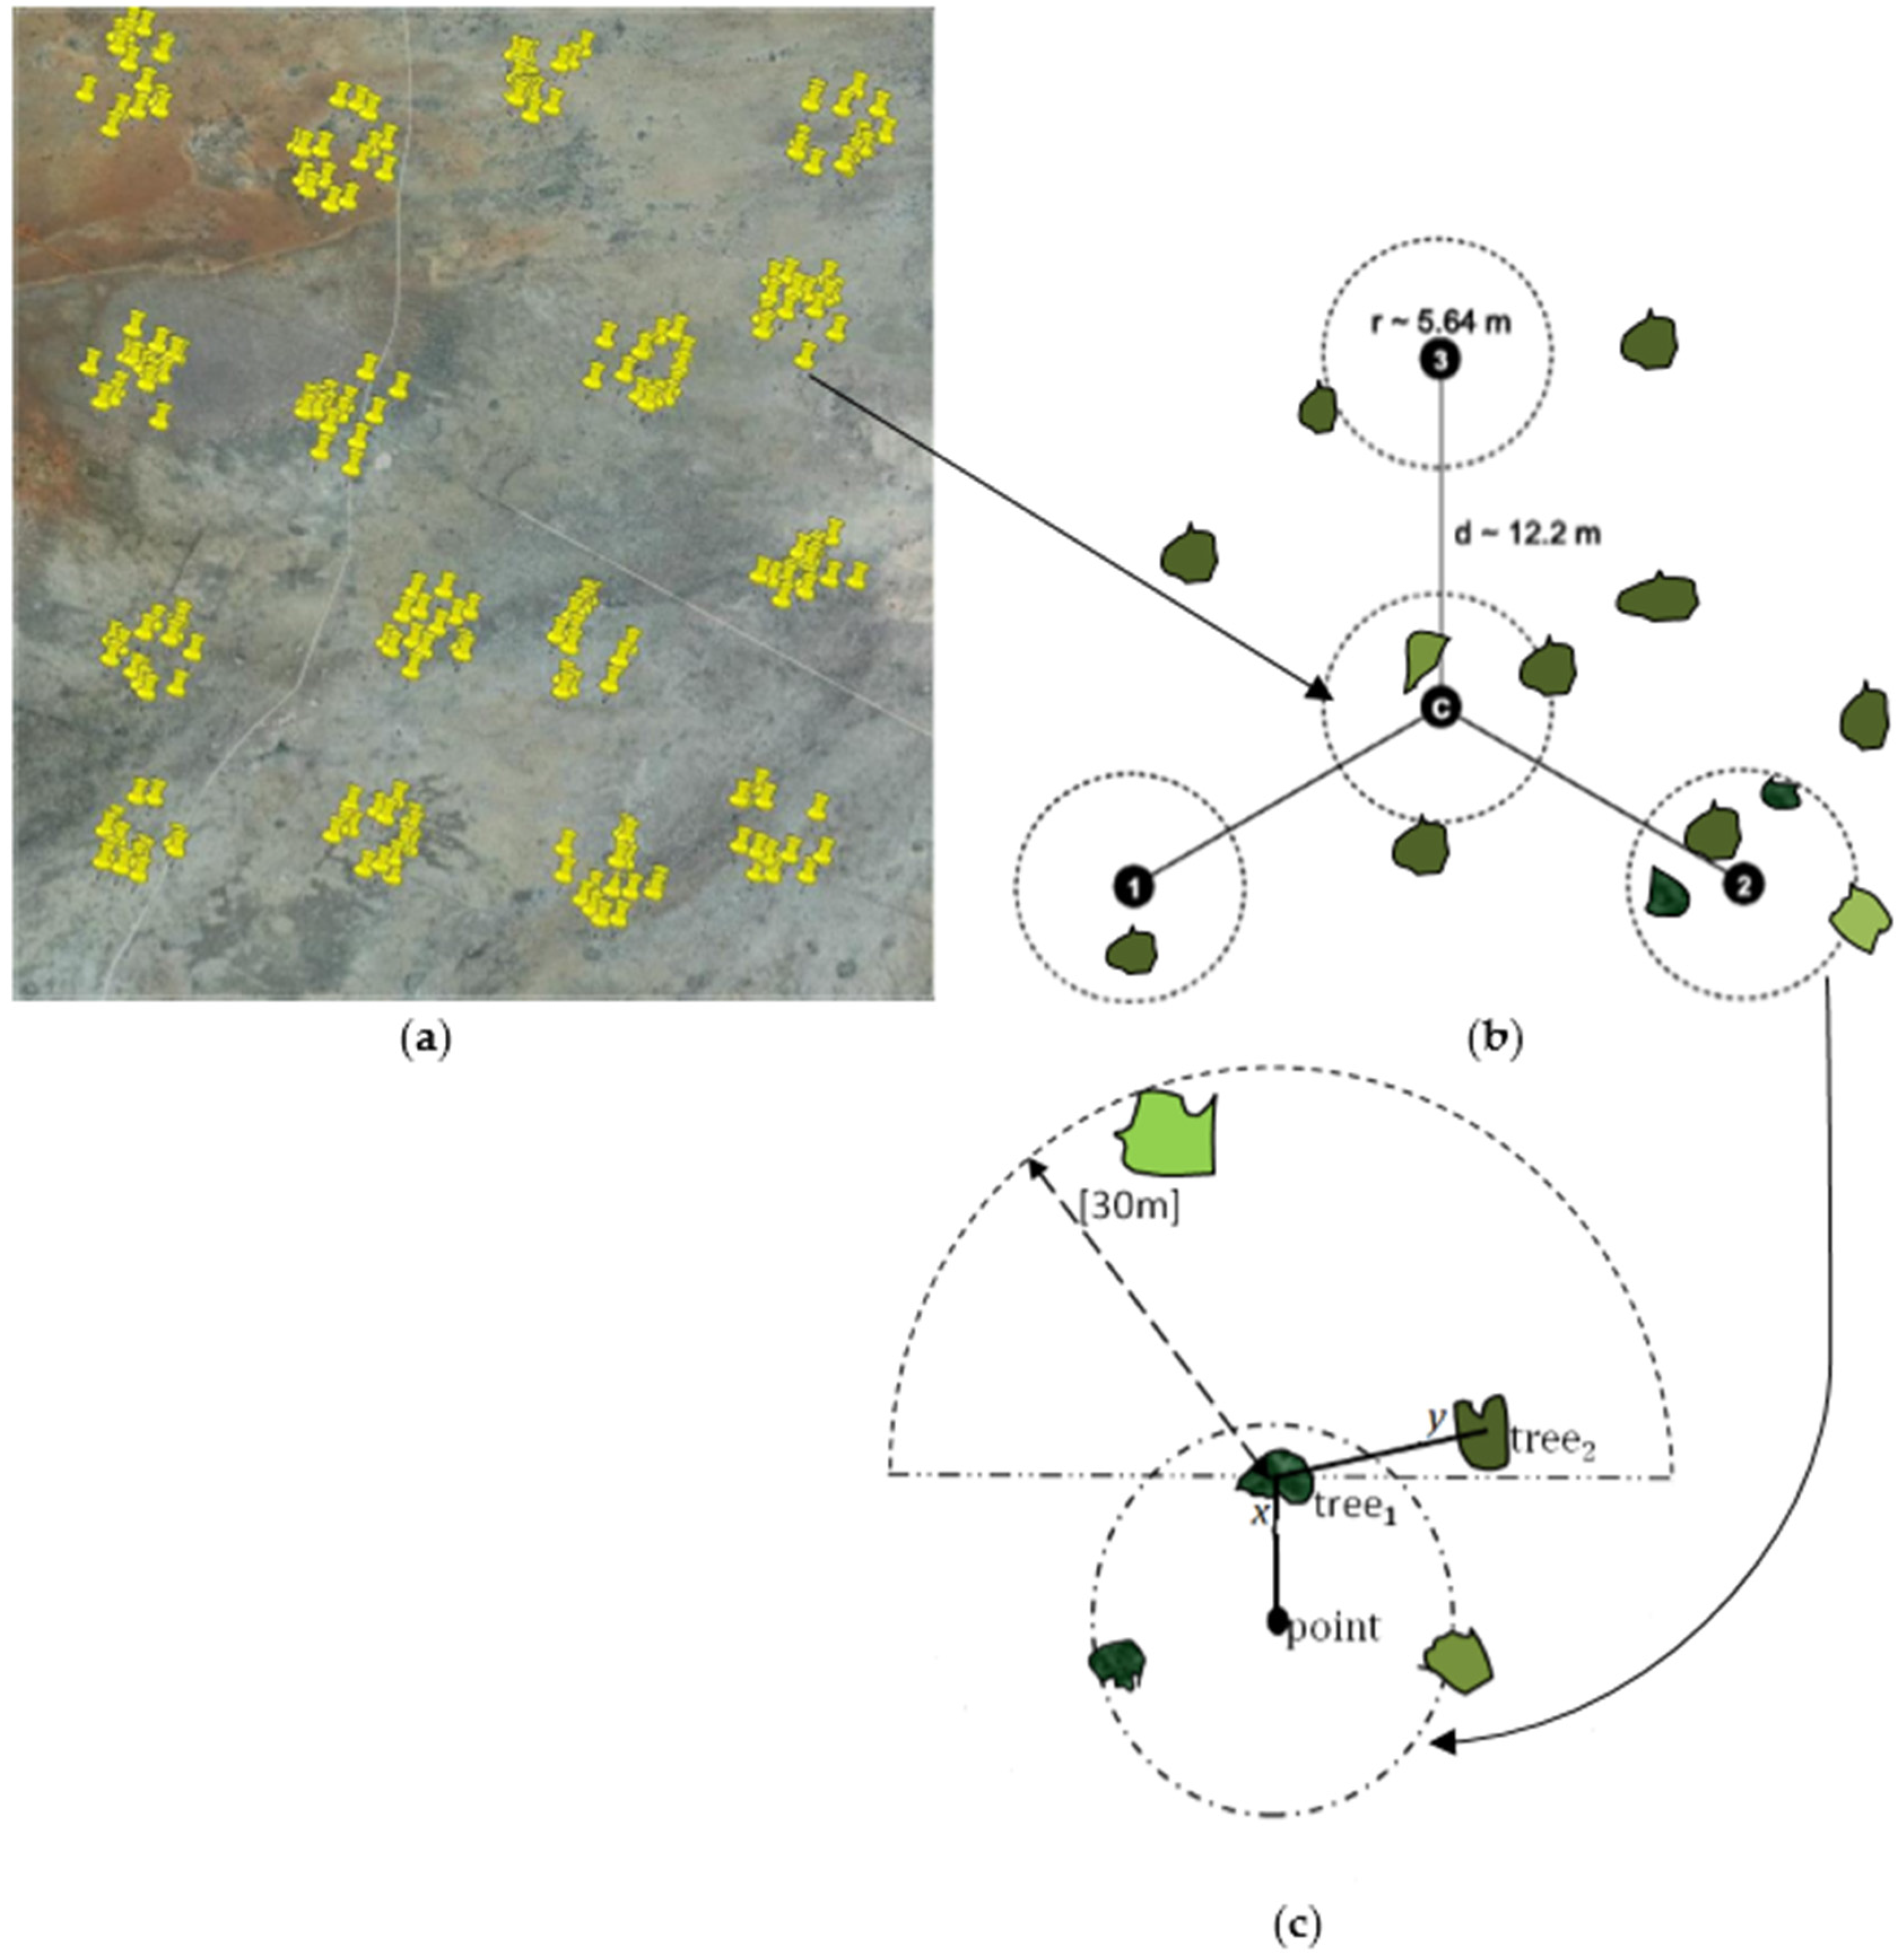
2.2. Sampling Strategy and Data Collection

This study applied the Africa Soil Information Service (AfSIS) sampling protocol where the sub-Saharan African continent is stratified according to the Koppen-Geiger climatic zones [18,19]. Additional sites of the CGAIR Drylands (CRP1.1) and the Africa Research in Sustainable Intensification for the Next Generation (Africa RISING) Programs were also included following similar sampling framework. Extensive data were collected from 4640 plots in the 29 sentinel sites (Table 1) covering a total area of 290,000 ha.
In all of the 29 sites, we employed the Land Degradation Surveillance Framework (LDSF) in which sample points are selected using hierarchical stratified random sampling [20]. The LDSF was designed to have sentinel sites of 10,000 ha as sampling framework. The sentinel site was stratified into 16 clusters of 100 ha. Within each cluster, 10 plots of 0.1 ha were randomly located (Figure 2a). The plot was further divided into four subplots of 0.01 ha as sampling units (Figure 2b). Tree related measurements were done at the sub-plot level.
Global Positioning System was used to navigate to sentinel sites-clusters-plots-subplots. The central position of the plot (referred as the central subplot, c) was marked (Figure 2a). From the center-point of this subplot, a distance of 12.2 m was measured to the upper slope position using measuring tape and the center of the next subplot was marked as subplot 2. Subplots 3 and 4 were located by offsetting 120 and 240 degrees from subplot 2, respectively. The radius of each subplot was 5.64 m, which approximately gives 0.01 ha area.
Sampling of individual trees for measurement was done using the T-square method [21]. The T-square has an advantage over other widely used distance or point-centered methods to estimate density for populations where individuals (trees) are randomly distributed in a study area [21,22]. Using the T-square method, the “point to tree1” distance (xi) was measured from the center of a subplot to the nearest tree. From the first tree observed (tree1), a “tree1 to tree2” distance (yi) was then measured to the nearest neighbor in the direction away from and perpendicular to the line “point to tree1” (Figure 2c). The angle of measurement was constrained to lie in the hemisphere with search diameter of 30m, the average distance between nearest neighboring trees expected in randomly distributed tree population in farmlands [23]. For tree2, diameter at 1.3 m height (D) and height (h) are measured using a measuring tape and clinometer, respectively.
For biomass estimation, woody plants with height of 3 m or more were considered as they are assumed to contain the greater portion of aboveground biomass carbon [5]. These tree stands also escape fire die back and are generally conserved by farmers while those below than 3 m and herbaceous plants are prone to destruction by fires and more likely cleared in cultivated areas [1].
In each plot, the degree of disturbance due to agriculture, cutting trees, grazing, fire, erosion, alien vegetation, etc. was assessed visually and through interviews with plot owners on a scale of 0 to 3 representing none to high impact following the procedures in the LDSF protocol [20]. The probability of a plot experiencing a given form of disturbance was estimated for each site (based on 160 plots per site) using a logistic regression model. For this purpose, estimates of the linear predictors (on the logit scale) and odd ratios were obtained for sites within each eco-zone separately. Predicted probabilities of each disturbance variable were then calculated from the odds ratios for each site within an eco-region.

2.3. Tree Density Estimation Using the T-Square Method

Most national forest inventories estimate tree density by counting the total number of trees and adjusting for the size of the area considered [24]. However, in our study sites, as is the case in most tropical grasslands, tree distribution is sporadic and sparse in agricultural areas and semiarid zones, thereby having vacant subplots where no measurements were made. Estimating tree density by relating the number of trees encountered with the area of plot/subplot could thus over or under-estimate tree density and carbon stock. In order to avoid that, the search areas were not restricted to the small plot area and adjustments were made to make sure that the calculated density was based on vacant and non-vacant plots/subplots.
To deal with errors associated with plot sizes, we estimate density and biomass at cluster level to increase the degrees of freedom (especially for sparsely populated areas), thereby having an unbiased estimate [9]. In a cluster, the unbiased mean search area (assuming there are no vacant subplots) occupied by nearest tree for the distance point to tree1 is:
A x = π 1 m 1 n x i j 2 n ( n m 1 ) ,
where m is the number of points (plots) in a cluster; i a particular plot; n is the number of subplots, j being a subplot, xij is the distances as described in the previous section. The corresponding unbiased estimate of density δ, as demonstrated by Mitchell [22] is the reciprocal of the search area given by:
δ x = n ( n m 1 ) π 1 m 1 n x i j 2 .
Similarly, the search area for the next nearest tree to a neighbor in the semi-circle is calculated as:
1 2 A y = π 1 m 1 n y i j 2 2 n ( n m 1 ) ,
where yij is the distance. Tree density within the corresponding search areas is given by:
δ y = 2 n ( n m 1 ) π 1 m 1 n y i j 2 .
The combined density that is robust to non-random pattern is [21]:
δ x y = δ x δ y .
The quations described above assume that all subplots contain trees but as discussed earlier, the sampled areas have vacant subplots. The absolute density should thus be corrected for vacant subplots for both the first and second trees. To achieve this, we first estimated the density of non-vacant subplots using:
δ x y ( m n m 0 ) = ( n m m 0 1 ) x * ( n m m 0 1 ) y ( π m n = 1 n m m 0 x i ) *   ( π m n = 1 n m m 0 y i ) ,
where mo denote number of vacant subplots. To correct for the bias, we employ the correction factor (CF) following Warde and Petranka [25] and derived as:
δ x y c = ( n m m 0 ) x ( n m m 0 ) y ( π m n = 1 n m m 0 x i )   ( π m n = 1 n m m 0 y i )     C F .
CF values were obtained from the CF table corresponding to proportion of vacant quarters (VQ), using:
VQ = m o x   *   m o y n m x n m y .

2.4. Estimating Variation in Tree Density, Height and Diameter

Variations in tree density, height and diameter were estimated using generalized linear mixed model to account for the hierarchical nature of the sampling. The first step involved analysis of variation across eco-zones (fixed effects). Here, a random intercept with site as the subject was specified as the random effect. The random statement in the model specifies that the linear predictor contains an intercept term that randomly varies at the level of the “study site” effect. The second step involved analysis of site effects (entered as fixed effects) within each eco-zone. In this case, a random intercept was introduced with clusters as a subject in the model in order to estimate the 95% confidence intervals (95% CI) correctly. Statistical inference was based on the means and their 95% CI.

2.5. Estimation of Aboveground Biomass (AGB) and Carbon Stocks

Tree biomass was estimated using existing multispecies biomass estimation models developed for each zone (Table 2). Some models such as the ones developed by Chave et al. [14] though robust for pan-tropical vegetation; they use default values for wood specific gravity and could not be applied to our dataset as it captured some species whose wood specific gravity are not yet determined. AGB was predicted using measured diameter as an input variable in each model. The predictive performance of each model was then compared and the best approximating model selected for each zone. Variations in estimated AGB across sites in the same eco-zone were estimated using linear mixed model. For each eco-zone, countries were entered as fixed effects and a random intercept with plots as subjects were entered as random effects in the mixed effects model. The best model was considered the one that gave the lowest AIC, narrow confidence intervals, and lower root mean square error (RMSE) [15]. Tree biomass was estimated using the best performed model. Stand biomass (per hectare) was then estimated by aggregating cluster level data since density adjusted for vacant subplots was aggregated at cluster level.
Aboveground biomass carbon stocks (AGBCS) were estimated from AGB using the equation [31]:
A G B C S = A G B * 0.47
Several studies have shown that the carbon fraction approximates between 0.47 and 0.50 of the total biomass [31,32,33,34]. Although Clark and Kellner [6] suggest to use species/stand specific values, it is a daunting task considering the varied species combinations encountered in the tropics [7]. Moreover, the aggregated range at stand level will not be very different from current widely used values obtained from meta-analyses of species specific values in the regions. In this study, we used 0.47, which is considered standard and is widely used to estimate AGBCS from AGB data for carbon trade in the tropics [31,32].
To assess the overall validity of the approach and thus show the level of confidence in both accuracy and precision of the results, we compared the estimates against biomass and carbon stock values obtained using destructive sampling in the region.

3. Results

3.1. Tree Density, Height and Diameter

Of the total 18,560 sampled subplots, 49.6% had at least a tree within 5.64 m radius while the search for the next tree within the 30 m radius hemisphere captured 47.4% of the trees (Table 3). The proportion of vacant subplots was 52.6%. Chilende in Zambia had the highest presence of trees (with 93.4% of the subplots having trees) whereas Musungwa (Zambia) had the least (0.03%). In most sites, there was high likelihood of finding the second tree from the first, except for Malawian sites of Golomoti, Kandeau, Linthipe and Nsipe where trees were more scattered.
Average search area from center to tree1 was 34.2 ± 87.2 m2 and from tree1 to tree2 was 66.7 ± 116.5 m2 (Table 3). The search area between the first and the second trees was wider (indicating sparse tree populations) in arid areas compared to the humid zones. Nambuma, Kandeu, and Linthipe in Malawi (Plate 1c), Musungwa in Zambia (Plate 1h), and Paje in Botswana had sparse populations. Woodlands at Gambisa in Zimbabwe, Chilende in Zambia, Kenilworth in Zimbabwe, Massuque in Mozambique, Mucope in Angola and Gumare in Botswana had clustered tree distributions as indicated by almost similar search areas for tree1 and tree2.
Tree density varied significantly across sites (Figure 3, Table 4) and eco-zones. The average tree density (adjusted for vacant subplots) was 502 trees·ha−1 with semi-arid regions having higher density of 682 trees·ha−1 followed by humid zone (584 trees·ha−1) while the arid regions had the least with 393 trees·ha−1. Musungwa in Zambia had the least tree density of 23 trees·ha−1 while Kenilworth in Zimbabwe had the highest of 1293 trees·ha−1. Gambisa in Zimbabwe had more vacant subplots such that the adjusted density was 1107 trees·ha−1 (47% of the unadjusted). At Furancungo (Mozambique), the adjusted density was 25% of the density for non-vacant subplots. The sparsely populated areas include Musungwa (Zambia) with adjusted density of 80% and the four Malawian sites (Linthipe, Nambuma, Thuchila and Kandeau) with adjusted density of less than 20% of the non-vacant density.
The average tree height significantly varied across sites and eco-zones (Figure 3, Table 4). Sites in humid areas had taller trees (mean 7.7 m) while those in arid areas tend to be significantly shorter (mean 4.6 m) than those in all other eco-zones. The average tree diameter also varied across sites and eco-zones (Figure 3, Table 4). Remnant trees in cultivated and drier areas had larger diameters than dense re-growth saplings in semi-arid and arid areas. Generally larger tree diameters were found in humid zones compared to the other eco-zones. However, the 95% CL does not indicate significant differences between eco-zones. With fewer trees, Musungwa in Zambia had relatively large diameter trees averaging 27.2 ± 18.0 cm. In this site, the trees are well preserved under co-management arrangement between the local community and Zambia Wildlife Authority since it is within the buffer zone of Kafue National Park. The arid areas, despite having shorter trees, tend to have larger diameter trees. Most trees in the area were coppice re-growth of multiple stems from single stump. The dominantly cultivated area of Nambuma (Malawi) had fewer and large diameter trees averaging 21.46 ± 20.6 cm. The sites with smallest diameter trees include Nsipe (Malawi), Gumare (Botswana) and Furancungo (Mozambique) with average diameters of 12.01 cm, 12.88 cm and 13.67 cm, respectively.

3.2. Tree Biomass and Carbon Stocks

Among the various set of models used (Table 2), models by Ryan et al. [28], Kuyah et al. [29] and Mugasha et al. [26] best approximated aboveground biomass and carbon stock for the arid and semi-arid; sub-humid; and humid eco-zones, respectively (Table 5). The results show that the region contains considerable amount of aboveground biomass and carbon stocks at both tree and stand levels (Table 4). Individual tree biomass averaged 329.6 kg·tree−1 with humid zone having trees with more biomass (409.3 kg·tree−1) followed by arid zone. The sub-humid zone had the lowest biomass (238.4 kg·tree−1). The arid and semi-arid zones had the largest variability indicated by large standard errors.
Trees with lower biomass were observed in newly cultivated areas of Bimbe in Angola, Budula-Siliya in Zambia and at Gumare in the arid zone of Botswana. Sites with higher variability in biomass carbon contents include Chikumbakwa and Chiculecule (Mozambique) and Gumare (Botswana) while those with low variability include Musungwa (Zambia), Luimbale (Angola) and Furancungo (Mozambique).
The stand AGB estimated using the individual tree and density adjusted for non-vacant subplots was 119.9 Mg·ha−1 constituting carbon stocks of 56.4 Mg·ha−1 (Table 6). Semi-arid and humid zones had higher carbon stocks (72 Mg·ha−1) compared to sub-humid region (34.3 Mg·ha−1). At site level, higher carbon stocks were recorded in the semi-arid regions of Kenilworth and Gambisa (both in Zimbabwe) and Massuque (in Mozambique), arid area of Chiculecule (Mozambique) and sub-humid area of Chilende (Zambia). Sites in sub-humid regions of Linthipe, Thuchila, Nambuma, Kandeu and Nsipe (all in Malawi), Musungwa (Zambia) and Bimbe (Angola) had relatively lower carbon stocks.

4. Discussion

This study has revealed high variability in tree density, biomass and carbon stocks across land uses and eco-zones in southern Africa. Areas with high levels of anthropogenic disturbance (e.g., many in Malawi) appear to have the lowest tree densities and biomass carbon while undisturbed woodlands and some grazing areas showed dense tree cover and carbon stock (Table 7).
Except few sites with higher estimates, the majority of the AGB values in this study are within the range of estimates obtained in other studies from tropical dry to moist forests. A review by Gibbs et al. [35] also established that sub-Saharan Africa’s open, closed and tropical seasonal forest contains carbon stock ranging from 17 to 152 Mg·ha−1. The wide variability in carbon stock could be a reflection of differences in topography, climate and land use regimes across those different systems.
Generally, biomass carbon stocks in humid and sub-humid areas were affected by intense cultivation and wood fuel extraction whereas bush fires destroy trees in semi-arid and arid zones. Fire has a long history in the evolution of southern African savanna ecosystems and there exists some degree of fire dependency for the growth, production, regeneration and coexistence of herbaceous and woody savanna vegetation [17]. However, humans have altered the intensity and timing of fire over time, and anthropogenic activity is one of the main causes of fires [36]. For example, the current distribution of miombo woodland, the principal vegetation type in the Zambezian savanna zone, is believed to reflect the history of anthropogenic fire utilization in the region [17].
In closed undisturbed forests, regional trends in rainfall and topography are the prime determinants of woody biomass carbon stock [4,37]. Olson et al. [38] found carbon stocks of 120, 105, and 72 Mg·ha−1 for tropical rain, moist and dry forests, respectively. A similar gradient was captured by Intergovernmental Panel on Climate Change (IPCC) [31] where Africa’s tropical wet forest had higher carbon stocks (145.7 Mg·ha−1) followed by woodlands with short season (122.2 Mg·ha−1), woodlands with short dry season (57.81 Mg·ha−1) and drier areas with 33.84 Mg·ha−1.
At stand level, woody biomass follows a gradient along successions following disturbance [39]. Disturbance regimes including conversion of forests to agricultural production, fires, wood extraction and grazing exert local to regional impact on tree biomass as reflected in the variability of biomass/carbon stocks estimates within eco-zones and countries [27]. In this study, the intensively cultivated sub-humid areas of Malawi had consistently lower biomass estimates compared to arid areas under moderate cultivation and intense grazing in Botswana (Table 4). This could be linked to disturbance probabilities (Table 1) where sites in Botswana have lower cutting and agricultural incidence compared to those of Malawi. National carbon estimates reviewed by Gibbs et al. [35] based on studies conducted between 1983 and 2007 shows varied carbon stocks among four countries as follows: Angola (59.44 with range 28.53–94.39), Zambia (53.4 with range 19.64–92.86), Mozambique (49.6 with range 24.16–65.39) and Malawi (2.86 with range 1.61–4.16), which generally agreed with the estimates in this study.
The carbon stocks found in this study in undisturbed and disturbed woodlands and croplands are within the ranges estimated previously in the region. Kuyah et al. [29] recorded carbon stocks of 0.8–22 Mg·ha−1 in croplands and disturbed woodlands of Malawi. Ribeiro [40] found carbon stocks of 19 Mg·ha−1 in undisturbed miombo woodland within Niassa Forest Reserve in northern Mozambique. Several studies in miombo woodlands of eastern Arc Mountains and Kitulango Forest both in Tanzania found carbon estimates within the rage of 15.5–80 Mg·ha−1 [41,42,43]. The study by Chidumayo [27] in miombo of Zambia found carbon gradients in spatial (adjacent re-growth and old-growth) and temporal (1990–2012) scales. He established that the re-growth experienced minimal disturbance and had increased carbon stock from 3.8 Mg·ha−1 at eight years in 1990 to 16.0 Mg·ha−1 in 2012. On the other hand, an old-growth that experienced moderate disturbance had its carbon stock decreased from 47.0 to 35.3 Mg·ha−1. These trends are primarily a result of woodland management and utilization regimes by local communities and are supported by the observation by Chidumayo [44]. Chidumayo noted that many interacting land use factors have shaped regeneration and regrowth of miombo woodlands. In the arid areas, the woodlands are preserved because other vegetation types cannot be supported by the little rains received [37].
Socio-cultural factors also influence biomass within ecological zones with Paje (Botswana) having lower biomass due to scorching bush fires whereas woodlands of Shoshong (Botswana) are traditionally protected. The mangroves of coastal Mozambique are also conserved by local communities without formal institutions and contain considerable biomass stocks. The results from this study are consistent with estimates by Fatoyinbo et al. [45] who found 67 Mg·ha−1 carbon stocks in mangroves of Inhambane along the central-southern coastlines of Mozambique. The Inhassunge site is generally located below sea level, water floods the coastal lines and valleys form a network of rivers that flow upland during lunar tide and towards the ocean when the water recedes. Woodlands have formed natural bands and are conserved by local communities (Plate 1g). Other studies in the region show that beliefs, taboos and tradition are among the driving forces shaping use and management of tree/forest resources [46,47].
Overall, biomass carbon stocks followed the gradient in ecological and anthropogenic disturbance regimes, hence the need for different management approaches specific to the zone or site(s). Being the first regional study across a range of eco-zones and land cover/use types, the approach and estimates can serve as a baseline and used for future monitoring of carbon stock and income generation through “carbon trade”. This will add to the pool of information required to enhance negotiation capacity of governments, private sector and communities involved REDD+ and voluntary carbon markets.

5. Conclusions

Tropical forests have great potential for mitigating global warming due to atmospheric CO2 emissions. The miombo dominated woodlands in Southern Africa are also major sources of livelihoods. However, their potential is impaired by deforestation and forest degradation, which contribute about one fifth of total anthropogenic CO2 emissions. Restoring landscapes and proper management of forest resources are necessary to tackle problems of climate change and global warming. Carbon sequestration incentives require that initial carbon storage is established and the role of projects in tackling atmospheric emission verified. Understanding spatial variability of carbon stock across land use and eco-zones can play a crucial role in the design of management strategies. This can also facilitate “carbon-saving” credit schemes and provide necessary incentives. However, developing countries face measurement challenges due to diversity in vegetation species, inaccessibility and limited resources.
The paper reports the estimate of biomass and carbon stock from land degradation surveillance of randomly selected 4640 plots across six countries of Southern Africa (Angola, Botswana, Malawi, Mozambique, Zambia, and Zimbabwe). Generalised allometric equations for tree species in different vegetation types and climate zones were used to estimate aboveground biomass based on which carbon stock was estimated. The study estimated average aboveground tree density of 502 trees·ha−1 and carbon stock of 56.4 Mg·ha−1. There were however wide site to site variability in both biomass and carbon stock due to a combination of natural and anthropogenic processes. Areas with high levels of anthropogenic disturbance (e.g., many in Malawi) appear to have the lowest tree densities and biomass carbon while undisturbed woodlands and some grazing areas showed dense tree cover and carbon stock. Given the extent and variability of woody carbon stocks in the region, there is a huge capacity for the ecosystem to store carbon if properly managed. Managing the carbon stock in this extensive carbon rich ecosystem can also contribute to global initiatives in combating global warming. Financial incentive designed to ensure proper management of the woodland and forest ecosystem can contribute to the creation of considerable carbon sink contributing to the REDD+ initiatives in developing regions.
The data for this study is based on large number of plots distributed across diverse ecological and land use systems. Moreover, the study captured diverse ecosystem ranging from xeric shrublands to dense humid forests along latitudinal and altitudinal gradients using consistent methods. The estimated aboveground biomass and carbon stock can thus form a baseline against which future trends can be compared for monitoring and impact assessment. Despite the fact that the estimates reported in this study are based on allometric models that are suited to corresponding agro-ecological zones and/or tree species, it will be necessary to test the results using measured biomass and carbon values.

Acknowledgments

We would like to thank the Bill and Melinda Gates Foundation for the financial support to the Africa Soil Information Service (AfSIS) Project, which enabled collecting data for a large number of sites. The Dryland System CGIAR Program funding helped collect additional data in Malawi, Mozambique and Zambia. We would also like to acknowledge financial support from the USAID Feed the Future’s Africa RISING program that enabled us gather data from additional sites in Malawi. We would also like to thank our partners in national institutions and local communities in the different countries who were instrumental in data collection.

Author Contributions

Lulseged Tamene and Powell Mponela did initial analysis and drafted the paper; Gudeta W. Sileshi contributed to the analysis and write-up, Jiehua Chen contributed to data analysis, and Jerome Tondoh made comments and inputs on the discussion.

Conflicts of Interest

The authors declare no conflict of interest.

Abbreviations

The following abbreviations are used in this manuscript:
AGB
aboveground biomass
AGBC
aboveground biomass carbon
AGBCS
aboveground biomass carbon stock
AfSIS
Africa Soil Information Service
AIC
akaike information criterion
LDSF
land degaradation surveillance framework
REDD+
Reducing Emmisions from Degradation and Forest Degradation
RISING
research in sustainable intensification for the next gerneration

References

  1. Campbell, B.M. The Miombo in transition: Woodlands and Welfare in Africa. CIFOR 1996. [Google Scholar] [CrossRef]
  2. World Bank. Wood-Based Biomass Energy Development for Sub-Saharan Africa. Issues and Approaches; The World Bank Group: Washington, DC, USA, 2011. [Google Scholar]
  3. Liyama, M.; Neufeldt, H.; Dobie, P.; Njenga, M.; Ndegwa, G.; Jamnadass, R. The potential of agroforestry in the provision of sustainable woodfuel in sub-Saharan Africa. Curr. Opin. Environ. Sustain. 2014, 6, 138–147. [Google Scholar]
  4. Frost, P.G.H. The ecology of miombo woodlands. In The Miombo in Transition: Woodlands and Welfare in Africa; Campbell, B., Ed.; CIFOR: Bogor, Indonesia, 1996; pp. 11–57. [Google Scholar]
  5. FAO. The Miombo in transition: Woodlands and Welfare in Africa. In Environment and Natural Resources Series 8; FAO: Rome, Italy, 2005. [Google Scholar]
  6. Clark, D.B.; Kellner, J.R. Tropical forest biomass estimation and the fallacy of misplaced concreteness. J. Veg. Sci. 2012, 23, 1191–1196. [Google Scholar] [CrossRef]
  7. Henry, M.; Picard, N.; Trotta, C.; Manlay, R.; Valentini, R.; Bernoux, M.; Saint-Andre, L. Estimating tree biomass of sub-Saharan African forests: A Review of Available Allometric Equations. Silva. Fennica. 2011, 45, 477–569. [Google Scholar] [CrossRef]
  8. Henry, M.; Bombelli, A.; Trotta, C.; Alessandrini, A.; Birigazzi, L.; Sola, G.; Vieilledent, G.; Santenoise, P.; Longuetaud, F.; Valentini, R.; et al. GlobAllomeTree: International Platform for Tree Allometric Equations to Support Volume, Biomass and Carbon Assessment. iForest 2013, 6, 326–330. [Google Scholar] [CrossRef] [Green Version]
  9. Bostoen, K.; Chalabi, Z.; Grais, R.F. Optimisation of the T-square sampling method to estimate population sizes. Emerg. Themes Epidemiol. 2007, 4, 7. [Google Scholar] [CrossRef] [PubMed] [Green Version]
  10. WFP. Using the T-square sampling method to estimate population size, demographics and other characteristics in emergency food security assessments (EFSAs). Technical Guidance Sheet No. 11. World Food Program. 2009. Available online: http://documents.wfp.org/ stellent/groups/public/documents/manual_guide_proced/wfp197301.pdf (accessed on 12 November 2011).
  11. Vagen, T.; Shepherd, K.D.; Walsh, W.G.; Winowiecki, L.; Desta, L.T.; Tondoh, J.E. AfSIS Technical Specifications Soil Health Surveillance; Africa Soil Information Service: Nairobi, Kenya, 2010. [Google Scholar]
  12. Shepherd, K.D.; Shepherd, G.; Walsh, M.G. Land health surveillance and response: A Framework for Evidence-Informed Land Management. Agric. Syst. 2015, 132, 93–106. [Google Scholar] [CrossRef]
  13. PHAC (Public Health Agency of Canada). Sentinel Sites 2015. Available online: http://www.phac-aspc.gc.ca/foodnetcanada/necessity-importance-eng.php (accessed on 8 December 2015).
  14. Chave, J.; Rejou-mechain, M.; Burquez, A.; Réjou-Méchain, M.; Alberto Búrquez, A.; Chidumayo, E.; Colgan, M.S.; Delitti, W.B.C.; Duque, A.; Eid, T.; et al. Improved allometric models to estimate the aboveground biomass of tropical trees. Glob. Change Biol. 2014, 20, 3177–3190. [Google Scholar] [CrossRef] [PubMed]
  15. Sileshi, G.W. A critical review of forest biomass estimation models, common mistakes and corrective measures. For. Ecol. Manag. 2014, 329, 237–254. [Google Scholar] [CrossRef]
  16. Sayre, R.; Comer, P.; Hak, J.; Josse, C.; Bow, J.; Warner, H.; Larwanou, M.; Kelbessa, E.; Bekele, T.; Kehl, H.; et al. A New Map of Standardized Terrestrial Ecosystems of Africa; Association of American Geographers: Washington, DC, USA, 2013. [Google Scholar]
  17. White, F. The Vegetation of Africa. In Natural Resources Research No. 20; UNESCO: Paris, France, 1983. [Google Scholar]
  18. Kottek, M.; Grieser, J.; Beck, C.; Rudolf, B.; Rubel, F. World map of Koppen-Geiger climate classification update. Meteologische. Zeitschrift. 2006, 15, 259–263. [Google Scholar] [CrossRef]
  19. Peel, M.C.; Finlayson, B.L.; Mcmahon, T.A. Updated world map of the Koppen-Geiger climate classification. Hydrol. Earth Syst. Sci. 2007, 11, 1633–1644. [Google Scholar] [CrossRef]
  20. Vagen, T.; Winoweicki, L.; Tamene, L.; Tondoh, J.E. The Land Degradation Surveillance Framework: Field Guide; ICRAF/CIAT: Nairobi, Kenya, 2015. [Google Scholar]
  21. Sakkatat, P. T-Square sampling. Bang Phra. Center J. 1997, 4, 27–30. [Google Scholar]
  22. Mitchell, K. Quantitative Analysis by the Point-Centered Quarter Method; Hobart and William Smith Colleges: Geneva, Switzerland, 2007. [Google Scholar]
  23. Kimondo, J.M.; Agae, J.G.; Okia, C.A.; Dino, A.W.; Abohassan, R.A.A.; Mulatya, J.; Teklehaimanot, Z. Distribution and regeneration status of Vites payos (Lour.) Merr. In Kenyan drylands. J. Hortic. Forest. 2014, 6, 81–91. [Google Scholar]
  24. Lund, G.Y. National Forest Inventories and Global Resource Assessments. Forests and Forest Plants, 1. Encyclopedia of Life Support System. Available online: http://www.eolss.net/sample-chapters/c10/E5-03-01.pdf (acessed on 10 December 2015).
  25. Warde, W.; Petranka, J.W. A correction factor table for missing point-center quarter data. Ecology 1981, 62, 491–494. [Google Scholar] [CrossRef]
  26. Mugasha, W.A.; Eid, T.; Bollandsas, O.M.; Malimbwi, R.E.; Chamshama, S.A.O.; Zahabu, E.; Katani, J.Z. Allometric models for prediction of above- and belowground biomass of trees in the miombo woodlands of Tanzania. For. Ecol. Manag. 2013, 310, 87–101. [Google Scholar] [CrossRef]
  27. Chidumayo, E.N. Forest degradation and recovery in a miombo woodland landscape in Zambia: 22 Years of Observations on Permanent Sample Plots. For. Ecol. Manag. 2013, 291, 154–161. [Google Scholar] [CrossRef]
  28. Ryan, C.M.; Williams, M.; Grace, J. Above- and belowground carbon stocks in a miombo woodland landscape of Mozambique. Biotropica 2011, 43(4), 423–432. [Google Scholar] [CrossRef]
  29. Kuyah, S.; Sileshi, G.W.; Njoloma, J.; Mng’omba, S.; Neufeldt, H. Estimating aboveground tree biomass in three different miombo woodlands and associated land use systems in Malawi. Biomass Bioenergy 2014, 66, 214–222. [Google Scholar] [CrossRef]
  30. Brown, S.L.; Gillespie, A.J.R.; Lugo, A.E. Biomass estimation methods for tropical forests with applications to forest inventory data. For. Sci. 1989, 35, 881–902. [Google Scholar]
  31. IPCC. Good Practice Guidance for Land Use, Land-Use Change and Forestry 2006. Available online: http://www.ipcc-nggip.iges.or.jp/public/gpglulucf/gpglulucf_files/Chp3/Anx_3A_1_Data_Tables.pdf (accessed on 3 April 2014).
  32. Penman, J.; Gytarsky, M.; Hiraishi, T.; Krug, T.; Kruger, D.; Pipatti, R.; Buendia, L.; Miwa, K.; Ngara, T.; Tanabe, K.; et al. Good practice guidance for land use, land-use change and forestry. Hayama, Japan. Institute for Global Environmental Strategies (IGES)/Intergovernmental Panel on Climate Change (IPCC) 2003, 295, 590. Available online: http://www.ipcc-nggip.iges.or.jp/public/gpglulucf/gpglulucf_files/GPG_LULUCF_FULL.pdf (accessed on 23 February 2016). [Google Scholar]
  33. Hughes, R.F.; Kauffman, J.B.; Jaramillo-Luque, V.J. Ecosystem-scale impacts of deforestation and land use in a humid tropical region of México. Ecolpgical. Appl. 2000, 10, 515–527. [Google Scholar] [CrossRef]
  34. Paladinic, E.; Vuletic, D.; Martinic, I.; Marjanovic, H.; Indir, K.; Benko, M.; Novotny, V. Forest biomass and sequestered carbon estimation according to main tree components on the forest stand scale. Periodicum. Biologorum. 2009, 111, 459–466. [Google Scholar]
  35. Gibbs, H.K.; Brown, S.; Niles, J.O.; Foley, J.A. Monitoring and estimating tropical forest carbon stocks: Making REDD a Reality. Environ. Res. Lett. 2007, 2, 045023. [Google Scholar] [CrossRef]
  36. Eriksen, C. Why do they burn the “bush”? Fire, rural livelihoods, and conservation in Zambia. Geogr. J. 2007, 173, 242–256. [Google Scholar] [CrossRef]
  37. Sankaran, M.; Hanan, N.P.; Scholes, R.J.; Ratnam, J.; Augustine, D.J.; Cade, B.S.; Gignoux, J.; Higgins, S.I.; Le Roux, X.; Ludwig, F.; et al. Determinants of woody cover in African savannas. Nature 2005, 438, 846–849. [Google Scholar] [CrossRef] [PubMed]
  38. Olson, J.S.; Watts, J.A.; Allison, L.J. Major World Ecosystem Complexes Ranked by Carbon in Live Vegetation: A Database; Carbon Dioxide Information Center, Oak Ridge National Laboratory: Oak Ridge, TN, USA, 2001. [Google Scholar]
  39. Chambers, J.Q.; Negron-Juarez, R.I.; Marra, D.M.; Di Vittorio, A.; Tews, J.; Roberts, D.; Ribeiro, G.H.; Trumbore, S.E.; Higuchi, N. The steady-state mosaic of disturbance and succession across an old-growth Central Amazon forest landscape. Proc. Natl. Acad. Sci. USA 2013, 110, 3949–3954. [Google Scholar] [CrossRef] [PubMed]
  40. Ribeiro, N.S.; Matos, C.N.; Moura, I.R.; Washington-Allen, R.A.; Ribeiro, A.I. Monitoring vegetation dynamics and carbon stock density in miombo woodlands. Carbon Balance Manag. 2013, 9, 1–11. [Google Scholar] [CrossRef] [PubMed]
  41. Malimbwi, R.E.; Solberg, B.; Luoga, E. Estimate of biomass and volume in miombo woodland of Kitulangalo forest reserve, Tanzania. J. Trop. For. Sci. 1994, 7, 230–242. [Google Scholar]
  42. Munishi, P.K.T.; Mringi, S.; Shirima, D.D.; Linda, S.K. The role of miombo woodlands of the southern highlands of Tanzania as carbon sinks. J. Ecol. Nat. Environ. 2010, 2, 261–269. [Google Scholar]
  43. Shirima, D.; Munishi, P.; Lewis, S.; Burgess, N.; Marshall, A.R.; Balmford, A.; Swetnam, R.D.; Zahabu, E.M. Carbon storage, structure and composition of miombo woodlands in Tanzania’s Eastern Arc Mountains. Afr. J. Ecol. 2011, 49, 332–342. [Google Scholar] [CrossRef]
  44. Chidumayo, E.N. Changes in miombo woodland structure under different land tenure and use systems in central Zambia. J. Biogeogr. 2012, 29, 1619–1626. [Google Scholar] [CrossRef]
  45. Fatoyinbo, T.E.; Simard, M.; Washington-Allen, R.A.; Shugart, H.H. Landscape-scale extent, height, biomass, and carbon estimation of Mozambique’s mangrove forests with Landsat ETM+ and Shuttle Radar Topography Mission elevation data. J. Geophys. Res. 2007, 113, G02S06. [Google Scholar] [CrossRef]
  46. Siangulube, F.S.; Almstedt, M.; Bystrom, M.; Mwitwa, J.P. Local Vegetation Use and Traditional Conservation Practices in the Zambian Rural Community: Implications on Forest Stability. Master Thesis, Uppsala Universitate, Uppsala, Sweden, 2007. [Google Scholar]
  47. Tanyanyiwa, V.I.; Chikwamba, M. The role of indigenous knowledge systems in the management of forest resources in Mugabe area, Masvingo, Zimbabwe. J. Sustain. Develop. Afr. 2011, 13, 132–149. [Google Scholar]
Figure 1. (a) Location of the sampling sites in Southern Africa and (b) description of areas with respect to miombo, pantoropical and ecozones.
Forests 07 00057 g001aForests 07 00057 g001b
Plate 1. Tree and stand structure in varied land cover and use types (a) Miombo woodland at Massuque in Mozambique; (b) Terminalia woodland in arid zone at Gumare in Botswana; (c) trees on farm (scattered trees in intensively cropped areas at Linthipe in Malawi; (d) burnt and respouting trees with intensively grazed dry grass at Paje in Botswana; (e) intensively cultivated plains and forested hills at Luimbale in Angola; (f) intact mopane woodlands in semi-arid zone at Kenilworth in Zimbabwe; (g) mangroves with salt pans in depressions and trees on raised areas at Inhassunge in Mozambique; and (h) Dauwn palm on edge of Kafue river flood plain at Musungwa in Zambia.
Forests 07 00057 g004aForests 07 00057 g004b
Figure 2. (a) Hierarchical sampling of plots (individual icons) in 16 clusters within the 10 by 10 km sentinel site (b) sampling subplots layout and (c) the T-square method employed to measure tree attributes for each subplot. NB: subplots c1 and c2 are non-vacant; c3 is vacant; and c1 could have tree 1 but no tree 2 within a 30 m radius (see Section 2.3 for details).
Forests 07 00057 g002
Figure 3. Variation in tree density (in ha−1) (top panel); total height (in m) and diameter at breast height (D in cm) (bottom panel) across eco-zones and sites. Vertical bars represent 95% confidence intervals.
Forests 07 00057 g003
Table 1. Distribution of the sites, vegetation types and ecological zones with corresponding Koppen–Geiger (R) and pan-tropical (PT) climatic zones.
LocationSite NameMajor Woody Vegetation CompositionRPT
AngolaBimbeRe-growth fallow; sparse remnant trees on farmlandSub-humidDry
LuimbaleRe-growth fallow, sparse remnant trees on farmland and old-growth on hill topsSub-humidDry
MucopeRegrowth Mopane woodland with open canopy used chiefly for grazingSemi-aridDry
Sanza-pomboTall grass (>1.5 m) with scattered treesHumidMoist
BotswanaGumareOld-growth Terminalia spp.AridDry
PajeOld-growth Terminalia; mopane and AcaciaAridDry
ShoshongRe-growth fallow; remnant trees on farmland; and old-growth along valleys and hilltopsAridDry
MalawiGolomotiMiombo remnant trees on escarpment and re-growth on farmland and old-growth; mopane & acacia re-growth & remnants on cropland in the plainSemi-aridDry
KandeauRemnant trees, exotic fruit and firewood trees on farmland and homesteadsSub-humidDry
LinthipeRemnant native trees, exotic fruit and firewood trees on farmland and homesteadsSub-humidDry
NambumaRemnant native trees, exotic fruit and firewood trees on farmland and homesteadsSub-humidDry
Nkhata BayRubber plantation; old and re-growth miombo and fruit treesHumidMoist
NsipeRemnant trees on farmland, fallow and old-growth on hillsSub-humidDry
ThuchilaExotic fruit and firewood trees on homesteads and along streams and roadsSub-humidDry
MozambiqueChicaRe-growth fallows, remnant trees and cashewnut on farmlandSub-humidDry
ChiculeculeThorny thickets on west and miombo on east (mainly re-growth fallow and remnants on farmland)AridDry
FuranungoOld-growth on cluster 4; re-growth fallow; and remnants on farmlandSub-humidDry
IhansungheDense old-growth mangrove lowland; coconut & mangoes on farmlandHumidMoist
MacasangilaHeavily cut coppice shoots; with intact woodland in cluster 4Sub-humidDry
MartinhoA few patches of re-growth woodland; and treeless farmlandSemi-aridDry
MassuqueOld-growth miombo closed canopySemi-aridDry
ZambiaBudulaRemnant trees on cropland; and old-growth untilled areas and hillsSub-humidDry
ChilendeOld-growth miomboSub-humidDry
FisengePatches of old-growth miombo; remnant trees on farmlandSub-humidDry
MongaOld-growth miombo on steep slopes; re-growth and remnant trees on farmlandSub-humidDry
MusungwaPalm and mango trees on southern tip; greater part is flood plain and grasslandSub-humidDry
ZimbabweChikumbakweScattered trees and shrubs on farmland; re-growth miombo; waterlogged grasslandsSemi-aridDry
GambissaOld-growth D. cinerea thickets; miombo and mopaneSemi-aridDry
KenilworthMiombo old-growth; D. cinerea thickets re-growth fallow and remnant trees on farmlandSemi-aridDry
Table 2. Selected equations used to estimate aboveground biomass (AGB (kg·tree−1)) in the study area.
SourceEquationEco-RegionRainfall (mm/Year)
Arid and Semi-Arid
Mugasha et al. [26] aAGB = exp(−2.2453 + 2.4735ln(D)Dry miombo Tanzania6–1000(9)
Chidumayo [27] aAGB = 0.0446D2.765Dry miombo Zambia850–940(10)
Chidumayo [27] bAGB = 2.5553ln(D) − 2.5265Dry miombo Zambia850–940(11)
Ryan et al. [28]lnAGB = 2.601log(D) − 3.62Dry miombo Mozambique520–1120(12)
Sub-Humid
Kuyah et al. [29]AGB = 0.0905D2.4718Savanah: Markhamia, Eucalyptus, Acacia1000–1300(13)
Brown et al. [30] aAGB = 34.4703 − 8.0671D + 0.6589D2Tropical dry<1500(14)
Mugasha et al. [26] bAGB = exp(−1.6557 + 2.3427ln(D)Wet miombo Tanzania1000–1400(15)
Humid
Mugasha et al. [26] bAGB = exp(−1.6557 + 2.3427ln(D)Wet miombo Tanzania1000–1400(16)
Brown et al. [28] bAGB = exp(−2.4090 + 0.9522ln(D2hρ))Tropical moist>1500(17)
Subscript letters (a, b) denote different models by the same author the same year.
Table 3. Summary of presence of trees, distribution (search area, SA) in the study area.
Subplot (Number)SA (m2)
Eco-ZoneCountrySentinel SiteTree1Tree2Tree1SDTree2SD
Grand-average32431334.287.366.7116.5
Semi-arid Sub-average29929254.7276.280.3136.2
BotswanaGumare45645131.324.344.867.0
BotswanaPaje17916240.928.6115.4189.4
BotswanaShoshog156152124.11027.7106.7167.6
MozambiqueChiculecule40440222.424.254.2120.7
Semi-arid Sub-average39938726.923.753.1104.3
AngolaMucope51751625.924.338.388.2
MalawiGolomoti23216129.925.379.2178.0
MozambiqueMartinho28327734.825.899.3161.4
MozambiqueMassugue53253124.622.234.254.3
ZimbabweChikumbakwa17417029.726.467.9146.6
ZimbabweGambissa50250019.520.122.843.8
ZimbabweKenilworth55355223.521.729.958.1
Sub-humid Sub-average28626631.024.885.5140.9
AngolaBimbe29928932.827.278.1141.8
AngolaLuimbale40240025.624.643.6100.9
MalawiKandeau1629735.823.3187.9280.0
MalawiLinthipe1175541.227.1125.0169.4
MalawiNambuma15213946.927.2221.1274.9
MalawiNsipe22613836.827.785.0165.3
MalawiThuchila927933.126.6108.4189.0
MozambiqueChica_b42041621.823.043.7100.5
MozambiqueFurancungo26824928.325.943.987.1
MozambiqueMacssangila29329025.725.162.0124.7
ZambiaBudula Silya39539222.121.934.881.0
ZambiaChilende59959922.721.327.132.8
ZambiaFisenge30529923.223.349.9121.2
ZambiaMonga53453323.921.933.566.2
ZambiaMusungwa201745.126.3138.1179.0
Humid Sub-average31430924.324.748.184.5
AngolaSanza Pombo42542123.423.641.785.5
MalawiNkhata Bay26625624.224.937.567.1
MozambiqueIhassunge25124925.325.665.0100.8
Table 4. Tree density (unadjusted and adjusted for vacant subplots), total height and diameter at breast height. Figures in parenthesis are 95% confidence intervals of means.
Eco-zoneCountrySentinel SiteUnadjusted DensityDensity Adjusted for VacantHeight (m)Diameter1.3 (cm)
AridBotswanaShoshog467115 (9.7–220.4)4.5 (4.2–4.7)21.5 (18.2–24.9)
BotswanaPaje1026153.2 (69–238)3.9 (3.6–4.2)21.2 (17.9–24.5)
MozambiqueChiculecule1440751 (424–1077)5.4 (5.2–5.6)17.8 (15.2–20.5)
BotswanaGumare1123551 (400–703)4.3 (4.1–4.5)12.8 (10.2–15.4)
Mean1014393 (240–545)4.6 (4.4–4.9)16.9 (15.9–17.9)
Semi-aridZimbabweChikumbakwa905181 (81–281)5.5 (5.0–6.0)17.4 (14.8–20.0)
MozambiqueMassugue1392911 (550–1271)7.4 (7.2–7.7)18.4 (17.2–19.6)
MozambiqueMartinho691215 (154–276)5.3 (5.0–5.6)18.6 (17.0–20.3)
ZimbabweKenilworth17561293 (732–1854)5.5 (5.2–5.7)16.8 (15.6–18.0)
MalawiGolomoti1348268 (115–422)6.1 (5.7–6.5)19.2 (17.0–21.4)
AngolaMucope1471797 (480–1114)5.3 (5.1–5.6)16.4 (15.1–17.6)
ZimbabweGambissa23741107 (557–1657)5.6 (5.3–5.9)15.0 (15.0–16.2)
Mean1420682 (566–797)5.9 (5.7–6.1)17.1 (16.4–17.8)
Sub-humidMalawiNambuma35556 (30–82)5.5 (4.9–6.0)22.2 (19.9–24.5)
MalawiKandeau73475 (40–111)7.0 (6.3–7.6)22.8 (20.1–25.6)
ZambiaMusungwa2827 (0–15)7.4 (6.0–8.9)26.4 (20.1–32.8)
ZambiaFisenge1440542 (248–836)5.5 (5.1–5.9)18.8 (17.2–20.4)
MalawiThuchila69060 (31–89)5.7 (5.0–6.4)18.0 (15.0–21.0)
MalawiLinthipe34243 (−6–93)5.2 (4.4–6.0)17.5 (13.9–21.0)
MozambiqueChica_b1394762 (492–1033)5.0 (4.7–5.4)14.8 (13.4–16.2)
MalawiNsipe1045201 (58–343)5.6 (5.0–6.1)15.2 (12.9–17.5)
MozambiqueFurancungo1667404 (263–544)6.4 (6.0–6.9)17.8 (16.0–19.6)
ZambiaChilende16381084 (767–1401)8.6 (8.3–8.9)19.0 (17.8–20.2)
MozambiqueMacssangila1039397 (181–613)7.1 (6.7–7.5)15.5 (13.8–17.1)
ZambiaBudula Silya1541726 (522–93106.0 (5.6–6.3)13.9 (12.4–15.4)
AngolaLuimbale1369743 (405–1081)5.9 (5.6–6.3)16.6 (15.1–18.0)
ZambiaMonga15021118 (881–1355)5.6 (5.3–5.9)15.3 (14.0–16.5)
AngolaBimbe760261 (182–340)5.2 (4.8–5.6)15.2 (13.5–16.9)
Mean1053432 (353–511)6.2 (6.0–6.4)16.8 (16.2–17.5)
HumidMozambiqueIhassunge1062427 (90–764)8.0 (6.7–9.4)23.6 (20.7–26.4)
MalawiNkhata Bay1433426 (90–764)9.8 (8.5–11.2)18.9 (16.1–21.7)
AngolaSanza Pombo1370900 (515–1285)6.3 (5.1–7.6)15.0 (12.4–17.5)
Mean1288584 (408–760)7.7 (7.4–7.9)17.8 (16.8–18.9)
Grand mean1194502 (445–559)6.1 (6.0–6.2)17.0 (16.7–17.3)
Table 5. Mean tree biomass estimates (kg·tree−1) with lower and upper 95% confidence limits (95% CL). The best approximating model identified using Akaike Information Criterion (AIC) and Root Mean Square Error (RMSE) are shaded. The mean estimate is the weighted average for a particular model on individual tree basis.
EcoregionModelCountryMean (kg·tree−1)95% CLAICRMSE
Arid and semi-aridMugasha et al. [26] aAngola253.1109.7–396.45927528.3
Botswana270.6150.4–390.9 22.2
Mozambique545.5381.5–709.5 15.0
Zambia189.050.2–327.8 36.7
Zimbabwe255.8156.2–355.5 19.5
Chidumayo [27] aAngola313.438.1–588.66362043.9
Botswana341.2109.4–573.0 34.0
Mozambique865.3551.0–1179.7 18.2
Zambia221.1−45.3–487.5 60.3
Zimbabwe340.0147.1–533.0 28.4
Chidumayo [27] b linearAngola257.992.5–423.36021832.1
Botswana277.2138.3–416.1 25.1
Mozambique594.1405.0–783.1 15.9
Zambia189.629.5–349.6 42.3
Zimbabwe265.0149.7–380.3 21.8
Ryan et al. [28]Angola102.332.0–172.55442834.4
Botswana110.251.2–169.3 26.8
Mozambique244.7164.4–325.0 16.4
Zambia74.56.5–142.5 45.7
Zimbabwe106.257.1–155.3 23.1
Sub-humidKuyah et al. [29]Angola126.780.7–172.66973118.2
Malawi271.6224.3–319.0 8.7
Mozambique202.3173.7–230.9 7.1
Zambia179.6146.0–213.1 9.4
Zimbabwe313.3155.0–471.7 25.3
Brown [30] aAngola142.187.0–197.27134419.4
Malawi314.0257.2–370.8 9.1
Mozambique231.8197.6–266.1 7.4
Zambia204.2164.0–244.5 9.9
Zimbabwe361.2171.4–550.9 26.3
Mugasha et al. [26] bAngola215.6129.5–301.87533220.0
Malawi483.2394.4–572.0 9.2
Mozambique355.4301.7–409.0 7.6
Zambia311.9248.9–374.8 10.1
Zimbabwe554.9258.1–851.8 26.8
HumidMugasha et al. [26] bAngola213.489.8–337.01556228.7
Malawi404.1265.6–542.5 17.0
Mozambique614.5472.3–756.7 11.5
Brown [30] bAngola255.678.4–432.91622634.3
Malawi505.3307.1–703.5 19.4
Mozambique802.4599.0–1005.7 12.6
Subscript letters (a, b) denote different models by the same author the same year.
Table 6. Estimated aboveground tree biomass (Kg·tree−1) and stand biomass (Mg·ha−1) and their 95% confidence limits (95% CL) and carbon stocks (Mg·ha−1) at the sites in southern Africa.
ZoneCountrySiteTree Biomass95% CLStand Biomass95% CLCarbon Stock
AridMozambiqueChiculecule541.6198.4–716.7225.7101.0–289.3106.1
BotswanaGumare153.3108.2–176.379.947.6–96.437.6
BotswanaShoshog406.9282.4–470.445.618.5–59.421.4
BotswanaPaje468.0318.8–544.142.925.1–52.020.1
Mean392.4227.0–476.898.547.9–124.346.3
Semi-aridZimbabweKenilworth240.9190.9–266.4293.8210.3–336.4138.1
MozambiqueMassugue220.8165.7–248.9228.6159.8–263.7107.5
ZimbabweGambissa180.3138.0–201.9227148.4–267.1106.7
AngolaMucope252.6198.1–280.4172.8130.8–194.281.2
ZimbabweChikumbakwa553.4−7.6–839.66612.7–93.232.0
MalawiGolomoti252.0135.2–311.648.810.2–68.523.0
MozambiqueMartinho249.2168.4–290.447.35.4–68.722.1
Mean278.5141.3–348.5154.996.9–184.572.8
Sub-humidZambiaChilende187.7158.7–202.5248.2178.4–283.8116.6
ZambiaMonga173.6141.3–190.1190.4146.3–212.989.5
MozambiqueChica_b181.7121.9–212.2147.622.9–211.269.4
ZambiaFisenge251.3160.7–297.5105.273.8–121.249.4
AngolaLuimbale138.1115.0–149.992.954.5–112.543.7
ZambiaBudula Silya112.087.9–124.370.952.3–80.433.3
MozambiqueFurancungo176.1135.5–196.860.135.8–72.528.3
MozambiqueMacssangila166.699.0–201.157.327.3–72.626.9
AngolaBimbe110.685.9–123.229.716.6–36.414.0
MalawiNsipe183.596.5–227.927.411.5–35.512.9
MalawiKandeau330.8204.4–395.321.8−16.6–41.410.2
MalawiNambuma398.4110.1–545.5186.0–24.18.5
MalawiThuchila292.7151.6–364.714.14.9–18.86.6
MalawiLinthipe196.765.4–263.77.72.0–10.63.6
ZambiaMusungwa675.9188.6–924.54.8−23.0–19.02.2
Mean238.4128.2–294.673.139.6–90.234.3
HumidMalawiNkhata Bay396.7300.5–445.8165.755.4–222.077.9
AngolaSanza Pombo213.2164.4–238.1164.995.5–200.377.5
MozambiqueIhassunge617.9442.1–707.6128.761.7–162.960.5
Mean409.3302.5–463.8153.170.8–195.172.0
Overall mean329.6199.7–395.9119.963.8–148.556.4
Table 7. Ecological zones (according to Koppen–Geiger) of the study sites and major sources of disturbance. The probability of a plot experiencing disturbance due to agricultural activities, cutting trees, grazing, fire, erosion and alien species are shown under each category.
Eco-ZoneCountrySite NameAgricultureCuttingGrazingFireErosionAliens
AridBotswanaGumare0.0000.0000.9940.4690.5000.000
Paje0.1380.0000.0000.2380.4380.000
Shoshong0.1250.2750.9310.0380.4810.000
MozambiqueChiculecule0.6380.6310.2380.2500.4250.100
p value************NSNA
Semi-aridMozambiqueMartinho0.5310.5690.1060.4560.5810.106
Massuque0.0250.0000.6500.4370.5060.000
ZimbabweChikumbakwe0.2500.4500.8630.4310.3810.013
Gambissa0.2130.1880.9630.4690.6880.000
Kenilworth0.1500.0000.8690.5940.6810.000
AngolaMucope0.3000.0940.9810.0750.4810.000
MalawiGolomoti0.3940.4440.1190.8000.5500.000
p value***************NA
Sub-humidAngolaBimbe0.3810.3060.0060.6810.8060.006
Luimbale0.3810.2560.0380.4380.7810.000
MalawiKandeau0.4380.2630.1060.7000.6690.000
Linthipe0.4500.0940.1560.6250.2190.000
Nambuma0.4690.9000.1130.0500.5940.000
Nsipe0.3940.3560.1440.8060.7630.000
Thuchila0.0880.9690.0810.1500.4310.013
MozambiqueChica0.6060.5000.0130.4000.7560.125
Furanungo0.4130.2810.0130.8250.7500.000
Macasangila0.7060.4810.0000.5380.6560.050
ZambiaBudula0.5180.3880.3940.4310.8310.000
Chilende0.0060.0000.0250.4500.5440.000
Fisenge0.4310.5940.0940.3880.3880.013
Monga0.4130.1810.7130.4440.8940.000
Musungwa0.0190.0310.0000.9000.2810.000
p value***************NA
HumidAngolaSanzapombo0.1250.1130.0810.8000.7560.000
MalawiNkhataBay0.4810.7000.1560.6440.4940.006
MozambiqueIhansunge0.2630.7500.0060.2310.4380.175
p value**************NA
p values show significance of differences between sites (** p = 0.05; *** p < 0.001 and NS p > 0.05). NA means that maximum likelihood estimates do not exist due to lack of convergence.

