Article

Allometric Models Based on Bayesian Frameworks Give Better Estimates of Aboveground Biomass in the Miombo Woodlands

1
Department of Botany, Jomo Kenyatta University of Agriculture and Technology (JKUAT), P.O. Box 62000-00200, Nairobi, Kenya
2
World Agroforestry Centre (ICRAF), United Nations Avenue, P.O. Box 30677-00100, Nairobi, Kenya
3
Plot 1244, Ibex Hill, Lusaka, Zambia
*
Author to whom correspondence should be addressed.
Forests 2016, 7(2), 13; https://doi.org/10.3390/f7020013
Submission received: 27 August 2015 / Revised: 2 November 2015 / Accepted: 19 November 2015 / Published: 3 February 2016

Abstract

:
The miombo woodland is the most extensive dry forest in the world, with the potential to store substantial amounts of biomass carbon. Efforts to obtain accurate estimates of carbon stocks in the miombo woodlands are limited by a general lack of biomass estimation models (BEMs). This study aimed to evaluate the accuracy of most commonly employed allometric models for estimating aboveground biomass (AGB) in miombo woodlands, and to develop new models that enable more accurate estimation of biomass in the miombo woodlands. A generalizable mixed-species allometric model was developed from 88 trees belonging to 33 species ranging in diameter at breast height (DBH) from 5 to 105 cm using Bayesian estimation. A power law model with DBH alone performed better than both a polynomial model with DBH and the square of DBH, and models including height and crown area as additional variables along with DBH. The accuracy of estimates from published models varied across different sites and trees of different diameter classes, and was lower than estimates from our model. The model developed in this study can be used to establish conservative carbon stocks required to determine avoided emissions in performance-based payment schemes, for example in afforestation and reforestation activities.

1. Introduction

The miombo is the largest continuous dry deciduous forest in the world. It extends across much of Central, Eastern and Southern Africa including parts of Angola, the Democratic Republic of Congo, Malawi, Mozambique, Tanzania, Zambia and Zimbabwe [1]. The woodlands are rich in plant diversity and have the potential to contain a substantial amount of carbon, up to 39.6 Mg ha1 in aboveground biomass [2,3,4]. Though this is only 20% of Sub-Saharan African equatorial forests, which are estimated to stock between 72 and 152 tonnes of carbon per hectare [5], this carbon pool could be significant considering that miombo covers 2.7 million km2 [6]. However, there is significant uncertainty in the amount of biomass carbon in miombo woodlands; only a few studies report reliable estimates, making the estimation of carbon balance within the ecosystem uncertain.
The miombo woodland vegetation is highly heterogeneous [1,7,8], a phenomenon that makes it difficult to assess biomass. The density, patch size and shape (configuration) of tree stands are heavily influenced by variations in environmental conditions and human-induced disturbance factors (e.g., selective harvesting, frequent fires and grazing). These factors reshape the community structure and geometry of individual trees [9]. Naturally, there are distinct woodland types, such as wet miombo and dry miombo, with different floristic characteristics [6]. Most are dominated by Brachystegia, Julbernardia and Isoberlinia, but others are dominated by Colophospermum mopane (Benth.), Vachelia, Combretum, and Terminalia. In addition to the natural variations, the miombo woodlands have also undergone changes due to heavy use for supply of wood fuel. Carbon stocks in the miombo woodlands show spatial variability because of these differences in growth conditions and species composition [10].
Efforts to integrate information on the miombo woodlands’ carbon stocks in national forest assessment programs are often limited by a lack of BEMs. Biomass models present advantages for biomass estimation because of their capacity for non-destructive estimation, which, when developed, yields high accuracy, applications over large areas of calibration, and a potential for follow-up measurements. Biomass models are typically developed and tested from destructive sampling, although there have been recent attempts with non-destructive approaches such as fractal branch analysis [11]. A large number of BEMs have been developed for sub-Saharan Africa from destructive harvest data [12], with models archived in the GlobAllomeTree database [13]. The wide range of BEMs presents challenges to users including the choice between: (1) existing models and developing new ones; (2) species-specific and mixed-species models; (3) simple bivariate power-law functions and models with multiple predictors; and (4) single predictors (e.g., DBH) and groups of predictors (e.g., DBH in combination with height, and/or wood density) [14]. Ultimately, the choice of model affects the accuracy of the resultant carbon estimates. This study builds on those discussions to address the challenge of choosing between existing models and developing new ones.
A study by Kuyah et al. [15] reported a general lack of biomass models for tree species and environmental conditions in Malawi, possibly because earlier efforts in the region were directed towards wood volume models [16,17]. Of the more than 800 models reviewed by Henry et al. [12], only 21 volume models (thirteen species specific and eight generalized) are available for Malawi. These models thoroughly cover the species commonly found in the miombo woodland, i.e., Brachystegia boehmii (Taub.), Brachystegia floribunda (Benth.), Brachystegia spiciformis (Benth.), Brachystegia utilis (Hutch. & Burtt Davy), Julbernardia paniculata (Benth.) and Pterocarpus angolensis (DC.). However, they focused mainly on the bole and the merchantable compartments, and estimate biomass through conversion of modeled bio-volume using wood density. Estimation of biomass in the country therefore largely relies on general purpose models cited in Brown [18,19,20], and those from neighboring miombo countries such as Mozambique [21], and Tanzania [8,22,23].
The lack of BEMs can constrain a country’s ability to develop a database on the biomass available within and outside forests, the potential to participate in the global carbon trade through Reducing Emission from Deforestation and Forest Degradation (REDD+), and the national obligation to communicate to the United Nations Framework Convention on Climate Change emissions and removals from all sources and sinks. There is need therefore to either identify appropriate allometric models from the literature or develop new valid models that account for the diversity of trees within the miombo woodland ecosystem in Malawi. We develop a simple diameter-based power-law model for estimating aboveground biomass in the miombo woodlands and associated land use systems. We further demonstrate how the model compares with existing regional models commonly used in the miombo eco-region of southern Africa.

2. Materials and Methods

2.1. Study Site

The study was conducted in the districts of Kasungu, Salima and Neno in Malawi. Kasungu and Salima are located in the central region while Neno is located in the southern region of Malawi. Table 1 provides a detailed description of the location, climatic conditions and edaphic characteristics of each site.
Table 1. Biophysical and climatic characteristics at the study areas in the districts of Kaungu, Salima and Neno.
DistrictLocationAltitude (m)Rainfall (mm) *Rainfall PeriodAnnual Temperature (°C)
MinimumMaximum
Kasungu12°48′ S, 33°21′ E1020–1130800–1000November–April1224
Salima13°40′ S, 34°17′ E520–6401000–1200October–May19.629.2
Neno15°31′ S, 34°41′ E320–730<800November–March832
* Mean annual rainfall source: http://www.metmalawi.com/climate/climate.php.
The natural vegetation across the three sites consists mainly of miombo woodland interspersed with marsh and grassy river channels in Kasungu, scattered fallows with dry grasslands in Salima, and montane grassland in Neno. The three sites are characterized by declining tree cover, particularly on communal land. Reducing tree cover is attributed to increasing pressure from agricultural expansion from an increasing population. Trees are also felled for wood fuel and charcoal, which supplies most of the domestic energy needs, for curing bricks in Neno, and for curing and construction of tobacco-curing structures in Kasungu.

2.2. Selection of Trees for Harvesting

Trees for building allometric models were sampled from three 10 km × 10 km sites located in the districts of Kasungu, Salima and Neno. The sites are part of 100 km2 benchmark designed by the Africa Soil Information Service (AfSIS) for surveillance of land degradation in Malawi [24]. Each 100 km2 site is divided into 16 clusters of 2.5 km × 2.5 km; each cluster has 10 randomly placed centroids that can be used to draw plots. Out of the 10 centroids per cluster, 3 centroids were randomly selected and located using a GPS device. Plots measuring 30 m × 30 m were drawn for selected centroids, and an inventory of all trees within the plot boundary generated. This inventory was used to inform the diversity of species and sizes, and to create the list of trees for destructive sampling.
Trees inventoried in each site were grouped into six diameter classes of below 10 cm, between 10–20, 20–30, 30–40, 40–50, and above 50 cm to cover the entire range of sizes spanned by the trees in the area. A randomized pre-sample of trees from each site was generated from the inventory list with respect of the stratified diameter class. Trees to be harvested were chosen through a blind selection without tree species association. In addition to random selection of trees for harvesting in each diameter class from the inventory list, larger trees which could not be found in the inventoried plots were purposively sought in the landscape. Tree DBHs (measured at 1.3 m above the ground) greater than 2 cm were considered for harvesting. The lower DBH threshold of 2 cm was adopted to take into account the high number of low biomass trees in the study [25,26].

2.3. Tree Measurements and Biomass Sampling

A total of 88 trees ranging in DBH from 5.1 to 105 cm were harvested in 28 plots: 6 plots in Kasungu, 17 plots in Salima, and 5 plots in Neno. There were 33 species of tree. A summary of the characteristics of the dataset are presented in Table 2. The DBH of each tree was measured using diameter tape. The diameters were determined over-bark to the nearest 0.1 cm, with the tape held horizontally and tightly at the stem. Trees with abnormalities, including multi-stemmed trees were measured using guidelines described by West (2009). To determine the crown area, the largest extension of the crown was visually identified, and the crown edge of tall trees was located using a clinometer and a percent scale. The crown diameter was measured twice with a measuring tape: the crown diameter at its widest point (l), and the distance directly perpendicular to the maximum extension, at the same height (w). The crown area (CrA) in m2 was then calculated using the formula of an ellipse:
C r A = π × ( l 2 ) × ( w 2 )
The species name was recorded, and, when scientific names could not be established in the field, the local name was provided by the local people who participated in the data collection.
Selected trees were felled by cutting at the lowest possible point using a chainsaw. The length of the felled tree was measured along the longest axis with a measuring tape. This measurement was used as the total tree height in the analysis. Felled trees were separated into stem, branches and twigs (leaves and small branches). The stem and larger branches were cut into smaller pieces of approximately 1 m in length. The fresh weights of the smaller stem and branch sections, as well as that of the leaves, were determined in the field on a 300-kg weighing scale to the nearest 0.1 decimal.

2.4. Sub-Sampling and Drying

Sub-samples were taken from the stems, branches and twigs for the determination of their fresh weight in the field and dry weight in the laboratory. Three discs, about 3 cm thick, were taken around the DBH, at the middle of the stem and towards the end of the stem axis. Similarly, three small discs, about 3 cm thick, were cut from the main branches at the proximal, middle and end of the branch. The three discs were taken across the stem and branch axis to account for possible variation in wood density. The samples were weighed on a 3 kg balance, labeled and transported to the laboratory for dry weight determination. In the laboratory, the labeled samples were put in the oven and allowed to dry for about 24 h at 105 °C [27]. Samples were subsequently removed from the oven and weighed to establish any change in weight, after which the dry weight was recorded. The ratio of sub-sample dry weight to fresh weight was used to convert component fresh weight to dry weight.
Table 2. Summary of variables measured and biomass of trees harvested across the three sites in Malawi. CV is the coefficient of variation.
SiteNo of TreesDBH (cm)Height (m)Crown Area (m2)Aboveground Biomass (kg)
Range MeanCV%Range MeanCV%Range MeanCV%RangeMeanCV%
Kasungu215.1–55.818.868%3.3–15.77.939%0.1–114.732.4104%4.3–1967.6254.0174%
Salima476.5–10538.965%4.1–24.211.145%2.1–397.2100.195%6.2–5357.8806.5143%
Neno206.8–74.629.161%4.2–19.89.844%3.5–236.882.083%6–2554.5548.1125%

2.5. Development and Evaluation of Biomass Models

The total biomass of aboveground woody parts and the DBH of each tree were used to fit regression models to the logarithmic form (Model 2), or to the power-law function (Model 3), where a and b, respectively, are the proportionality and power coefficients of the models. The models were built for aboveground biomass with DBH alone as the predictor variable (Model 2), DBH in combination with the height (Model 4), and DBH in combination with the crown area (Model 5).
ln ( A G B ) = ln ( a ) + b ( l n D B H )
AGB = aDBH b
ln ( A G B ) = ln ( a ) + b ( l n D B H ) + c ( l n H )
ln ( A G B ) = ln ( a ) + b ( l n D B H ) + c ( l n C r A )
Allometric coefficients for biomass models were estimated from the data using hierarchical Bayesian analysis, and compared with those constructed using ordinary least squares (OLS) regression. In the hierarchical Bayesian, the analysis included a hierarchical structure to explicitly account for the nested structure of the dataset, i.e., trees nested within sites to account for dissimilarities among the sites in climate (Table 1) and vegetation structure (Table 2). Bayesian analysis was chosen because violation of statistical assumptions of error can lead to biased point estimates if OLS or maximum likelihood estimation are applied, especially with small samples [14]. Bayesian estimation methods need a much smaller sample size to estimate parameters accurately [28], and the hierarchical Bayesian approach has recently been proposed for estimating allometric parameters [29,30]. Unlike the traditional approaches, in the Bayesian framework, the model parameters are treated as random variables, and inferences are based on their posterior distributions given the data. Thus, the conditional probability of a, b and the dispersion parameter (φ) were estimated from the posterior distribution of samples using the GENMOD procedure of the SAS system. GENMOD uses a Markov Chain Monte Carlo simulation by Gibbs sampling to simulate samples from posterior distributions. By default, GENMOD assumes a uniform prior distribution on the regression coefficients. Since we did not have prior knowledge of the distribution of a and b, we compared various non-informative priors (normal, uniform, Jeffrey’s) and decided on the one that gave the smallest deviance information criterion (DIC). We assumed the prior distribution of φ to be inverse gamma and we monitored convergence by running two chains with initial values of the parameters from the maximum likelihood estimation. We specified a burn-in period of 5000 iterations, and additional numbers of Monte Carlo chains (NMCs) ranging from 10,000 to 500,000 after each burn-in depending on the diagnostics (Gelman-Rubin, Geweke, Raftery-Lewis and Heidelberger-Welch). In some instances, the Raftery-Lewis diagnostic indicated failure to produce a valid first-order Markov chain in the posterior samples of the parameters after 100,000 NMCs. Therefore, the NMC was increased until the test passed the set criteria. The parameter estimates and their credible intervals were considered valid only when the analysis passed all the diagnostics.
The literature was reviewed to identify potentially suitable biomass models from countries with agro-ecological settings similar to Malawi. Only power-law models with information on the sample size, the range of diameters and the tree components included in building the allometry were selected for evaluation. These descriptive metadata were considered important since they indicate the valid range within which the models can be used. Table 3 provides a summary of biomass models considered useful, while noting that the differences in ecological conditions of the source data could be a major cause of bias in the application. The accuracy of published and developed models was evaluated by calculating the mean relative error (MRE), the root mean square error (RMSE), and the mean absolute percentage error (MAPE) in the total biomass of the harvested trees. Better models have lower MRE, RMSE, DIC, and MAPE.
Table 3. Allometric models commonly used for estimating aboveground biomass (ABG) in the miombo woodlands.
AuthorAllometric ModelNDBHCountryMRERMSEMAPE
Chamshama et al. [22]AGB = 0.0625 × DBH2.553301–50Tanzania1793736.4
Chidumayo [8] Model 1AGB = 0.0446 × DBH2.7651132–39Zambia50149158.3
Chidumayo [8] Model 2AGB = 0.0799 × DBH2.55531132–39Zambia73258480.8
Mugasha et al. [23]AGB = 0.1027 × DBH2.47981671.1–110Tanzania50127856.5
Brown [18]AGB = 0.1359 × DBH2.2320285–40Global dry forests1750632.7
Ryan et al. [21] *AGB = 0.0265 × DBH2.601295–73Mozambique24116941.6
N is the number of trees (sample size) used for constructing the model; MRE is the mean relative errors, RMSE is the root mean square error, and MAPE is the mean absolute percentage error; * Calculate the mass of carbon in the trees. The estimate is therefore multiplied by 2.13 (1/0.47) to obtain dry mass of trees.

3. Results and Discussion

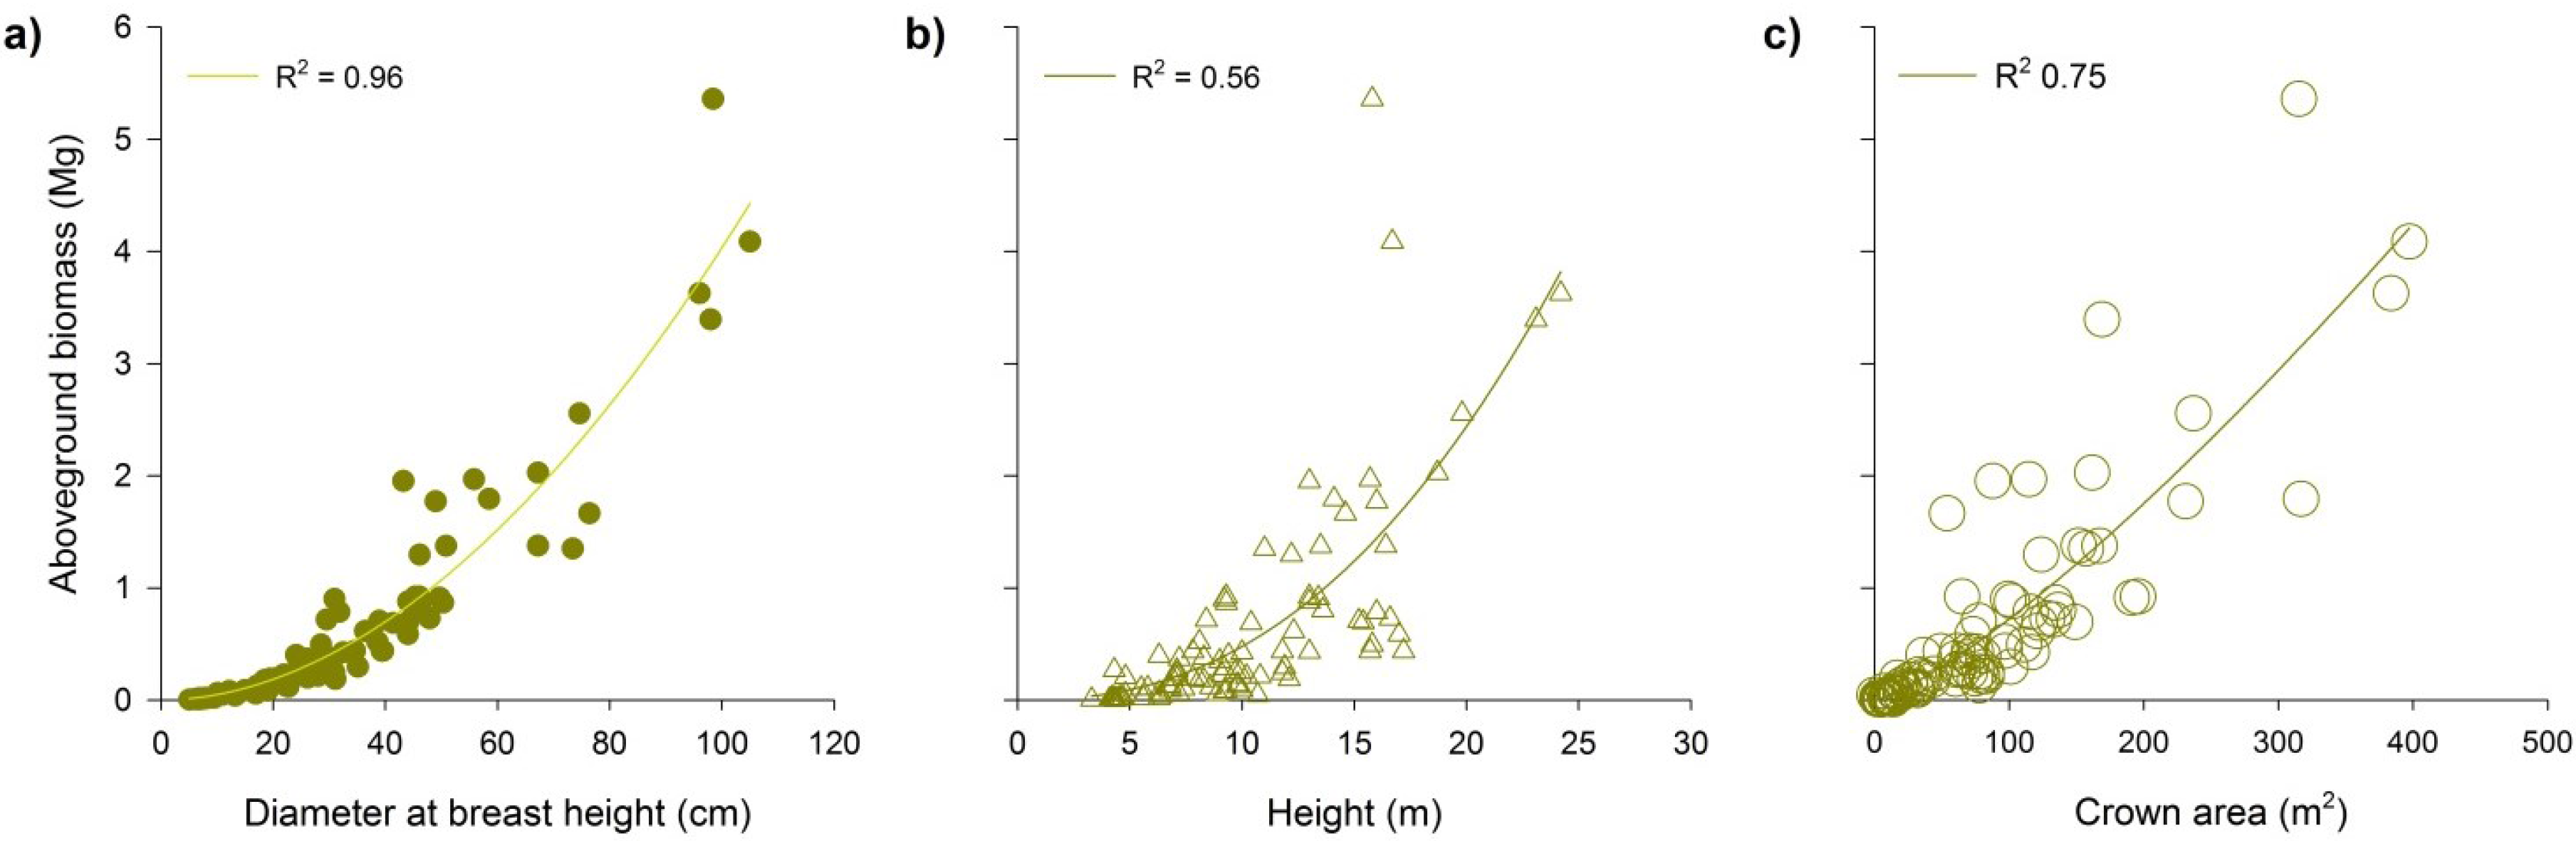
3.1. Relationship between Aboveground Biomass and Predictor Variables

Trees harvested for development of allometric models thoroughly captured the variability of the miombo woodland vegetation in Malawi in terms of species diversity and tree sizes. This is important because the parameters of allometric models (a and b) have been shown to vary with tree species and ecological conditions [29]. It has been recommended that allometric models be developed using a dataset of about 50 sample trees because sample sizes below this lead to underestimation of the allometric exponent [14]. The sample size used was considered adequate to develop a generalizable model that is applicable to a large set of species of different sizes across the miombo woodland in Malawi.
The diameter at breast height was significantly correlated with the aboveground biomass of harvested trees, accounting for over 95% (p < 0.001) of the variation in aboveground biomass for trees harvested across the three sites (Figure 1a). The scatter plots of height and crown area against aboveground biomass show positive correlation, but also reveal greater variance compared to those of DBH (Figure 1b,c). The positive correlation observed between tree height or crown area and aboveground biomass is expected because of a fundamental allometric scaling law that operates between these variables. The greater variance between the height/crown area and aboveground biomass scatter is attributed to the variable tree height and crown area, even for trees of the same diameter class and species. This variation can be explained by differences in environmental condition and the historical disturbance levels at the different sites. For example, extraction of wood for fuel and charcoal production, livestock grazing and conversion of woodlands to cultivated fields are the main factors that change community structure and geometry of individual trees in the miombo [7,8,31].
Figure 1. Relationships between aboveground biomass and diameter at breast height (a); height (b); crown area (c).
Forests 07 00013 g001

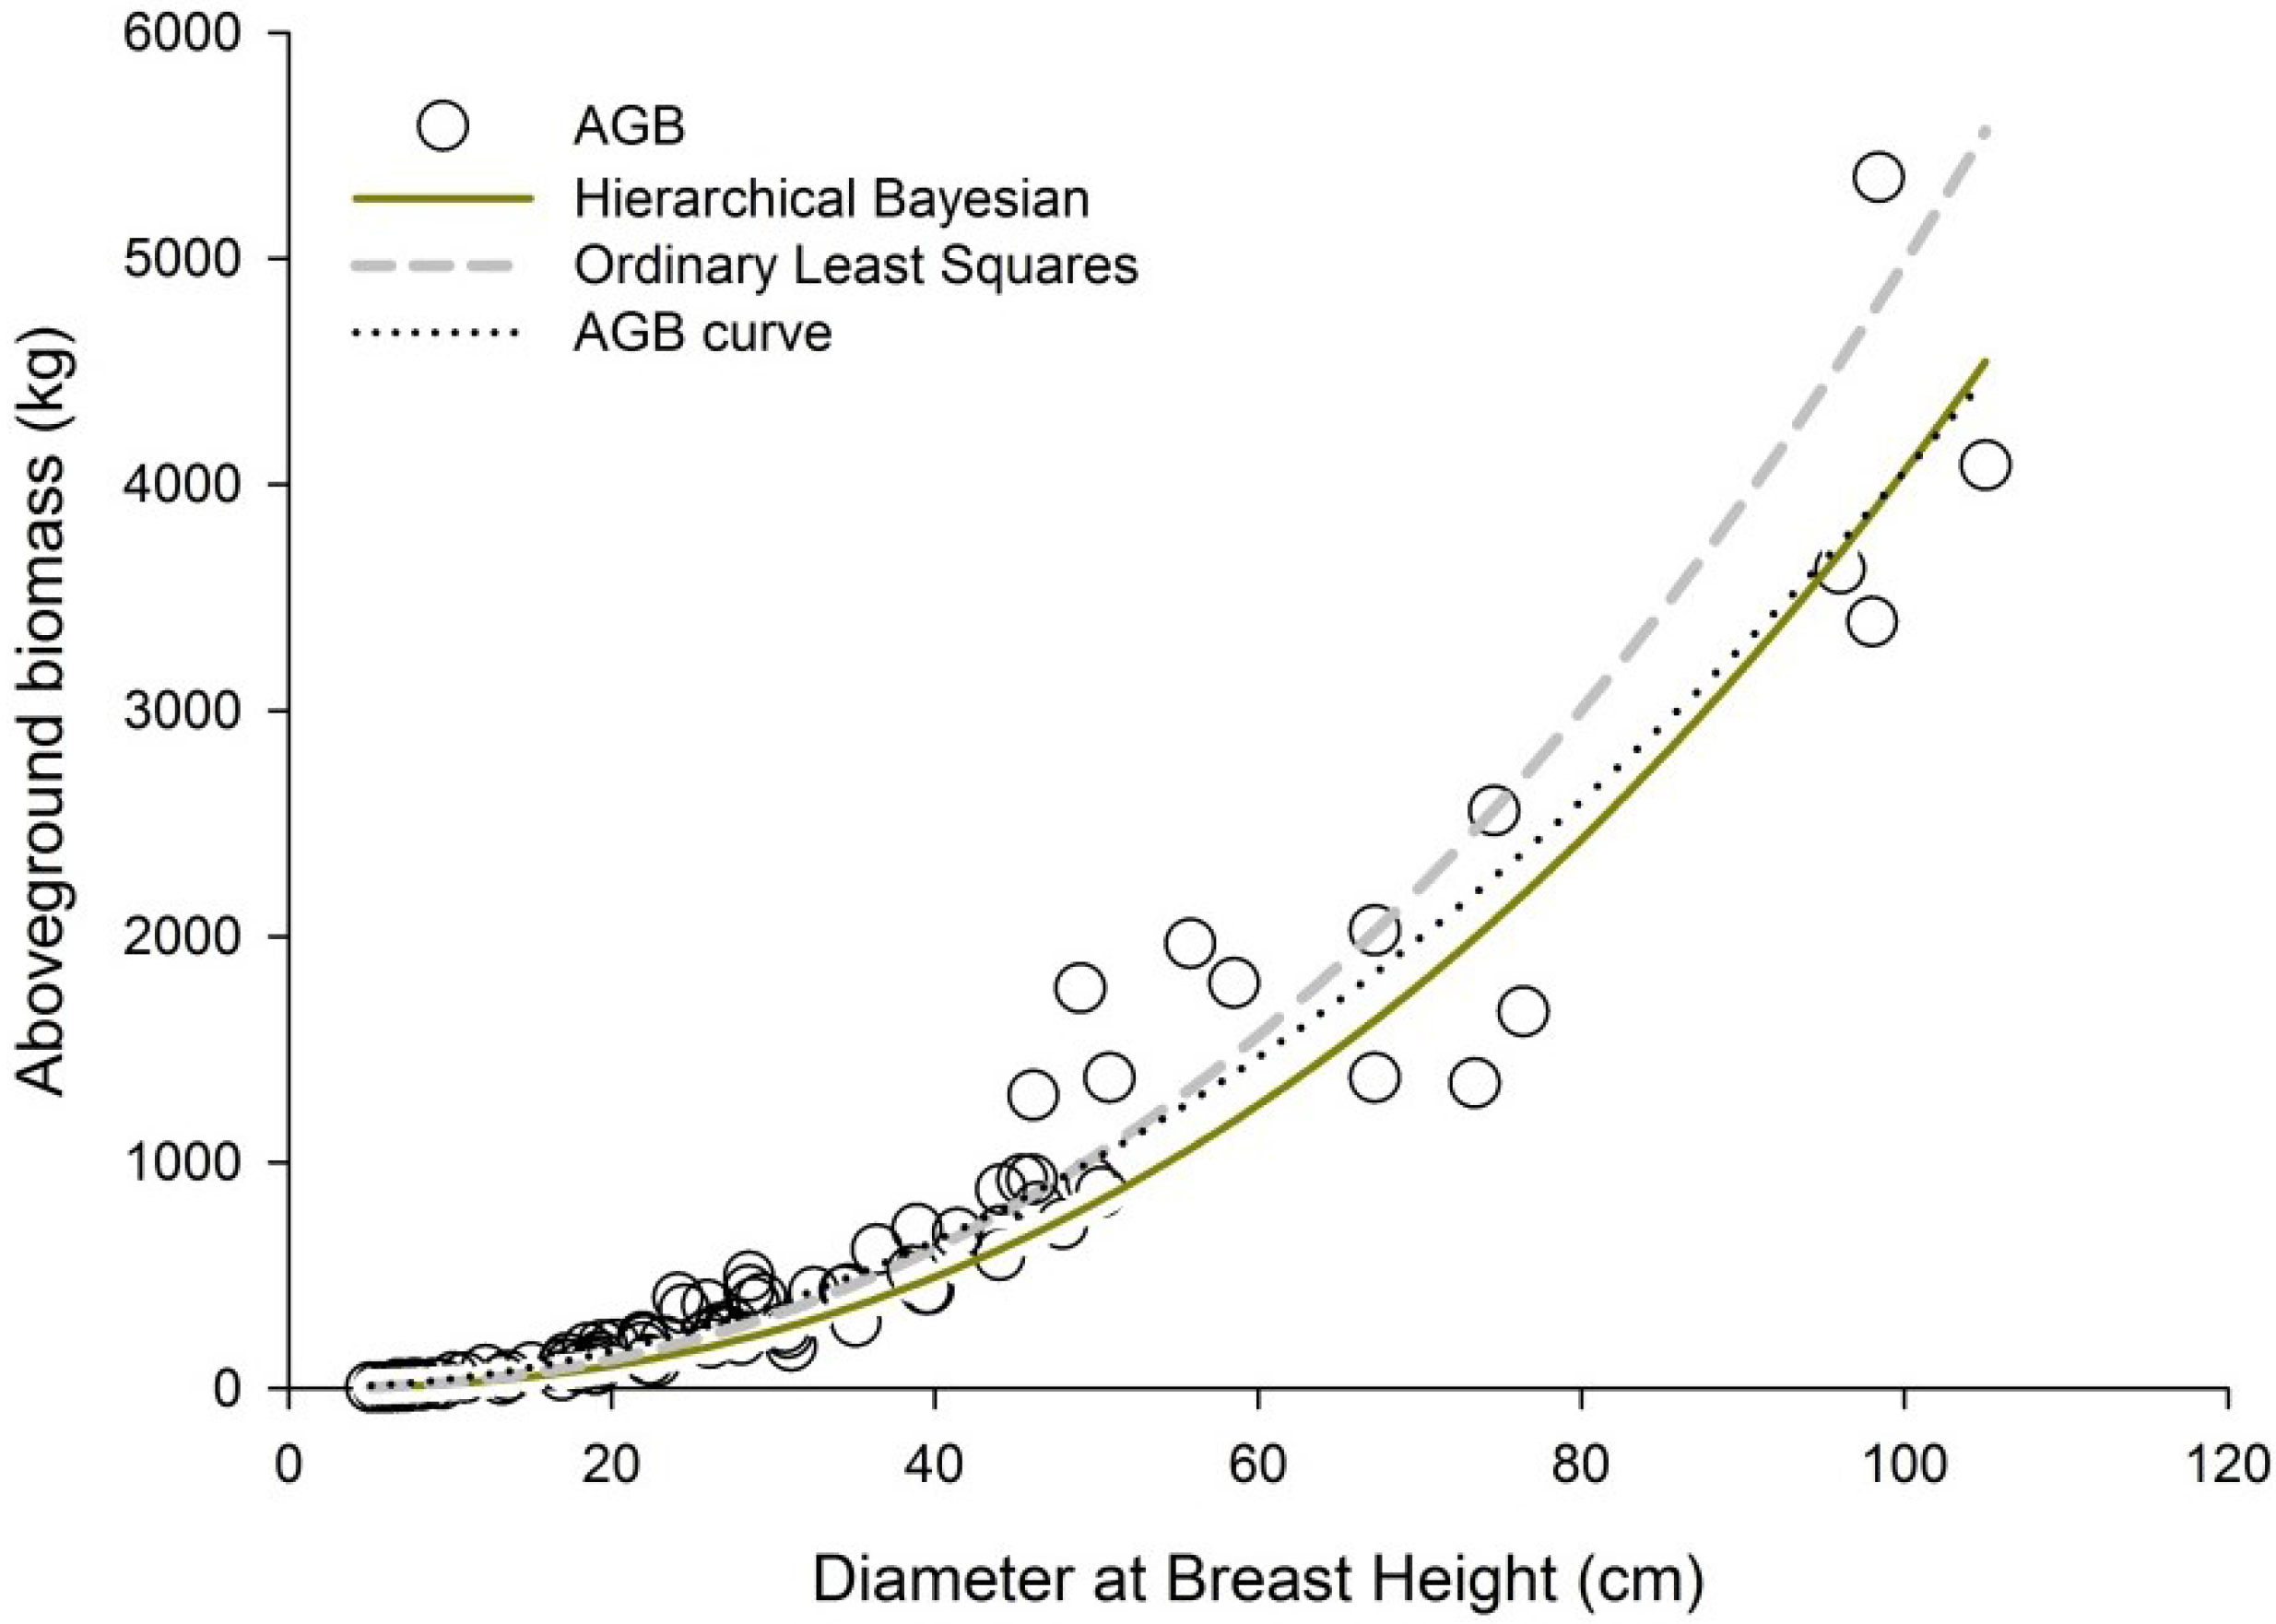
3.2. Performance of New Allometric Models

Generalizable allometric models were developed for estimating biomass in the miombo woodlands in Malawi (Table 4). Evaluation of the models indicates that the quality of biomass estimates varies among models and depends on how the models are developed. A common approach to developing allometric models is to regress total tree biomass or the biomass of components against the DBH using ordinary least squares. A major limitation with such simple linear regression is heteroscedasticity—the variation in tree weight increases with increasing diameter. The data are therefore log transformed, although back transformation of logarithmic values to arithmetic units introduces bias that must be corrected [32]. Model development techniques, such as the hierarchical Bayesian approach, have been recommended for circumventing many problems involved in allometry development [14]. In this study, the Bayesian method performed better compared to ordinary least square regression. The DIC of 59.02 for the model built with ordinary least squares (Model 2) was larger than 51.04 for Bayesian (Model 1). The MAPE of 27.98% for ordinary least squares was larger than MAPE of 27.20% for Bayesian. This means that the Bayesian estimation is more accurate because even a small difference in absolute terms in the performance of two models indicates a better performance. Figure 2 also indicates that the model built using ordinary least squares tended to overestimate aboveground biomass. Previous studies have shown that the Bayesian approach provides a robust approach for estimating allometric coefficients [29,30].
Table 4. Parameter estimates and Bayesian posterior credible intervals (CI) for biomass estimation models developed in this study. Allometric models for the parameter estimates of respective models are AGB = 0.102 * DBH2.242 (Model 1), AGB = 0.143 * DBH2.271 (Model 2), AGB = 0.134 * DBH2.187 (Model 3), AGB = 0.159 * DBH2.150 (Model 4), AGB = 0.148 * DBH2.019 (Model 5).
ModelParameter EstimateDICMREMAPEVIF
Intercept (CI)lnDBH (CI )lnH (CI)lnCrA (CI)
1−2.284 (−2.635, −1.933)2.300 (2.242, 2.438) 51.04−17.3427.20
2−1.946 (0.158)2.271 (0.048) 59.025.3427.98None
3−2.013 (−2.350, −1.683)2.187 (2.00, 2.368)0.154 (−0.137, 0.452) NS 59.965.4127.94Acceptable
4−1.838 (−2.180, −0.494)2.150 (1.967, 2.334) 0.0747 (−0.023, 0.173) NS58.765.3127.54Acceptable
5−1.910 (−2.255, −1.565)2.019 (1.762, 2.276)0.203 (−0.084, 0.491) NS0.087 (−0.009, 0.183) NS58.845.0727.24Moderate
Model 1–2 are built from the diameter at breast height (DBH) alone using Bayesian and least square regression, respectively. Models 3–5 were built with DBH in combination with height and crown area (CrA) using Bayesian methods. The criteria for the choice of model included the deviance information criterion (DIC), mean absolute percentage error (MAPE) and variance inflation factor (VIF). represents the 95% credible intervals in Model 1,2, 3–5 and the standard error of the parameter estimate in Model 2. NS Parameters are not significantly different from zero.
Figure 2. Performance of biomass models developed using ordinary least squares and hierarchical Bayesian methods. AGB curve represents a trend line fit against harvested aboveground biomass (AGB).
Forests 07 00013 g002
The power law model (Model 1) was better than the polynomial model with DBH and square of DBH. Model diagnosis showed that parameters of Model 1 were stable, and there were also not many outliers and influential observations as indicated by studentized residuals. The scaling exponent of this model is close to the theoretical value of the Metabolic Scaling Theory (8/3) [30]. The use of power law models is supported in the literature because they are simple to construct and use, and their parameters have biological meaning [33,34]. Although polynomial regression models with DBH and square of DBH (not shown) present lower DIC (48.83), diagnostics showed that the model was unstable, as indicated by highly inflated variance (variance inflation >10) and the standard error for ln(DBH2).
Model 1 with DBH alone as the predictor variable was also better than models that include height and crown area as additional predictor variables (Table 4). The null hypothesis that parameter estimates for height and crown area are not significantly different from zero could not be rejected. Inclusion of these variables in the DBH model also did not substantially reduce the MAPE; instead, the bias (MRE) changed from underestimation to overestimation. The parameters of models with height and crown area were also unstable due to large values of influence statistics. Our findings that height and/or crown area does not substantially improve the predictive power of diameter models contradict recent findings in Peru, which show that crown radius greatly improves model performance, especially for the largest trees [35]. The majority of allometric models in the miombo ecoregion use DBH as the sole predictor variable, e.g., Chamshama et al. [22], Ryan et al. [21] Chidumayo et al. [8] and Mugasha et al. [23]. There are few models that include height as a second variable to DBH, e.g., Chamshama et al. [22]. The lack of models that include height and crown area may be attributed to difficulties associated with measuring these variables and an inability to measure them accurately—errors are pronounced for taller trees and trees with intersecting crowns [36]—and to the marginal value in improving the accuracy of allometric models when included as predictor variables along with DBH [33,37].

3.3. Performance of Published Allometric Models

Published models overestimated biomass with an MRE between 17% and 73%, and biomass with a MAPE between 33% and 81% (Table 3). The accuracy of the models varied across the evaluated sites and trees of different diameter classes (Figure 3). In the absence of local or country-specific allometric models, mixed species models by Chamshama et al. [22] and Ryan et al. [21] appear as the most appropriate for estimating aboveground biomass in Kasungu and Neno, which were both dominated by small diameter trees. Breaking down the error into DBH size classes showed that all published models overestimated biomass with a greater bias in trees with a DBH greater than 30 cm. The model by Brown [18] was best for trees with a DBH between 10 and 30 cm in diameter.
Figure 3. The mean relative error and mean absolute percentage error of the models applied to each of the sites and the trees of different size class.
Forests 07 00013 g003
Published models overestimated biomass in Salima and larger diameter class, indicating that models should be used within their DBH range. For example, 38% (18 out of 47) of the trees from Salima exceeded the maximum DBH of trees used to build the models by Brown [18] and Chidumayo [8] (Table 3). This demonstrates the need to consider the DBH range in applying biomass models—applying models outside their DBH range will result in bigger errors, especially for the larger trees. Information on error breakdown is important since uncertainty in the resultant biomass depends on the size of the tree, and the individual trees of a particular size. For example, though the small diameter trees hold a small fraction of biomass in most landscapes [15,33], their contribution is significant when aggregated in areas where they occur in large number. Selection of models can therefore be informed by uncertainty introduced in the biomass estimated in trees of different diameter classes.

4. Conclusions

The power law model with DBH alone as the predictor variable developed using the Hierarchical Bayesian performed better than both the polynomial model with DBH and models that include height and crown area as additional predictor variables. The model can be used to establish conservative carbon stocks required to determine carbon sequestration in performance-based payment schemes, for example in afforestation and reforestation activities. This model should be evaluated for its applicability across land-use systems where logging and extensive extraction for fuel wood and wild fire are known to affect the structure of trees in the miombo woodlands.

Acknowledgments

This work was supported with funding from the CGIAR research program on Climate Change, Agriculture and Food security (CCAFS) and the Standard Assessment of Agricultural Mitigation Potential and Livelihoods (SAMPLES) program through the World Agroforestry Centre (ICRAF). The authors would like to thank Daniel Manduwa for coordinating data collection exercise, the workers who helped with measurement and destructive sampling, and community leaders for their support during field work.

Author Contributions

Shem Kuyah and Gudeta W. Sileshi conceptualized the research design, site selection and data analysis. Shem Kuyah conducted field data collection, processing and laboratory analysis. Shem Kuyah, Gudeta W. Sileshi and Todd S. Rosenstock contributed to the writing of the manuscript.

Conflicts of Interest

The authors declare no conflict of interest.

Appendix

Appendix I. Elements of the 94 trees harvested in three 10 × 10 blocks in Kasungu, Neno and Salima in Malawi. Eighty-eight trees were used to develop and test allometric equations for estimating aboveground biomass (AGB) in miombo woodlands. Entries with an asterisk were identified as outliers during the analysis.
SiteSpecies NameDBH (cm)Height (m)Crown Area (m2)Biomass (kg)
StemBranchTwigsAGB
KasunguBauhinia thonningii5.14.35.113.410.450.454.31
Zanha africana5.63.32.273.180.960.584.73
Bauhinia thonningii6.14.23.963.230.800.724.76
Antidesma venosum7.64.37.7811.634.390.5116.53
Bauhinia thonningii7.84.29.116.1611.991.3219.47
Diplorhynchus condylocarpon9.56.32.9715.151.701.2218.07
* Brachystegia utilis10.16.315.2241.2515.594.3061.15
Julbernardia paniculata10.27.216.9825.2216.078.1249.41
Brachystegia spiciformis10.910.70.0934.338.103.3245.75
Diplorhynchus condylocarpon12.29.26.8322.3040.0016.6078.90
Brachystegia spiciformis13.26.410.7525.462.6710.5338.66
Brachystegia utilis19.19.818.7370.6435.6214.65120.91
S. cauescens19.46.937.3292.8189.476.61188.89
Bauhinia petersiana21.98.126.41106.6767.187.65181.50
Julbernardia paniculata21.99.132.68134.5873.8016.56224.93
Bauhinia thonningii22.010.280.1192.47107.5110.14210.13
Brachystegia utilis24.19.436.19122.33237.6439.83399.80
Bauhinia petersiana25.87.144.15109.59117.664.24231.49
Bobgunnia madagascariensis25.97.259.9782.58265.2319.69367.50
Terminalia sericea27.59.262.67130.40135.5116.66282.58
* Khaya anthotheca30.99.299.35314.56556.7927.60898.95
* Senna siamea31.816.0115.92282.60479.0523.27784.93
Ficus capensis44.113.0102.10219.14626.6632.66878.47
Khaya anthotheca55.815.7114.72939.03901.38127.191967.60
NenoAcacia nigrescens19.29.820.7395.1645.130.00140.30
Combretum fragrans6.85.610.1515.50 0.8916.39
Diplorhynchus condylocarpon6.84.43.464.820.650.485.95
Combretum fragrans7.34.212.533.752.911.017.66
Philenoptera violacea8.24.59.017.133.862.5613.55
Anisophyllea boehmii17.26.877.7457.1466.337.22130.68
Combretum fragrans18.06.822.7856.0325.146.4287.58
Combretum fragrans18.58.342.8872.3694.1711.61178.14
Anisophyllea boehmii20.27.174.6665.2990.1535.67191.11
Terminalia sericea26.77.165.74117.81127.9119.63265.36
Piliostigma thonningii28.88.369.3999.84277.94 377.77
* Terminalia sericea29.58.4133.24185.02463.5267.92716.46
Celtis durandii34.413.075.23271.52158.82 430.34
Celtis durandii34.611.896.76203.75233.62 437.38
Celtis durandii35.111.9101.08211.1083.74 294.84
Celtis durandii38.915.277.31451.82253.18 705.00
Sclerocarya caffra41.410.4122.52275.12345.7164.86685.68
* Acacia nigrescens43.213.087.65456.88666.88827.521951.27
Sclerocarya caffra46.112.2123.65582.75633.8477.851294.44
Sclerocarya caffra49.016.0230.99570.341144.0155.911770.26
Sclerocarya caffra50.813.5167.13485.08833.1456.101374.31
Celtis durandii74.619.8236.801177.871376.60 2554.47
* Sterculia africana76.011.986.56603.34637.29 1240.64
SalimaAlbizia harveyi6.54.113.954.13 2.046.16
Cassia spectabilis7.94.72.1410.78 6.9717.76
Philenoptera violacea8.24.33.969.172.182.0113.36
Piliostigma thonningii9.04.611.9510.46 10.2020.65
Bauhinia spp13.64.816.2419.9419.7314.5154.17
Nchezime15.010.031.6577.22 11.9589.17
Faidherbia albida16.98.919.2342.35 13.8856.24
Combretum fragrans17.05.833.5139.8154.0315.14108.98
Combretum fragrans17.47.430.6663.0022.8018.26104.07
Faidherbia albida19.09.314.4551.05 29.8180.87
Kigelia aethiopica19.05.520.4052.0532.8819.33104.26
Piliostigma thonningii22.36.730.6867.9641.3414.62123.92
Sclerocarya caffra22.78.626.6467.9634.0713.90115.93
Mangifera indica23.34.835.7439.32135.2831.44206.04
Bauhinia spp24.59.072.3591.02200.2057.14348.37
Philenoptera violacea26.17.816.82128.9643.6825.54198.17
Acacia polyacantha26.69.770.8587.93161.13 249.07
Acacia polyacantha27.39.978.0496.18125.2127.41248.81
Albizia lebbeck28.010.883.20125.4970.5317.60213.62
Kigelia pinnata28.57.849.07152.42242.7039.45434.57
Nchezime28.515.8111.23289.11182.5022.23493.83
Bauhinia spp29.36.380.58125.97219.2351.88397.09
Piliostigma thonningii30.74.361.5099.18127.5639.65266.39
Albizia lebbeck30.911.883.13161.3465.1216.80243.26
Faidherbia albida31.112.160.08110.4261.5413.69185.65
Acacia polyacantha32.510.0116.77199.62188.9835.04423.64
Acacia polyacantha36.412.3120.87306.70271.3935.41613.50
Sclerocarya caffra38.68.196.70205.85271.0842.03518.96
Faidherbia albida39.415.770.12232.24160.9044.08437.22
Faidherbia albida39.617.261.43297.39113.7326.14437.25
Faidherbia albida44.017.072.98354.88196.0635.39586.33
Faidherbia albida44.115.4148.94375.38249.3670.69695.43
Albizia lebbeck45.413.0195.78279.41579.4462.78921.62
Kigelia aethiopica46.09.365.05324.12531.1667.24922.52
Sclerocarya caffra46.413.6136.46578.18156.6766.22801.07
Faidherbia albida47.916.6128.21389.47260.1177.01726.59
Albizia lebbeck49.713.4191.01430.27416.7363.53910.53
Sclerocarya caffra50.39.3134.40271.75501.6693.85867.26
Acacia polyacantha58.514.1316.86814.47942.1734.801791.44
Faidherbia albida67.216.4151.62527.68686.63160.511374.82
Faidherbia albida67.218.7161.57790.381029.40205.532025.30
Pterocarpus angolensis73.411.0157.02 1309.0440.401349.44
Kigelia aethiopica76.414.653.98728.05889.0647.481664.59
Faidherbia albida96.024.2383.471989.511570.4064.223624.12
Faidherbia albida98.023.1168.962028.051156.51207.613392.16
Sclerocarya caffra98.415.8315.262166.893008.87182.035357.80
Faidherbia albida105.016.7397.221938.551986.92159.304084.76

References

  1. Campbell, B. The Miombo in Transition: Woodlands and Welfare in Africa; Center for International Forestry Research (CIFOR): Bogor, Indonesia, 1996. [Google Scholar]
  2. Williams, M.; Ryan, C.M.; Rees, R.M.; Sambane, E.; Fernando, J.; Grace, J. Carbon sequestration and biodiversity of re-growing miombo woodlands in mozambique. For. Ecol. Manag. 2008, 254, 145–155. [Google Scholar] [CrossRef]
  3. Munishi, P.K.T.; Mringi, S.; Shirima, D.D.; Linda, S.K. The role of the miombo woodlands of the southern highlands of tanzania as carbon sinks. J. Ecol. Nat. Environ. 2010, 2, 261–269. [Google Scholar]
  4. Kalaba, F.K.; Quinn, C.H.; Dougill, A.J.; Vinya, R. Floristic composition, species diversity and carbon storage in charcoal and agriculture fallows and management implications in miombo woodlands of zambia. For. Ecol. Manag. 2013, 304, 99–109. [Google Scholar] [CrossRef]
  5. Gibbs, H.K.; Brown, S.; Niles, J.O.; Foley, J.A. Monitoring and estimating tropical forest carbon stocks: Making redd a reality. Environ. Res. Lett. 2007, 2, 13. [Google Scholar] [CrossRef]
  6. Frost, P. The ecology of miombo woodlands. In The Miombo in Transition: Woodlands and Welfare in Africa; Campbell, B., Ed.; Center for International Forestry Research (CIFOR): Bongor, Indonesia, 1996; pp. 11–57. [Google Scholar]
  7. Chidumayo, E.N. Changes in miombo woodland structure under different land tenure and use systems in central zambia. J. Biogeogr. 2012, 29, 1619–1626. [Google Scholar] [CrossRef]
  8. Chidumayo, E.N. Forest degradation and recovery in a miombo woodland landscape in zambia: 22 years of observations on permanent sample plots. For. Ecol. Manag. 2013, 291, 154–161. [Google Scholar] [CrossRef]
  9. Harja, D.; Vincent, G.g.; Mulia, R.; van Noordwijk, M. Tree shape plasticity in relation to crown exposure. Trees 2012, 26, 1275–1285. [Google Scholar] [CrossRef]
  10. Shirima, D.D.; Munishi, P.K.T.; Lewis, S.L.; Burgess, N.D.; Marshall, A.R.; Balmford, A.; Swetnam, R.D.; Zahabu, E.M. Carbon storage, structure and composition of miombo woodlands in tanzania’s eastern arc mountains. Afr. J. Ecol. 2011, 49, 332–342. [Google Scholar] [CrossRef]
  11. MacFarlane, D.W.; Kuyah, S.; Mulia, R.; Dietz, J.; Muthuri, C.; van Noordwijk, M. Evaluating a non-destructive method for calibrating tree biomass equations derived from tree branching architecture. Trees 2014, 28, 807–817. [Google Scholar] [CrossRef]
  12. Henry, M.; Picard, N.; Trotta, C.; Manlay, R.J.; Valentini, R.; Bernoux, M.; Saint-André, L. Estimating tree biomass of sub-saharan african forests: A review of available allometric equations. Silva Fenn. 2011, 45, 477–569. [Google Scholar] [CrossRef]
  13. Henry, M.; Bombelli, A.; Trotta, C.; Alessandrini, A.; Birigazzi, L.; Sola, G.; Vieilledent, G.; Santenoise, P.; Longuetaud, F.; Valentini, R.; et al. Globallometree: International platform for tree allometric equations to support volume, biomass and carbon assessment. iFor. Biogeosci. For. 2013, 6, 326–330. [Google Scholar] [CrossRef] [Green Version]
  14. Sileshi, G.W. A critical review of forest biomass estimation models, common mistakes and corrective measures. For. Ecol. Manag. 2014, 329, 237–254. [Google Scholar] [CrossRef]
  15. Kuyah, S.; Sileshi, G.W.; Njoloma, J.; Mng’Omba, S.; Neufeldt, H. Estimating aboveground tree biomass in three different miombo woodlands and associated land use systems in malawi. Biomass Bioenergy 2014, 66, 214–222. [Google Scholar] [CrossRef]
  16. Lowore, J.D.; Abbot, J.I.O.; Werren, M. Stackwood volume estimation for miombo woodlands in malawi. Commonw. For. Rev. 1994, 73, 193–197. [Google Scholar]
  17. Abbot, J.I.O.; Lowore, J.D.; Werren, M. Models for the estimation of single tree volume in four miombo woodland types. For. Ecol. Manag. 1997, 97, 25–37. [Google Scholar] [CrossRef]
  18. Brown, S. Estimating Biomass and Biomass Change of Tropical Forests: A Primer; Food and Agriculture Organization of the United Nations (FAO): Rome, Italy, 1997. [Google Scholar]
  19. Chave, J.; Andalo, C.; Brown, S.; Cairns, M.A.; Chambers, J.Q.; Eamus, D.; Fölster, H.; Fromard, F.; Higuchi, N.; Kira, T.; et al. Tree allometry and improved estimation of carbon stocks and balance in tropical forests. Oecologia 2005, 145, 87–99. [Google Scholar] [CrossRef] [PubMed]
  20. Chave, J.; Réjou-Méchain, M.; Búrquez, A.; Chidumayo, E.N.; Colgan, M.; Delitti, W.B.C.; Duque, A.; Eid, T.; Fearnside, P.M.; Goodman, R.C.; et al. Improved allometric models to estimate the aboveground biomass of tropical trees. Glob. Chang. Biol. 2015, 20, 3177–3190. [Google Scholar] [CrossRef] [PubMed]
  21. Ryan, C.M.; Williams, M.; Grace, J. Above- and belowground carbon stocks in a miombo woodland landscape of mozambique. Biotropica 2011, 43, 423–432. [Google Scholar] [CrossRef]
  22. Chamshama, S.A.O.; Mugasha, A.G.; Zahabu, E. Stand biomass and volume estimation for miombo woodlands at kitulangalo, morogoro, tanzania. South. Afr. For. J. 2004, 200, 59–70. [Google Scholar] [CrossRef]
  23. Mugasha, W.A.; Eid, T.; Bollandsås, O.M.; Malimbwi, R.E.; Chamshama, S.A.O.; Zahabu, E.; Katani, J.Z. Allometric models for prediction of above- and belowground biomass of trees in the miombo woodlands of tanzania. For. Ecol. Manag. 2013, 310, 87–101. [Google Scholar] [CrossRef]
  24. Vågen, T.-G.; Davey, F.A.; Shepherd, K.D. Land health surveillance: Mapping soil carbon in kenyan rangelands. In Agroforestry—The Future of Global Land Use, Advances in Agroforestry; Nair, P.K.R., Garrity, D., Eds.; Springer Science + Business Media: Dordrecht, The Nederland, 2012; Volume 9, pp. 455–462. [Google Scholar]
  25. Chaturvedi, R.K.; Raghubanshi, A.S. Aboveground biomass estimation of small diameter woody species of tropical dry forest. New For. 2012, 44, 509–519. [Google Scholar] [CrossRef]
  26. Preece, N.D.; Crowley, G.M.; Lawes, M.J.; van Oosterzee, P. Comparing above-ground biomass among forest types in the wet tropics: Small stems and plantation types matter in carbon accounting. For. Ecol. Manag. 2012, 264, 228–237. [Google Scholar] [CrossRef]
  27. Williamson, G.B.; Wiemann, M.C. Measuring wood specific gravity correctly. Am. J. Bot. 2010, 97, 519–524. [Google Scholar] [CrossRef] [PubMed]
  28. Zapata-Cuartas, M.; Sierra, C.A.; Alleman, L. Probability distribution of allometric coefficients and bayesian estimation of aboveground tree biomass. For. Ecol. Manag. 2012, 277, 173–179. [Google Scholar] [CrossRef]
  29. Price, C.A.; Ogle, K.; White, E.P.; Weitz, J.S. Evaluating scaling models in biology using hierarchical bayesian approaches. Ecol. Lett. 2009, 12, 641–651. [Google Scholar] [CrossRef] [PubMed]
  30. Tredennick, A.T.; Bentley, L.P.; Hanan, N.P. Allometric convergence in savanna trees and implications for the use of plant scaling models in variable ecosystems. PLoS ONE 2013, 8, e58241. [Google Scholar] [CrossRef] [PubMed]
  31. Abbot, J.I.O.; Homewood, K. A history of change: Causes of miombo woodland decline in a protected area in malawi. J. Appl. Ecol. 1999, 36, 422–433. [Google Scholar] [CrossRef]
  32. Beauchamp, J.J.; Olson, J.S. Corrrections for bias in regression estimates after logarithmic transformation. Ecology 1973, 54, 1403–1407. [Google Scholar] [CrossRef]
  33. Kuyah, S.; Dietz, J.; Muthuria, C.; Jamnadassa, R.; Mwangi, P.; Coe, R.; Neufeldt, H. Allometric equations for estimating biomass in agricultural landscapes: I. Aboveground biomass. Agric. Ecosyst. Environ. 2012, 158, 216–224. [Google Scholar] [CrossRef]
  34. Mate, R.; Johansson, T.; Sitoe, A. Biomass equations for tropical forest tree species in mozambique. Forests 2014, 5, 535–556. [Google Scholar] [CrossRef]
  35. Goodman, R.C.; Phillips, O.L.; Baker, T.R. The importance of crown dimensions to improve tropical tree biomass estimates. Ecol. Appl. 2014, 24, 680–698. [Google Scholar] [CrossRef] [PubMed]
  36. Hunter, M.O.; Keller, M.; Victoria, D.; Morton, D.C. Tree height and tropical forest biomass estimation. Biogeosciences 2013, 10, 8385–8399. [Google Scholar] [CrossRef]
  37. Bastien-Henri, S.; Park, A.; Ashton, M.; Messier, C. Biomass distribution among tropical trees pecies grown under differing regional climates. For. Ecol. Manag. 2010, 260, 403–410. [Google Scholar] [CrossRef] [Green Version]

