Article

A New Skid Trail Pattern Design for Farm Tractors Using Linear Programing and Geographical Information Systems

1
Department of Forest Engineering, Faculty of Forestry, Karadeniz Technical University, 61080 Trabzon, Turkey
2
Department of Forest Engineering, Faculty of Forestry, Duzce University, 81620 Duzce, Turkey
*
Author to whom correspondence should be addressed.
Forests 2016, 7(12), 306; https://doi.org/10.3390/f7120306
Submission received: 15 October 2016 / Revised: 24 November 2016 / Accepted: 29 November 2016 / Published: 5 December 2016

Abstract

:
Farm tractor skidding is one of the common methods of timber extraction in Turkey. However, the absence of an optimal skidding plan covering the entire production area can result in time loss and negative environmental impacts. In this study, the timber extraction by farm tractors was analyzed, and a new skid trail pattern design was developed using Linear Programming (LP) and Geographical Information Systems (GIS). First, a sample skidding operation was evaluated with a time study, and an optimum skidding model was generated with LP. Then, the new skidding pattern was developed by an optimum skidding model and GIS analysis. At the end of the study, the developed new skid trail pattern was implemented in the study area and tested by running a time study. Using the newly developed “Direct Skid Trail Pattern (DSTP)” model, a 16.84% increase in working time performance was observed when the products were extracted by farm tractors compared to the existing practices. On the other hand, the average soil compaction value measured in the study area at depths of 0–5 cm and 5–10 cm was found to be greater in the sample area skid trails than in the control points. The average density of the skid trails was 281 m/ha, while it decreased to 187 m/ha by using the developed pattern. It was also found that 44,829 ton/ha of soil losses were prevented by using the DSTP model; therefore, environmental damages were decreased.

1. Introduction

Extraction work is one of the important steps in the production of wood-based forest products. The extraction process includes various tools and methods according to the technical, economic and environmental aspects. Farm tractors are used for a variety of forest harvesting tasks, including felling, processing, extraction, and transportation [1]. Skidding with farm tractors is a very common extraction method, which has many advantages such as low investment for small-scale forests [2].
Irregular (“go anywhere”) skidding should be avoided as it results in excessive land disturbance and erosion. The negative environmental effects caused by skidding activities listed in descending order include the physical detrition of the soil, plant retardation, changes in species diversity and degradation of wildlife habitats and activities caused by organic elements and humification of the soil and nitrogen losses due to denitrification. Furthermore, skid trails break trees and saplings on the path also causing trauma and injury. Stream water quality can be affected by the nutrient cycle and water temperature of riparian zones. This is primarily due to sediment flow into drainage systems caused by skid trails [3,4,5,6,7,8].
Conventionally, the routes followed by agricultural vehicles are formed as repetitions of standard motifs [9]. Skid trails are defined as tertiary roads that are used by skidders that move logs from the point of felling and bucking to landing areas [3]. The small contact area where the wheels of logging vehicles impact on the ground results in low traction efficiency and high ground pressures. The extent and distribution of soil disturbance after skidding operations shows that the pressure of harvesting vehicles can be distributed horizontally at the soil surface at least 2 m from the wheel ruts [10]. These trails should be closed after harvest completion because of their steep nature and lower standards, which can result in higher erosion rates [11].
There are two main types of skid trail networks: branching and parallel patterns. A branching skid trail pattern is planned to cross contour lines, and a parallel skid trail is planned in a parallel pattern following the contours [12,13].
With conventional logging, these skid trails cover from 18 to 36 percent of the soil surface after a single harvest entry [14]. Using a skid-road system increases the cost level by 30% if the ground slope increases from 30% to 60% [15]. Optimum road density is an important factor to help forest engineers optimize the harvesting costs using a suitable forest road network [16,17,18].
Decision making in forestry operations is difficult because forest conservation approaches and the beneficial features of the forest environment must be considered [19]. Skidding can be destructive for stands as well as for the land and the logs itself. A skidding plan should be made to minimize the environmental damages of skidding by pre-planning the skid trails. A well-balanced control over a skidding operation can be made by selecting suitable equipment, determining the appropriate harvest time, individual cut-tree size, location, and spatial distribution. Well-arranged skid trails make the work fast and improve the success of the skidding devices [20,21]. GIS and digital terrain models are well known tools for the evaluation of the terrain and logging parameters for skidding planning [22,23,24,25].
Although there are many studies on skid trails soil impacts, density and spacing determination [26,27,28,29], there are few studies on skid trail design [7,14]. The main objective of this paper is to develop a new skid trail pattern model using an optimization technique and GIS database analysis for the extraction of industrial wood using farm tractors.

2. Materials and Methods

The study was located in the Balikli district (40045′57′′ N, 31000′38′′ E) in the Western Black Sea province of Duzce, Turkey, where farm tractor usage is widely preferred for wood extraction. The study area’s altitude ranges between 1100 and 1850 m above the sea level and has a northern aspect. The annual average rainfall is 884.9 mm/year, and temperatures ranges from below −20.5 °C to 42.0 °C during the summer (annual average is 13.3 °C).
The study area forests are managed as high forest and have mixed stands. Tree species in the mixture are Fagus orientalis and Abies nordmaniana subsp. brnmuelleriana. The stands are even aged and the average growing stock is approximately 350 m3/ha. The silvicultural method is the clearcut system. Trees to be removed are felled, delimbed, topped, and bucked into logs motor-manually. The scheduled amount of timber extraction was 21,185 m3/year for the research period. The study area covers 5822 ha of forest land and has a total of 106.6 km of forest roads.
The study site has typically appropriate ground skidding features. The study area has a slope ranging from 0% to 33%, and the extracting activities were carried out by farm tractors, as they are the most suitable under these conditions.
The study has been formulated in four main steps (1) constitution of the existing farm tractor skidding time regression equation by a time study for determining effective variables in the skidding operations (this section was completed and published by Turk and Gumus [30]); (2) optimization of the total skidding time by Linear Programing for determining the optimum value of the effective factors; (3) developing skid trail pattern planning based on optimized effective factors value and forest terrain and stand data using GIS analysis and (4) field testing of the developed skid trail pattern.
The data set covered time study data, skid trail plans, topography of the production areas, forest road network plans, inventory information from forest management and yearly cutting plans. Topographical and graphic data related to the study area were identified, and all features were collected in a GIS database.
The time study was carried out to evaluate skidding time and to identify effective variables in farm tractor skidding. In recent studies carried out on skidding of logs, effective variables for skidding time and logging difficulty were identified as area slope, skidding length, tractor machine power, number of pieces per load, timber volume, skid trail floor class (1 = granular, 20 < mm; 2 = large granular, 0.2–2 mm; 3 = fine granular, 0.02–0.2 mm and 4 = humic soil), and floor condition (1 = nonslippery/dry floor; 2 = semi-slippery/moist floor; and 3 = slippery/wet floor). Soil compactions at a depth of 0–5 cm and area slope (gradient) were determined [1,31,32,33,34]. The duration of the skidding cycle (binding the load, waiting, pulling the load by cable and transmitting the load to the tractor, transporting the load, unloading, recycling empty) was determined using the continuous-time measurement technique (Figure 1a).
The loaded tractors moved downhill to the forest road and returned empty uphill from the forest road. The time measurement started with pulling the cable to the load, then binding the load to the cable, pulling the load to the tractor, connecting to the chain of the tractor, transporting the load, unloading and lastly, recycling the empty tractor. Each stage of the operation was measured independently. Furthermore, the number of each compartment and sub-compartment, the traveling direction, skidding distance, number of workers, skid floor condition and floor class information were all recorded on the survey chart. Each skidded log volume calculated by using the central diameter and length of the logs was measured using a tape measure.
Soil compaction data for the skid trails and natural parts (area not affected by skidding) of the study area were measured. Initially, sample measurements were made at intervals of 10 m lengths from the beginning to the end of every skid trail. Furthermore, the control point for the study was an area not affected by skidding and at least 25–30 m (at least one tree length) from the skid trail, in order to prevent side effects. For the control point, measurements were again taken at 10 m intervals (Figure 1b).
In the studied sections of the skid trail, soil compaction was measured using hand penetrometers for soil sections of 0–5 cm and 5–10 cm in depth [35]. Three color codes were employed by the soil compaction measurement device: green (0–200 psi), indicating soil compaction conducive to plant stem growth; yellow (201–300 psi), indicating soil compaction moderately favorable for plant stem growth; and red (301 < psi) indicating soil compaction not suitable for plant stem growth. For the control point (CP), the determination of soil compaction was done by hand penetrometers at the two different soil depths in the same manner used for the measurements in the sample area.

2.1. Specifications of the Optimum Skidding Model

In the optimum skidding model, the factors that affect skidding using farm tractors were defined for the purpose of minimum skidding time, high extraction productivity and the optimization of the skid trail pattern with minimum environmental damage. One of the mathematical strategies used in the problem-solving process was linear programming (LP) using operations research techniques [26,27,36,37,38]. In this study, LINDO 6.1 optimization software was used to solve LP problems.
The skidding time regression model and loaded travel time (ltt) (Teorem 1), described by Turk and Gumus [30], were used for the first step in designing the optimum skidding model and in determining the mathematical formulation of the optimum skidding model.
l t t = 28 + ( 1.046 t h g ) + ( 0.711 p c ) + ( 2.113   s q r t   t v ) + ( 4.138 f c ) + ( 1.490 f c l ) + ( 1.604 s g ) + ( 10.894   l g 10   s c 05 ) + ( 0.385   s q r t   s d )
The decision variables below were selected, as they affected the loaded tractor travel time statistically and semantically. Decision variables were defined as:
thg = tractor horsepower groups (1 = 50–60 hp, 2 = 61–71 hp and 3 = 72–82 hp)
pc = piece count (number)
tv = timber volume (m3)
fc = floor condition (1 = not slippery, 2 = semi-slippery and 3 = slippery)
fcl = floor class (1 = granular, 2 = large granular, 3 = fine granular and 4 = humic soil)
sg = slope group (1 = 0%–11%, 2 = 12%–22% and 3 = 23%–33%)
sc05 = soil compaction measured at a depth of 0–5 cm in the SA (psi)
sd = skidding distance (m)
×100 = constant
Restrictive factors were defined as:
1 ≤ thg ≤ 3, pc = 4, tv = 1.732 (sqrt 3), 1 ≤ fc ≤ 2, 2 ≤ fcl ≤ 4, 2 ≤ sg ≤ 3, 2.25 ≤ sc05 ≤ 2.89 (lg10152, lg10780), sd = 10 (sqrt100), ×100 = 28.
The decision variables restrictive factors divided into groups by calculations were performed using LINDO software. As the “tv” did not show a normal distribution, the square root transformation was utilized here; the value that should have been 3 became 1.732. As the “sc05” did not show a normal distribution, log10 transformation was utilized; the variables that should have been between 152 and 780 were 2.25–2.89 with the value transformation. The “sd” was not normally distributed, so square root transformation was utilized; the value that was supposed to be 100 became 10 with the value transformation. The ×100 variable defines the constant number and equals the value of 28.
The regression equation of the loaded tractor travel time (skid time) was accepted for the objective function of the optimum skidding model. The best variable values for the minimum skid time were determined. Furthermore, equations to minimize soil loss and soil compaction after skidding were integrated into the optimum skidding model.

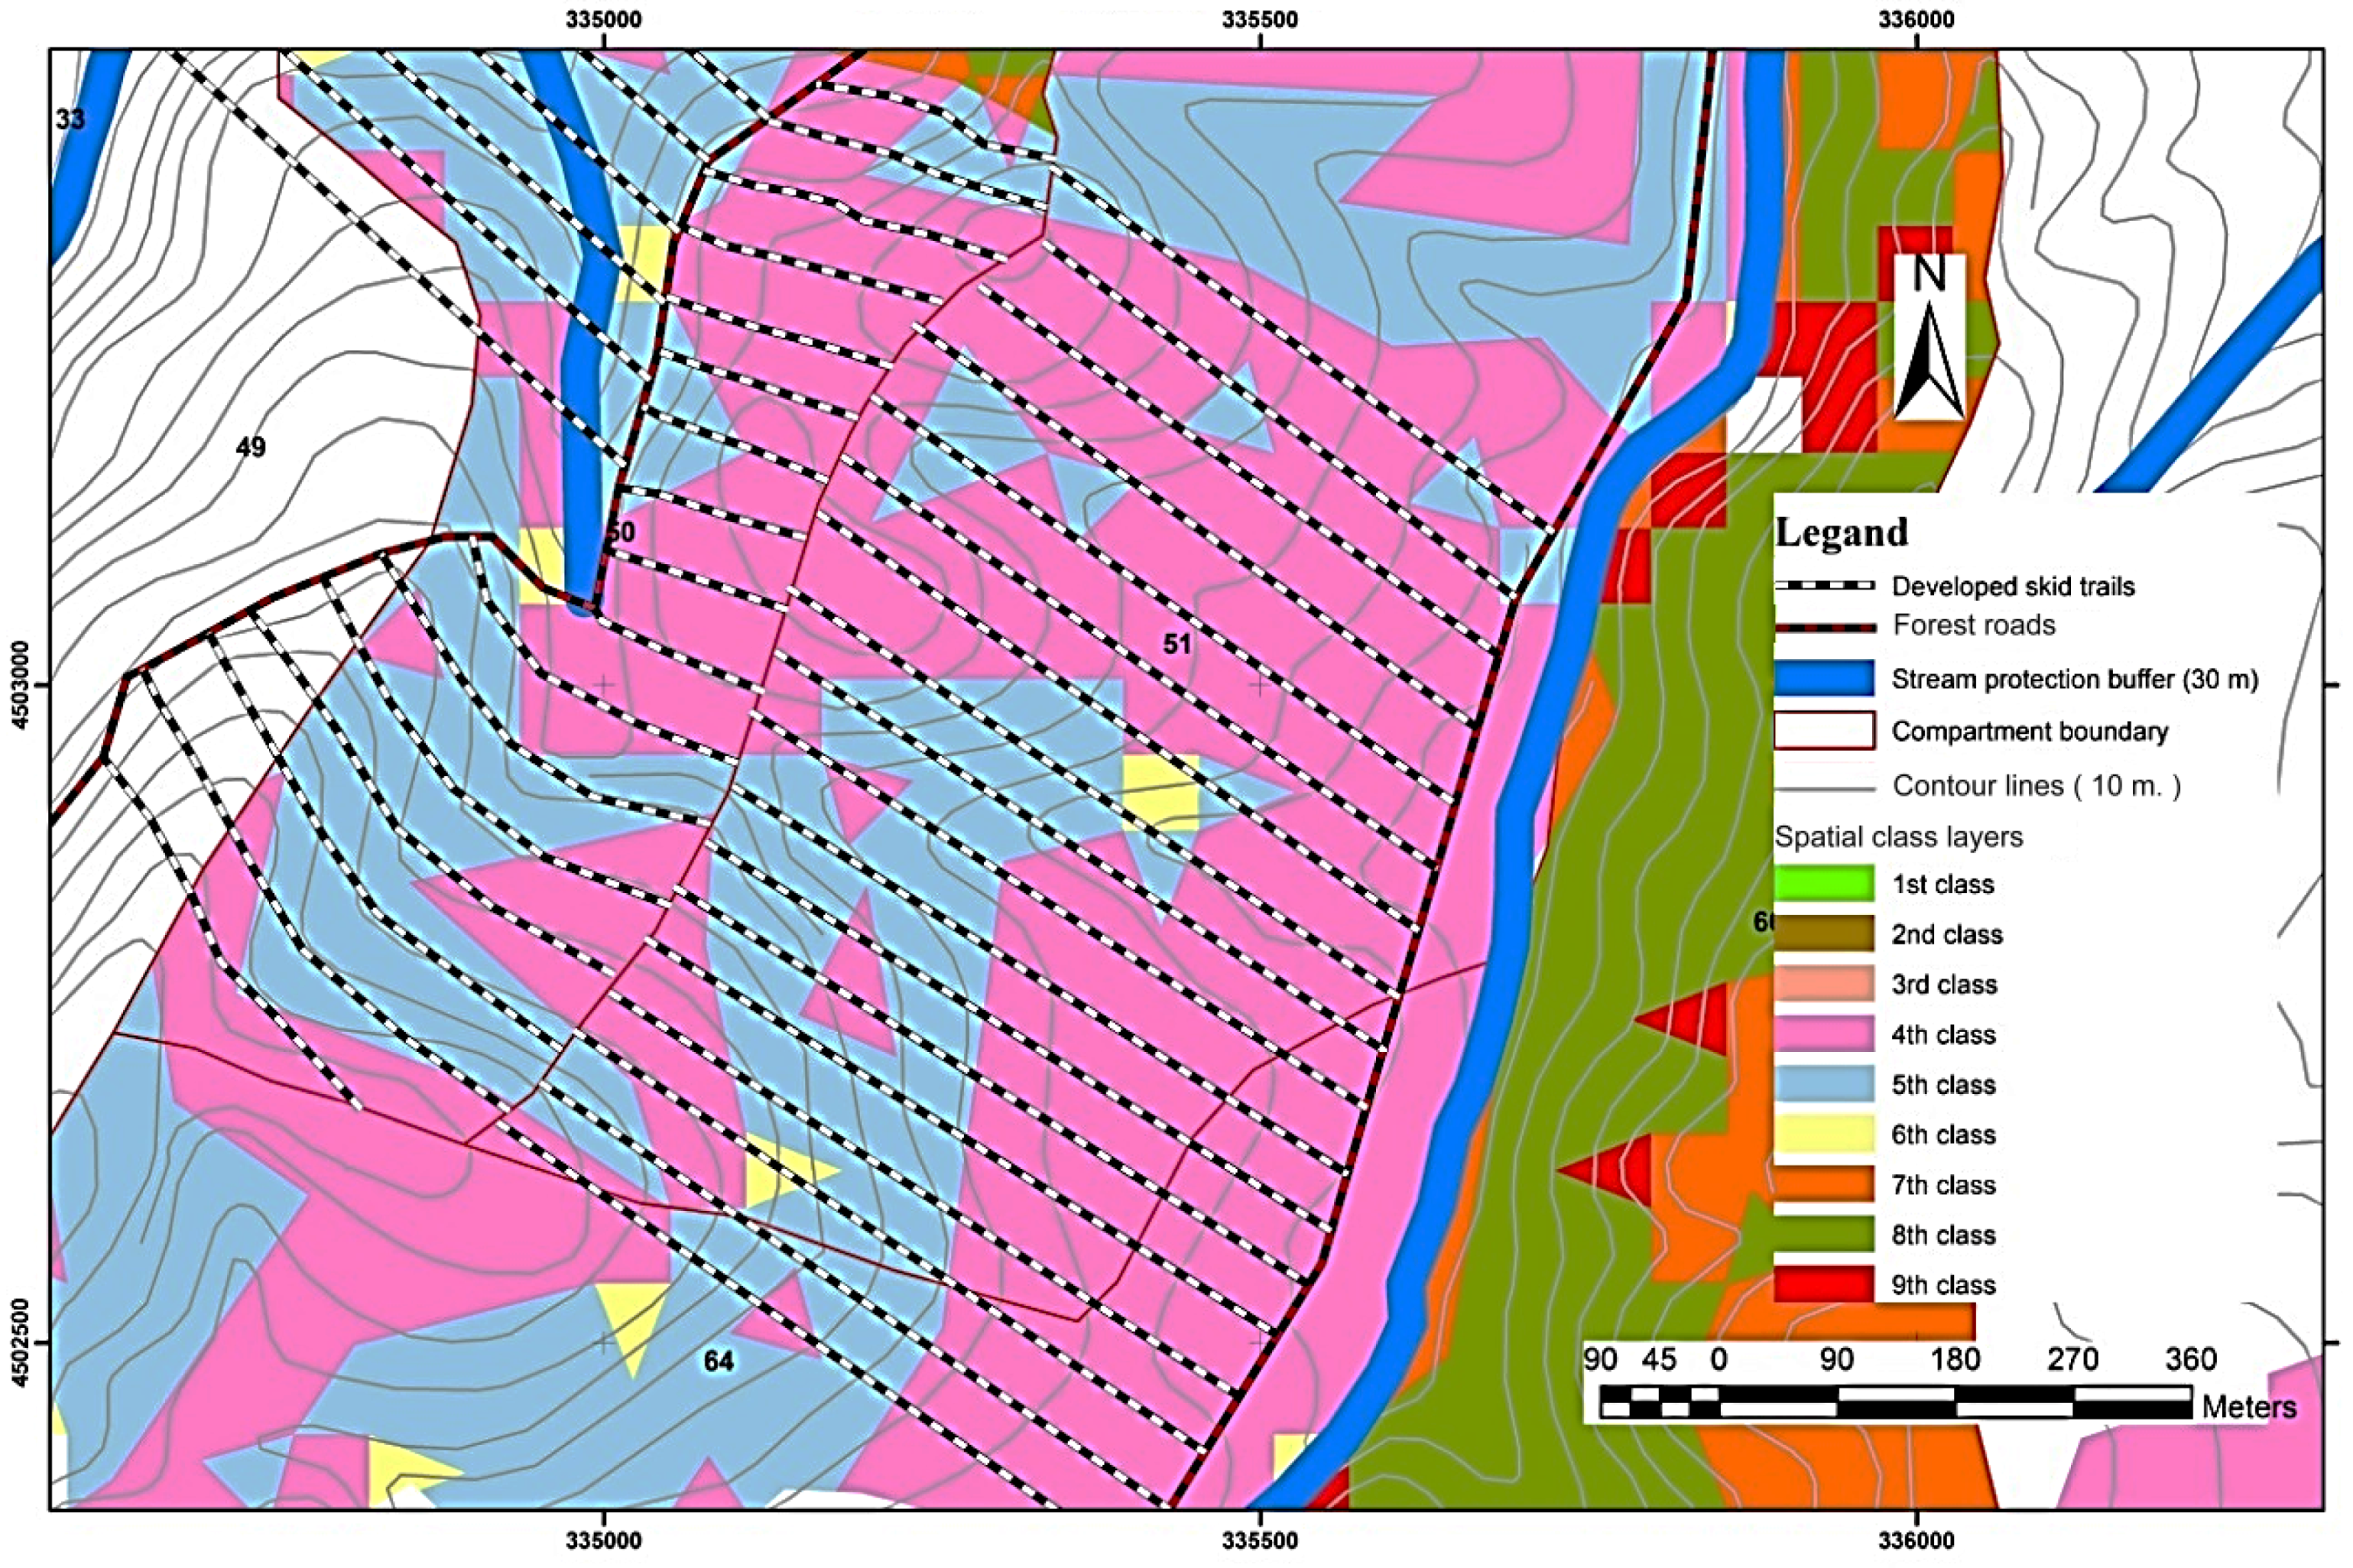
2.2. Skid Trail Pattern Design

The most suitable skid trail pattern was laid out for the skidding time minimization. While deciding the pattern of the skid trail, the optimum skidding time minimization model variables and spatial classes layers were used. In the model, nine classes were formed by arranging the area slope, floor and floor class spatial decision variable possibilities. These nine spatial conditions define the best spatial situations ranging from Class 9 to Class 1 (Table 1).
The area slope group, the floor condition and floor class layers were combined one by one by the ArcMap GIS software overlay process, and an optimum spatial class layer was made for the working area. This layer was used for the skidding time calculations in the GIS model. The skid time calculations for each pattern were conducted using the same spatial class positions.
There are two commonly known skid trail patterns; a branching skid trail pattern (BSTP) and a parallel skid trail pattern (PSTP) [12,14,24]. A new pattern was designed for the aim of skidding of the wood directly to the forest road. The new pattern was named the Direct Skid Trail Pattern (DSTP). The developed skidding trail pattern is defined below, and its design in the area is shown in Figure 2.
Technical aspects of the DSTP include the following features:
  • Skid trails width should be 1 m wider than the skidding vehicles.
  • As farm tractors were used in this study, skid trails should be planned in the areas where the uphill gradient is below 33%.
  • Skid trails should be connected to forest roads using the shortest routes and at angles of 35°–45°. The connection angle can vary according to the topological features, conditions of the forest roads and wood length.
  • Skid patterns should be designed to realize the transportation of wood in a downhill direction. The distance between the trails should be equivalent to two tree lengths (50 m).
  • Open culverts should be constructed on the skid trail at every 50 m interval at an angle of 45° across the trails axis where skid trails exceed 100 m.
Both patterns were determined by the position of every class and tested with the optimization skidding model using LINDO 6.1 optimization software; thus, the pattern that resulted in skidding in the shortest time was defined.

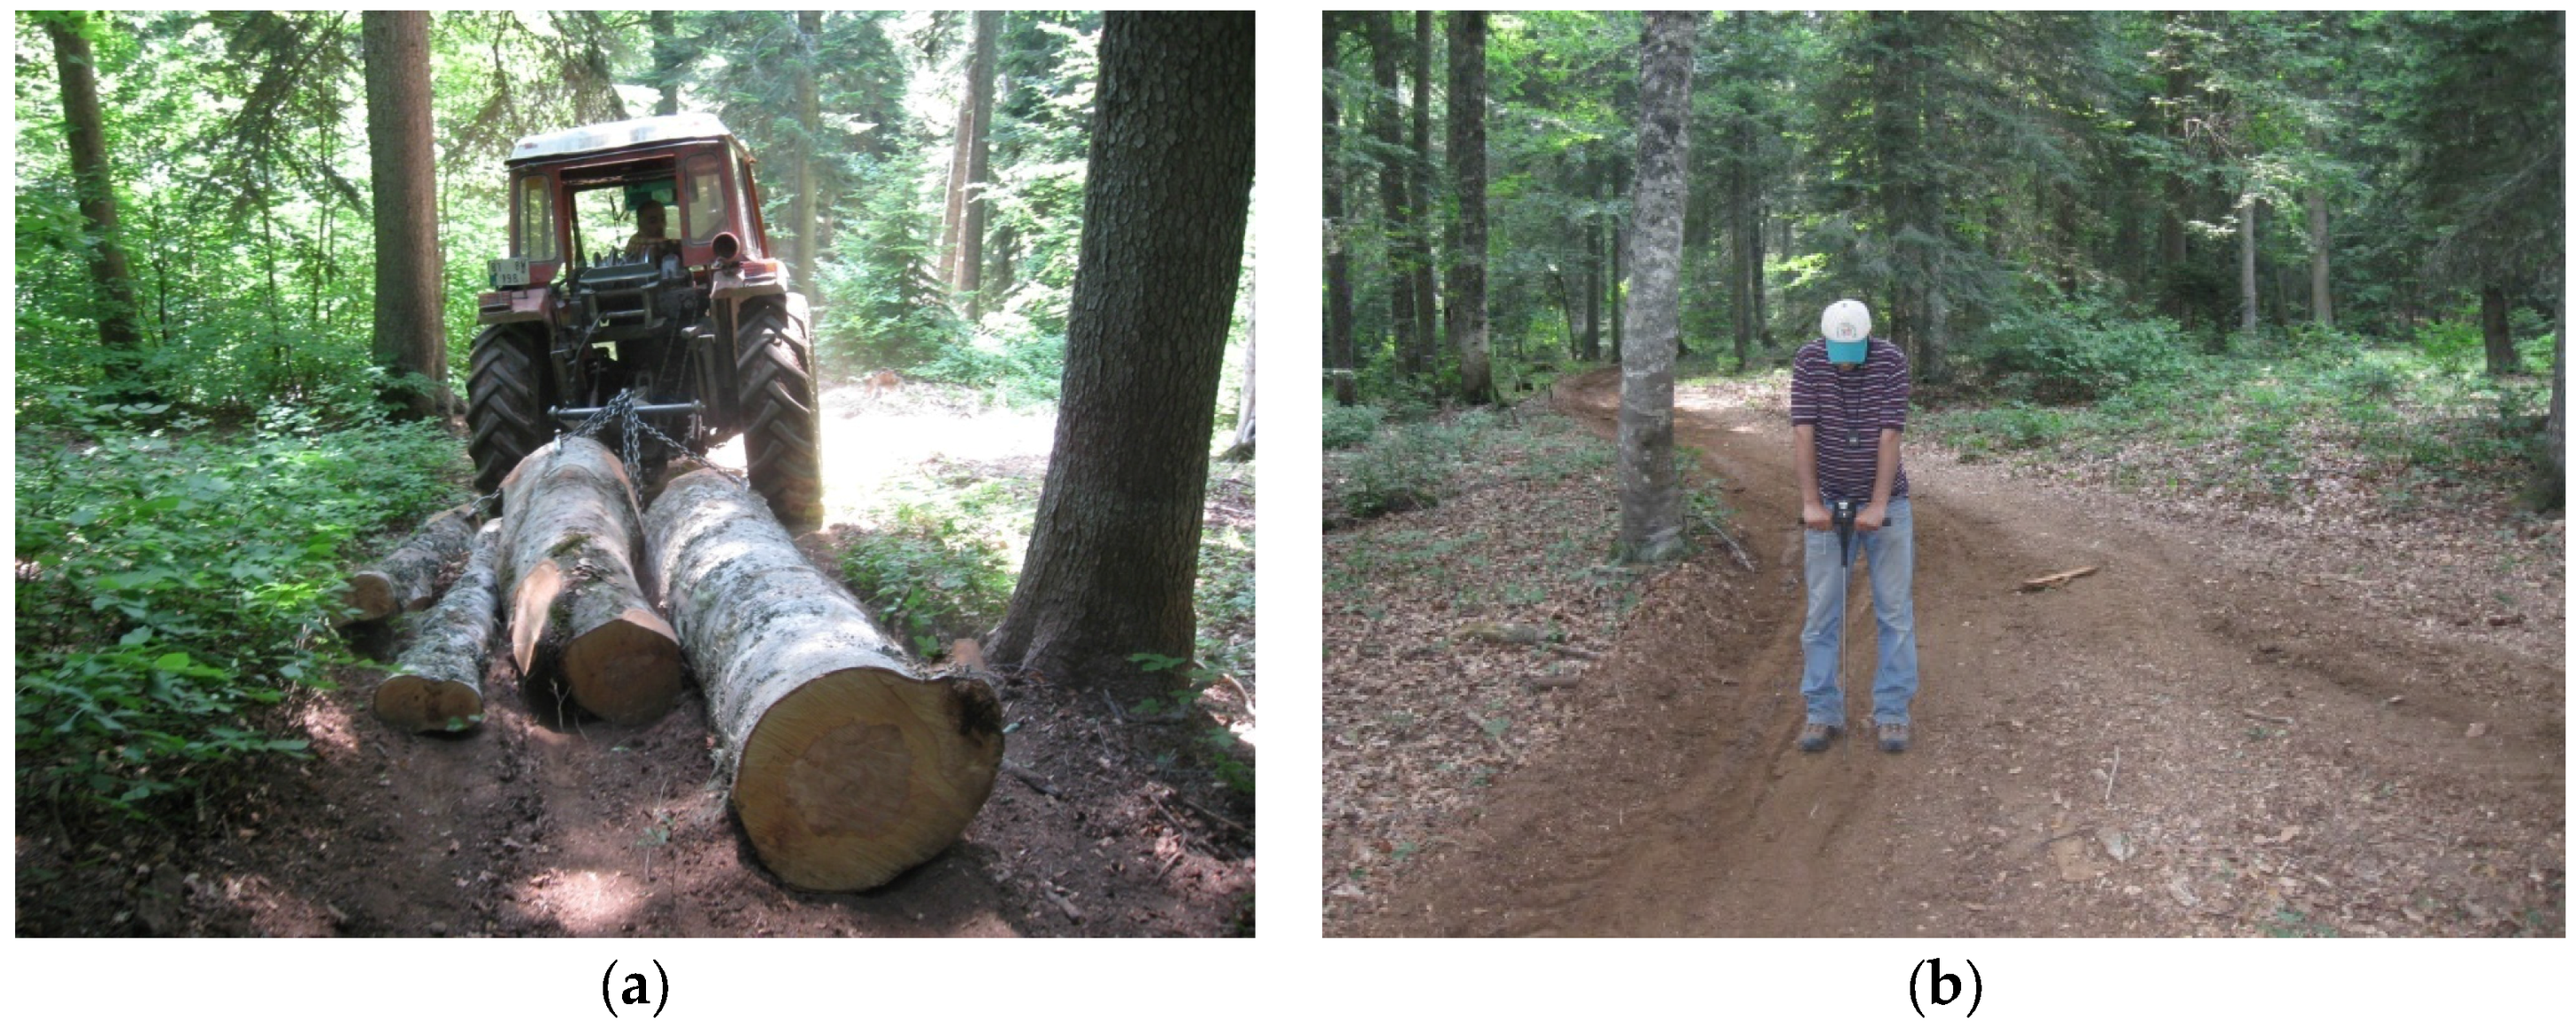
2.3. Testing the Designed Skid Trail Pattern in Field Operations

Logging plan maps were designed using the DSTP for the study area in a GIS environment. Subsequently, DSTP trails were marked in the study field. Following the marking of the skid trails, logs were skidded from the compartments with farm tractors using the direct skid trail pattern.
Time measurements done in the harvesting season were repeated in the following harvesting year. The computerized developed direct skid trail pattern was compared to the logging plan. The similarities in the area content and stand qualities of selected sub-compartments were recorded.

3. Results and Discussion

3.1. Existing Skidding Operations

Results of the time study conducted for the existing skid trails showed that the average productivity was 13.54 m3/h for 100 m skidding according to the time measurements of cable transmission to the load and connecting, the skidding of the load to the tractor and unloading times.
As for the findings from the skid trails, the average skid trail width was 2.43 m, and the average length was 389 m. The average soil compaction value measured in the study area at depths of 0–5 cm and 5–10 cm was found to be greater (three times) in the sample area skid trails than in the control points. Relationships between number of cycles and increase in soil bulk density and strength were only apparent in the wheel track section of the skid trail [39].

3.2. Optimum Skidding Model

The skidding model derived from the existing skidding operation by the time study indicated that the loaded transport time (ltt) given before in Equation (1) was accepted as the most suitable, having a confidence level of about 95% (0.749) and a standard error value of 2.939. The optimum skidding model was defined as the minimum travel time for the loaded tractor. The objective function belonging to this model is given below.
Zmin = −×100 − 1.046 thg + 0.711 pc + 2.113 tv + 4.138 fc − 1.490 fcl + 1.604 sg + 10.894 sc05 + 0.385 sd
The model was completed in five steps. For the decision variables that were under the main solution, for the skidding distance of 100 m, the tractor hp group (thg) was 3 (72–82 hp), the piece count in per load (pc) was 4, the total timber volume per load (tv) was 3 m3, the floor condition (fc) was 1 (nonslippery), the floor class (fcl) was 4 (humic soil), the slope group (sg) was 2 (12%–22%), the soil compaction at a depth of 0–5 cm measured in the SA (sc05) was 179 psi (soil compaction value conducive to plant growth), constant (×100) was 28, and skidding distance (sd) was 10 (sqrt100).
While these decision variables were chosen, the co-decision variable values minimizing soil loss were obtained. This was the reason the slope decision variable value affecting soil loss to the minimum degree was used in the same way as in the optimum skidding model.
With the solving of the given conditions of the model, the objective function value was found to be 5.11 min (Zmin). The square root transformation was implemented for this value as it did not show a regular division. Thus, the value was found to be 26.14 min.

3.3. The Optimization Results of the Skid Trail Patterns

Skid trail patterns (BSTP, PSTP and DSTP) were laid out on the designed optimum spatial floor layers. In order to define the optimum skidding trail pattern in the study field, two sample areas (48 and 51) were chosen from the study area compartments. Among all the patterns, DSTP was found to be the most suitable according to spatial conditions and the time analyses of the optimum skidding model. The hourly productivity of DSTP for 100 m is seen to be higher than the others (Table 2). This productivity value is calculated on the GIS best conditions layers by network analysis for 100 m distance and for only loaded transport time on skid trails. Consequently, these are theoretical values.
When Table 2 is examined, the developed pattern is observed to be the best in terms of the forested areas and density per hectare. However, little difference was found between the branching and parallel patterns.
These three patterns, when compared with the existing situation, were found to take up nearly 40% less area for skidding, while the percentage of openings for skidding operations was the same. The direct and branching patterns exhibited a difference of 0.73 m3/h while the parallel pattern showed a difference of 11.23 m3/h and the existing situation a difference of 34.87 m3/h. The greatest difference was observed between the existing situation and the direct (developed) pattern because the developed pattern used the optimum pattern implemented by the model under the most suitable conditions.
In previous studies, it was seen that with the planning of skid trails in the optimum way, environmental damage to the stand and the soil would be minimized to some extent [39,40]. In this study, steps to minimize soil compaction, soil loss and sapling damage were taken as well. When the three patterns were considered, the technically developed pattern could be seen extending throughout the area and connecting to the forest road by the shortest route. Moreover, the developed skid trail pattern affected a smaller area than that of the existing skid trails. Thus, 236 m2/ha could be protected from the effects of soil compaction.

3.4. Results of Testing the DSTP in the Field Study

The optimum skid trail pattern was designed using a computer environment and applied to the study area. In Table 3, spatial and temporal data on skid trails taken from three sub-compartments (50-A, 51-A and 63-D) can be seen.
Existing skid trails in the area were compared to DSTP using the optimum skidding model under the same conditions, i.e., having the same total length, the same log count and total timber volume extracted from the entire compartment (Table 3).
The comparison showed that a total of 472 logs and 355 m3 of timber were extracted from the compartment in 96,736 s (26.87 h) with the optimum skidding model. The extraction was accomplished in the existing situation in 133,561 s (37.10 h). The difference between the two situations is 10.23 h.
The developed skid trail patterns and the existing skid trails were compared in terms of productivity (only cycle time without pulling, unloading within delay time) and environmental effects (Table 4).
The average cycle time of the farm tractors per 100 m skidding distance was calculated as 4.62 min. In the study area, the average productivity of the farm tractors was 38.99 m3/h. However, when time periods for pulling of the cable to the load and connecting (2.70 min), yarding the load to the tractor and unloading (4.06 min) were added, the real operation time was found. According to this average cycle time per 100 m skidding distance, the average productivity was 15.82 m3/h. Productivity for a 250 m skidding distance was 9.83 m3/h. Similar productivity values were obtained in some optimization and case studies [1,27,41]. It is revealed that productivity was increased by 16.84% compared to the existing skidding operations by using the developed trail pattern in the area.

4. Conclusions

A new, direct skid trail pattern was developed and described in this study. Testing of the DSTP in the study area proved that the average cycle time of the farm tractors per 100 m skidding distance was 11.38 min, and the average productivity of the farm tractors was 15.82 m3/h. Productivity of a 250 m skidding distance was 9.830 m3/h. Thus, the increase in productivity was 16.84% compared with existing skidding operations. A total loss of 2124 saplings/ha and 44,829 ton/ha of soil was prevented by using DSTP.
In the existing situation, the average density of the skid trails opened under the same operation was 281 m/ha, while with the DSTP, this was decreased to 187 m/ha. Thus, unnecessary occupation of the area was prevented, and environmental damage was decreased.
As the mathematical model (LP) designed and used in the solution of problems had many factors and complicated transport issues, the most suitable solutions and optimum variable values were found. Both the results of the research and testing results of the area showed that the model was successful.
When the productivity of the branching, parallel and direct patterns was examined, the direct pattern was the most productive one. Moreover, when the three models were evaluated in technical terms, the developed pattern extended throughout the area and connected to the forest road using the shortest possible routes. This resulted in the shortest time for completing the round trip, and this shorter cycle was observed to extract more wood products from the compartment.

Acknowledgments

This work was funded with the support of the Karadeniz Technical University, Scientific Research Unit with the Project Number: 2008.113.001.3. We would like to thank the unit staff. We thank to Balikli forestry office technical staff, located in Duzce governed by the General Directorate of Forestry, Republic of Turkiye. Special thanks are also extended to forest workers who applied the “Direct Skid Trail Pattern” to their harvest area and worked according to this design. Special thanks are extended to Briseida Gomez Yilmaz for English editing.

Author Contributions

Selcuk Gumus conceived and designed the experiment, Yilmaz Turk collected and analyzed the data, Selcuk Gumus and Yilmaz Turk wrote the original draft. Selcuk Gumus critically reviewed and edited the manuscript.

Conflicts of Interest

The authors declare no conflict of interest. The founding sponsors had no role in the design of the study; in the collection, analyses, or interpretation of data; in the writing of the manuscript, and in the decision to publish the results.

References

  1. Spinelli, R.; Magagnotti, N.; Visser, R. Productivity Models for Cable Yarding in Alpine Forests. Eur. J. For. Eng. 2015, 1, 9–15. [Google Scholar]
  2. Magagnotti, N.; Spinelli, R. Financial and energy cost of low-impact wood extraction in environmentally sensitive areas. Ecol. Eng. 2011, 37, 601–606. [Google Scholar] [CrossRef]
  3. Buckley, D.S.; Crow, T.R.; Nauertz, E.A.; Schulz, K.E. Influence of skid trails and haul roads on understory plant richness and composition in managed forest landscapes in upper Michigan, USA. For. Ecol. Manag. 2003, 175, 509–520. [Google Scholar] [CrossRef]
  4. Messina, M.G.; Schoenholtz, S.H.; Lowe, M.W.; Wang, Z.; Gunter, D.K.; Londo, A.J. Initial responses of woody vegetation, water quality, and soils to harvesting intensity in a Texas Bottom and hardwood ecosystem. For. Ecol. Manag. 1997, 90, 201–215. [Google Scholar] [CrossRef]
  5. Arocena, J.M. Cations in solution from forest soils subjected to forest flor removal and compaction treatments. For. Ecol. Manag. 2000, 133, 71–80. [Google Scholar] [CrossRef]
  6. Marshall, V.G. Impacts of forest harvesting on biological processes in Northern forest soils. For. Ecol. Manag. 2000, 133, 43–60. [Google Scholar] [CrossRef]
  7. Krueger, W. Effects of future crop tree flagging and skid trail planning on conventional diameter-limit logging in a Bolivian tropical forest. For. Ecol. Manag. 2004, 188, 381–393. [Google Scholar] [CrossRef]
  8. Godefroid, S.; Koedam, N. The impact of forest paths upon adjacent vegetation: Effects of the paths surfacing material on the species compaction and soil compaction. Biol. Conserv. 2004, 119, 405–419. [Google Scholar] [CrossRef]
  9. Bochtis, D.D.; Sørensen, C.G.; Busato, P.; Berruto, R. Benefits from optimal route planning based on B-patterns. Biosyst. Eng. 2013, 115, 389–395. [Google Scholar] [CrossRef]
  10. Solgi, A.; Najafi, A.; Ezzati, S.; Ferencik, M. Assessment of ground-based skidding impacts on the horizontally rate and extent of soil disturbance along the margin of the skid trail. Ann. For. Sci. 2016, 73, 513–522. [Google Scholar] [CrossRef]
  11. Vinson, J.A. Soil Erosion and Modeling Following Closure Best Management Practices for Bladed Skid Trails in the Ridge and Valley Region. Ph.D. Thesis, Virginia Tech University, Blacksburg, VA, USA, 2016. [Google Scholar]
  12. Garland, J.J. Designated Skid Trails Minimize Soil Compaction; Forest Research Laboratory, School of Forestry, Oregon State University, Extension Service: Corvallis, OR, USA, 1983. [Google Scholar]
  13. Picman, D.; Pentek, T.; Nevecerel, H.; Papa, I.; Lepoglavec, K. Possibilities of application of relative openness in secondary forest opening of slope forests in Croatia. Croat. J. For. Eng. 2011, 32, 427–430. [Google Scholar]
  14. Froehlich, H.A.; Aulerich, D.E.; Curtis, R. Designing Skid Trail Systems to Reduce Soil Impacts from Tractive Logging Machines; Forest Research Laboratory Oregon State University: Corvallis, OR, USA, 1981. [Google Scholar]
  15. Heinimann, H.R. A computer model to differentiate skidder and cable-yarder based road network concepts on steep slopes. J. For. Res. 1998, 3, 1–9. [Google Scholar] [CrossRef]
  16. Ghaffarian, M.R.; Sobhani, H. Optimum road spacing of ground based skidding operations in Nowshahr. Iran. Casp. J. Env. Sci. 2008, 6, 105–112. [Google Scholar]
  17. Kooshki, M.; Hayati, E.; Rafatnia, N.; Ahmadi, M.T. Using GIS to evaluate and design skid trails for forest products. Taiwan J. For. Sci. 2012, 27, 117–124. [Google Scholar]
  18. Sterenczak, K.; Moskalik, T. Use of LIDAR-based digital terrain model and single tree segmentation data for optimal forest skid trail network. iForest 2014, 8, 661–667. [Google Scholar] [CrossRef]
  19. Phua, M.H.; Minowa, M.A. GIS-based multi-criteria decision making approach to forest conservation planning at a landscape scale: A case study in the Kinabalu Area, Sabah, Malaysia. Landsc. Urban Plan. 2005, 71, 207–222. [Google Scholar] [CrossRef]
  20. Sidle, R.C.; Sasaki, S.; Otsuki, M.; Noguchi, S.; Nik, A.R. Sediment pathways in a tropical forest: Effects of logging roads and skid trails. Hydrol. Process. 2004, 18, 703–720. [Google Scholar] [CrossRef]
  21. Contreras, M.A.; Chung, W. A modeling approach to estimating skidding costs of individual trees for thinning operations. West. J. Appl. For. 2011, 26, 133–146. [Google Scholar]
  22. Tucek, J.; Pacola, E. Algorithms for skidding distance modelling on a raster digital terrain model. J. For. Eng. 1999, 10, 67–79. [Google Scholar]
  23. Parsakhoo, A.; Mostafa, M. Road network analysis for timber transportation from a harvesting site to mills (Case study: Gorgan county–Iran). J. For. Sci. 2015, 61, 520–525. [Google Scholar] [CrossRef]
  24. Vopěnka, P.; Kašpar, J.; Marušák, R. GIS tool for optimization of forest harvest-scheduling. Comput. Electr. Agric. 2015, 113, 254–259. [Google Scholar] [CrossRef]
  25. Segura, M.; Ray, D.; Maroto, C. Decision support systems for forest management: A comparative analysis and assessment. Comput. Electr. Agric. 2014, 101, 55–67. [Google Scholar] [CrossRef]
  26. Najafi, A.; Sobhani, H.; Saeed, A.; Makhdom, M. Planning and assessment of alternative forest road and skidding networks. Croat. J. For. Eng. 2008, 29, 63–73. [Google Scholar]
  27. Ezzati, S.; Najafi, A.; Yaghini, M.; Hashemi, A.A.; Bettinger, P. An optimization model to solve skidding problem in steep slope terrain. J. For. Econ. 2015, 21, 250–268. [Google Scholar] [CrossRef]
  28. Lotfalian, M.; Khosrozadeh, S.; Hosseini, S.A.; Kazemi, M.; Zare, N. Determination of forest skid trail density in Caspian forests, Iran. J. For. Sci. 2016, 62, 80–87. [Google Scholar] [CrossRef]
  29. Borchert, H.; Huber, C.; Göttlein, A.; Kremer, J. Nutrient Concentration on Skid Trails under Brush-Mats–Is a Redistribution of Nutrients Possible? Croat. J. For. Eng. 2015, 36, 243–252. [Google Scholar]
  30. Turk, Y.; Gumus, S. Log skidding with farm tractors. In Proceedings of the 43th International Symposium on Forestry Mechanisation: “Forest Engineering: Meeting the Needs of the Society and the Environment”, Padova, Italy, 11–14 July 2010.
  31. Akay, A.E.; Erdas, O.; Sessions, J. Determining Productivity of Mechanized Harvesting Machines. J. Appl. Sci. 2004, 4, 100–105. [Google Scholar]
  32. Zecic, Z.; Marence, J. Mathematical models for optimization of group work in harvesting operation. Croat. J. For. Eng. 2005, 26, 29–37. [Google Scholar]
  33. Demir, M.; Makineci, E.; Yilmaz, E. Harvesting impact on herbaceous understory, forest floor and top soil properties on skid road in a beech (Fagus orientalis Lipsky) stand. J. Environ. Biol. 2007, 28, 427–432. [Google Scholar] [PubMed]
  34. Bavaghar, M.P.; Sobhani, H.; Feghhi, J.; Darvishsefat, A.A.; Marvi Mohajer, M.R. Comprehensive Productivity Models for Tracked and Wheeled Skidders in the Hyrcanian Forests of Iran. Res. J. For. 2010, 4, 65–71. [Google Scholar] [CrossRef]
  35. Makineci, E.; Demir, M.; Yilmaz, E. Long Term Harvesting Effects on Skid Road in a Fir (Abiesbornmulleriana Mattf.) Plantation Forest. Build. Environ. 2007, 42, 1538–1543. [Google Scholar] [CrossRef]
  36. Rönnqvist, M. Optimization in Forestry. Math Program. 2003, 97, 267–284. [Google Scholar]
  37. Eker, M.; Acar, H.H. Development of annual operational planning model for timber harvesting. SDU J. Nat. Appl. Sci. 2006, 10, 235–248. [Google Scholar]
  38. Frisk, M.; Göthe-Lundgren, M.; Jörnsten, K.; Rönnqvist, M. Cost allocation in collaborative forest transportation. Eur. J. Oper. Res. 2010, 205, 448–458. [Google Scholar] [CrossRef]
  39. Brais, S.; Camire, C. Soil compaction induced by careful logging in the claybelt region of northwestern Quebec (Canada). Can. J. Soil Sci. 1998, 78, 197–206. [Google Scholar] [CrossRef]
  40. Johns, J.S.; Barreto, P.; Uhl, C. Logging damage during planned and unplanned logging operations in the Eastern Amazon. For. Ecol. Manag. 1996, 89, 59–77. [Google Scholar] [CrossRef]
  41. Acar, H.H. An investigation on the extraction from compartment by tractors at the mountainous region. Turk. J. Agric. For. 1997, 21, 299–306. [Google Scholar]
Figure 1. (a) Log skidding on the skid trails; (b) Soil compaction measurement with hand penetrometer on the skid trails.
Forests 07 00306 g001
Figure 2. Direct skid trail pattern on the optimum spatial class layer.
Forests 07 00306 g002
Table 1. Spatial class layer definitions.
Optimum Positional ClassFloor ConditionFloor ClassSlope Group (%)
1st classNot SlipperyHumic Soil0–11
2nd classNot SlipperyHumic Soil12–22
3rd classNot SlipperyHumic Soil23–33
4th classNot SlipperyThin Granular0–11
5th classNot SlipperyThin Granular12–22
6th classNot SlipperyThin Granular23–33
7th classNot SlipperyBig Granular0–11
8th classNot SlipperyBig Granular12–22
9th classNot SlipperyBig Granular23–33
Table 2. Road density and skidding productivity on the skid trail patterns.
Density of the Skid Trail Patterns in Hectares
Section No.Existing TrailsBranching PatternParallel PatternDirect Pattern
48209 m/ha197 m/ha199 m/ha192 m/ha
522 m2/ha494 m2/ha498 m2/ha480 m2/ha
51353 m/ha186 m/ha180 m/ha181 m/ha
883 m2/ha465 m2/ha450 m2/ha454 m2/ha
Average281 m/ha192 m/ha190 m/ha187 m/ha
703 m2/ha480 m2/ha474 m2/ha467 m2/ha
Skidding productivity for the Skid Trail Patterns in the optimum GIS model (skidding distance of 100 m)
4823.10 m3/h61.02 m3/h59.67 m3/h61.71 m3/h
5134.32 m3/h64.67 m3/h65.06 m3/h65.45 m3/h
Average28.71 m3/h62.85 m3/h52.37 m3/h63.58 m3/h
Table 3. Skidding time and operational data of skid trail patterns in the field tests.
Skid Trails PatternsSub-Compartment No.Trail Length (m)Total Log (Piece)Total Volume (m3)Total Number of CycleAverage Cycle Time (s)Total Time (s)
DSTP Test in the field50-A2421561163965825,662
51-A36648371298111,772
423967224116327,912
63-D2581721304373031,390
General total118353296,736
Current situation50-A2421561167547935,925
51-A36648372372516,675
42396724683838,548
63-D2581721308351142,413
General total2272553133,561
Table 4. Comparison of the productivity and environmental effects.
Productivity and Environmental EffectsDirect Skid Trail Pattern (Field Test Values)Existing Skid Trails
Average Productivity (100 m)38.99 m3/h29.49 m3/h
Average Productivity (250 m)15.60 m3/h11.78 m3/h
Average Productivity (389 m) (existing skid trails lengths)10.02 m3/h7.58 m3/h
Sapling collapse, ha4203 number/ha6327 number /ha
Soil loss, ha35.53 m3/ha (89,180 ton/ha)53.39 m3/ha (134,009 ton/ha)

