Figure 1.
Location of the study area (Bellif national forest) in the Mediterranean basin (A). Altitude and precipitation isohyets (B) and forest cover types (C) are also shown.
Figure 1.
Location of the study area (Bellif national forest) in the Mediterranean basin (A). Altitude and precipitation isohyets (B) and forest cover types (C) are also shown.
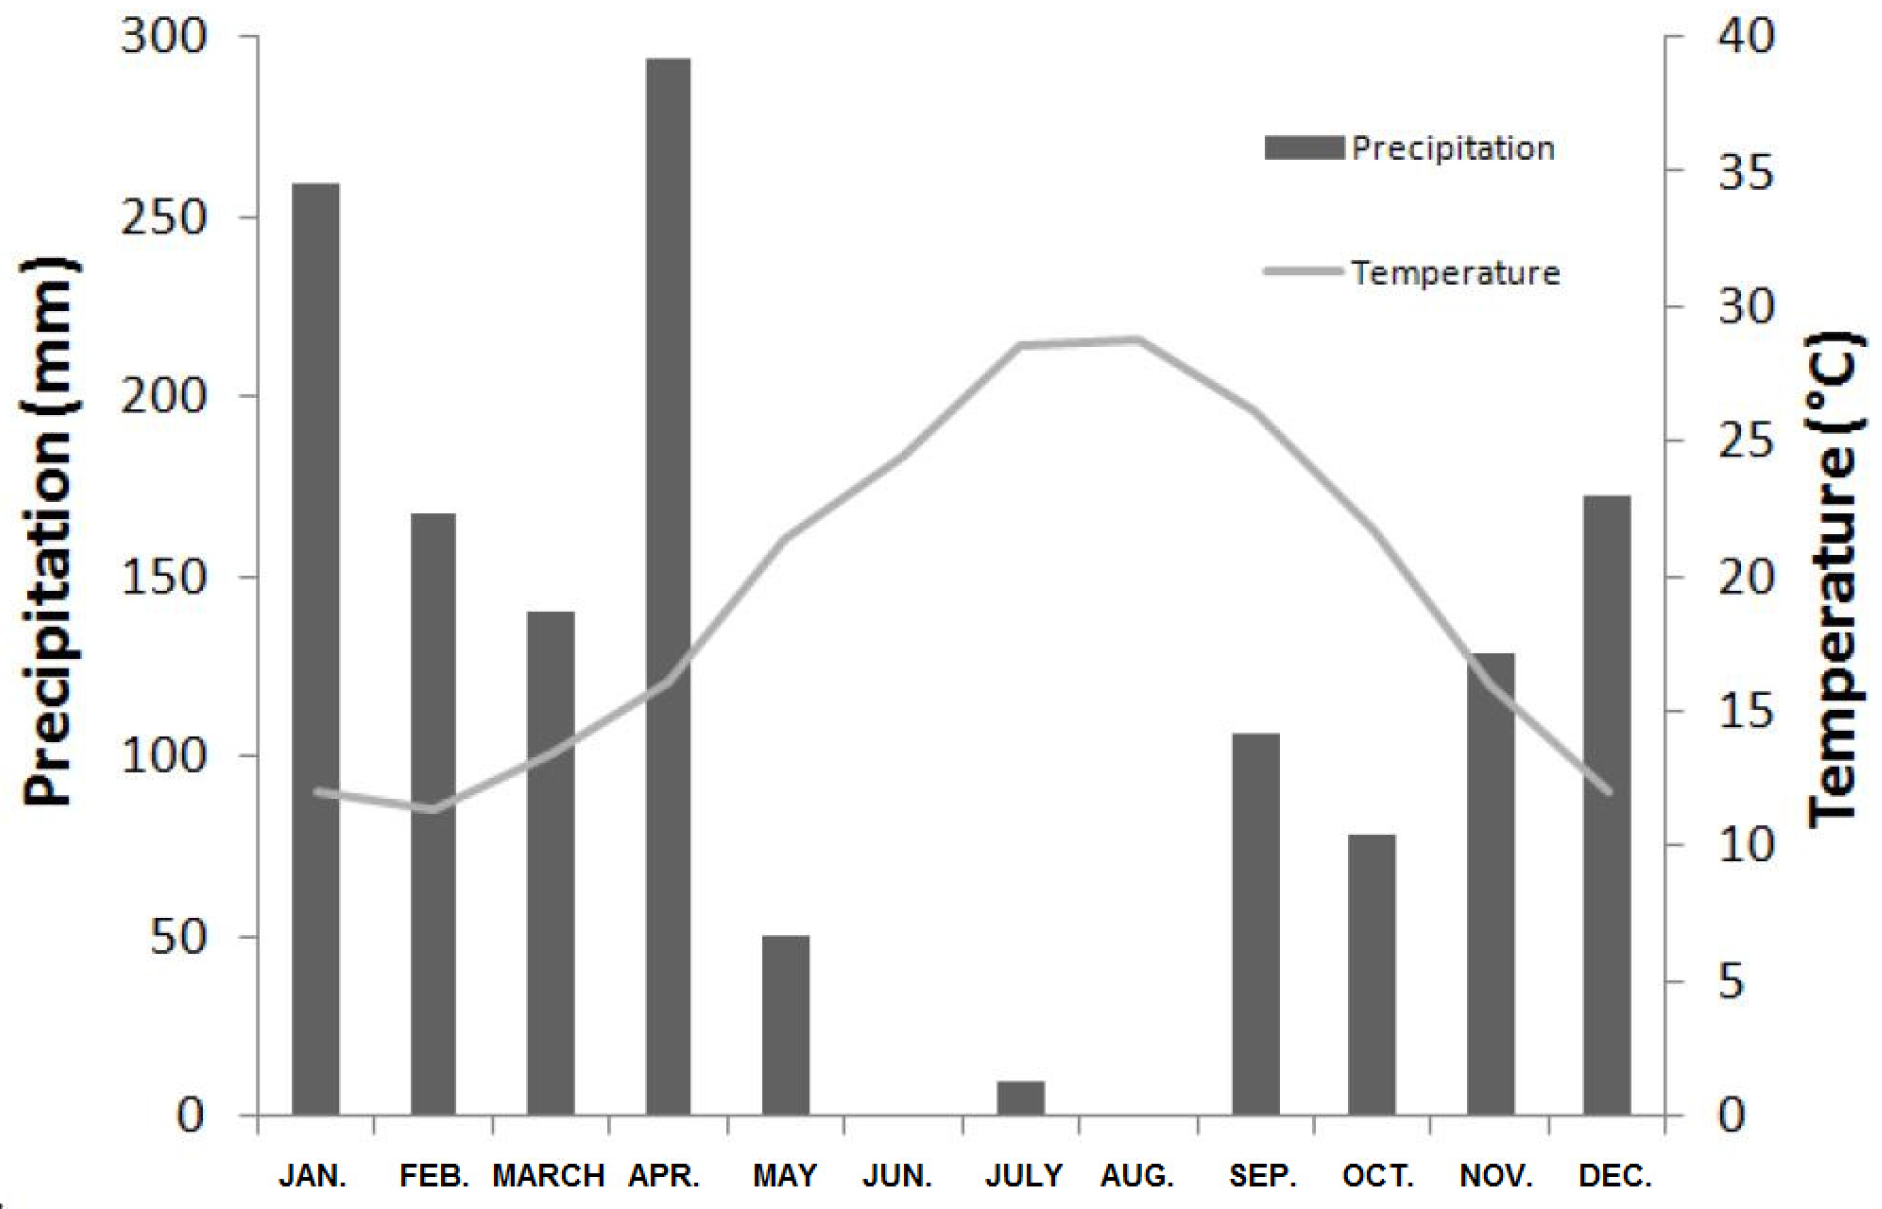
Figure 2.
Climate diagram for the 2008–2009 period in the Bellif study site, representing monthly precipitations (bars) and mean temperatures (grey line).
Figure 2.
Climate diagram for the 2008–2009 period in the Bellif study site, representing monthly precipitations (bars) and mean temperatures (grey line).
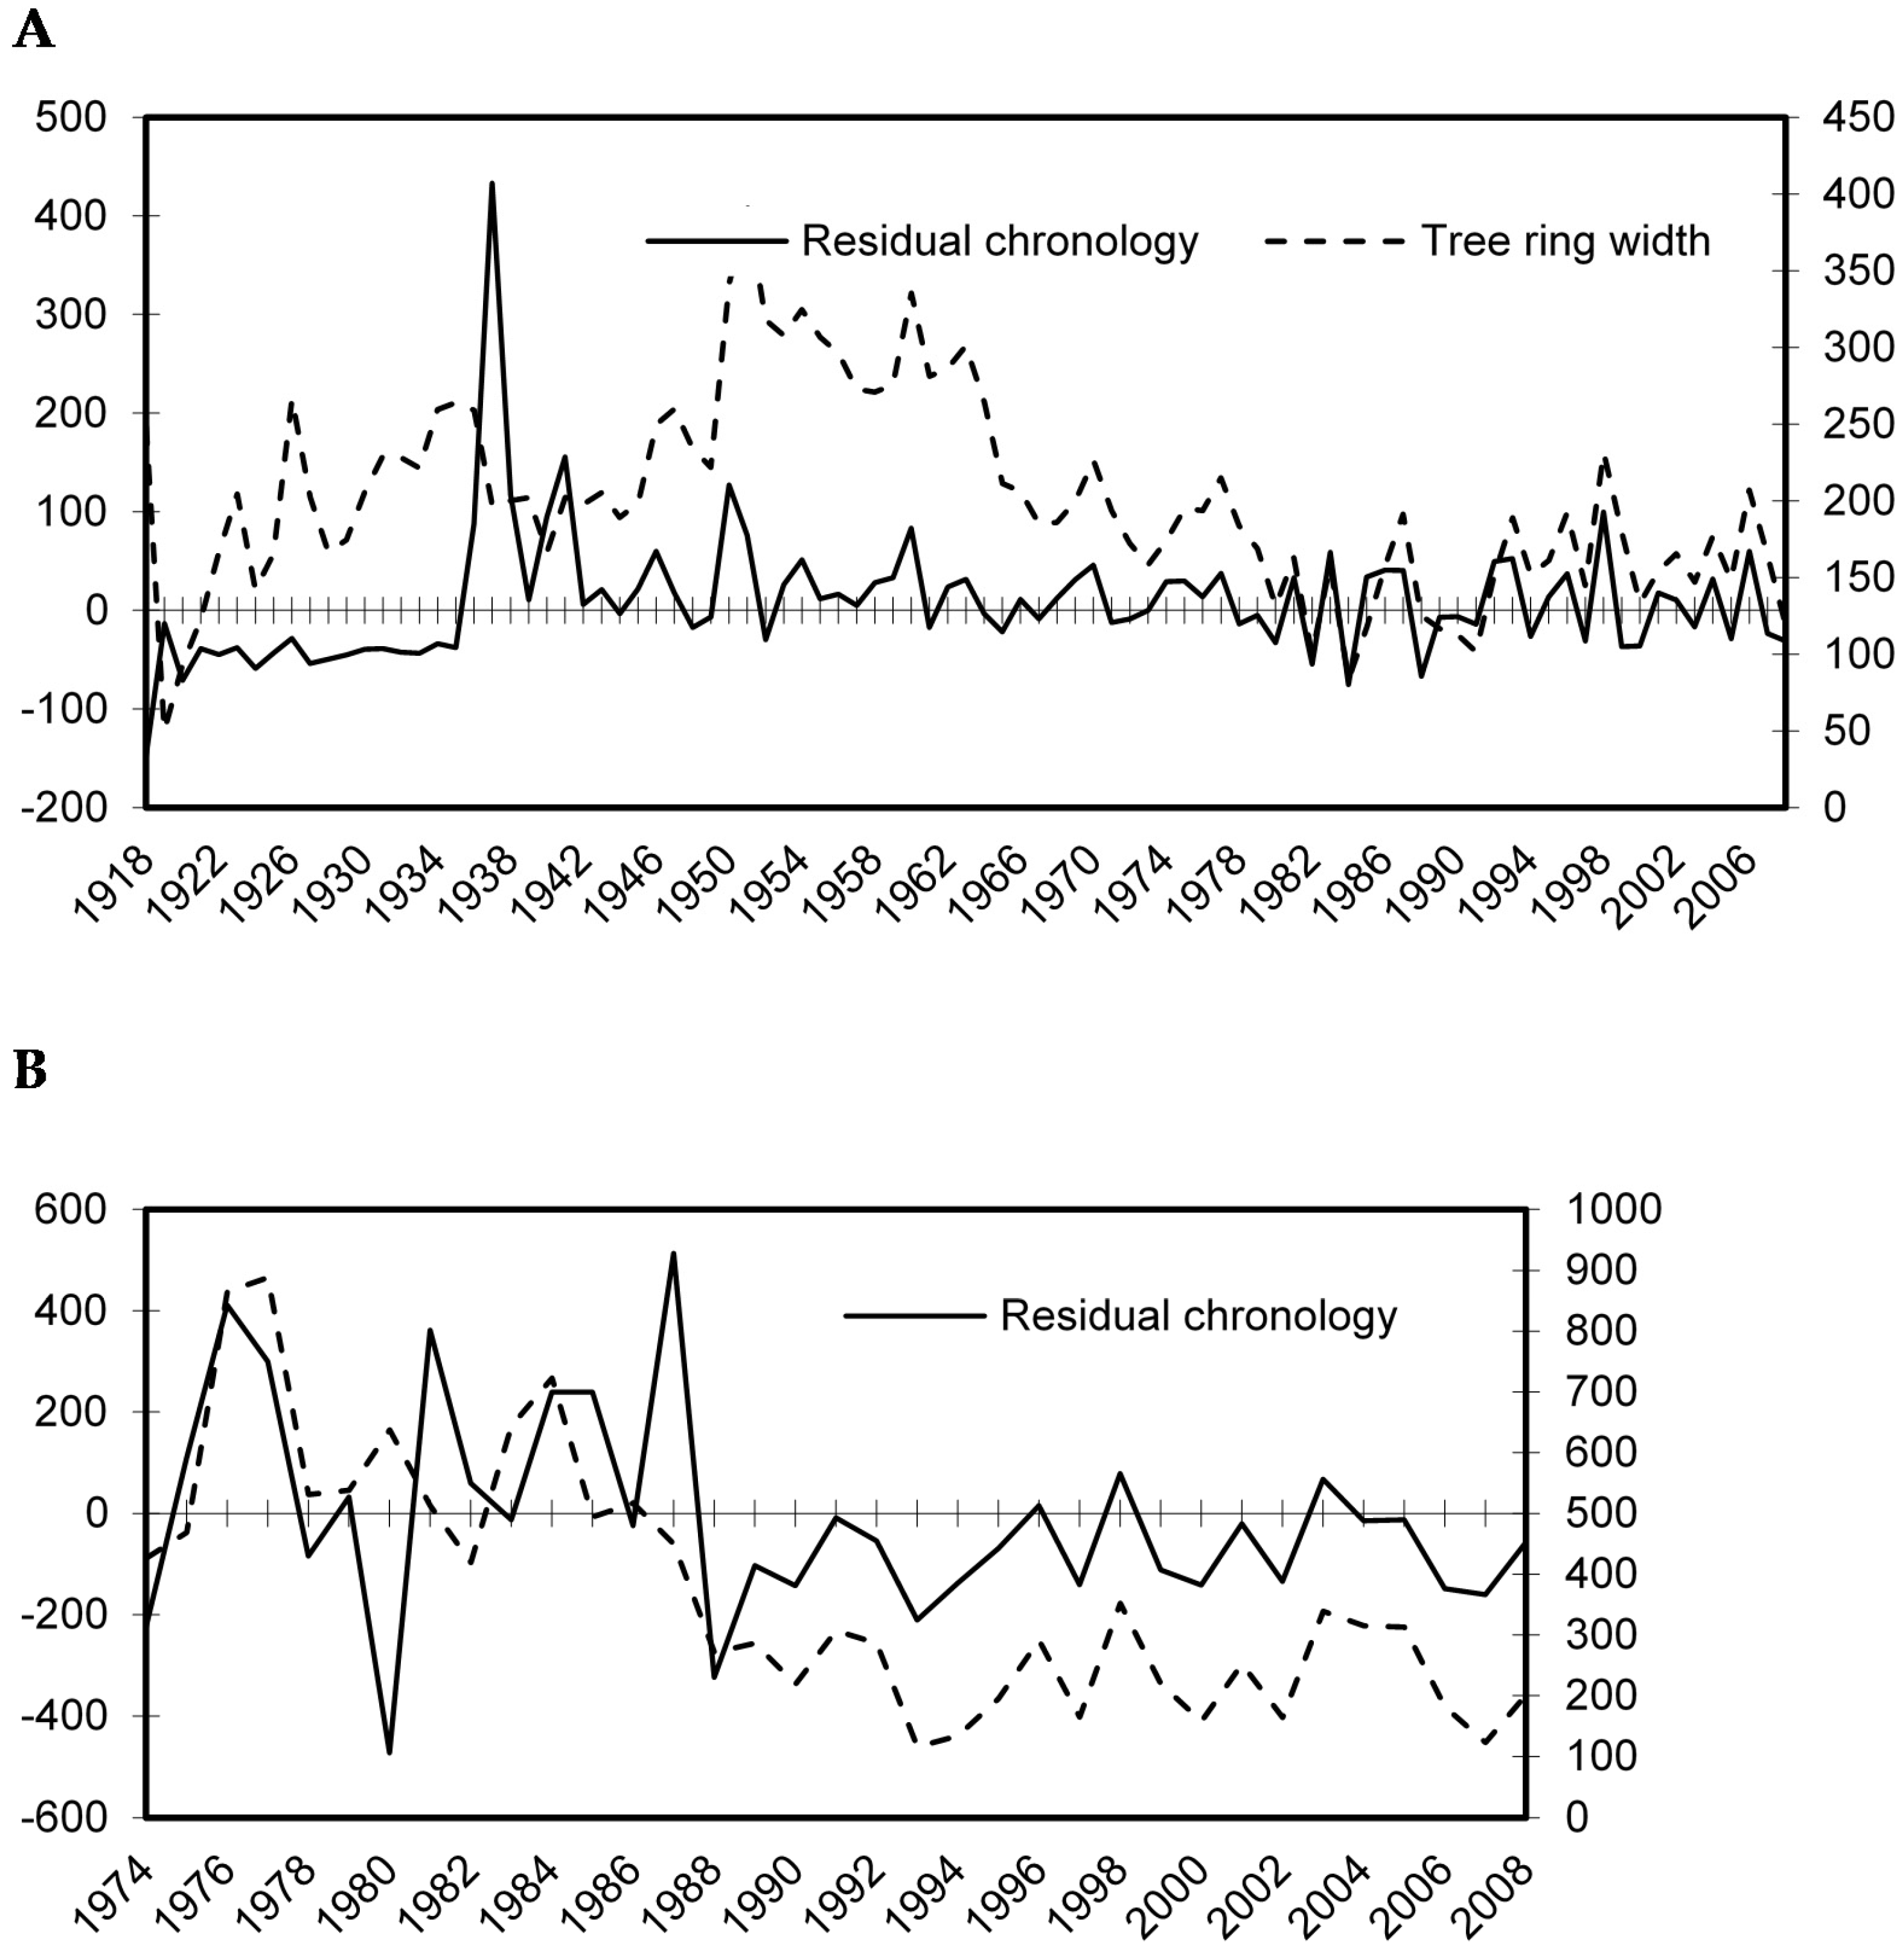
Figure 3.
Mean annual cork oak tree ring measurements before standardization (raw tree ring width), and after standardization (tree ring residues) in the mature stand MS (A) and in the young stand YS (B).
Figure 3.
Mean annual cork oak tree ring measurements before standardization (raw tree ring width), and after standardization (tree ring residues) in the mature stand MS (A) and in the young stand YS (B).
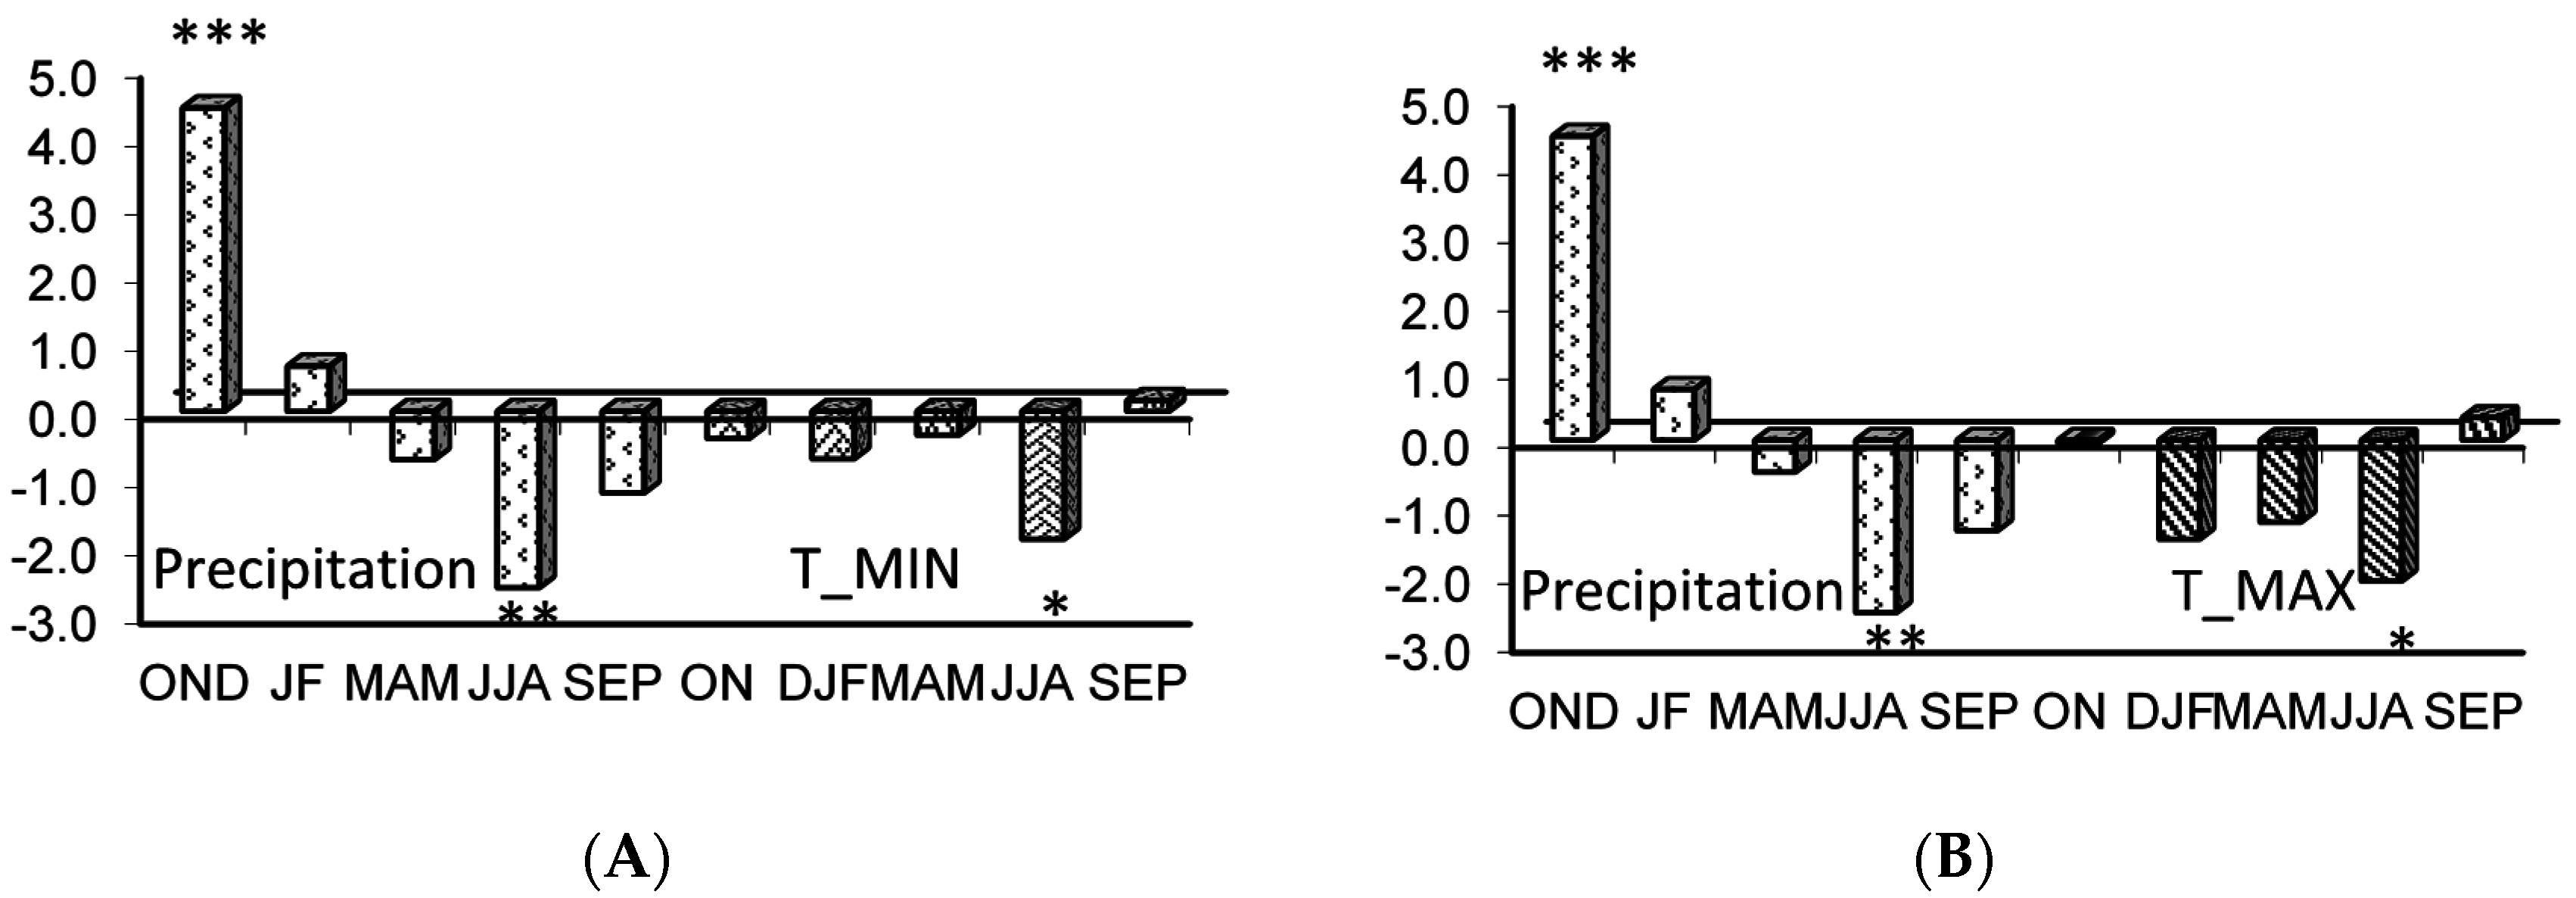
Figure 4.
Response function analysis of the residual tree ring chronology of Quercus suber in the young stand (YS) to monthly climatic data from October (t − 1) to September (t) for the period 1974–2002: (A) for the joint effect (P-TMIN) of precipitation P and minimum temperature (TMIN) and (B) for the joint effect (P-TMAX) of precipitation P and maximum temperature (TMAX). The number of stars indicates significance at 95%, 99%, and 99.99% levels, respectively. (MRC/SC = 99.99% and MRV/SV = 95%).
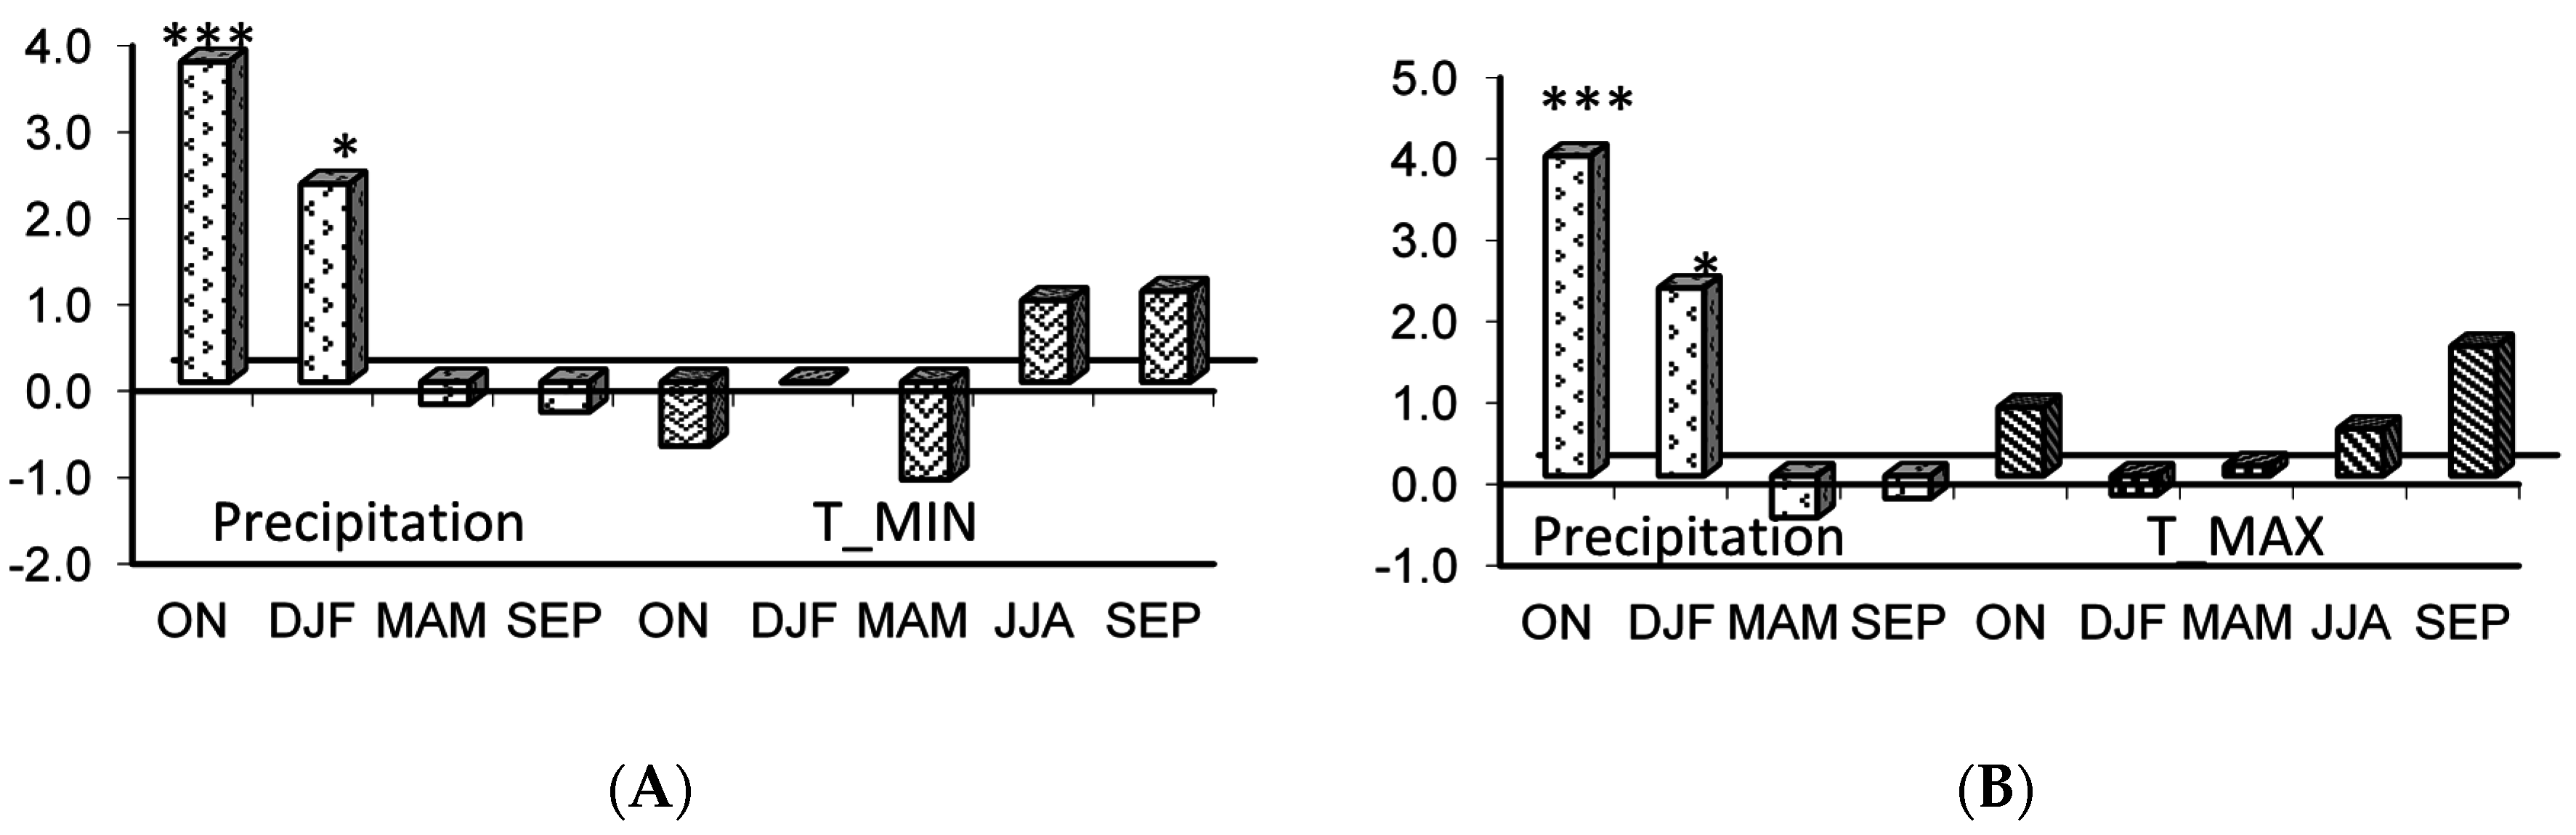
Figure 5.
Response function analysis of the residual tree ring chronology of Quercus suber in the mature (MS) to monthly climatic data from October (t − 1) to September (t) for the period 1937–2002 (A) for the joint effect (P-TMIN) of precipitation P and minimum temperature TMIN, and (B) for the joint effect (P-TMAX) of precipitation P and maximum temperature (TMAX). The number of stars indicates significance at 95%, 99%, and 99.99% levels, respectively. (MRC/SC = 99.99% and MRV/SV = 95%).
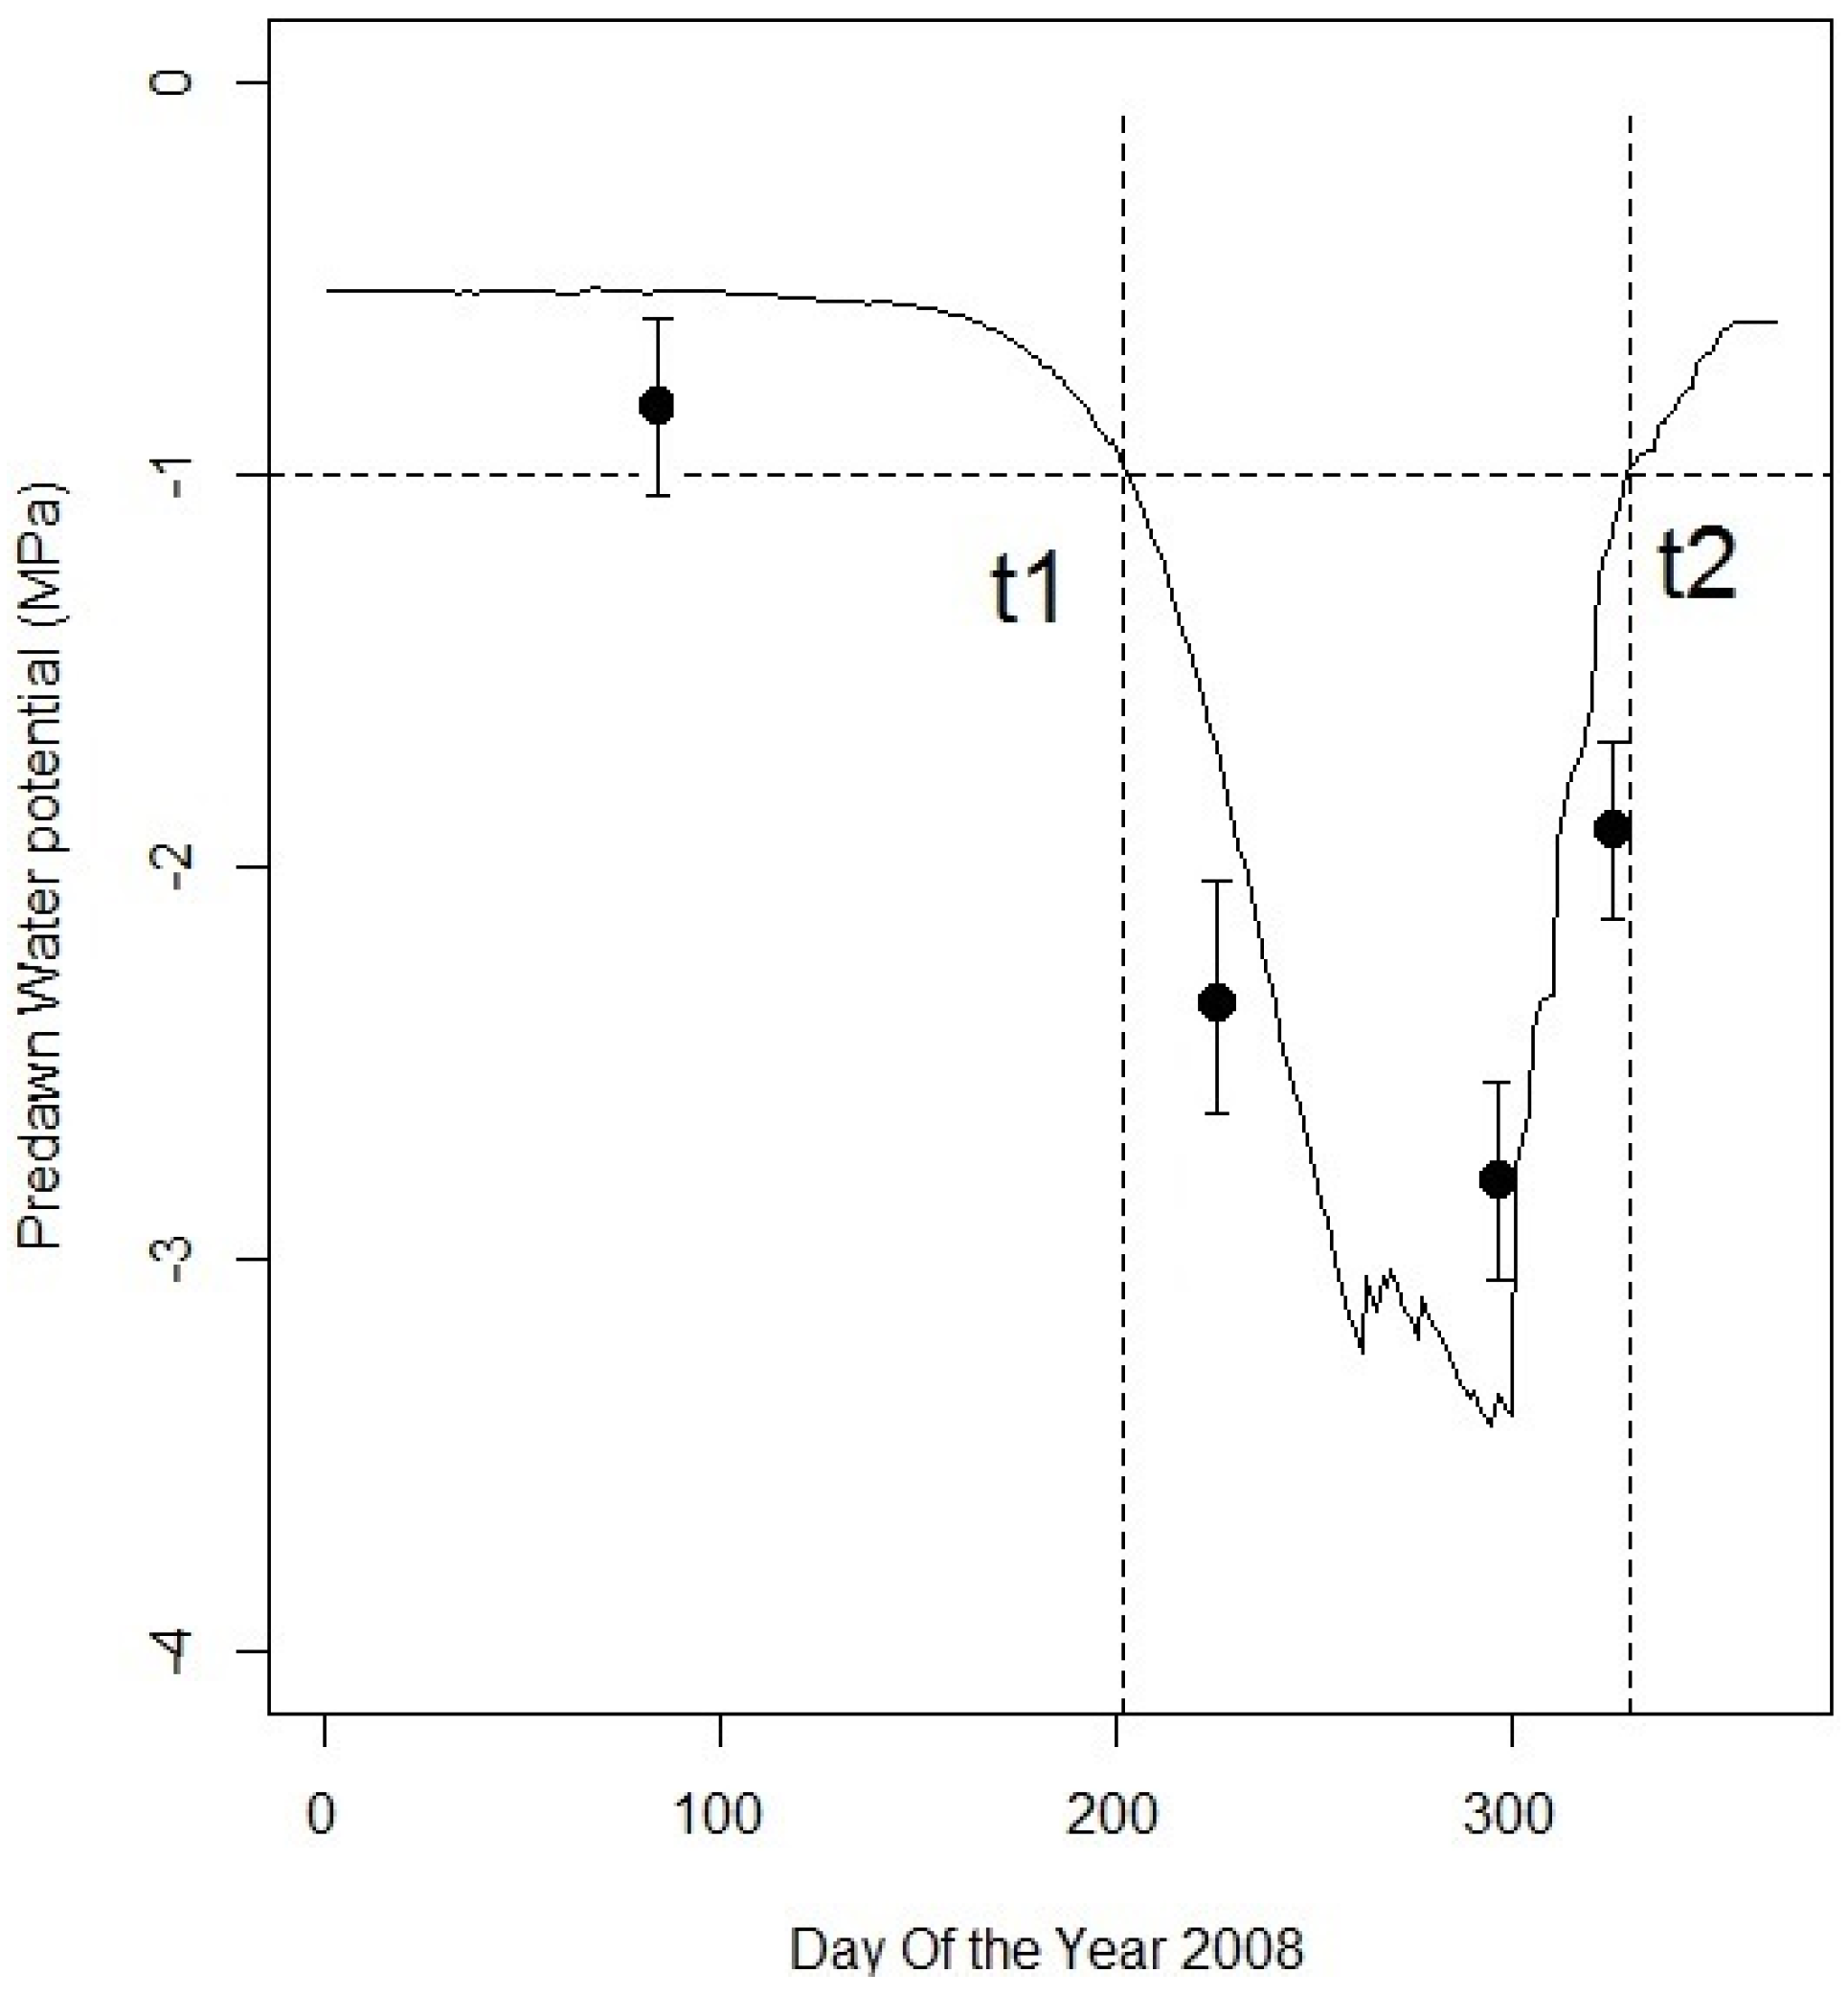
Figure 6.
Daily predawn leaf water potentials for Quercus suber measured (black dots, mean and standard deviation) during the year 2008, and simulated (black line). The horizontal dotted line illustrates the −1 MPa threshold, from day of the year which drought onset t1 and drought offset t2 are deduced when the simulated predawn water potential reaches this threshold.
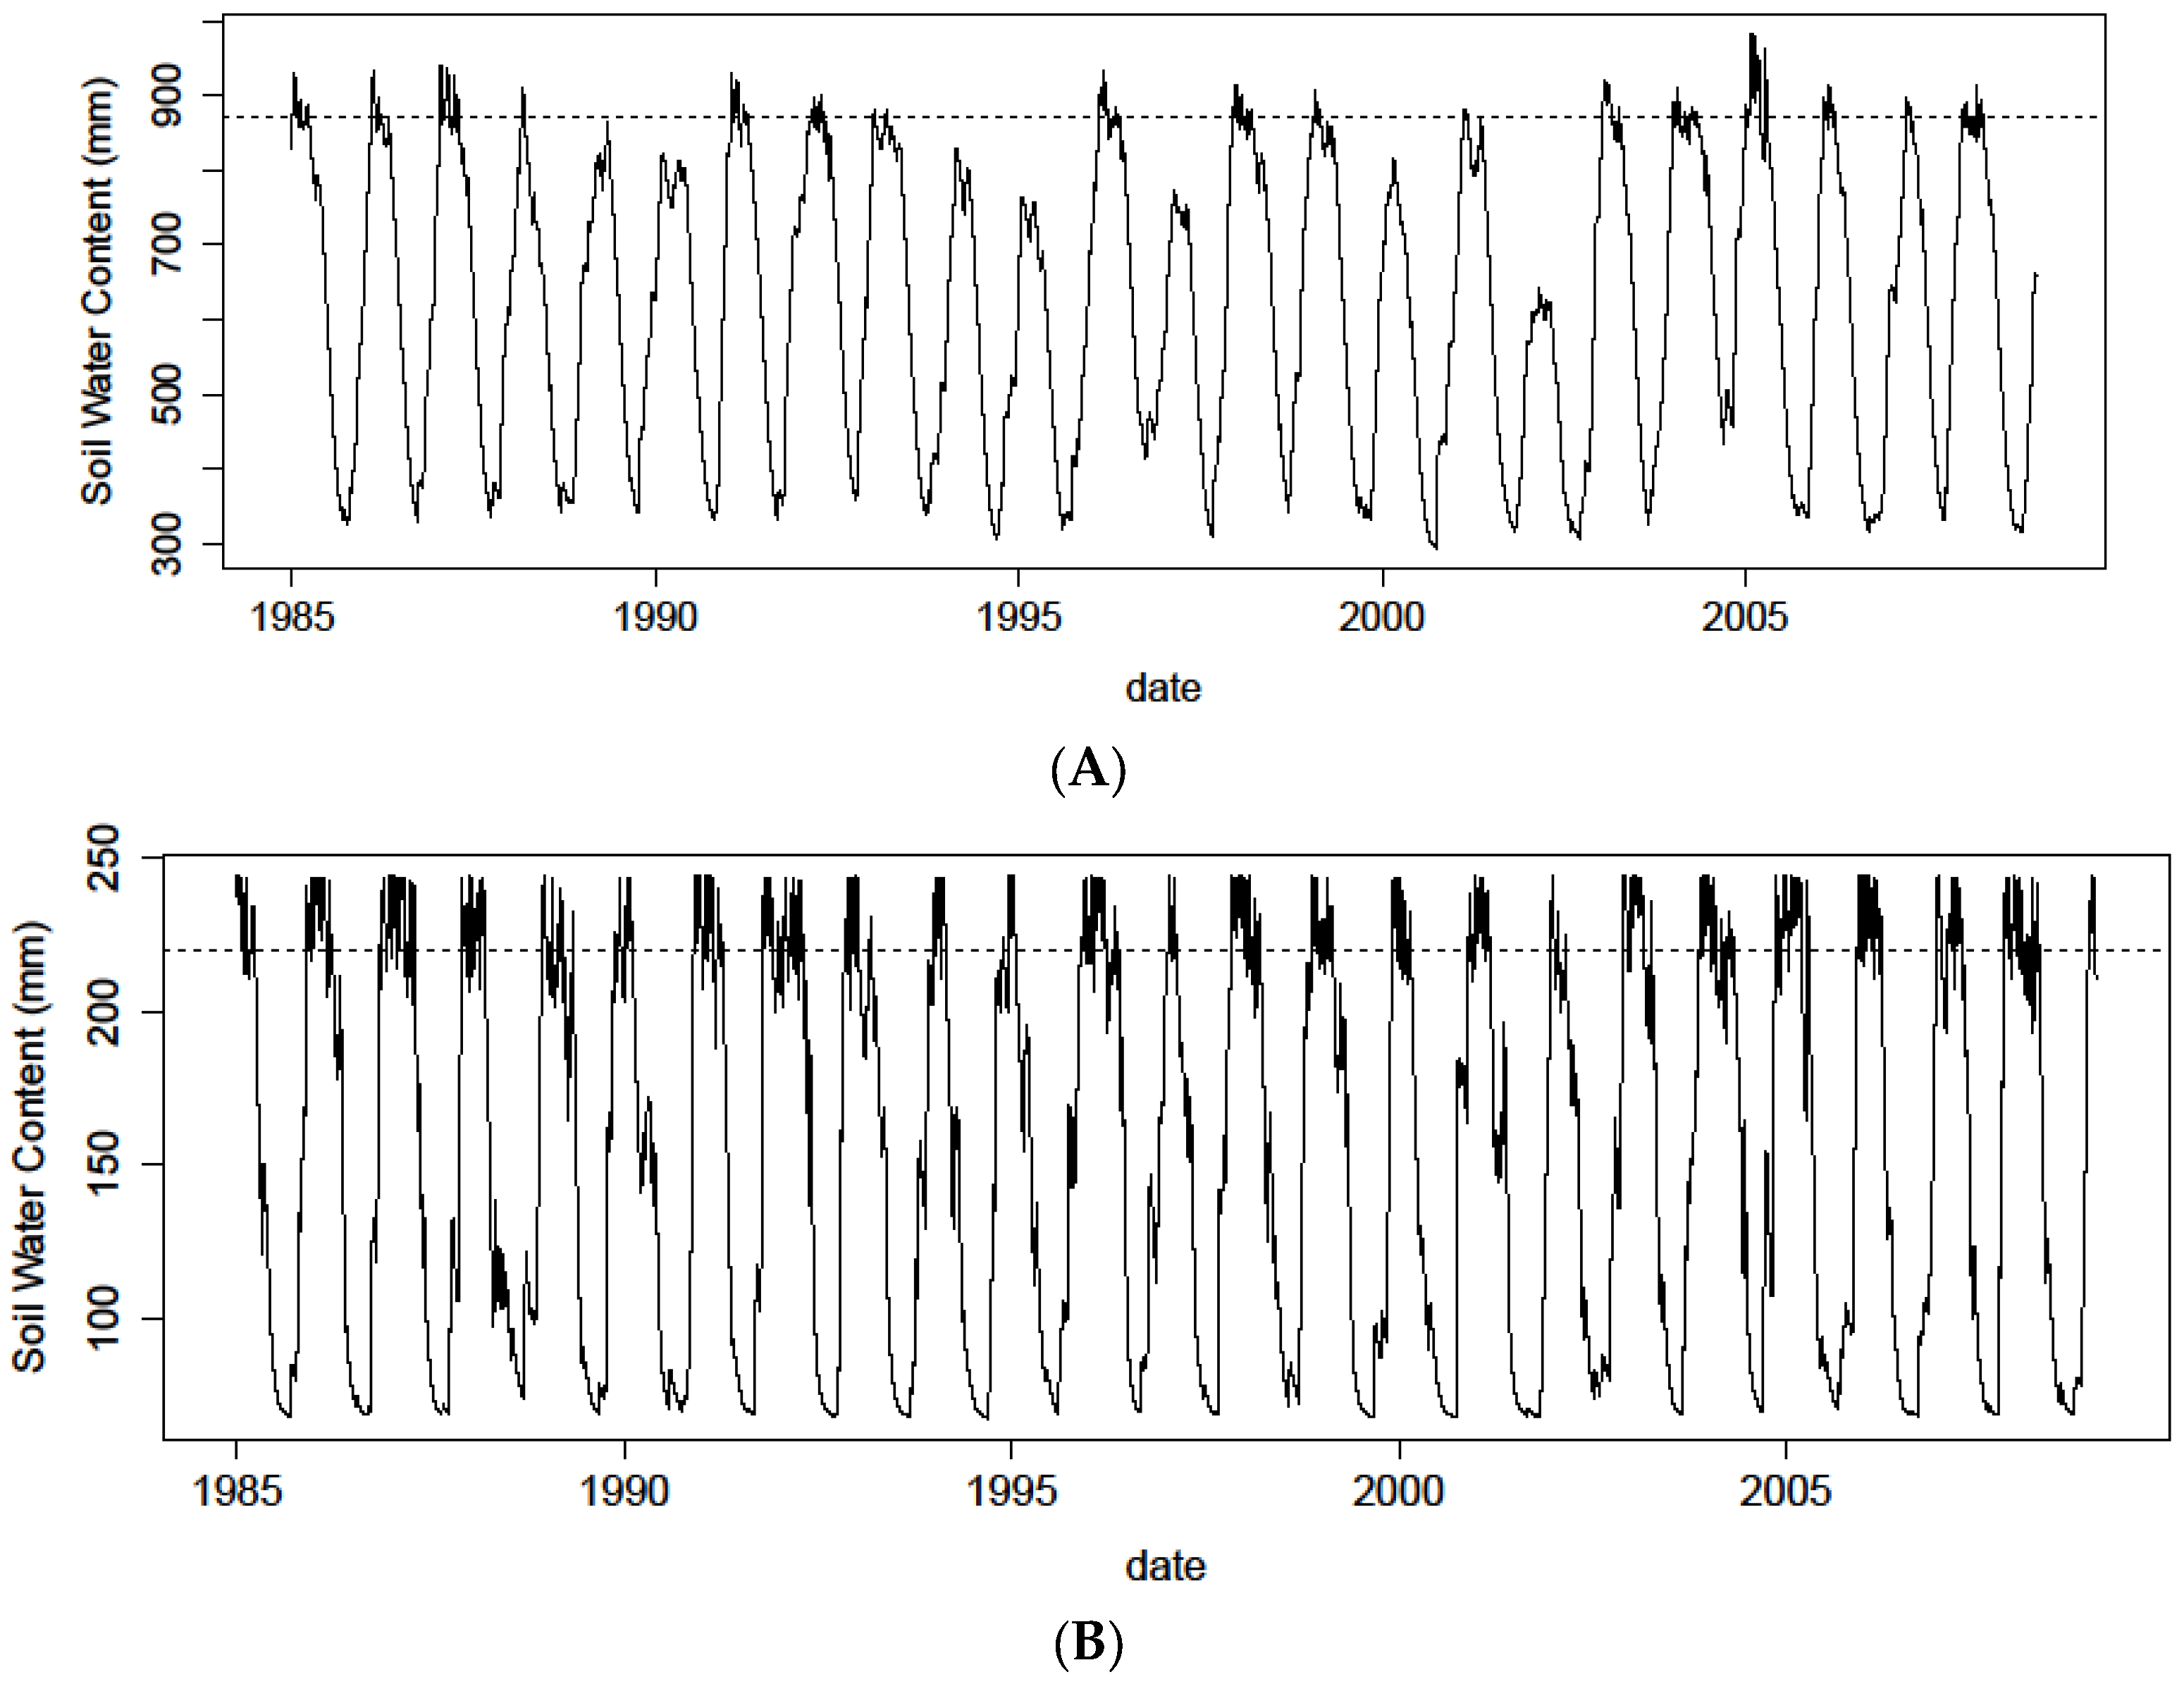
Figure 7.
Daily simulations (black line) of soil water content for the 1985–2008 period for (A) soil field capacity = 890 mm (deep soil); and (B) field capacity = 220 mm (shallow soil), based on the daily climate data from the Nefza station. The dotted line illustrates the field capacity level.
Figure 7.
Daily simulations (black line) of soil water content for the 1985–2008 period for (A) soil field capacity = 890 mm (deep soil); and (B) field capacity = 220 mm (shallow soil), based on the daily climate data from the Nefza station. The dotted line illustrates the field capacity level.
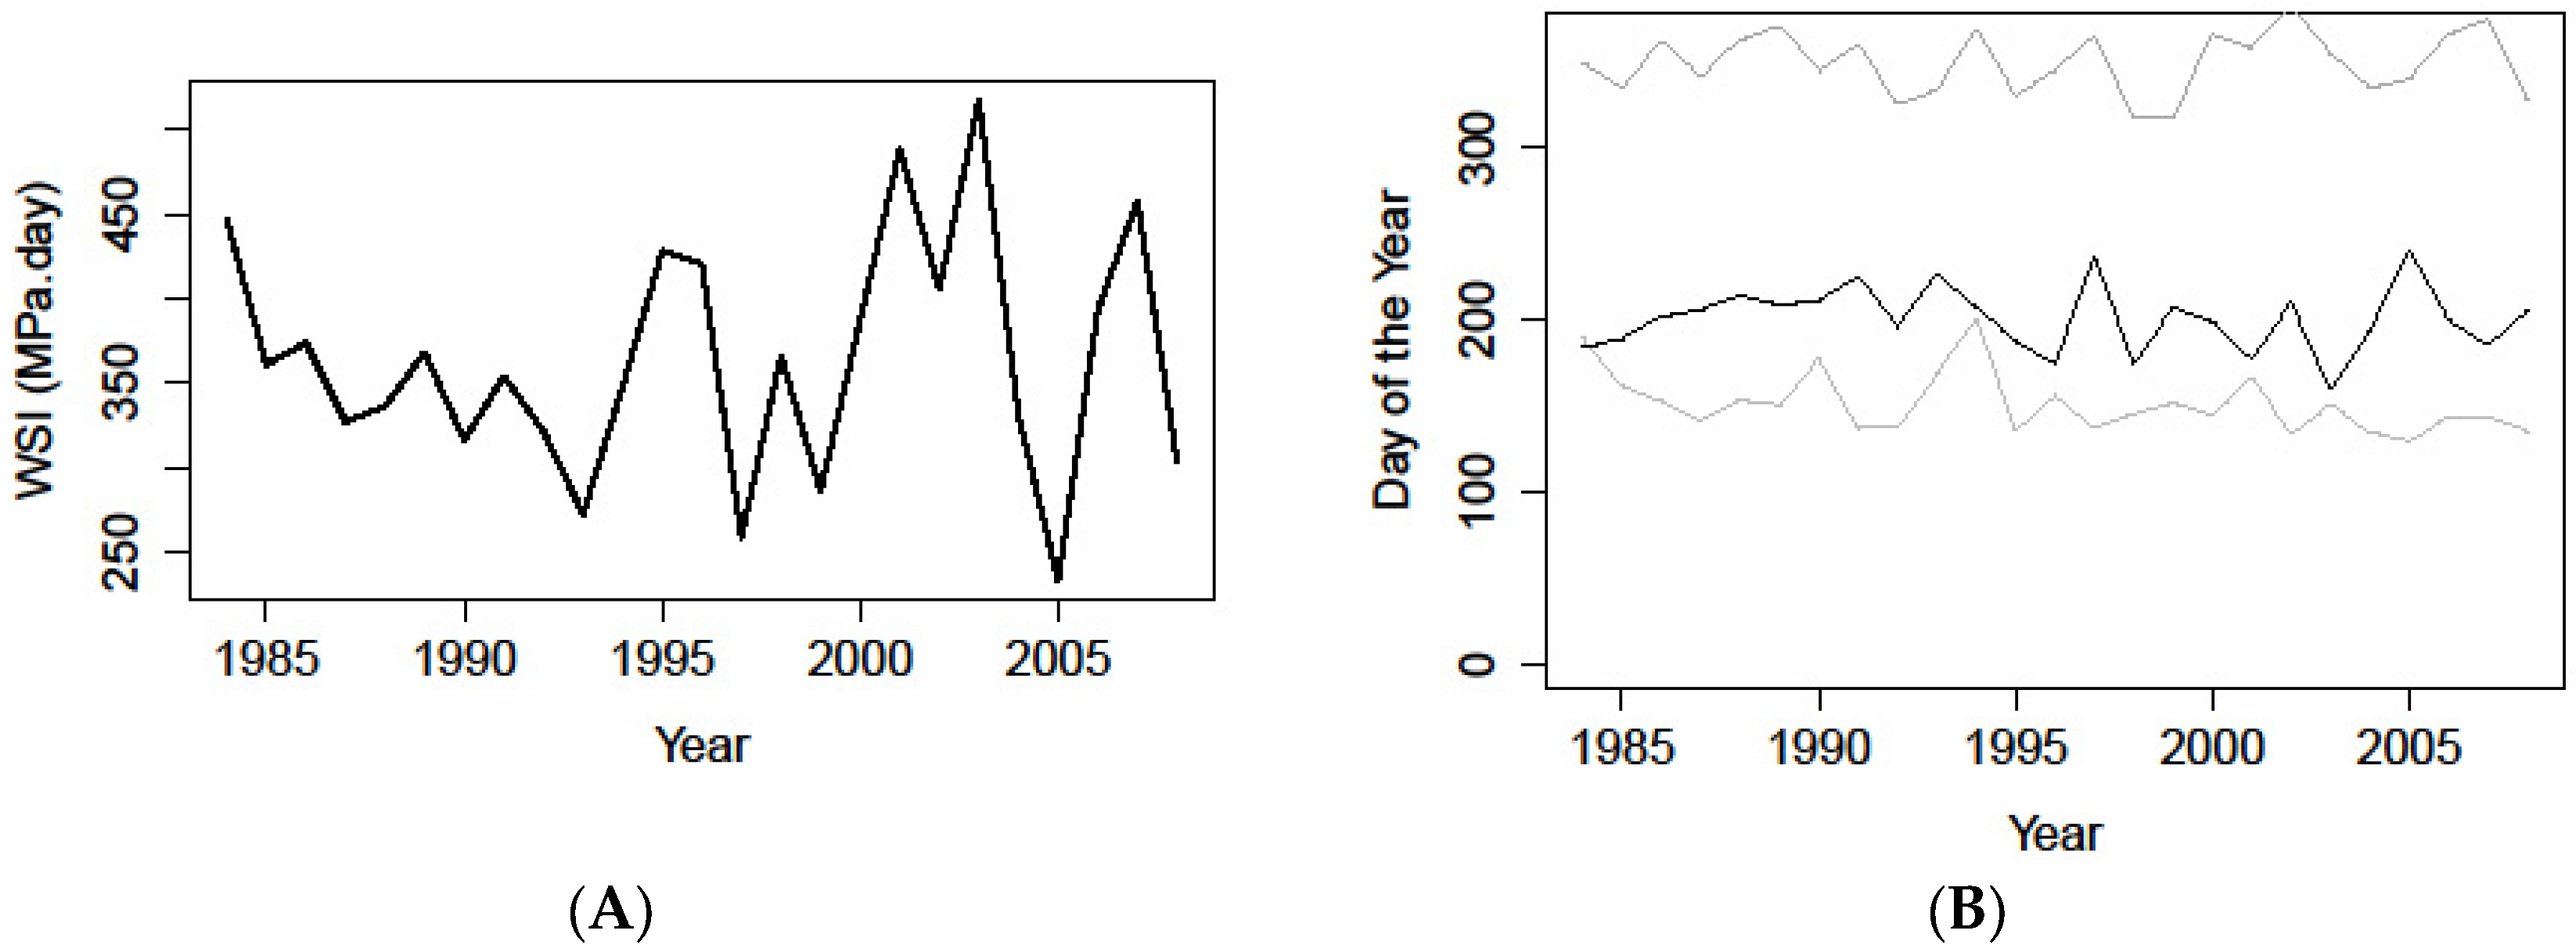
Figure 8.
(A) Yearly water stress integral (WSI MPa) simulated from the daily soil water budget and predawn water potentials for the 1985–2008 period simulated with a field capacity of 890 mm; (B) Yearly growing season start t0 (lower grey line), drought onset t1 (black line), and drought offset t2 (upper grey line), respectively, simulated from winter temperatures from January to March, and the daily water budget for the 1985–2008 period simulated with a field capacity of 890 mm.
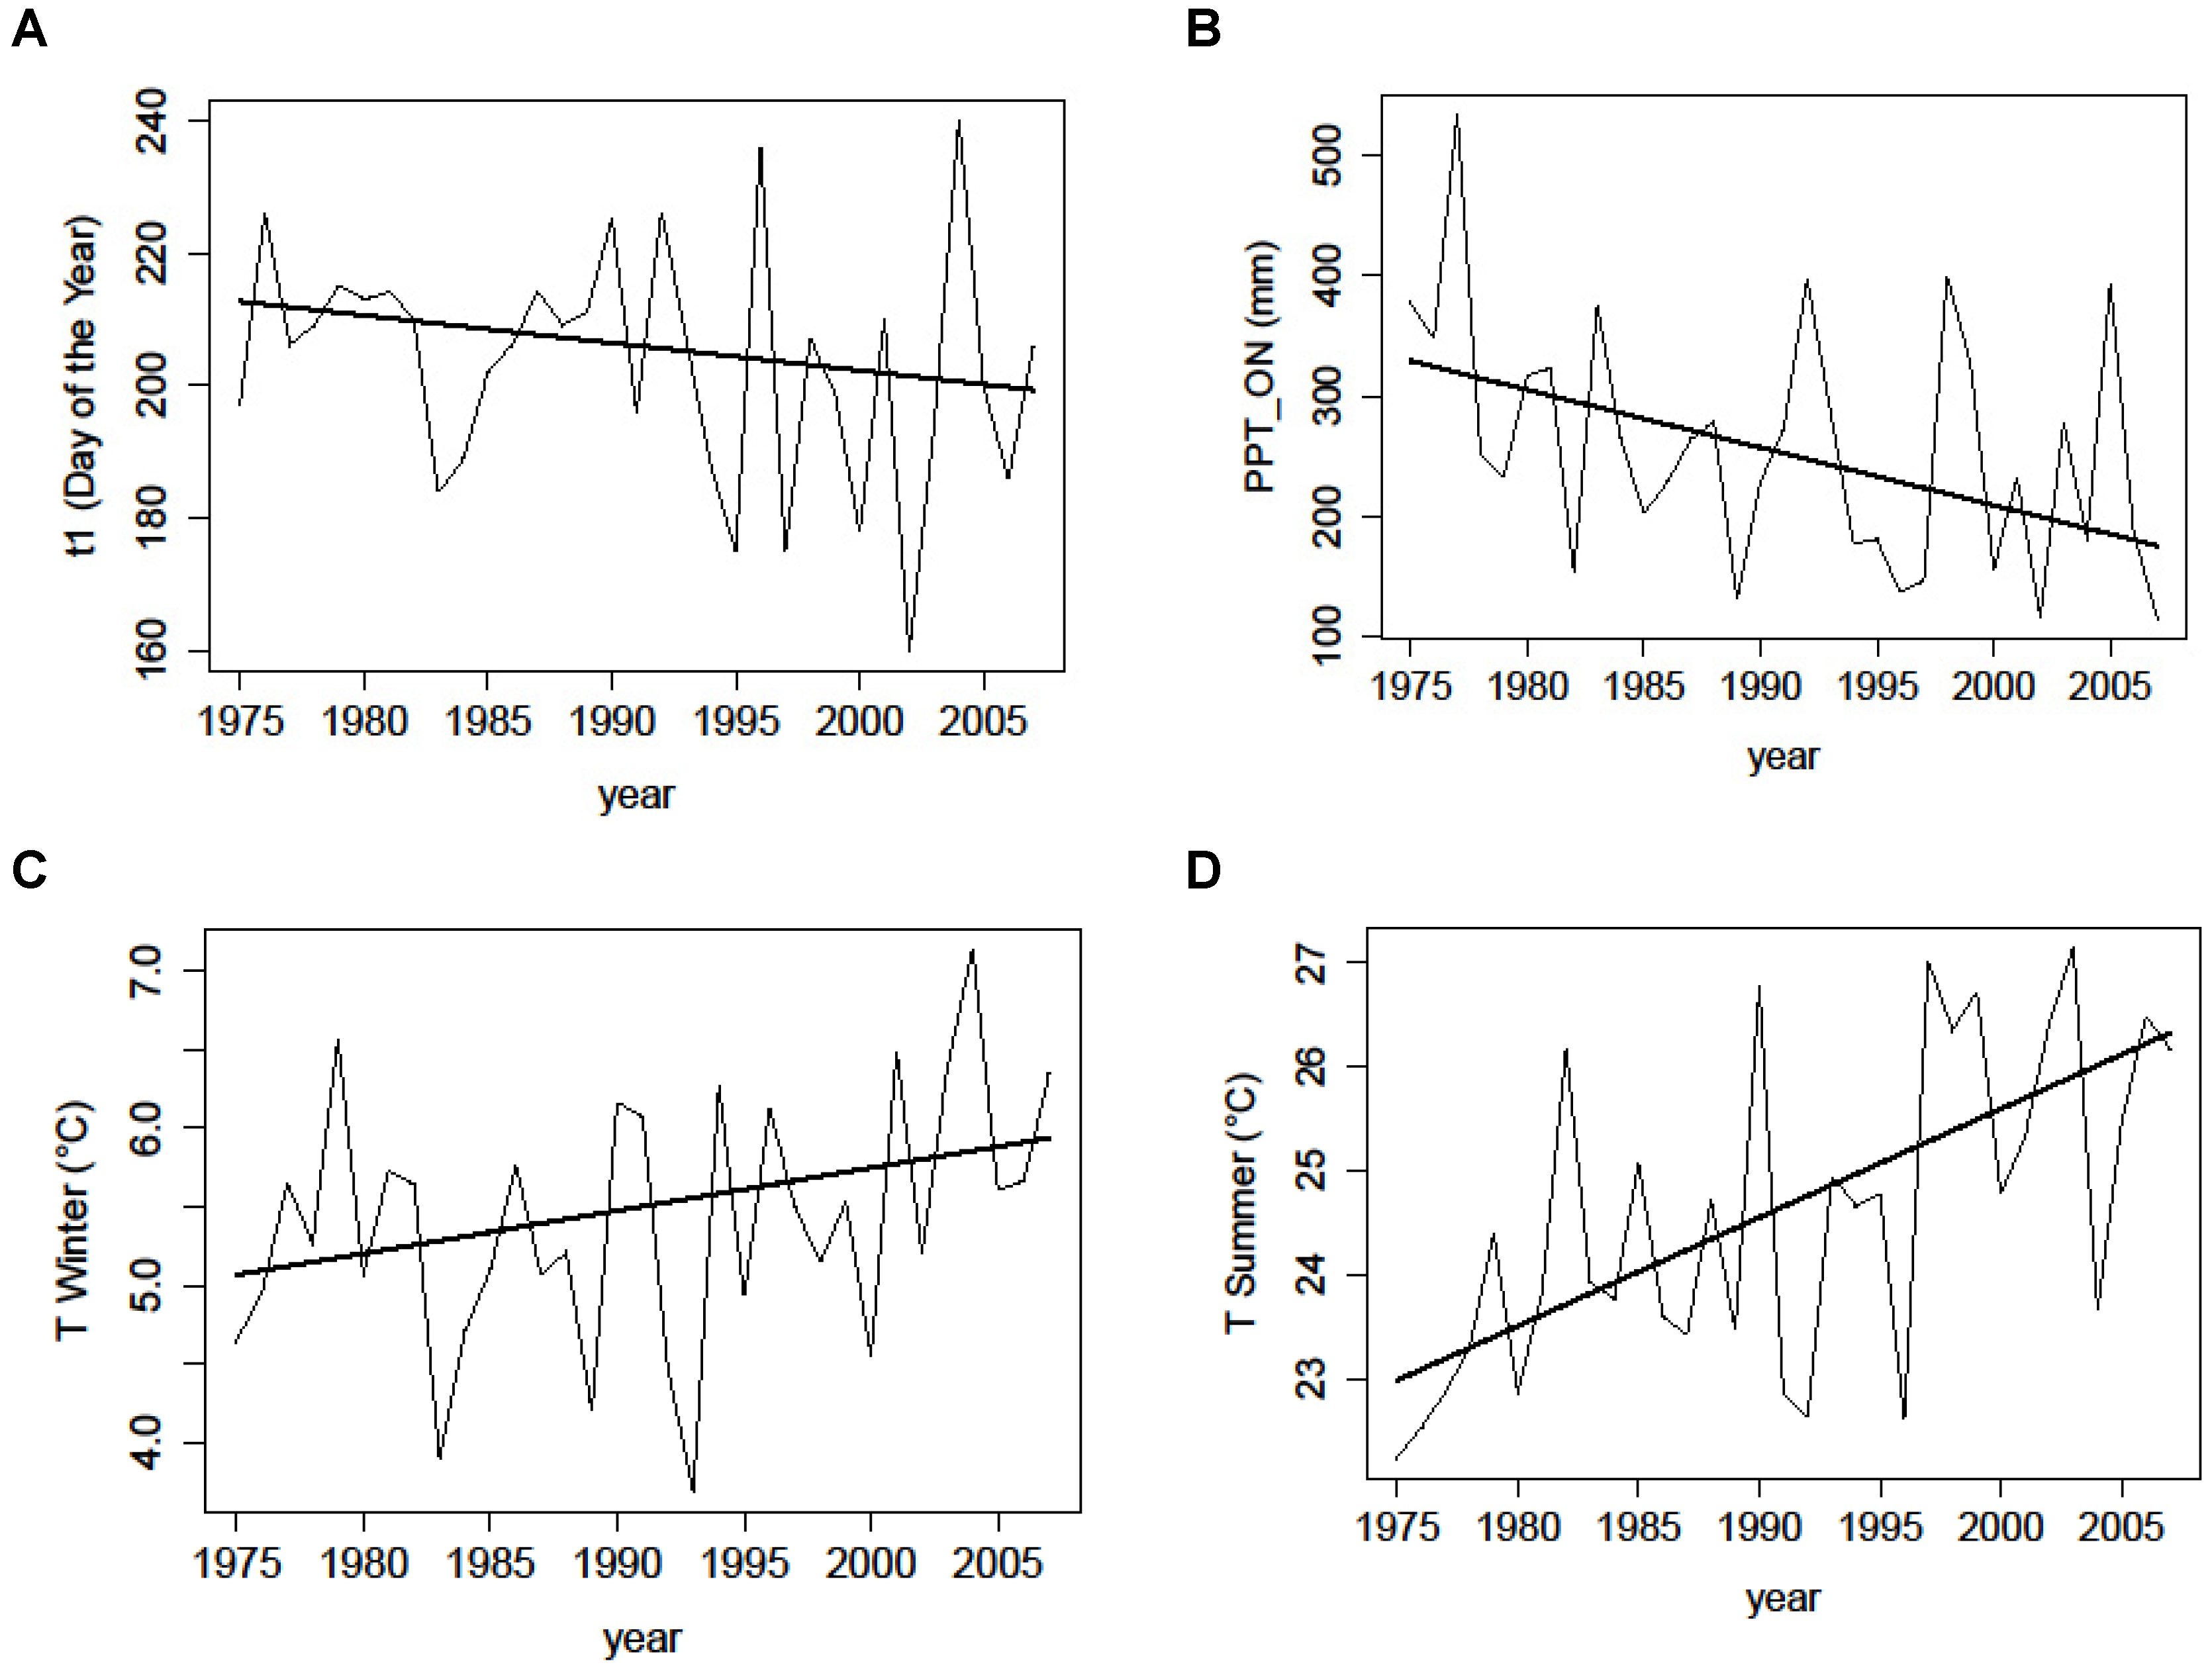
Figure 9.
Yearly values (thin black line) over the 1985–2008 period of the climate variables (drought onset t1 (A), precipitation for October November P_ON (B), winter temperatures for October-January (C), summer temperatures for June July August (D)) presenting a significant trend. The trend line (thick black line) is also shown.
Table 1.
Response function analysis of the residual tree ring chronology of Quercus suber to monthly precipitation from October (t − 1) to September (t): a- for the period 1974–2002 in the young stand (YS) and b- for the period 1937–2002 in the mature stand (MS). Monthly climate values were averaged over selected periods October-November (t − 1) (ON), December (t − 1) to February (t) (DJF), March (t) M, April–May (t) (AM), June–August (t) (JJA), and September (t) S.
| a-YS | ON | DJF | M | AM | JJA | S | Global Response Function |
| RMV | 0.550 | 0.258 | 0.304 | −0.116 | 0.210 | 0.028 | 0.506 |
| SV | 0.143 | 0.114 | 0.152 | 0.134 | 0.170 | 0.117 | 0.203 |
| RMV/SV | 3.859 | 2.268 | 2.001 | −0.867 | 1.237 | 0.240 | 2.493 |
| Significance (%) | 99.9% | 95% | 95% | NS | NS | NS | 95% |
| b-MS | ON | D | JF | MA | M | JJA | S | Global Response Function |
| RMV | 0.294 | 0.185 | −0.134 | −0.079 | 0.249 | −0.161 | −0.051 | 0.310 |
| SV | 0.085 | 0.073 | 0.092 | 0.071 | 0.094 | 0.086 | 0.088 | 0.133 |
| RMV/SV | 3.478 | 2.526 | −1.449 | −1.111 | 2.653 | −1.883 | −0.581 | 2.338 |
| Significance (%) | 99.9% | 95% | NS | NS | 99% | 90% | NS | 95% |
Table 2.
Response function analysis of the residual tree ring chronology of Quercus suber to monthly minimum TMIN and maximum TMAX temperature from October (t − 1) to September (t): A- for the period 1974–2008 in the young stand (YS) and B- for the period 1937–2008 in the mature stand (MS).
Table 2.
Response function analysis of the residual tree ring chronology of Quercus suber to monthly minimum TMIN and maximum TMAX temperature from October (t − 1) to September (t): A- for the period 1974–2008 in the young stand (YS) and B- for the period 1937–2008 in the mature stand (MS).
| A-YS | O | N | DJF | MAM | J | J | A | S | Global Response Function |
| T_MIN |
| RMV | −0.222 | −0.009 | −0.161 | 0.023 | −0.263 | −0.149 | −0.068 | 0.198 | 0.125 |
| SV | 0.169 | 0.178 | 0.204 | 0.225 | 0.219 | 0.166 | 0.157 | 0.104 | 0.254 |
| RMV/SV | −1.314 | −0.052 | −0.791 | 0.101 | −1.201 | −0.898 | −0.435 | 1.898 | 0.492 |
| Significance (%) | NS | NS | NS | NS | NS | NS | NS | 90% | NS |
| T_MAX |
| RMV | −0.199 | −0.017 | −0.043 | 0.032 | −0.249 | −0.196 | 0.049 | 0.243 | 0.140 |
| SV | 0.166 | 0.202 | 0.176 | 0.218 | 0.178 | 0.184 | 0.185 | 0.136 | 0.243 |
| RMV/SV | −1.197 | −0.085 | −0.243 | 0.147 | −1.398 | −1.063 | 0.264 | 1.794 | 0.577 |
| Significance (%) | NS | NS | NS | NS | NS | NS | NS | 90% | NS |
| B-MS | O | N | DJF | MA | M | JJ | A | S | Global Response Function |
| TMIN |
| RMV | −0.194 | 0.066 | −0.301 | 0.147 | 0.072 | −0.117 | −0.152 | 0.074 | 0.052 |
| SV | 0.164 | 0.100 | 0.172 | 0.109 | 0.074 | 0.167 | 0.099 | 0.085 | 0.169 |
| RMV/SV | −1.182 | 0.660 | −1.753 | 1.352 | 0.966 | −0.702 | −1.537 | 0.878 | 0.308 |
| Significance (%) | NS | NS | 90% | NS | NS | NS | NS | NS | NS |
| T_MAX |
| RMV | −0.224 | −0.006 | −0.400 | 0.023 | 0.136 | −0.066 | −0.111 | −0.029 | 0.094 |
| SV | 0.190 | 0.138 | 0.233 | 0.133 | 0.157 | 0.183 | 0.102 | 0.085 | 0.174 |
| RMV/SV | −1.177 | −0.041 | −1.714 | 0.170 | 0.865 | −0.360 | −1.094 | −0.339 | 0.540 |
| Significance (%) | NS | NS | 90% | NS | NS | NS | NS | NS | NS |
Table 3.
Pearson’s correlations (coefficient correlation (Corr) and p-value) between annual tree ring width and annual water stress integral WSI, start of the growing season (t0), end of the growing season (t1), length of the spring growing season (t1 − t0), length of the whole year growing including autumnal secondary growth (t1 − t0 + t2), and length of the summer growth break (t2 − t1) for the mature stand (MS) and the young stand (YS). NS: non-significant, *: significant at p < 0.1, **: significant at p < 0.05, ***: significant at p < 0.01.
| | WSI | t0 | t1 | t1 − t0 | t1 − t0 + t2 | t2 − t1 |
|---|
| YS Corr. | −0.428 | −0.358 | 0.244 | 0.3839 | 0.527 | −0.473 |
| p-value | ** | * | NS | * | *** | ** |
| MS Corr. | −0.467 | −0.01 | 0.447 | 0.364 | 0.368 | −0.427 |
| p-value | ** | NS | ** | * | * | ** |
Table 4.
Correlation coefficients and p-value between drought onset (t1) and WSI (simulated from a water budget model with field capacity FC = 890 mm and FC = 220 m) with the sum of precipitations for selected months. NS: non-significant, *: significant at p < 0.1, **: significant at p < 0.05, ***: significant at p < 0.01.
| FC = 890 mm | ON | D | DJF | JF | M | MA | AM | M | JJA |
| t1 Corr. | 0.378 | 0.0024 | 0.0568 | 0.073 | 0.27 | 0.43 | 0.648 | 0.62 | 0.35 |
| significance | *** | NS | NS | NS | * | *** | *** | *** | ** |
| WSI Corr. | −2.97 | 0.12 | −0.23 | −0.39 | −1.77 | −2.92 | −4.23 | −3.6 | −3.13 |
| p-value | *** | NS | NS | NS | * | *** | *** | *** | *** |
| FC = 220 mm | ON | D | DJF | JF | M | MA | AM | M | JJA |
| t1 Corr. | 0.178 | −0.039 | 0.048 | 0.092 | 0.335 | 0.494 | 0.607 | 0.501 | 0.044 |
| p-value | NS | NS | NS | NS | *** | *** | *** | *** | NS |
| WSI Corr. | −1.22 | 0.23 | 0.59 | 0.61 | 0.16 | −0.73 | −1.9 | −1.3 | −8.42 |
| p-value | NS | NS | NS | NS | NS | NS | * | NS | *** |
Table 5.
Temporal trend in climate variables (temperatures for June, July, and August (T_JJA), October, November, December, and January (T_ONDJ)), precipitations for October and November (P_ON), March and April (P_MA), April and May (P_AM), and June, July, and August (P_JJA), and the simulated (field capacity 890 mm) wood phenology start date (t0), drought onset (t1), drought offset (t2), length of the wood growth period (t1 − t0), and the annual water stress integral (WSI) for the 1985–2008 period obtained from a bootstrapped Theil Sen test. NS: non-significant, *: significant at p < 0.1, **: significant at p < 0.05, ***: significant at p < 0.01.
| | T_JJA | T_ONDJ | P_ON | P_MA | P_AM | P_JJA |
| Slope | 0.104 | 0.027 | −4.82 | −2.36 | 0.096 | −0.343 |
| p-value | 0.000 *** | 0.06 * | 0.023 ** | 0.194 (NS) | 0.96 (NS) | 0.373(NS) |
| | t0 | t1 - t0 | t1 | t2 | WSI | |
| slope | −0.41 | −0.28 | −0.42 | −0.11 | 4.70 | |
| p-value | 0.06 * | 0.46(NS) | 0.100 * | 0.91(NS) | 0.36 (NS) | |


 ,
, 


