1. Introduction
It has been proposed that species turnover during secondary succession in wet tropical forests is mainly driven by decreasing light availability [
1]. Species composition changes during succession from dominance of species that have an “acquisitive resource capture strategy”, that grow fast and require high light levels, to species that have a “conservative resource capture strategy”, that grow slow and persist in the shaded understory [
2,
3,
4]. Early successional, acquisitive, species develop cheap, short-lived leaves with high specific leaf area (SLA) and photosynthetic rates (A) to achieve fast growth (e.g., [
1,
5,
6]). Late successional, conservative, species persist by having tough leaves that are long-lived and efficiently utilize light. This continuum is in line with the leaf economics spectrum (LES) [
5] and the plant economics spectrum [
7,
8]. The LES highlights the leaf traits associated with light acquisition, critical for leaf carbon balances, but leaf traits associated with water acquisition remain largely undiscussed. Leaves form an important bottleneck in the plant water transport system, since the resistance of evaporating water through the stomata is much higher than the resistance of the sap flow in xylem [
9,
10]. It is thus remarkable that the role of water availability as a driving factor of succession remains poorly studied [
11].
The leaves of pioneer species are expected to be large and thin to allow for efficient light interception, to have high photosynthetic rates enabling fast growth, and to have high relative water content which is thought to be associated with extensive water losses [
8,
12]. As a result, these pioneers do not only require considerable light influx but also high water availability and they are expected to have low drought tolerance [
13]. Additionally, pioneer’s low wood density probably implies a lower resistance to drought-induced embolisms [
14,
15]. Pioneers are therefore expected to show higher mortality in dry episodes compared to late successional species under the same conditions. These expectations imply a transition from high light and water demand early in succession, to high tolerance to shade and drought later in succession [
12,
16,
17].
The opening of stomata for gas interchange during photosynthesis is directly coupled with water loss. Water movement throughout the plant is defined by hydraulic conductance of the leaves (K
leaf) and leaf stomatal conductance (g
s), while stomata regulation depends on the hydration level of the leaf [
18]. A well-hydrated leaf has high stomatal conductance, facilitating fluent sap-flow from the xylem to the leaf veins during photosynthesis. Leaf hydration is indicated by leaf water potential (Ψ
leaf) or relative water content (RWC) [
18,
19,
20,
21]. A dehydrating leaf (decreasing Ψ
leaf and RWC) will exhibit a decrease in leaf hydraulic and stomatal conductance until the stomata close or cavitation occurs [
16]. The sensitivity of the plant to dehydration differs among species and depends on the species ability to keep hydraulic and stomatal conductance sufficiently high during dehydration [
10,
20,
22]. Recent studies show that drought-tolerant species from dry forests react more gradually to drought and tolerate larger water losses when compared to drought-intolerant species from wet forests [
20,
23,
24]. In secondary forests, during succession, small, regenerating trees compete for water with larger trees that exhibit high transpiration rates (e.g., [
25]). We expect that drought tolerance is mainly determined by leaf functioning and that it increases with successional status. To this end we measured stomatal conductance of dehydrating leaves, and analyzed the change in mortality rate in dry
versus wet years.
In this paper, we assess the importance of leaf shade and drought tolerance in explaining abundance and mortality of tree species across a successional gradient in a moist tropical forest in southern Mexico. We address these issues by combining a morphological and physiological approach at the leaf level (measuring leaf morphological traits and water fluxes) with a field demographic approach, which was used to quantify the abundance and mortality rate of 25 tree species during the first 30 years of succession. Additionally, we documented changes in understory light availability and soil water availability during succession.
This study was carried out in Marqués de Comillas in Chiapas, Mexico, part of the Mesoamerican biodiversity hotspot. Biodiversity is threatened by ongoing deforestation, forest degradation and climate change [
26]. The study area is characterized by high yearly precipitation rates (3000 mm/yr), but a dry season from February to April may pose severe drought stress, possibly influencing species selection during succession. We assigned a successional status to a set of 25 common species, based on their relative abundance during the first 30 years of secondary succession. We defined the abiotic environment in terms of light and water availability for secondary forests of different ages. For each species, we quantified average trait values that indicate light and water demand. Finally we linked leaf shade and leaf drought tolerance to their species performance during succession. We hypothesized that (I) light and water availability decrease during succession; (II) light acquisition traits (e.g., specific leaf area, photosynthetic rate, and light compensation point) and water acquisition traits (e.g., relative water content, maximum stomatal conductance and drought sensitivity) decrease with succession; and (III) in dry years, the mortality rate of early successional species increases more strongly than that of late successional species.
2. Methods
2.1. Location and Species Selection
Fieldwork took place in the area of Loma Bonita (16°01′ N, 90°55′ W), a village located in the Marqués de Comillas region, in the southeast of Mexico. Mean annual temperature is 24 °C, and annual average rainfall is 3000 mm, with a dry period (<60 mm per month) between February and April [
27]. The dominant vegetation is tropical rain forest, that varies in structure and composition depending on soil type and topography [
28]. Old-growth forest occupies approximately 34% of the landscape, 24% is covered by secondary forest of different ages, and 42% is dedicated to agricultural purposes [
29].
2.2. Study Chronosequence
Around Loma Bonita, we selected 17 secondary forest plots, developed by natural regeneration in abandoned cornfields, and with varying fallow age between 4 and 29 years. In each forest, a 0.1 ha (20 × 50 m) permanent plot was established. Each plot was divided into two 10 × 50 m subplots. We identified and measured all individuals with DBH ≥ 1 cm in one subplot and all individuals DBH ≥ 5 cm in the other one. All stem-level variables were scaled up according to sampling effort per size-class, so the relative number of individuals and relative basal area per species as well as stand basal area (m2/ha) are corrected for the differential DBH threshold in the subplots. Twenty-five tree species were selected for shade and drought tolerance measurements based on their high abundance in the secondary plots and their spread across different successional stages. Of these 25 species, 9 were deciduous and 16 species were evergreen.
2.3. Successional Ranking of Species during Succession
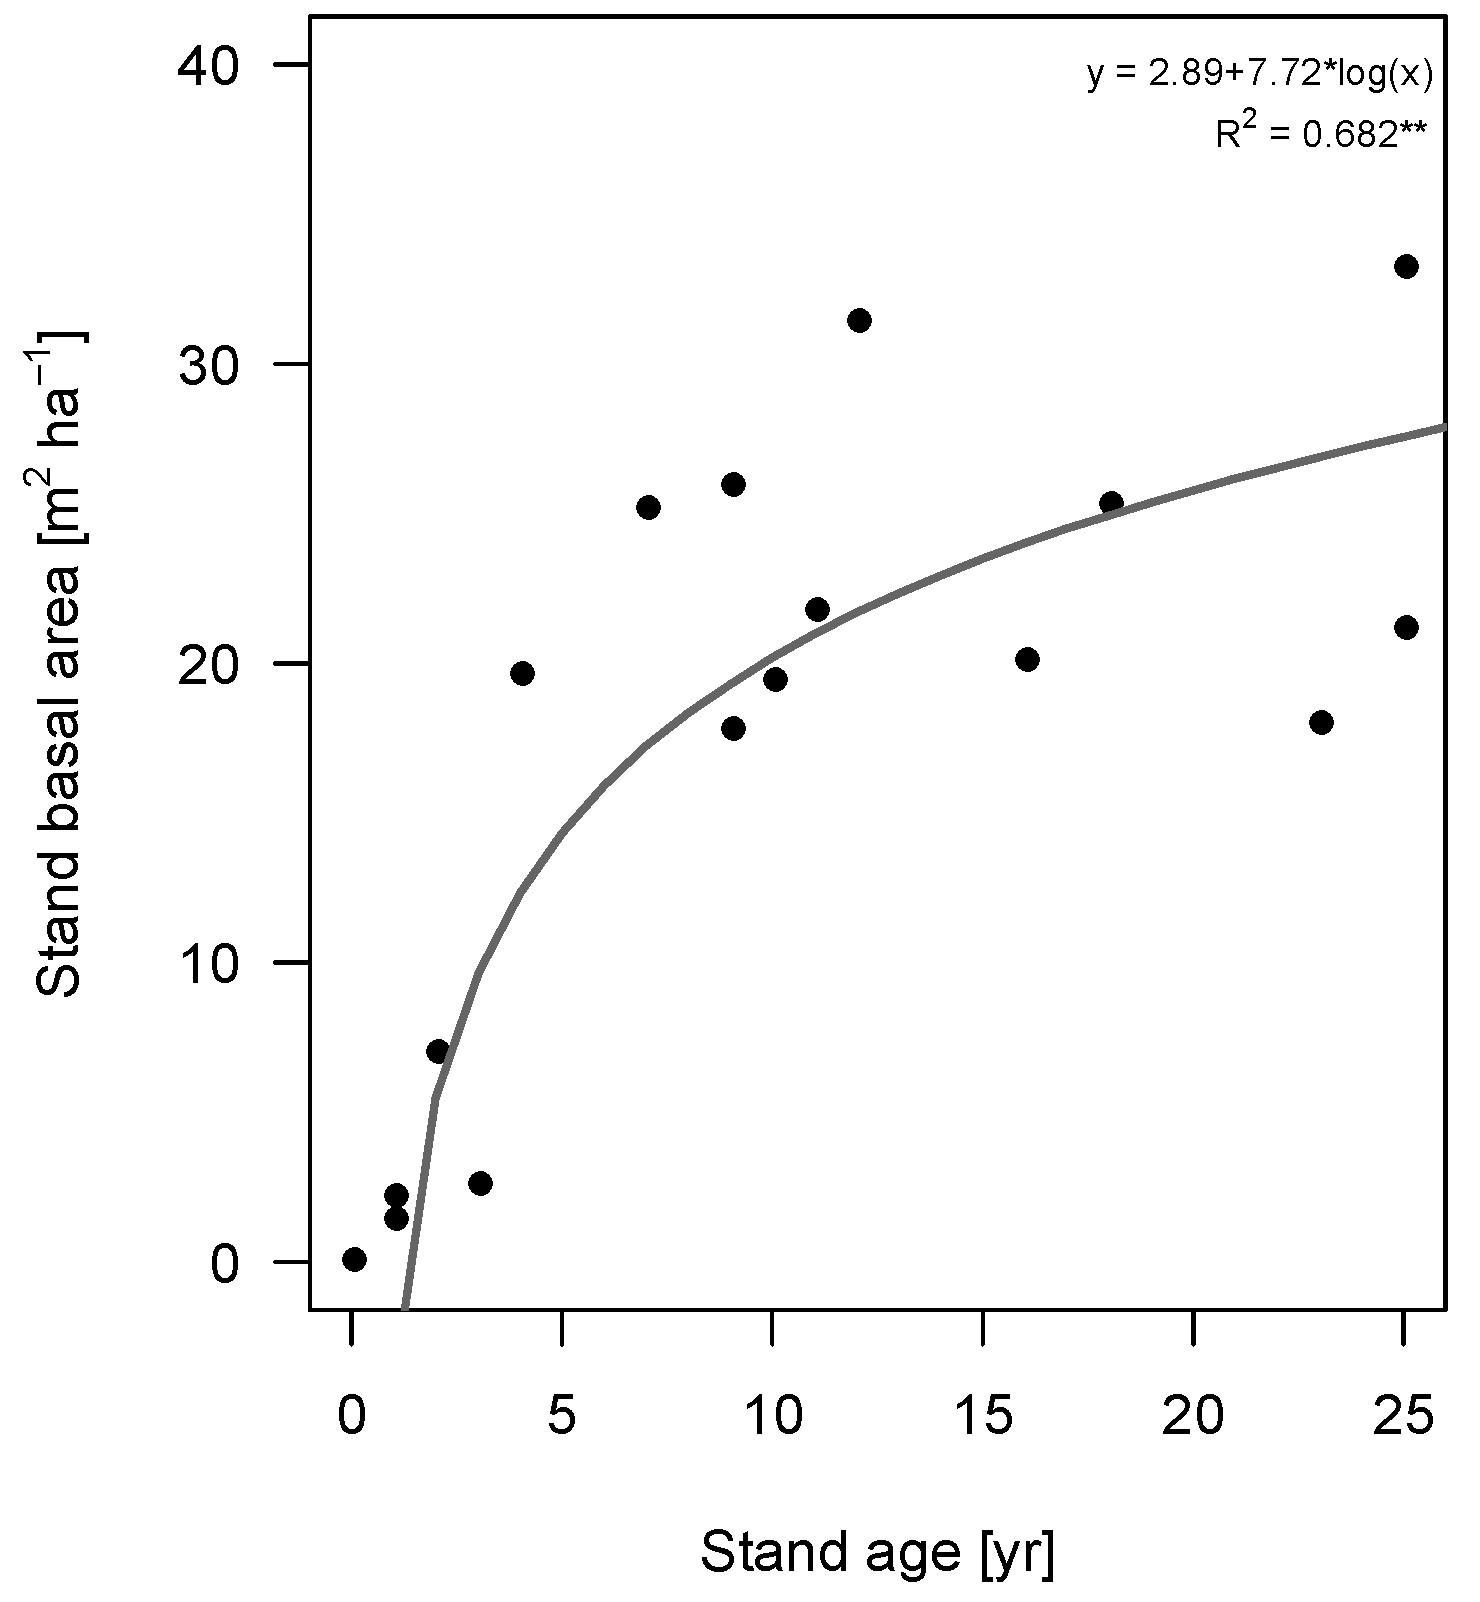
We estimated the successional position of each species using their relative abundance along different ages of succession. For every species, relative abundance in each plot was multiplied by the corresponding stand basal area (m
2/ha), and these values were added up to get the weighted average stand basal area where the species is relatively most abundant [
30]. Stand basal area is a structural variable of succession, indicative of forest structure and understory environmental conditions [
31] as well as competitive interactions [
32,
33]. We used stand basal area as indicator for succession and number of individuals as indicator for species abundance, because (I) a logarithmic relationship between stand basal area and stand age facilitates distinguishing changes in species composition during succession, and (II) the influence of possible remnant trees on the population is not exaggerated when using number of individuals, which would be the case when using species basal area.
2.4. Light and Water Availability
To assess the light conditions during succession, canopy openness (%) in the understory (1 m above ground) was estimated in 15 out of 17 secondary forest plots with a spherical densiometer (model-A, Forest Densiometers, Rapid City, South Dakota, US) in a transect along the middle length of the site. Every 5 m, two measurements were taken, one facing north and one facing east. This resulted in a total of 20 measurements per site, which were averaged. Measurements took place in 2008 and 2012.
Soil moisture was measured in the plots as an indicator of water availability, both in the dry (March 2009) and wet (December 2013) season at 60 mm depth using the ML2x Theta probe combined with HH2 Moisture meter readout device (DeltaT devices). Soil moisture was measured at nine points that were systematically spread. Measurements were repeated in two consecutive days when the weather conditions during the sampling days were constant.
2.5. Morphological Traits
Plant traits were measured following standardized protocols [
34,
35]. The leaf traits related to light acquisition comprised: (i) leaf area (LA, m
2; including petiole), measured using a flatbed scanner and image processing software (ImageJ); composite leaves were scanned including the rachis [
34]. Leaves too large for the scanner were cut and scanned in pieces. (ii) Specific leaf area (SLA, m
2/kg) calculated dividing leaf area by oven-dry weight; (iii) Leaf toughness (MN/m
2) was measured with a penetrometer, a flat-end nail attached to the inner part of a syringe, and a water basin on top. Toughness was measured by adding water to the water basin until the nail ruptured the leaf, after which the weight added was converted into Mega Newton [
36]. The leaf traits related to water acquisition included: (i) leaf dry matter content (LDMC, %), it was calculated as dry weight divided by fresh weight (fully hydrated) (× 100%) and (ii) relative water content (RWC, %), calculated as 100% minus LDMC.
2.6. Physiological Traits and Measures of Tolerance
For both shade and drought tolerance we have included a physiological trait that directly measures the fluxes of resources. These give a good indication of the leaf’s physiological response to changing conditions. The leaf traits referring to light included photosynthetic rate (A, µmol/m
2/s) and light compensation point (LCP, µmol/m
2/s). The latter indicates the light intensity that is needed to reach the photosynthesis rate that exactly matches the rate of respiration. Light compensation point is a proxy for shade tolerance so that shade tolerant tree species will have a low light compensation point,
i.e., low light levels are enough to compensate for respiration. It was calculated using the formula given in Johnson and Thornley [
37], by setting the the right-hand side of the equation to zero:
where
I is light intensity,
qy is quantum yield of a tree species, measured and calculated using Instantaneous Chlorophyll Fluorescence [
38], Amax is the maximum photosynthetic rate of a tree species, and θ is the curvature, which is parameterized at 0.5.
Photosynthetic rate was measured using LCpro-SD (ADC BioScientific Limited). Settings were standardized approaching as much as possible optimal conditions for the plants in this region: 1000 PAR irradiance, 400 ppm CO2 and 27 °C. Per species, five healthy looking, small adult trees were selected that were as much as possible exposed to the sun, anywhere in the landscape. Measurements were taken on two leaves per individual and ten measurements per leaf, to diminish the effect of outliers on the mean. Measuring times were between 8.00 and 12.00 to reduce variation in climatic conditions during the day and to avoid a possible midday depression in photosynthetic rates due to overload of irradiance. Measurements were taken during December 2012, at the end of the wet season, this was to avoid water deficiency which may influence photosynthetic rates. Individuals of a species were sampled over the entire period to reduce the effect of climate variability on the species level data.
Stomatal conductance (gs) was considered as a hydraulic flux and measured using the recently developed Evaporative flux method (EFM) [
24]. The EFM has the advantage of closely following the natural pathway of water through the leaf, since it is based on transpirational water movement under high radiation [
24]. We measured stomatal conductance of dehydrating leaves, to test for species-specific vulnerability to increased drought. We followed the protocol given in Sack and Scoffoni [
24], but used relative water content as a measure for leaf hydration level, instead of leaf water potential as prescribed in the protocol. Per species, at least 5 leaves of one individual were measured, each leaf at a different leaf hydration level. Using the measured water flux, stomatal conductance was calculated. Drought response curves were created by plotting normalized stomatal conductance (g
s/g
smax) against relative water content (RWC). Normalized stomatal conductance is used to eliminate the effect of g
smax on the slope of the curve. Using linear regression, the slope of each species’ drought response curve was estimated (slope B). Slope B was used as an indicator for drought tolerance.
2.7. Statistical Analysis
Linear, logarithmic and exponential regression models were used to test how canopy openness and soil moisture contents change with successional age (years) and stand basal area (m2/ha). The best fitting curve was chosen based on the lowest AIC. We regressed species’ functional traits (SLA, Amax and LCP, and RWCmax, gsmax and slope B) against species’ successional position (stand basal area, m2/ha). To evaluate coupling between leaf shade and drought dependent traits we calculated Spearman’s rank correlations for all trait pairs. To test whether deciduousness was related to species successional position, we used binary logistic regression (evergreen vs. deciduousness).
To assess whether pioneers are more vulnerable to drought than late successional species, we first calculated each species’ mean annual mortality rate (m) in all plots over a period of 10 years (2001–2010).
where N
t−1 is population size at
t−1, and N
t is population size at year
t minus the newly recruited individuals, in year
t. We then regressed mean annual mortality against successional status using linear and exponential models.
To identify drought vulnerable species,
i.e., species that exhibit disproportionally higher mortality in dry years, we selected the three wettest years (2001, 2004, 2006) and the three driest years (2002, 2005, 2010) using the Palmer’s drought severity index (PDSI) as indicator for drought (
Figure S3) [
39]. For each species we eliminated those years for which the population consisted of less than 5 individuals. Only species that were included in at least 2 wet and 2 dry years were analyzed, which were 21 out of 25 species. Subsequently we tested whether species’ mortality was higher in dry years than in wet years with a Wilcoxon matched pairs test, where mortality in dry and mortality in wet years for each species is considered a pair.
We calculated per species the ratio (m
ratio) between mortality in wet and in dry years:
where m
ratio is the mortality ratio between dry and wet years, m
dry is mortality of a species in the driest years (2002, 2005, 2010) and m
wet is mortality of a species in the wettest years (2001, 2004, 2006) [
39]. The ratio has values from 0 to 1, where values close to 0 indicate lower mortality in dry years than in wet years (drought tolerant), values of 0.5 indicate no difference in mortality between wet and dry years, and values close to 1 indicate higher mortality in dry years than in wet years (drought intolerant). We correlated the ratio (m
ratio) to the species’ successional status using Spearman’s correlation analysis, to test whether late successional species were more drought tolerant than early successional species. All statistical analyses were carried out in SPSS 20.0 (Armonk, NY, USA, IBM Corp.).
3. Results
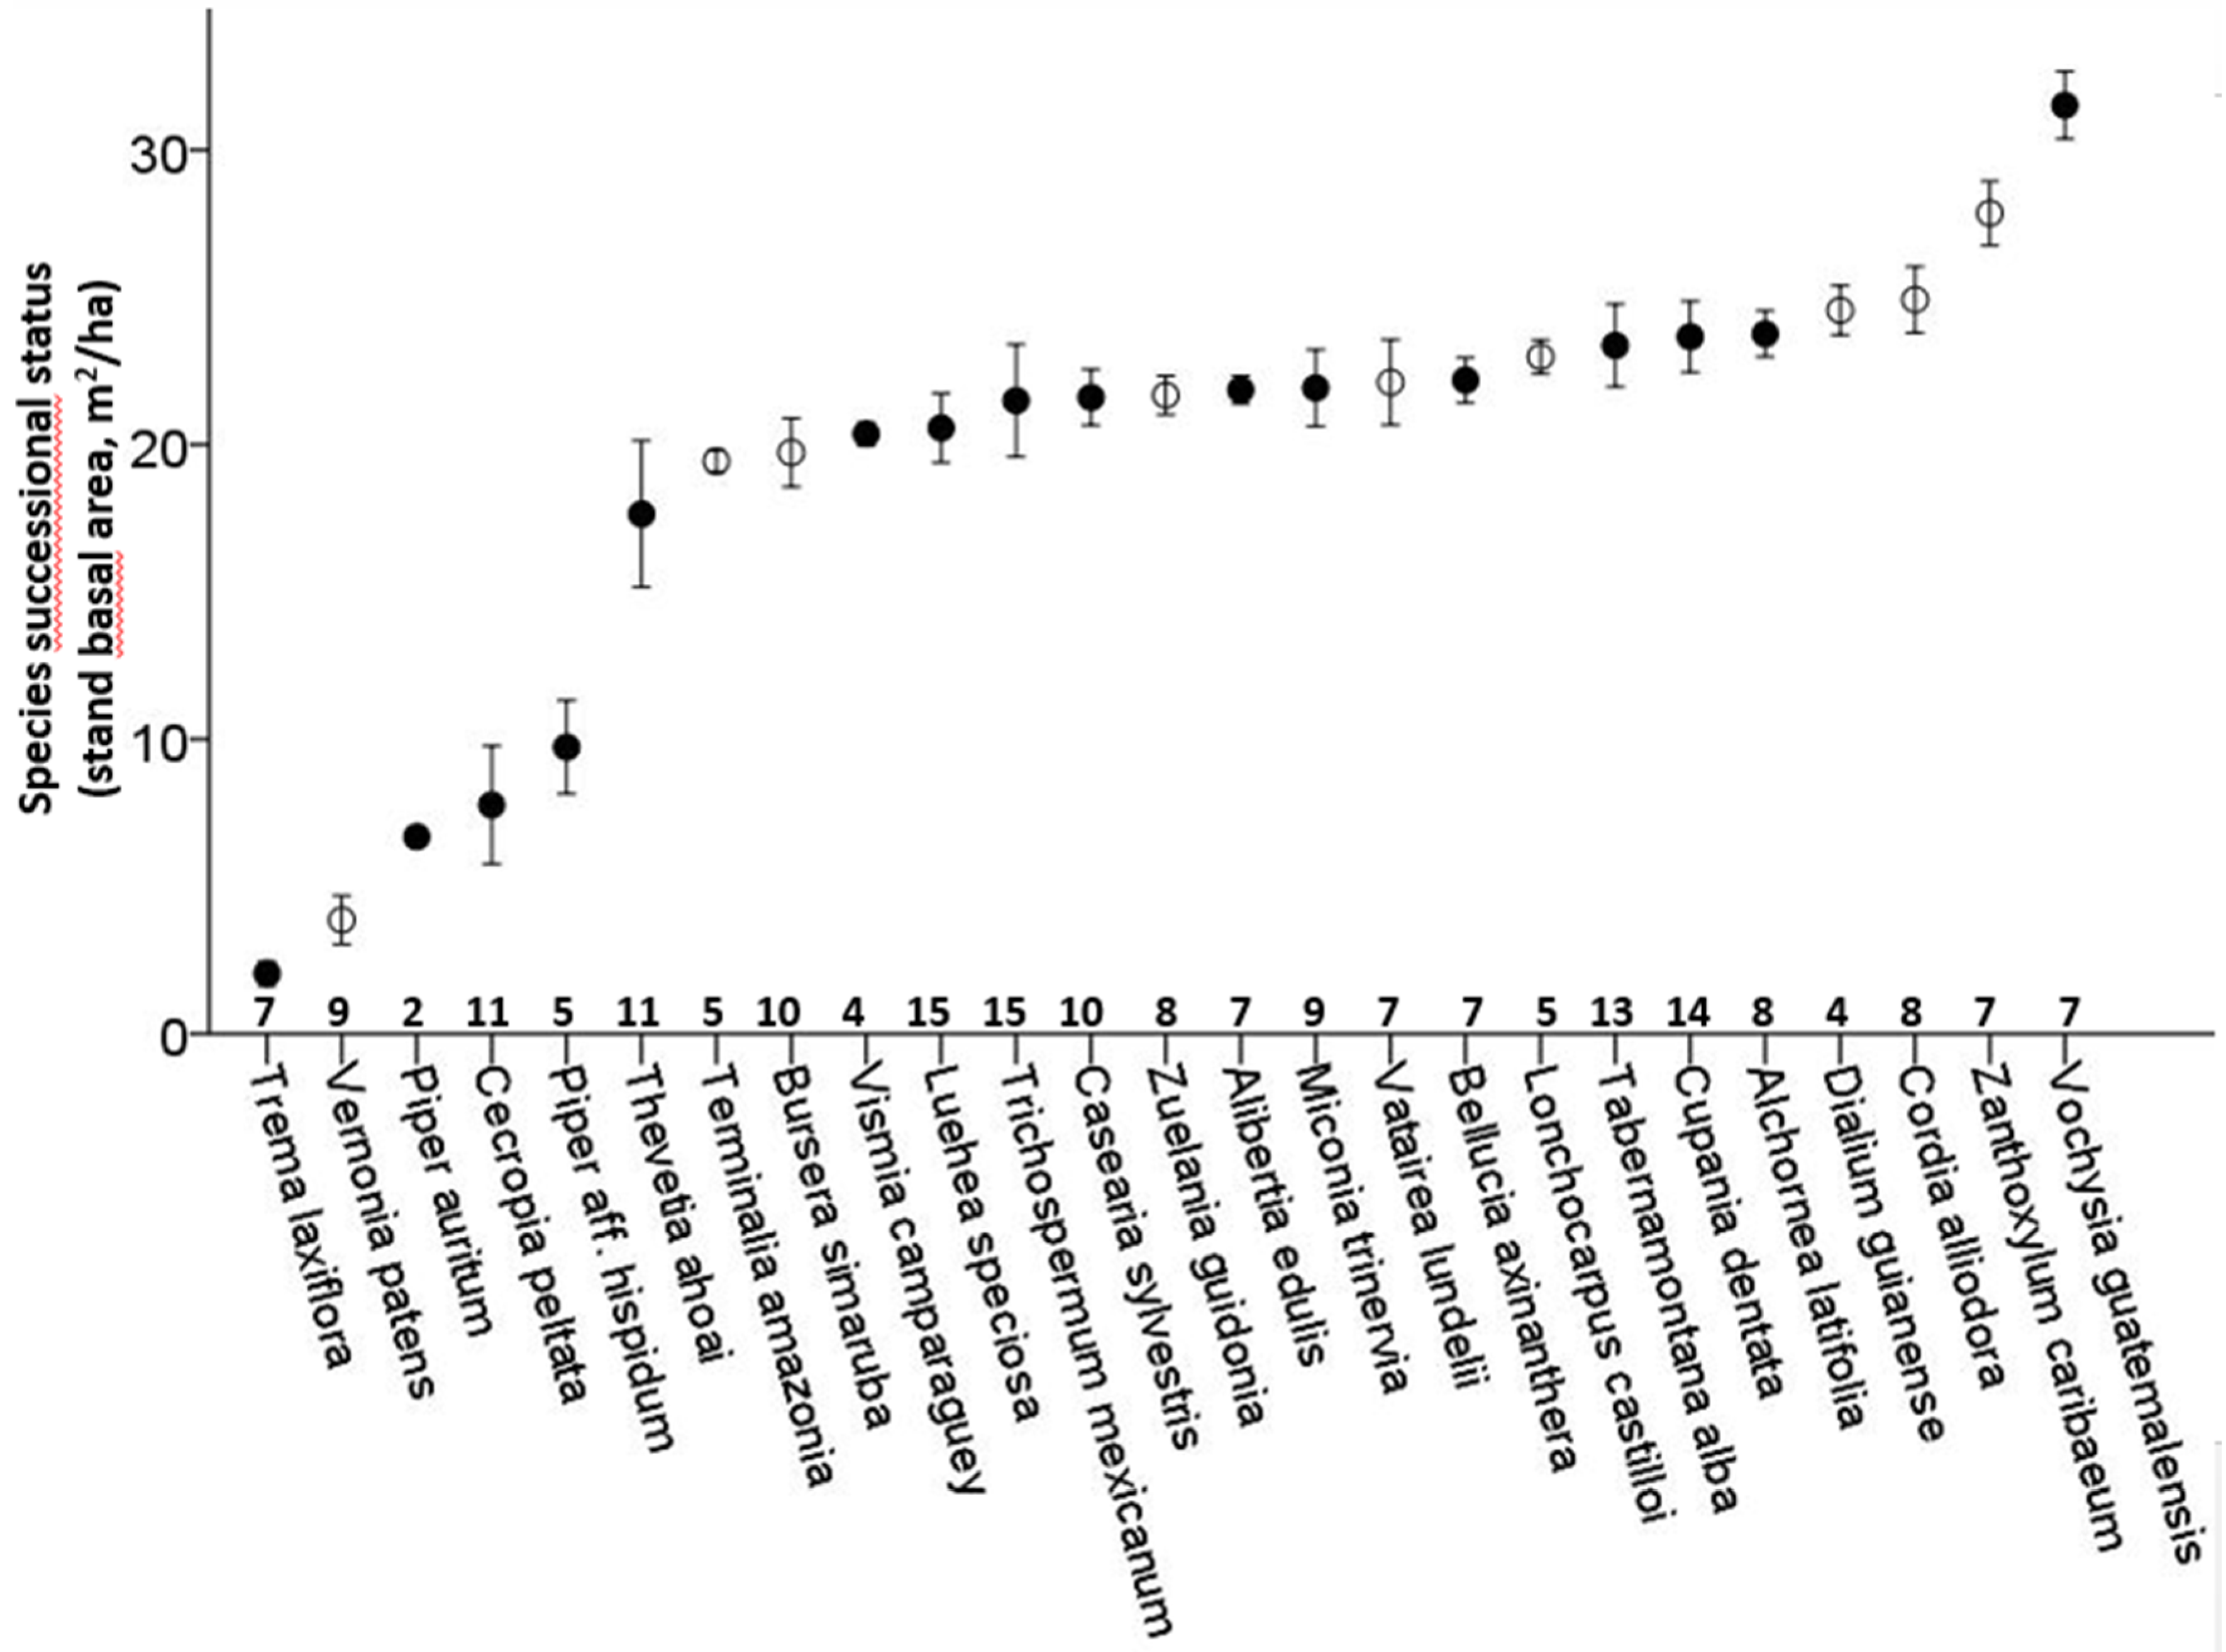
The 25 selected species occurred in 8.3 ± 3.4 out of the 15 plots, with only
Luehea speciosa and
Trichospermum mexicanum occurring in all plots. The successional status of the species lies between 1.4 m
2/ha and 33.3 m
2/ha, with a large proportion of the species having their maximum in plots of 20–25 m
2/ha (
Figure 1). Deciduousness was not significantly related to successional status (Binary logistic regression,
p = 0.44,
Figure 1).
Figure 1.
Successional status of 25 tree species of secondary successional tropical rain forest plots in Marqués de Comillas, Chiapas, Mexico. Successional status is defined as the average stand basal area of the plots where the species occurs, weighted for relative abundance (in number of individuals). Species are sorted from early to late successional. Vertical lines indicate standard error of the mean. Open symbols correspond to deciduous species, closed symbols to evergreen species. Numbers on the x-axis indicate the number of plots, out of a total of 15, in which the species is present.
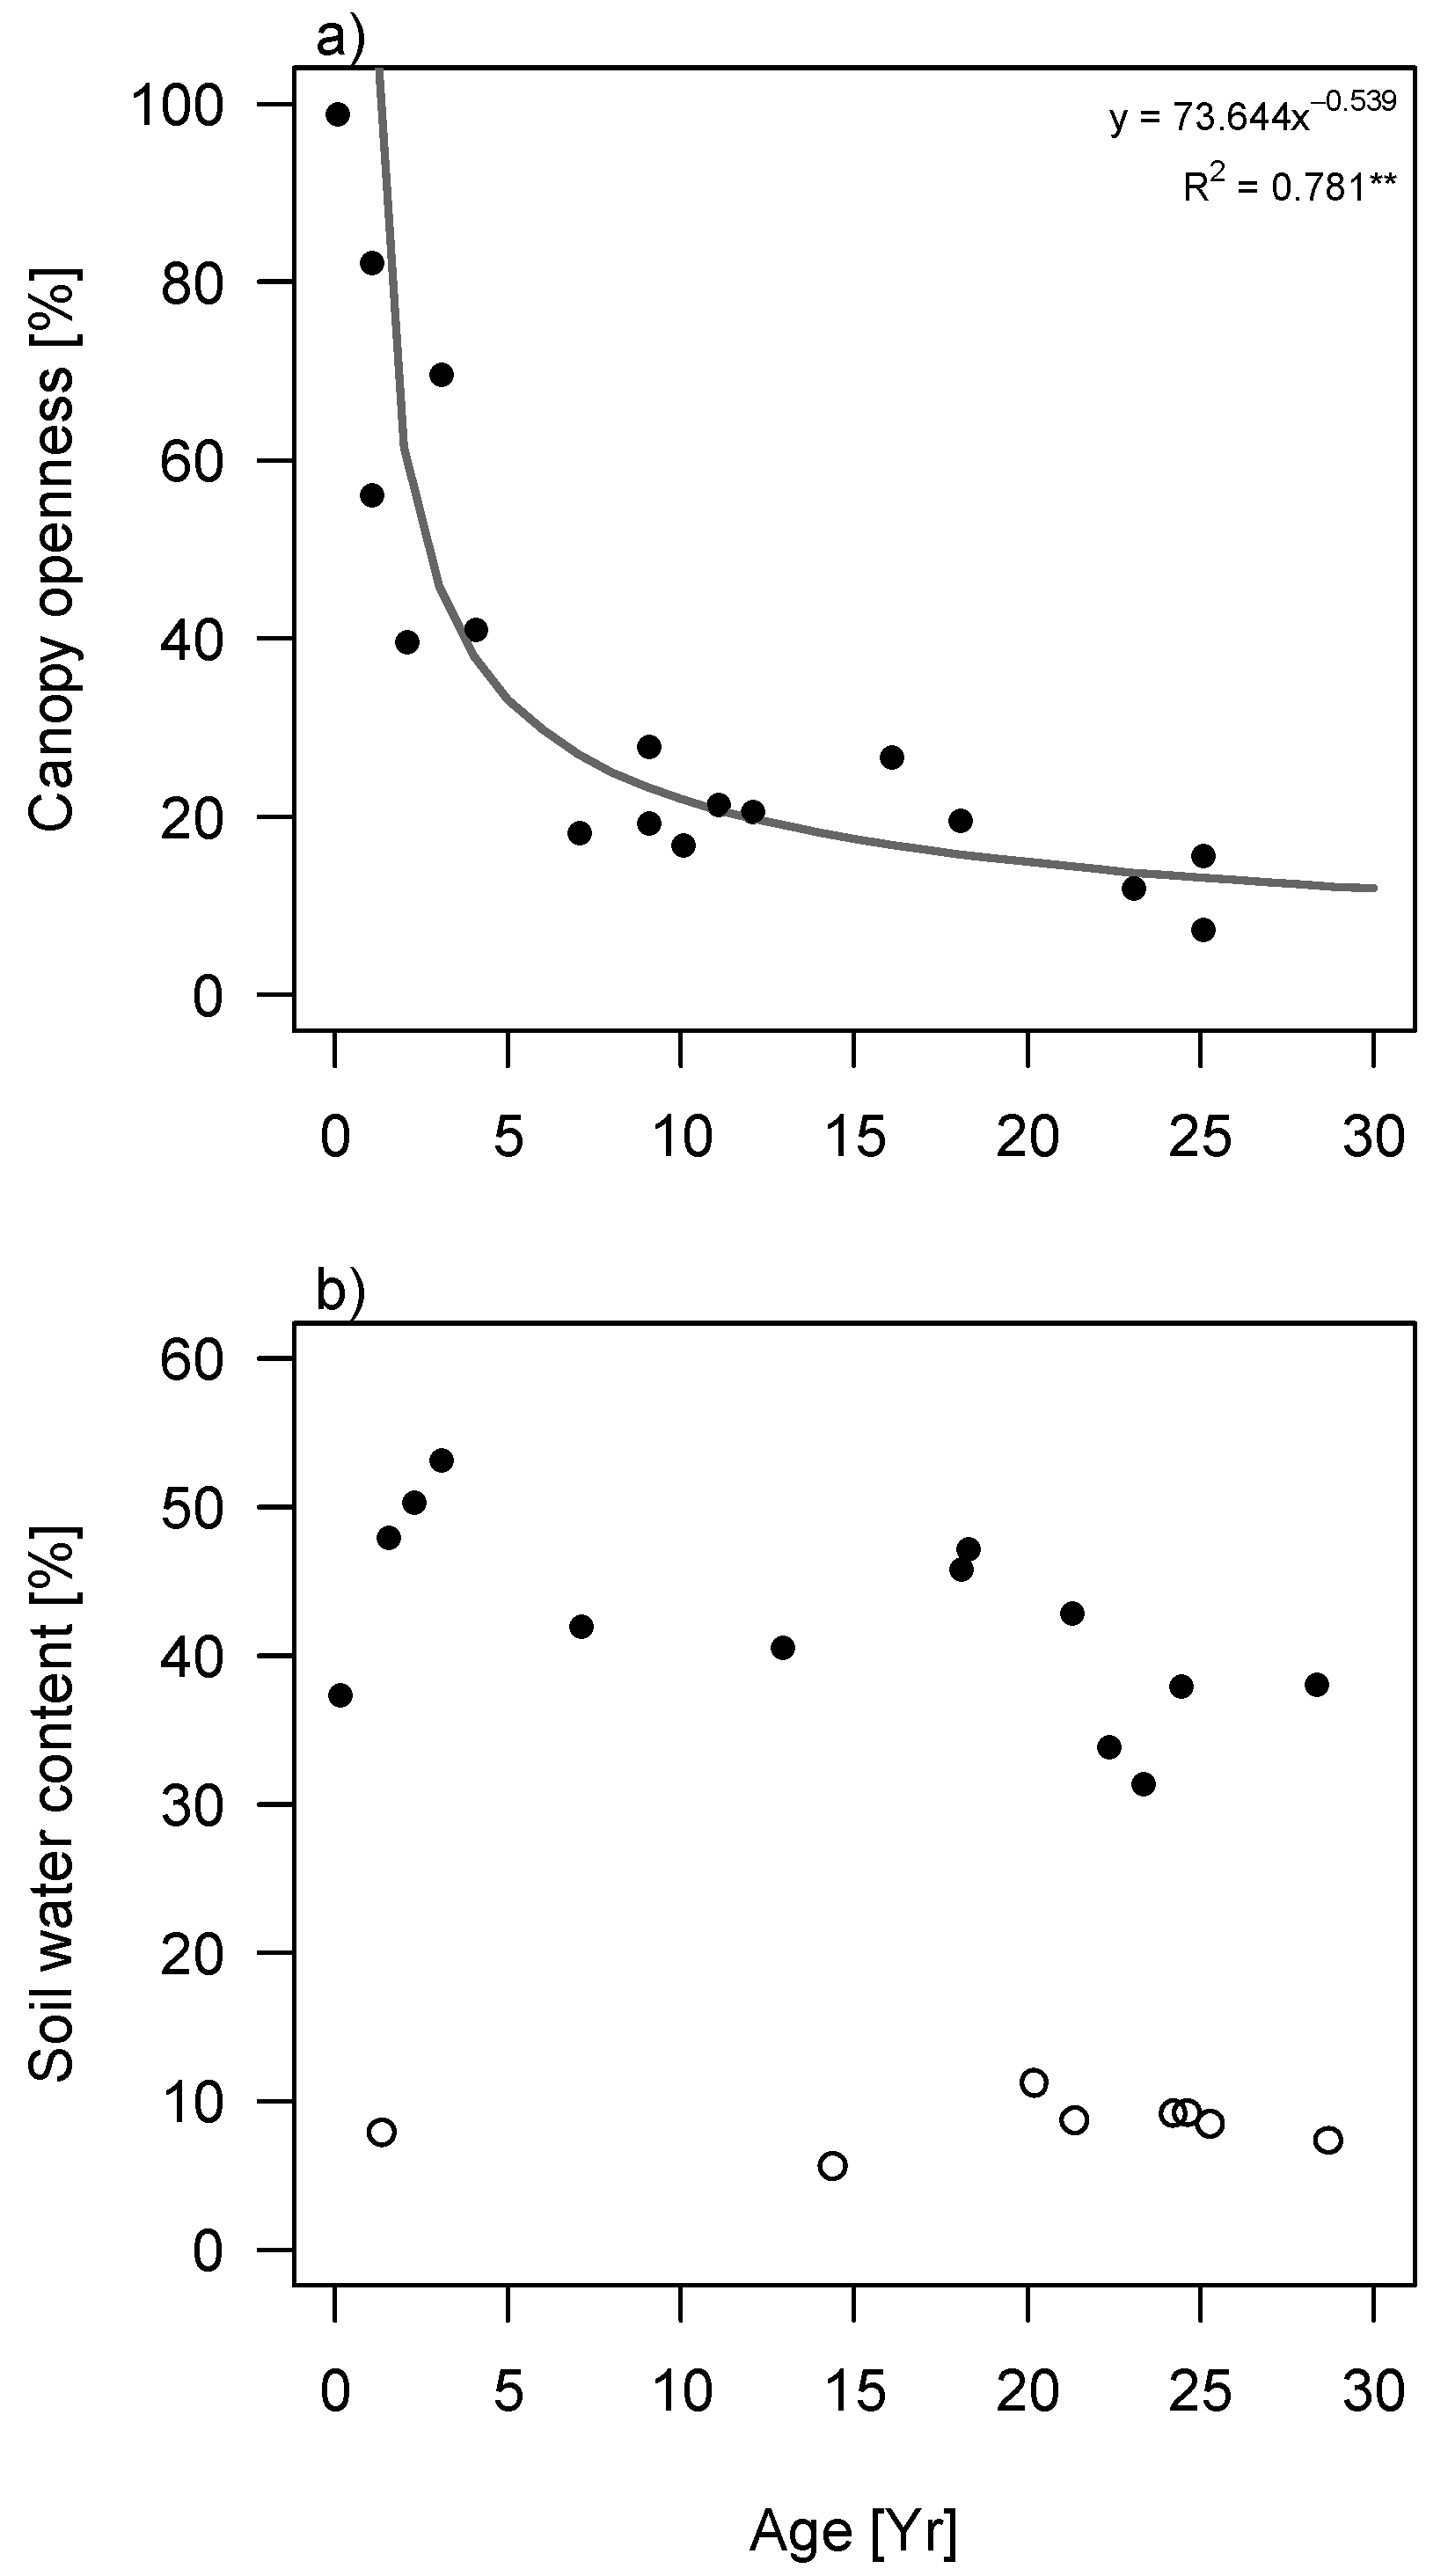
Canopy openness decreased exponentially with succession, both in terms of stand age (
Figure S2) and stand basal area (
Figure 2a). Soil water content was much lower during the dry season than the wet season (
Figure 2b and
Figure S2). Additionally, it was independent of succession in the dry season but decreased with stand basal area in the wet season (
p = 0.011;
Figure 2b). The decrease was not significant for successional stand age.
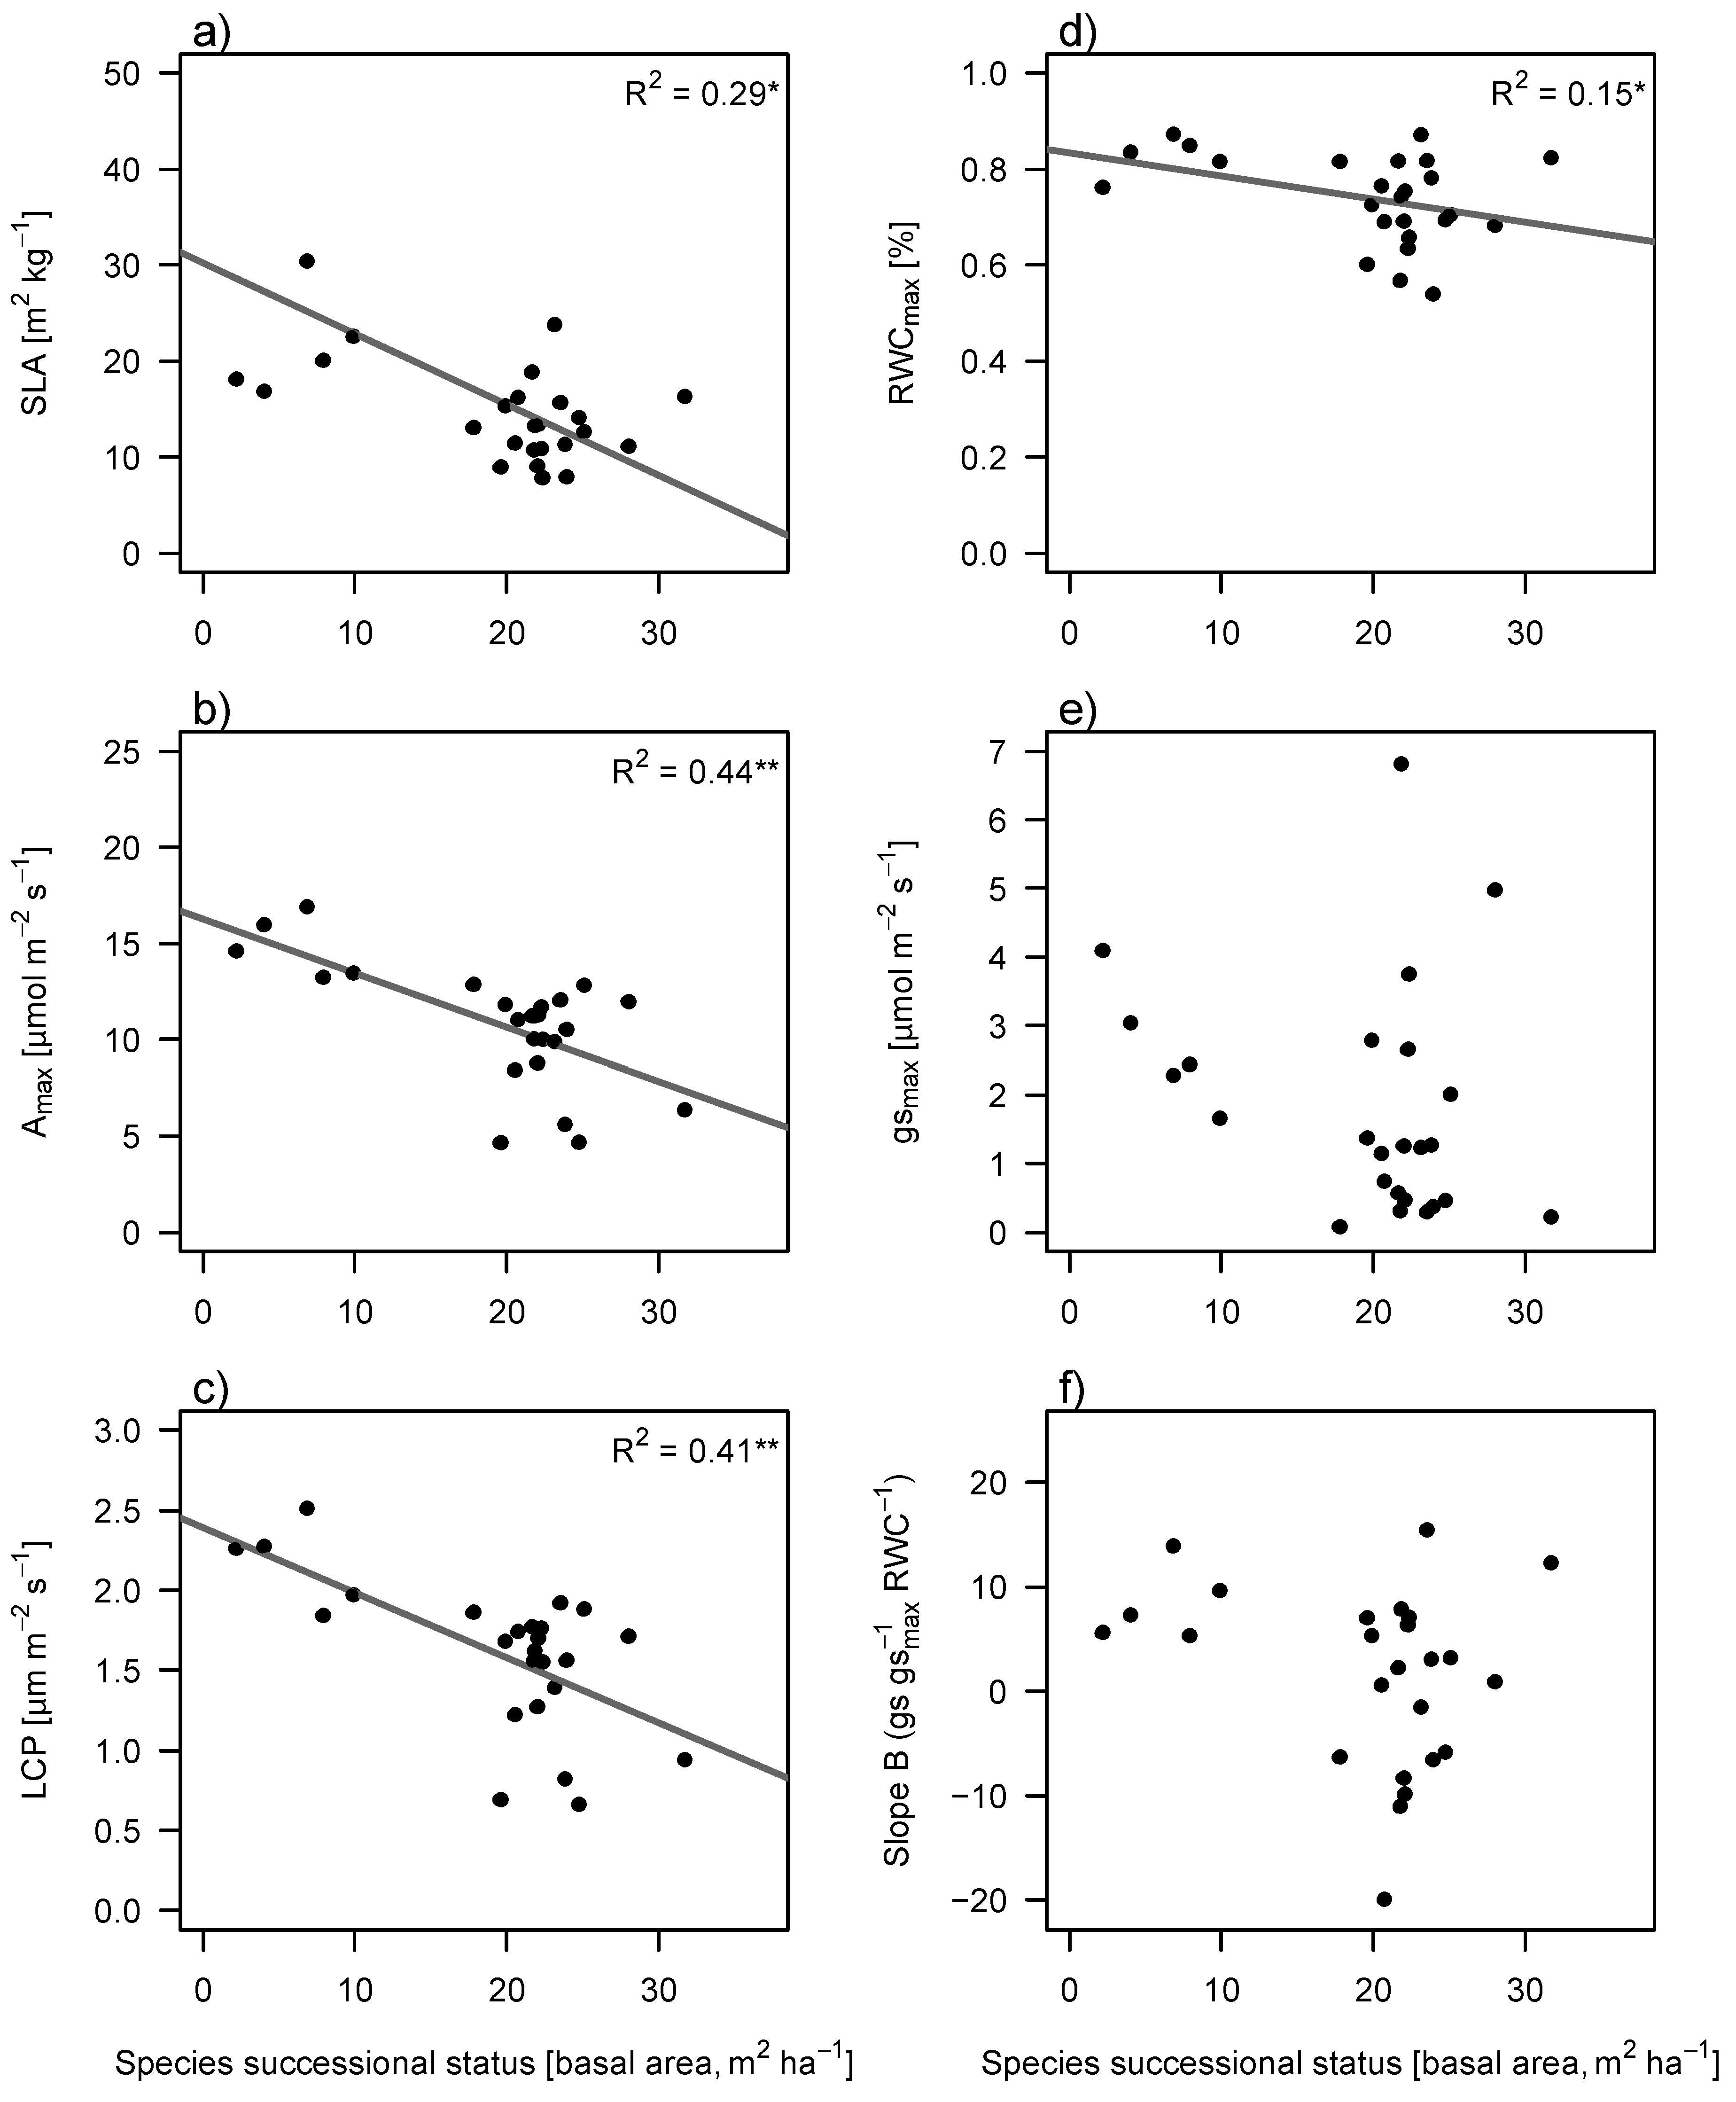
Traits related to light acquisition (specific leaf area (SLA), photosynthetic rate (A
max) and light compensation point (LCP)) significantly decreased with succession, as well as relative water content (RWC) (
Figure 3). Maximum stomatal conductance (g
smax) and leaf drought response (slope B) showed no significant trends (
Figure 3).
As expected, A
max and LCP were correlated with RWC
max, g
smax and slope B (
Table 1). SLA was highly correlated with RWC
max but unrelated to g
smax and slope B. Leaf toughness did not correlate with the three water-related traits.
Figure 2.
Changes in light and water availability during succession in tropical secondary forest in South-eastern Mexico. (
a) Changes in canopy openness as a function of stand basal area; (
b) Changes in soil water content as function of stand basal area. Filled circles correspond to measurements in the wet season (2013) and open circles to measurements in the dry season (2009). Regression lines are given if significant. Best fitting curves are depicted (tested for linear, exponential and logarithmic) with
R2 value. * =
p < 0.05, ** =
p < 0.01. Plots showing the relationship between canopy openness and soil water content with stand age can be found in
supplementary materials (Figure S2).
Figure 3.
Changes in light related functional traits (a–c) and in water related functional traits (d–f) against species’ successional status. Species successional status was defined as the average stand basal area value at which a species was most abundant. Abbreviations are SLA, specific leaf area; RWCmax, relative water content of a fully hydrated leaf; Amax, photosynthetic rate; gsmax, maximum stomatal conductance; LCP, light compensation point; Slope B; slope of drought response curve ((gs/gsmax)/RWC). A steeper slope indicates lower drought tolerance. Solid lines show significant regression and are indicated with R2.
Table 1.
Correlations (Spearman’s rho) between light acquisition related traits (left column: SLA, specific leaf area; Amax, maximum photosynthetic rate; and leaf toughness) and water acquisition related traits (upper row: RWCmax, maximum relative water content; gsmax, maximum stomatal conductance at full hydration; slope B, slope of the drought response curve). *: p < 0.05; **: p < 0.01.
| | Water Acquisition related traits |
| | RWCmax (%) | gsmax (mmol/m2/s1) | slope B |
| Light acquisition related traits | SLA (m2/kg) | 0.837 ** | 0.025 | 0.238 |
| Amax (µmol/m2/s1) | 0.394 * | 0.372 * | 0.431 * |
| Toughness (MN/m2) | −0.323 | −0.242 | −0.132 |
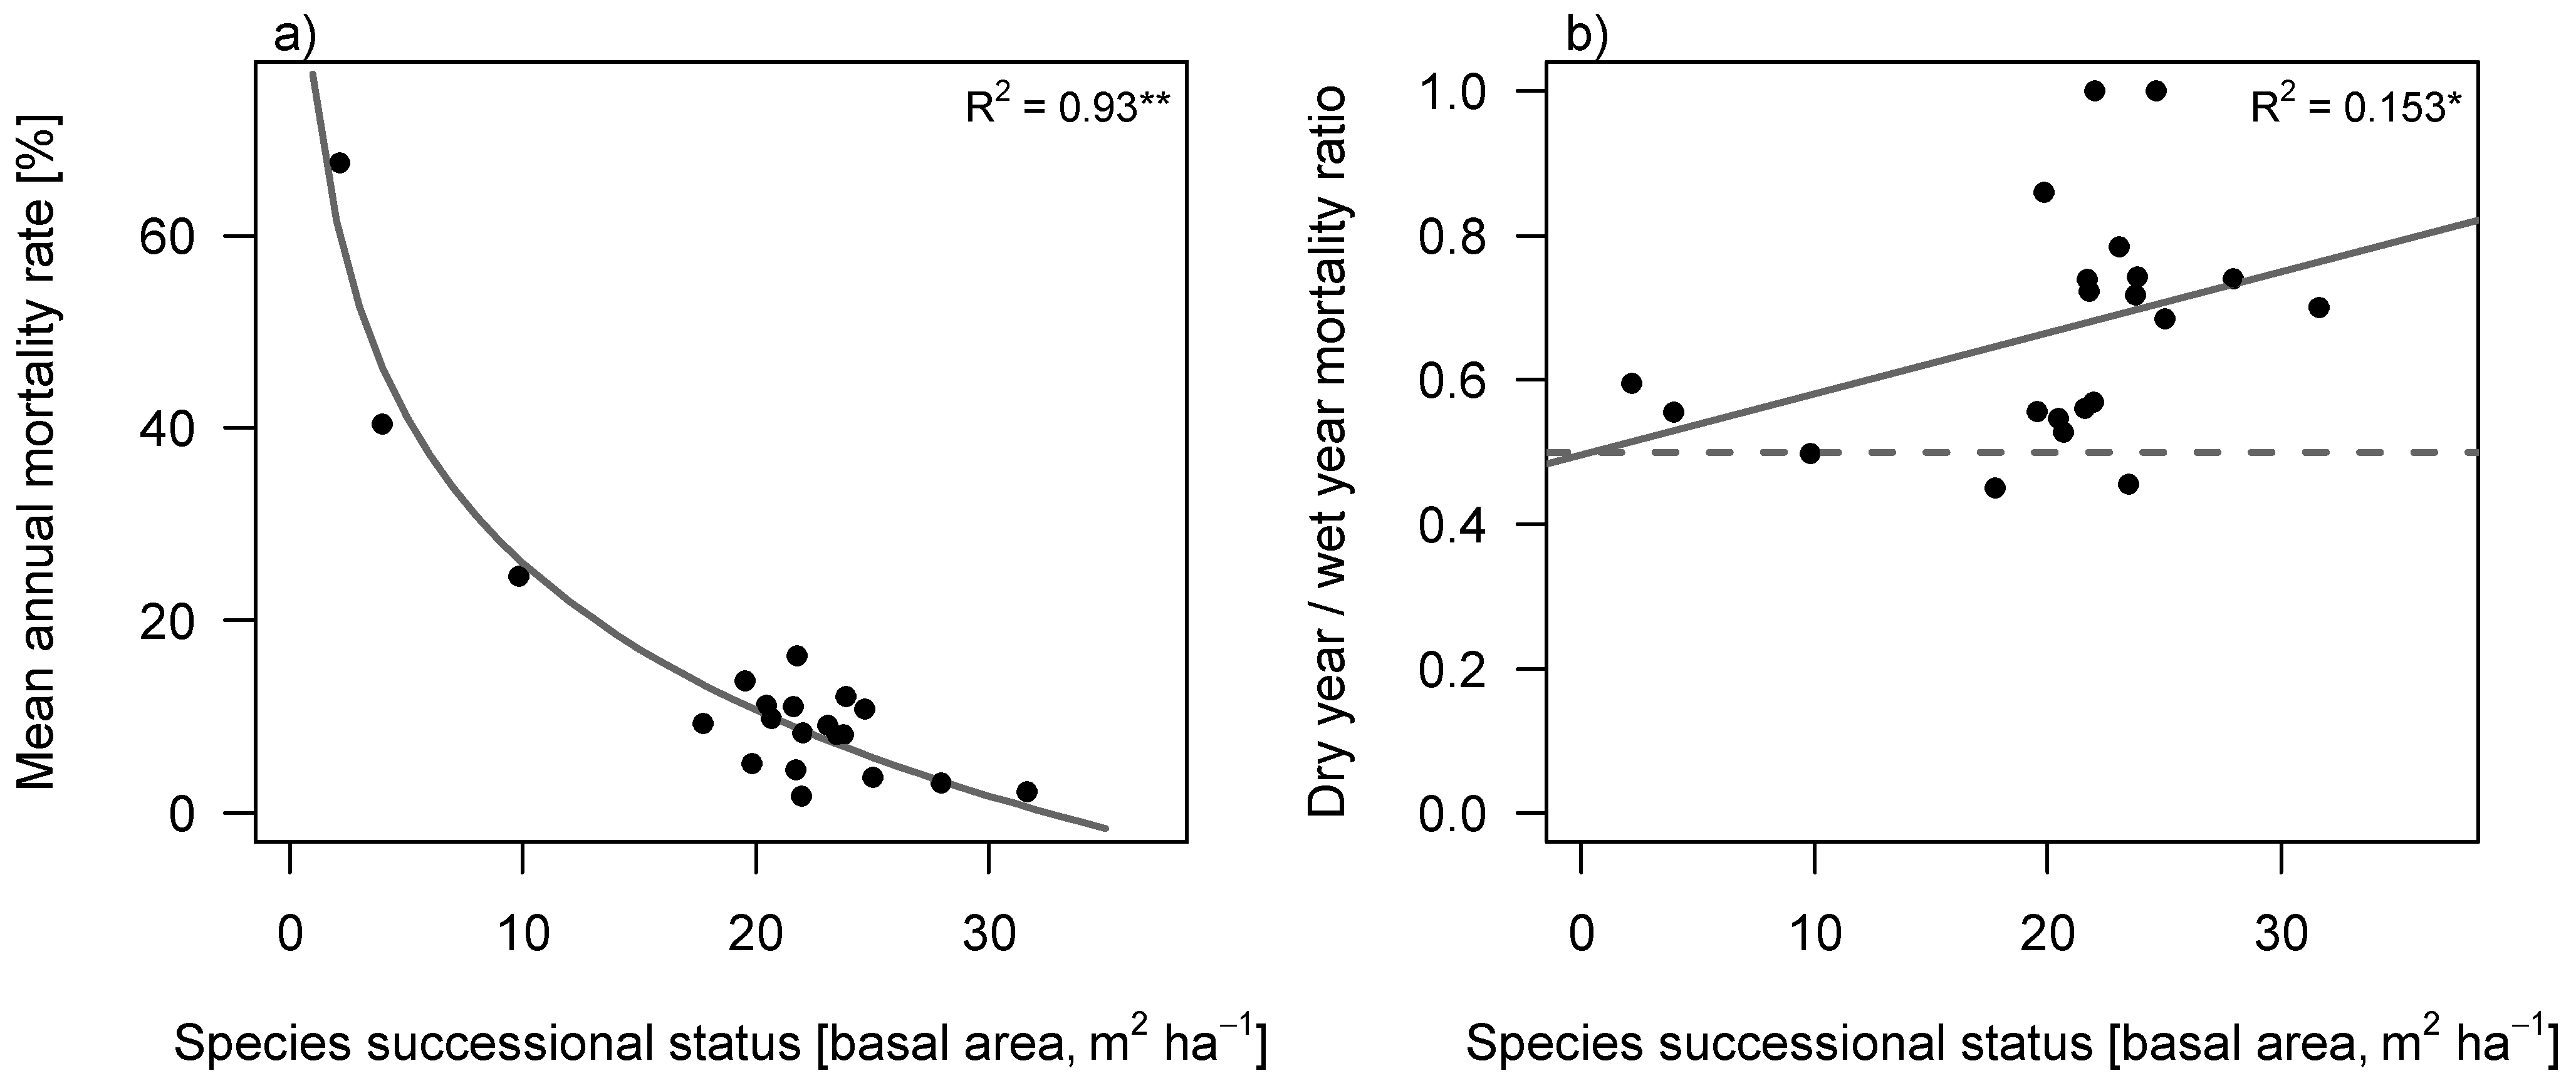
Annual mortality rate (m) decreased with successional status of the species (
Figure 4a) and was generally higher in dry years than in wet years (Wilcoxon pairwise test,
p = 0.001;
Figure 4b). In contrast to our expectation, however, the ratio of mortality (m
ratio) in dry
versus wet years (as indicator of drought induced mortality) significantly increased with successional position of species (Spearman’s rho = 0.468,
p = 0.043), suggesting that late successional species are more vulnerable to drought than we would expect from their morphological traits (
Figure 4b).
Figure 4.
Mortality rate of tree species against their successional status. Successional status was defined as the abundance weighted average basal area of the plots where the species was found. (a) Mean annual mortality rate, calculated over 10 years (2001–2010); (b) Ratio of dry year mortality, relative to wet year mortality, calculated over the three wettest and three driest years. The 0.5 line represents equal mortality in wet and in dry years. Values above the 0.5 line correspond to higher mortality in dry years than in wet years. Values below the line correspond to lower mortality in dry years than in wet years. Carried out with Spearman’s rank (1-tailed).
4. Discussion
This study aimed to assess the importance of leaf shade and drought tolerance for explaining species performance across a successional gradient in a moist tropical forest. We assessed the relation between different light and water related leaf traits for secondary forest species that dominate different stages of forest succession in southern Mexico. We found that indeed early successional species have higher leaf photosynthesis, leaf water transport and stomatal conductance levels, but leaf drought tolerance does not significantly change during succession (
Figure 3). Surprisingly, we observed a higher drought-related mortality in late successional species compared to early ones (
Figure 4).
We expected a decrease in light and water availability during succession. In line with our expectations, we found that light availability decreased with succession (
Figure 2a and
Figure S2). The rapid decrease of light availability early in succession is caused by pioneers invading the land and rapidly closing the canopy [
40]. This pattern is also found in temperate forests and in tropical dry forests, although light availability in wet tropical forests reaches levels that are 5% to even 20% lower than in dry forests, due to the high canopy density and stratification [
31]. Overall, these trends confirm the strong potential for selection by light during succession.
As expected, soil moisture decreased significantly with succession when measured in the wet season, however, in the dry season all sites were equally dry independent of their fallow age or basal area (
Figure 2 and
Figure S2b). Studies in drier forests found instead that soil moisture increases with succession when measured in the dry season, which is explained by high soil water evaporation in scarcely-vegetated early successional forests (
cf. [
17,
41,
42,
43]). In contrast, Lebrija-Trejos
et al. [
31] found a hump-shaped curve of soil water against succession, because increased shading prevents the soil from excessive evaporation, while later in succession, the high transpiration rates of the canopy deplete soil water again. The soil water levels are thus dependent on the soil evaporation/vegetation transpiration balance. The result that wet-season soil water content decreased during succession could be explained by the dense canopy in wet tropical forests having a higher water holding capacity, resulting in less water reaching the forest floor [
44], and also for a large part by the high transpiration of the dominant trees in later successional forest [
25]. The difference in soil water content between wet and dry season suggests that tree species experience very large moisture fluctuations during the year. In dry season, soil moisture levels may decrease as much as 75% (late successional) to 85% (early successional) compared to wet season soil water levels.
We expected that light related traits (e.g., SLA and A
max), and water related traits (e.g., RWC
max and g
smax) would decrease during succession, because early successional species need more resources (light and water), than do late successional species. SLA and A
max indeed significantly decreased with succession (
Figure 3a,c), confirming the dominant role of light in determining species success during succession [
45,
46]. Also RWC
max decreased with succession, but no significant decrease was found in g
smax (
Figure 3b,d). These results confirm that the acquisitive strategy of pioneers holds for light as well as water [
8]. These results are supported by studies on stems and whole plant hydraulic conductance, in both dry [
12] and wet tropical forests [
43].
We expected that the leaves of early successional species would be more intolerant to shade and drought than late successional species, resulting in a higher light compensation point and more extreme reaction to drought (high slope (B) of dehydration curve). Light compensation point (LCP) significantly decreased with succession, implying that tolerance to shade indeed increases with succession. In contrast, the relation between leaf drought tolerance and succession was absent in this study (
Figure 3f). To our knowledge, this study is the first to link leaf drought tolerance to succession, which prevents us from comparing our results to other studies. Earlier studies did look at xylem resistance against drought, instead of leaf drought tolerance, and did not find patterns of drought tolerance during succession in subtropical forests in China [
43], and dry forests in Mexico [
17]. But Markesteijn and colleagues [
47] did find a positive relation between xylem resistance to drought and succession in a dry tropical forest in Bolivia. These inconsistent results point to the question whether other mechanisms than those reported are key in maintaining physiological functioning during drought, which may all occur along the successional gradient. For example, drought avoidance strategies such as leaf shedding, deep roots and water storage capacity in the stems [
17] may prevent mortality during drought. To gain more understanding on the role of water availability along succession, we need to improve our knowledge on these different drought coping strategies [
21,
25,
48].
We expected a positive relation between light demanding and water demanding traits. We indeed observed that RWC
max was highly correlated with SLA. A
max and LCP were correlated with RWC
max, g
smax and slope (B) (
Table 1). Partially, these results confirm our hypothesis that there is a link between light related and water related traits. However, due to the fact that our previous results reveal that leaf drought tolerance is not correlated with succession, the correlation between A
max and LCP, and slope (B) is surprising. These correlations do however show that early successional species indeed use an acquisitive strategy where high photosynthetic rates and high water transport rates contribute to attain high growth rates (
cf. [
43,
47,
49]). As no relation between drought tolerance and succession was found, we cannot conclude that leaf shade tolerance and leaf drought tolerance are coupled, regardless of the positive correlation between some of their indicators (
cf. [
43,
49]).
Despite the fact that the study area was characterized by high yearly precipitation rates (3000 mm/yr), the dry seasons from February to April may pose severe drought stress. We expected that, as a consequence of pioneers’ leaf shade and leaf drought intolerance, the morphological and physiological traits would be reflected in the performance of these tree species. In other words, we expected that the mortality rates of early successional species would increase more strongly in dry years with respect to the mortality rates of late successional species.
Before testing this hypothesis, we wanted to confirm some generic trends. First, we showed that early successional species indeed had higher overall tree mortality than late successional species (
Figure 4a). This is in agreement with the higher turnover rate observed in early successional sites compared to late successional ones [
46,
50], and with the idea that an acquisitive strategy with fast growth comes at the cost of high mortality [
51]. Secondly, in line with our expectations, we found that overall mortality was higher in dry than in wet years (
Figure 4b), suggesting that moist forest species do indeed suffer from drought. Although our results implied that early and late successional species do not differ in leaf drought tolerance (
Figure 3f), significant differences in drought-related mortality (indicated by m
ratio) were still visible. Early successional species, though having higher mortality rates overall (
Figure 4a), had a lower drought-related mortality than did late successional species (
Figure 4b). Many factors affect mortality during tropical forest succession and the effect of drought is harder to detect in the already high mortality of pioneer species. The high relative increase of mortality in dry years of late successional species was however unexpected, based on their morphological and physiological leaf traits. Leaf drought tolerance does not explain these mortality patterns, and this suggests that late successional species are lacking strategies to limit excessive increase in mortality when exposed to drought. Possible mechanisms are represented by deep root systems, leaf shedding and water storage capacity in roots and xylem. A deeper root system allows trees to reach the ground water, thereby being less dependent on precipitation and suffering less from dry periods. Indeed other studies found that light-demanding species have deeper root systems than shade tolerant species [
52,
53]. Leaf shedding, which reduces leaf area and thus water loss [
6,
17], was also found among the species in this study, but deciduousness was not significantly related to species’ successional status in our study (
Figure 1). In addition, increased water storage capacity in roots or stems may allow species to maintain function at higher levels of soil desiccation [
17,
53].
An alternative explanation for the lack of directional changes in drought tolerance over succession is explained by the potentially underestimated role of nutrients in succession. Although this study considers water loss as an inevitable consequence of photosynthetic activity [
54], transpiration may also be an important mediator for the mass-transport of nutrients through the soil, towards the rhizosphere [
55]. This may be a reason not to strive for minimal water losses [
56]. In accordance to Reich [
8], fast growing pioneer species may maximize their water uptake for maximum nutrient use. This theory underlines the benefits of having drought avoidance strategies such as deep roots, over drought tolerance strategies such as stomatal closure, which shut down the water transport throughout the plant. The role of nutrients during succession is poorly studied, and more research is needed.


