Article

Long-Term Soil Productivity in Christmas Tree Farms of Oregon and Washington: A Comparative Analysis between First- and Multi-Rotation Plantations

1
Department of Forest Engineering, Resources & Management, Oregon State University, Corvallis, OR 97331, USA
2
Department of Crop and Soil Science, Oregon State University, Corvallis, OR 97331, USA
*
Author to whom correspondence should be addressed.
Forests 2014, 5(10), 2581-2593; https://doi.org/10.3390/f5102581
Submission received: 29 August 2014 / Revised: 17 October 2014 / Accepted: 21 October 2014 / Published: 23 October 2014

Abstract

:
Christmas tree production removes organic matter and associated nutrients from a site and can change soil physical properties, reduce mycorrhizal populations, and result in pesticide over-use/accumulation. These impacts have been implicated in potential field productivity declines. Assessing Christmas tree productivity is complicated by genetics, management, and market forces. We approached the perceived or possible productivity decline by examining soil properties on 22 pairs of sites. Each pair was comprised of an early rotation and late rotation plot with 1 and 3 or more rotations of Christmas trees, respectively. All sites were located on commercial Christmas tree plantations from the major production areas in Washington and Oregon. Chemical properties assessed to 45cm included pH, total C and N, and extractable P, K, Ca, and Mg. Soil physical properties assessed included aggregate stability and soil resistance. In general, we found little impact on soil resources that would impact long term production of Christmas trees. These impacts may have been mitigated by farmers following extension service recommendations. Nitrogen, K, and Ca appeared to be primarily affected by harvesting, but replacement by fertilizer application was probably adequate.

1. Introduction

Continued Christmas tree production on plantation sites is important to both Oregon and Washington’s agriculture economy. Oregon ranks as the nation’s largest Christmas tree producing state, with a production of 6.4 million trees in 2012 [1]. Oregon has held this position now for over 3 decades. Washington ranks at the sixth largest producer in the United States. Maintaining the site productivity of this important crop is vital for the continued success of this industry in both states.
Frequently, sites are used for multiple rotations of Christmas trees. Rotation lengths will vary from 6 to 12 years depending on species, site, markets and other factors. Depending on market demand, species may change from one rotation to the next. Growers employ a wide variety of production methods that frequently change as species, knowledge, and conditions alter from one rotation to the next. The common species grown in the region are Douglas-fir (Pseudotsuga menziesii (Mirib) Franco.), noble fir (Abies procera Rehd.) and grand fir (Abies grandis (Dougl.) Lindl.).
Some growers have commented that trees grown in fields with several rotations of Christmas trees seem to be of lower quality than those on first rotation sites. These comments raised concern that field productivity may decline after multiple rotations. If true, the trend leads to increased costs, lower returns, and longer rotations.
A generalized definition for Christmas tree productivity would be stated as the time to harvest quality 1.8–2.1 m (6–7 ft) trees on any given site. Measuring the productivity of a Christmas tree farm is less straightforward than a natural or managed forest due to extensive trimming, changing species between rotations, and market conditions. Furthermore, detecting a decline in productivity between rotations in systems dominated by perennial species (i.e., forests or Christmas tree farms) is challenging due to the effects of tree genotype, management practices, plasticity of trees to adapt to a site, and changes in state factors (e.g., climate) at potentially masking any trends in productivity [2,3]. One suggestion for detecting changes in the ability of a site or soil to grow trees is to use soil indicators [3,4].
Numerous causal candidates have been implicated in potential field productivity declines. Candidates commonly mentioned include changes in soil physical properties such as aggregate stability, compaction/resistance to penetration [5,6,7], loss of organic matter, mycorrhizal decline [8], pesticide over-use/accumulation [9], removal of limiting nutrients, and changes in soil chemical properties [10] which can affect nutrient availability and uptake as well as water uptake and holding capacity.
We hypothesized that nutrient capital was reduced as a result of harvesting which could lead to the perceived reduction in Christmas tree production. Since measuring productivity is complicated by genetics and management, we approached the perceived or possible productivity decline by utilizing paired test sites to compare selected site productivity properties commonly implicated as potential reasons for the decline. All sites were located on commercial Christmas tree plantations from the major production areas in Washington and Oregon.

2. Experimental Section

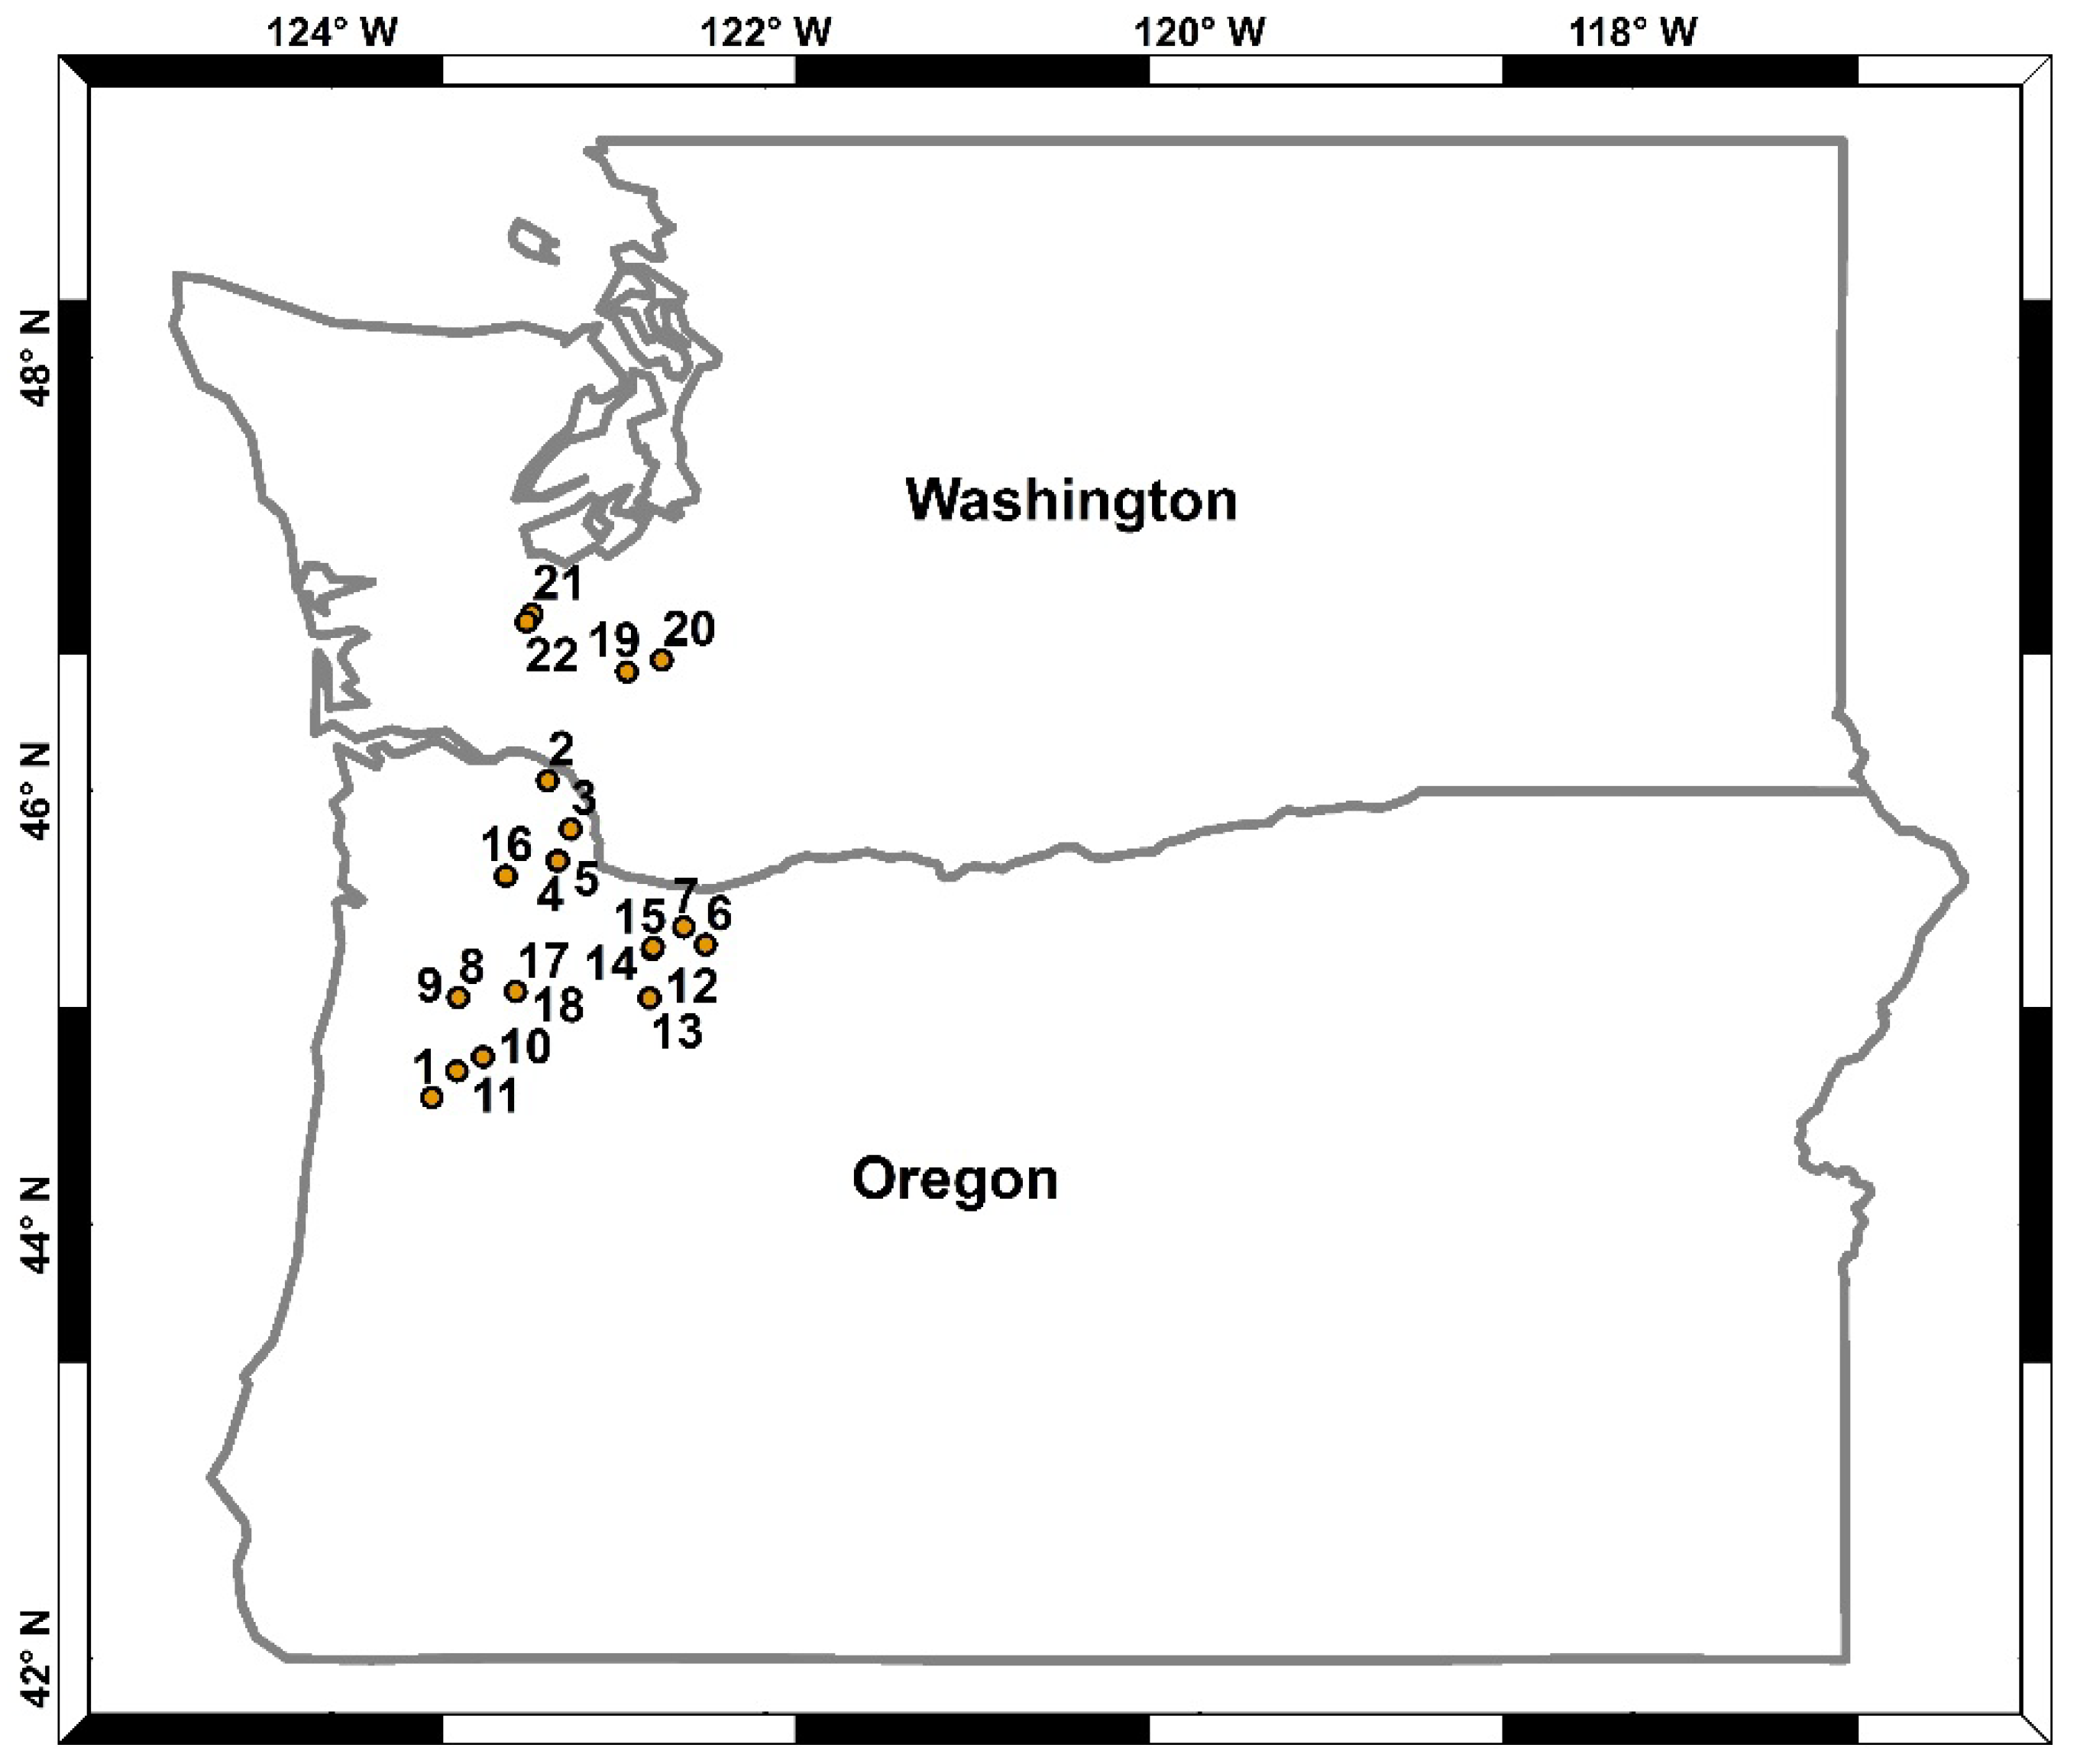
2.1. Site Description

We analyzed Christmas tree farms from a wide range of sites in Oregon and Washington (Figure 1). Soils ranged from clay loam to gravelly silt loams and sandy loams. Using downscaled PRISM data [11] we found that these sites span a relatively narrow range of mean annual temperature (9.6 to 11.7 °C) and precipitation (1213 to 1853 mm; MAT and MAP, respectively; Table 1); however, they represent a majority of the region utilized for Christmas tree production. While MAP increases and MAT typically decreases with latitude we did not find latitude to be correlated with MAT or MAP (R2 < 0.14) among our study sites, suggesting that climate may not be a significant covariate in the response at each site. The sites are situated in a Mediterranean environment with 80%–90% of their precipitation falling between October and April (2%–6% as snow). As a result of the annual distribution of precipitation water can limit production.
Figure 1. Map of Christmas tree farms in Oregon and Washington.
Forests 05 02581 g001
Soil properties were measured in field pairs which were proximate and as similar as possible with respect to species, soil type, slope, aspect, management, and usage prior to being planted to Christmas trees. Twenty-two pairs, a total of 44 fields were selected at 18 locations in western Oregon and 4 locations in southwest Washington (Figure 1 and Table 1). One of the pairs was a first rotation field; the other was a matched site that had undergone at least 3 rotations of Christmas trees with an average of 25+ years of continuous tree production (range 22–43 years; Table 1).
Table 1. Site and climate variables; na = not available; 1 Rot. = Rotations; 2 Prod. = Production.
PairElev. (m)MAT (°C)MAP (mm)USDA Subgroup Soil ClassificationUSDA Soil Texture# of Rot. 1Years in Prod. 2Years Since LimingYears Since Tillage
1201111853Typic Humultclay loam13na3
silty clay loam42822
2251101506Andic Fragiudeptsgravelly silt loam191na
silt loam431nana
397111251Aquic Haploxereptssilt loam10nana
silt loam315na16
4342101590Andic Fragiudeptssilt loam19na36
silt loam6351.539
5382101599Andic Fragiudeptssilt loam131.526
silt loam4251.53
6348111545Typic Paleudultssilt loam13na3
loam320na2
794121213Ultic Argixerollssilty clay loam14nana
loam420na22
8175111227Xeric Palehumultssilty clay loam12na2
silty clay loam327na9
9175111227Xeric Haplohumultssilty clay loam12na2
silty clay loam328na5
10118111406Ultic Haploxerollsloam1121.56
loam422nana
11156111675Xeric Haplohumultssilty clay loam19010
silty clay loam5382na
12475101755Xeric Palehumultsclay loam11na1
clay loam & silt loam44366
13475101755Xeric Palehumultsclay loam11na
clay loam & silt loam323na6
14245111343Xeric Palehumultssilt loam & clay loam11na1
silt loam3nanana
15232111340Xeric Palehumultssilt loam12na3
clay loam & loam4nanana
16150111249Ultic Haploxeralfssilt loam16na 7
silt loam53611
17326101320Xeric Haplohumultssilty clay loam1601
silty clay loam431nana
18326101320Xeric Haplohumultssilt loam15nana
silt loam330na19
19231101381Humic Haploxerandssilt loam11na1
loam & sandy loam320na5
20327101713Humic Haploxerandssilt loam16na8
silt loam4nanana
2171101342Xeric Palehumultsloam13na4
silt & silt loam3nana4
22147101359Xeric Palehumultssilt loam11na1
silt loam321nana
Although with the exception of rotation age, conditions between pairs of fields were as similar as possible, soil, climatic and management conditions among locations were very dissimilar. Conditions at each of the locations were in the range typical for Christmas tree sites in western Oregon and Washington. Management practices such as site preparation, tillage, sub-soiling, liming, pesticide use, and fertilizing varied among locations. Furthermore, the land use prior to becoming a Christmas tree farm (early or late rotation) on these sites varied and included second growth forest, pasture, and field crops. In general, the prior land use and management practices tended to be similar between pairs, but large variations in the parameters among locations are to be expected.

2.2. Soil Sample Collection and Analysis

Using a 3 cm diameter probe, soil samples were collected from: (1) the surface to 7.5 cm; (2) 7.5 to 30 cm; and (3) 30 cm to 45 cm at 15 to 20 randomly selected locations in each field with no pattern with regard to placement of samples within rows or near trees. The samples for each depth were combined and analyzed as a single sample per site. Soil samples were air dried and sieved to 2 mm.
Soil pH was measured on air dried and sieved soil with a combination electrode in a 2:1 (v/v) water:soil suspension [12]. Carbon and N were determined by combustion in a LECO CNS analyzer [13]. Extractable K, Ca, and Mg were measured by ICP after extraction with 1 N neutral ammonium acetate [14]. A dilute acid-fluoride extraction (Bray P1) for P was followed by measurement with an Alpkem rapid flow auto-analyzer using the molybdenum blue method [15].
Aggregate stability and particle size analysis (PSA), were determined on samples from the 0 to 7.5 cm depth. The pipette method was used to determine the size distribution of sand (50–2000 μm), silt (2–50 μm), and clay (<2 μm) after organic matter removal using hydrogen peroxide [16]. Aggregate stability was determined on air dry samples gently broken and passing a 2 mm sieve and collected on a 1mm sieve. Aggregates were subjected to repeated (35 cycles minute) insertion and removal from water for 3 min followed by an additional 5 min after addition of dispersing solution.

2.3. Soil Resistance

Soil resistance above 2000–2500 kPa restricts root growth [5,6] and root growth ceases when soil resistance is above 3000 kPa [7]. Soil resistance was measured with a recording penetrometer at 25 mm increments to 600 mm in 30 locations. At each location, soil resistance was further divided into measurements of three sub-areas (within tractor tire tracks, tree drip line and mid-row) where we anticipated differing levels of resistance. At the site level, we reduced these data to an average for each location (25 mm depth increment). From these composited data we determined an average and maximum across the range of depths corresponding to our soil sampling protocol (0–7.5, 7.5–30, and 30–45 cm). Means and standard deviations across the treatments were calculated from these site level averages and maximums.

2.4 Statistical Analysis

We performed a Wilcoxon Signed Rank test to test the null hypothesis that the median difference (absolute and early rotation normalized) between the early and late (early-late) rotation Christmas tree farms is equal to zero. We hypothesized that the response of a site’s nutrient or carbon capital may be influenced by their initial state. To examine this effect, we performed a Wicoxon Signed Rank test on normalized differences. Normalized values were determined by dividing the differences (early–late) in each variable by the value of the corresponding early rotation site (i.e., initial). Spearman correlations among selected variables were used to help explain the trends in the data. We used a tolerable type I error rate of 0.1 for all statistical tests.
The data set has been viewed and analyzed in its aggregate, as intended in the original experimental design. Making comparisons between individual pairs must be done with caution. Without replicated observations at each location, it is very difficult to judge whether differences between pairs are the result of natural variation or the result of prolonged cropping to Christmas trees. Future analysis of data subsets is planned. These analyses may provide additional insights on the impact of continuous cropping to Christmas trees on site productivity; however, it is not expected that these analyses will substantially alter the conclusions reported here.

3. Results and Discussion

The sites had a wide range of soil chemical characteristics (Table 2). In general pH, Ca, and Mg increased with depth while C, N, P, and K decreased with depth. We found that the concentration of Ca was lower in the late rotation relative to the early rotation at all depths (Table 3). The only other nutrient that decreased between early and late rotations was N at the 0–7.5 cm depth. Potassium has been shown to be a nutrient that is removed at a high rate and may need replacement through fertilization [10]. Potassium was lower in the late rotation relative to the early rotation, but the result was not statistically significant.
Table 2. Summary of soil chemical data.
ParameterDepth (cm)First RotationLate Rotation
AverageRangeAverageRange
pH0 to 7.55.44.5 to 6.35.54.8 to 7.0
7.5 to 305.64.8 to 6.25.54.8 to 6.2
30 to 455.65.0 to 6.15.75.1 to 6.0
P (mg kg−1)0 to 7.52810 to 76286 to 103
7.5 to 30219 to 68215 to 81
30 to 45146 to 34144 to 43
K (mg kg−1)0 to 7.523535 to 57319674 to 428
7.5 to 3017734 to 46313938 to 342
30 to 4515420 to 40813037 to 436
Ca (mg kg−1)0 to 7.593240 to 216082280 to 2140
7.5 to 30108020 to 262080040 to 2380
30 to 45103020 to 236091440 to 2340
Mg (mg kg−1)0 to 7.514312 to 41115012 to 496
7.5 to 3015612 to 59314812 to 557
30 to 4518412 to 62920012 to 750
C (g kg−1)0 to 7.537.911.9 to 76.936.413.9 to 107
7.5 to 303011.6 to 72.027.58.9 to 75
30 to 4527.55.0 to 43.817.45.5 to 45.8
N (g kg−1)0 to 7.52.60.8 to 5.02.31.0 to 5.5
7.5 to 301.91.0 to 4.81.80.7 to 4.0
30 to 451.20.3 to 3.01.10.4 to 2.4
C:N0 to 7.518.413.3 to 25.517.38.1 to 23.0
7.5 to 3018.613.2 to 24.918.212.4 to 23.6
30 to 4518.411.7 to 24.518.611.7 to 24.6
AS (%)0 to 7.594.364.6 to 99.791.248.7 to 99.2
Table 3. Median and standard deviation of differences (∆) between early and late rotation pairs. pdiff and pnorm represent the results from a Wilcoxon Signed Rank test testing the null hypothesis that the median difference (absolute) and normalized difference are equal to zero, respectively; nm = not measured.
Depth∆pH∆P∆K∆Ca∆Mg∆C∆N∆C:N∆AS
mg kg−1g kg−1%
0 to 7.5 cmmedian0.1−5.5−25.560.1236.46−1.7500.200−0.7−1.8
stdev0.417.1108.5489.14296.6311.2950.8343.310.2
pdiff0.8610.6480.1100.0620.4830.2470.0560.4210.011
pnorm0.9350.6150.5600.2730.2730.3340.1240.3670.011
7.5 to 30 cmmedian0.1−2.0−10.5−80.16−48.61−1.2500.050−1.0nm
stdev0.39.896.5484.46293.8011.7210.8762.7nm
pdiff0.1780.7530.2520.0050.4750.1870.3290.626nm
pnorm0.1400.7900.6950.0250.0250.3170.4750.649nm
30 to 45 cmmedian0.0−0.5−20.5−30.06−18.23−3.100−0.200−0.6nm
stdev0.34.7104.7360.09218.3711.0320.7053.2nm
pdiff0.3730.7420.3180.0920.3310.9630.9870.725nm
pnorm0.2420.6470.8140.3670.3670.4580.4480.700nm
Several parameters showed decreases between the early and late rotation plots, while normalized values showed little result. This suggests that the absolute response of a site is related to its initial level of nutrients. To explore these trends we examined the relationships among the site and soil characteristics. Indeed, we found significant negative correlations between early rotation K, Ca, and N from all depths and the change in these parameters from early to late rotation (Figure 2).
Figure 2. Relationship of early rotation N (upper left), Ca (upper right), and K (lower left) concentrations and change in nutrient soil concentration; Line #1 represents the soil Ca concentration that the OSU Extension service recommends application of Ca or K amendment; Line #2 represents the threshold for fields that declined below the Ca or K concentration that is recommended to be fertilized; spearman correlation coefficients are presented for each depth (*, **, and *** represent statistically significant correlations with p < 0.1, 0.05, and 0.001, respectively).
Forests 05 02581 g002
Early rotation N had a weak relationship with the decline in N from early to late (Figure 2). This may be partly a result of the common practice of N fertilization at mid- to late-rotation in Christmas tree farms. Both Ca and K had relatively strong correlations between the early rotation value and difference between early and late rotation soils. We plotted the threshold values at which OSU extension recommends Ca and K fertilization (Line #1 in Figure 2). Additionally, we plotted the threshold for fields that may have declined below the threshold from early to late rotation (Line #2 in Figure 2). In the case of both Ca and K all soils fall above or quite near these threshold values, which suggests that the recommendations of the extension service are being followed by this group of farmers. Indeed 7 of the 11 sites that were below the Ca threshold of 1000 mg kg−1 in at least one of the three sampled depths had been limed. It also suggests that these farms are in a good position to maintain site productivity between rotations.
Reductions in nutrient capital as a result of Christmas tree harvesting could be a result of removal from harvesting, increased leaching, translocation, or erosion rates. Harvesting has been shown to remove 140–336 kg ha−1 (125–300 lb ac−1), 56–168 kg ha−1 (50–150 lb ac−1), and 84–140 kg ha−1 (75–125 lb ac−1) of N, K, and Ca, respectively [10]. To determine if the trends in nutrient concentration are a result of harvesting, or some other process, we needed to calculate the mass of nutrients in the early and late rotation fields. Bulk density data were not measured on these soils, but we assumed that bulk density increased with depth and the 0–7.5, 7.5–30, and 30–45cm soil depths had bulk densities of 1, 1.3 and 1.5 g cm−3, respectively, which allowed us to estimate differences in mass of these nutrients between the whole soil profiles (0–45 cm) in the early and late rotation fields.
We found that N removal was negligible across the study, but ranged from −5.5 to 5.5 kg ha−1 difference between the early and late rotation fields. Nitrogen fertilization is a common practice in Christmas tree production, and is probably buffering any effect that harvesting may have on the site (and farmers are maintaining N levels).
Potassium was reduced by an average of 127 kg ha−1, within the rate of loss that can be attributed to harvesting (56–168 kg ha−1). Those sites that had removal rates greater than 168 kg K ha−1 had significantly higher early rotation K levels (averaged across all depths) than those that had lower removal rates (p < 0.005 from Mann-Whitney test). These high K loss sites lost an average of 497 kg ha−1 over an average of about 4 rotations, which is within the rate of loss caused by the harvesting of four rotations of trees. These results do suggest that soil K status should be monitored on Christmas tree farms and amended as needed, as suggested by extension recommendations [10].
Calcium was reduced by about 58 kg ha−1 on average across the sites, which is less than removal rates that can be attributed to harvesting one rotation of Christmas trees (84–140 kg ha−1). Those sites that had removal rates greater than 140 kg Ca ha−1 had higher early rotation Ca levels (averaged across all depths) than those that had lower removal rates but the result was not significant (p = 0.355 from Mann-Whitney Test).
We suggested in the introduction that soils may be a better predictor of long-term productivity of a site due to problems with measuring productivity in perennial species, changes in cultural practices, etc. However, a change in soil does not necessarily imply that site productivity was affected. The soil could be approaching a new threshold that is stable with regard to its disturbance regime [17]. Furthermore, with the appropriate monitoring of nutrients as suggested by the extension service, nutrient deficiencies may be avoided.
Overall, we found little indication that late rotation stands would have lower productivity relative to early rotation stands. In two pilot studies we examined mycorrhizae and triazine herbicides. The ability of Christmas trees to acquire nutrients is influenced by mycorrhizae. Mycorrhizal colonization and counts on noble fir (the most commonly planted species) was observed as similar between early and late rotation sites [18]. Furthermore, an accumulation of commonly applied triazine herbicides has also been implicated in productivity declines as a result of indirect impacts to the mycorrhizal and microbial communities or as direct growth reduction. We found that atrazine, Velpar™, the commonly applied triazine products, and their decomposition products were higher in the later rotation sites measured but were more closely associated with time since application. Results suggest that changes in the fungal or microbial communities are not significant and not associated with herbicide applications. Further, residual triazine levels were frequently below those needed to control triazine sensitive grasses.
Aggregate stability is a commonly measured soil quality parameter. Soil with stable aggregates should allow water infiltration and retention, be disposed to minimal erosion, and not restrict root elongation [19]. We found that aggregate stability in the top 7.5 cm was lower in the late rotation relative to the early rotation (Table 2 and Table 3). This could have some implication on long-term sustainability. Likewise, this finding has implications to growers regarding the methods of field preparation and subsequent erosion losses.
Neither early nor late rotation fields had a mean soil resistance that would restrict root growth (Table 4). However, at the 7.5–30 cm depth we found an average maximum soil resistance greater than 3000 kPa in the mid-row location, suggesting that root penetration may be hampered in this area. However, with one exception, we did not find a difference between the early and late rotation soil resistance (Table 5). This suggests that repeated management and harvesting has little effect on soil resistance.
We did find that mid-row locations had high soil resistance at the 7.5–30 cm depth, but no difference between early and late rotation (Table 5). We suggest that this effect is a result of management practices that occur at crop establishment. Farmers commonly use a planting apparatus with a ripping shank set to about 30+ cm. This tractor would have had its wheels in the mid-row location, where resistance was highest, where it could have compacted these locations. This effect appears to have remained after many years. Depending on the site preparation techniques this compacted area could impact the next crop’s productivity.
Table 4. Summary of soil penetrometer data collected within the drip line, first tire track and mid-row; all units in kpa.
DepthRotation22Drip LineTire TracksMid-Row
MeanMaxMeanMaxMeanMax
0 to 7.5 cmEarlymedian670102188213177571284
stdev389620385585393579
Latemedian53786075410737331112
stdev382655327573345649
7.5 to 30 cmEarlymedian192623392072242021223746
stdev382368342354331640
Latemedian191823252067238821163878
stdev466473429445426744
30 to 45 cmEarlymedian230824552309252523872616
stdev383423410395405435
Latemedian221324122260246123202442
stdev406473395443411439
Table 5. Median and standard deviation of differences (∆) between early and late rotation pairs; pdiff represent the results from a Wilcoxon Signed Rank test testing the null hypothesis that the median difference (absolute) is equal to zero; all units in kpa.
DepthRotationDrip LineTire TracksMid-Row
MeanMaxMeanMaxMeanMax
0 to 7.5 cmmedian−91−120−80−63−159−174
stdev490811477786490855
pdiff0.4780.5180.4580.4980.3840.582
7.5 to 30 cmmedian−21−39−59−8015−186
stdev408377370343370811
pdiff0.7180.3500.5390.2450.4780.439
30 to 45 cmmedian−76−36−83−66−59−122
stdev335339389410379388
pdiff0.0700.2450.4780.8140.4390.334
Compaction can create root restrictive layers in the soil that can limit the ability of trees to obtain water and nutrients. Compaction can also increase bulk density which can have a small effect on the water holding capacity of the soil. Resistance to penetration has been shown to be positively related to soil bulk density [7] and much more sensitive to compaction than bulk density [20]. Since we found no difference among most locations and depths’ soil resistance, we surmise that bulk density and therefore water holding capacity were not affected. The higher degree of compaction at the 7.5–30 cm depth in the mid-row location may limit root growth and the amount of soil volume tree roots can utilize and therefore may affect uptake of water and nutrients. Since this compacted area is beyond the crowns of the trees, and the spread of most of the roots, it may have little effect on site productivity.

4. Conclusions

We analyzed 22 pairs of early and late rotation Christmas tree plantations from a major Christmas tree growing region and found little impact on soil resources that would impact long term production of Christmas trees, if extension service recommendations are followed by Christmas tree farmers. We found that N, K, and Ca were affected by the treatments but replacement by regular fertilizer application was probably adequate. We also suggest that planting methods or other practices that potentially compact soil, increase resistance, and reduce aggregate stability should be investigated. The ripping operation at planting should be shifted to fall when the soil is dry.

Acknowledgments

The authors thank the following individuals for their assistance: Paul Adams (OSU Extension Watershed Specialist) and James Boyle (OSU Forest Soils Professor, emeritus) both provided expertise and guidance in developing the study plan; Aria Beckman, Mike Bondi, and Linda Brewer provided invaluable assistance in plot measurements, data collection and report preparation; Rick Fletcher and Steve Webster were all part of the original study team involved in plot selection, grower interviews, measurements and monitoring of study sites in each of their respective areas in Oregon and Washington; and Efren Cázares (OSU Mycorrhizal Ecology) provided the mycorrhizal below-ground evaluations. Partial funding was provided by Oregon Department of Agriculture and OSU Agricultural Research Center. This study would not have been possible without the twenty two participating Christmas tree growers in NW Oregon and SW Washington who allowed us unfettered access to their growing sites.

Author Contributions

Jeff Hatten, analyzed the data and wrote the paper; Chal Landgren and John Hart designed the study, performed the research, and contributed to interpreting the results and writing the paper.

Conflicts of Interest

The authors declare no conflict of interest.

References

  1. USDA. Agriculture Census; United States Department of Agriculture: Washington, DC, USA, 2012. [Google Scholar]
  2. Morris, L.A.; Miller, R.E. Evidence for long-term productivity change as provided by field trials. In Impacts of Forest Harvesting on Long-Term Site Productivity; Dyck, W.J., Cole, D.W., Comerford, N.B., Eds.; Chapman and Hall: London, UK, 1994; pp. 41–80. [Google Scholar]
  3. Richardson, B.; Skinner, M.F.; West, G. The role of forest productivity in defining the sustainability of plantation forests in New Zealand. For. Ecol. Manag. 1999, 122, 125–137. [Google Scholar]
  4. Burger, J.A.; Kelting, D.L. Using soil quality indicators to assess forest stand management. For. Ecol. Manag. 1999, 122, 155–166. [Google Scholar]
  5. Greacen, E.; Barley, K.; Farrell, D. The mechanics of root growth in soils with particular reference to the implications for root distribution. In Root Growth; Whittington, W.J., Ed.; Butterworths: London, UK, 1969; pp. 256–269. [Google Scholar]
  6. Greacen, E.L.; Sands, R. Compaction of Forest Soils. A Review. Aust. J. Soil Res. 1980, 18, 163–189. [Google Scholar]
  7. Sands, R.; Greacen, E.; Gerard, C. Compaction of sandy soils in radiata pine forests. I. A penetrometer study. Soil Res. 1979, 17, 101–113. [Google Scholar]
  8. Amaranthus, M.P.; Page-Dumroese, D.; Harvey, A.; Cazares, E.; Bednar, L.F. Soil Compaction and Organic Matter Affect Conifer Seedling Nonmychorizal and Ectomychorrrhizal Root Tip Abundance and Diversity; USDA Forest Service, Pacific Northwest Research Station: Portland, OR, USA, 1996. [Google Scholar]
  9. Frank, R.; Sirons, G.; Anderson, G. Atrazine: The impact of persistent residues in soil on susceptible crop species. Can. J. Soil Sci. 1983, 63, 315–325. [Google Scholar]
  10. Hart, J.; Landgren, C.; Fletcher, R.; Bondi, M.; Withrow-Robinson, B.; Chastagner, G. Christmas Tree Nutrient Management Guide: Western Oregon and Washington; Oregon State Univeristy Extension Service, EM 8856-E: Corvallis, OR, USA, 2009. [Google Scholar]
  11. Daly, C.; Gibson, W.P.; Taylor, G.H.; Johnson, G.L.; Pasteris, P. A knowledge-based approach to the statistical mapping of climate. Clim. Res. 2002, 22, 99–113. [Google Scholar]
  12. Thomas, G.W. Soil pH and Soil Acidity. In Methods of Soil Analysis; Part 3 Chemical Methods; Sparks, D.L., Page, A.L., Helmke, P.A., Loeppert, R.H., Soltanpour, P.N., Tabatabai, M.A., Johnston, C.T., Sumner, M.E., Eds.; Soil Science Society of America and America Society of Agronomy: Madison, WI, USA, 1996; pp. 475–490. [Google Scholar]
  13. Nelson, D.W.; Sommers, L.E. Total carbon, organic carbon, and organic matter. In Methods of Soil Analysis. Part 3. Chemical Methods; Sparks, D.L., Page, A.L., Helmke, P.A., Loeppert, R.H., Soltanpour, P.N., Tabatabai, M.A., Johnston, C.T., Sumner, M.E., Eds.; Soil Science Society of America and American Society of Agronomy: Madison, WI, USA, 1996; pp. 961–1010. [Google Scholar]
  14. Sumner, M.; Miller, W.; Sparks, D.; Page, A.; Helmke, P.; Loeppert, R.; Soltanpour, P.; Tabatabai, M.; Johnston, C. Cation exchange capacity and exchange coefficients. In Methods of Soil Analysis; Part 3 Chemical Methods; Soil Science Society of America and America Society of Agronomy: Madison, WI, USA, 1996; pp. 1201–1229. [Google Scholar]
  15. Olsen, S.; Sommers, L. Phosphorus. In Methods of Soils Analysis; Part II, 2nd ed.; Page, A.L., Ed.; Agronomy Monograph 9; ASA/SSA: Madison, WI, USA, 1982. [Google Scholar]
  16. Gee, G.W.; Bauder, J.W. Particle Size Analysis. In Methods of Soil Analysis. Part 3. Chemical Methods; Sparks, D.L., Page, A.L., Helmke, P.A., Loeppert, R.H., Soltanpour, P.N., Tabatabai, M.A., Johnston, C.T., Sumner, M.E., Eds.; Soil Science Society of America and American Society of Agronomy: Madison, WI, USA, 1996; pp. 383–412. [Google Scholar]
  17. Worrell, R.; Hampson, A. The influence of some forest operations on the sustainable management of forest soils—a review. Forestry 1997, 70, 61–85. [Google Scholar]
  18. Brewer, L.; Fletcher, R.; Hart, J.; Landgren, C.; Webster, S. Changes in Soil Conditions over Multiple-Tree Cropping Cycles- Final Report to Oregon Department of Agriculture; Oregon State University Extension Service: Corvallis, OR, USA, 2012. [Google Scholar]
  19. Bronick, C.J.; Lal, R. Soil structure and management: A review. Geoderma 2005, 124, 3–22. [Google Scholar]
  20. Vazquez, L.; Myhre, D.L.; Hanlon, E.A.; Gallagher, R.N. Soil penetrometer resistance and bulk density relationships after long-term no tillage. Commun. Soil Sci. Plant Anal. 1991, 22, 2101–2117. [Google Scholar]

