Article

Predicting Wood Density Using Resistance Drilling: The Effect of Varying Feed Speed and RPM

1
Forest Research Institute, University of the Sunshine Coast, Maroochydore, QLD 4556, Australia
2
Forest Quality Pty Ltd., Franklin, TAS 7113, Australia
3
Wood Quality Consulting, Rotorua 3015, New Zealand
4
Scion, Rotorua 3010, New Zealand
*
Author to whom correspondence should be addressed.
Forests 2024, 15(4), 579; https://doi.org/10.3390/f15040579
Submission received: 2 February 2024 / Revised: 11 March 2024 / Accepted: 18 March 2024 / Published: 22 March 2024
(This article belongs to the Special Issue Wood Quality and Mechanical Properties)

Abstract

:
The IML PD series Resi is a device used to assess the drilling resistance of wood. The IML PD series Resi instrument is being widely adopted for commercial wood quality assessment due to its speed, cost-effectiveness, and precision when combined with web-based trace processing. Collecting Resi data with fixed feed speed and RPM settings is challenging due to inherent basic density variations within and between tree species. Altering these settings affects the drilling resistance amplitude of the Resi data, impacting basic density predictions. This study introduces the concept of chip thickness to combine feed speed and RPM into a single parameter to minimise the effects of different sampling conditions on the basic density predictions. Regression models, with chip thickness as the regressor variable, account for 97% to 99% of variance in mean Resi outerwood amplitude across six species. The demonstrated adaptability of chip thickness for adjusting feed speed and RPM settings, along with species-specific functions correlating it with Resi amplitude, holds promise for standardizing amplitude values across diverse feed speeds and RPM settings. Optimal sampling conditions needed to predict basic density lie within the 30%–40% amplitude range. To drill a ~30 cm diameter tree, the recommended fastest settings were 200 cm/min and 3500 RPM for Southern Pine (Pinus elliottii var. elliottii (Engelm) × Pinus caribaea var. hondurensis (Sénéclauze)) and Radiata Pine (Pinus radiata (D. Don.)), 200 cm/min and 2500 RPM for Hoop Pine (Araucaria cunninghamii (Mudie)), 50 cm/min and 5000 RPM for Spotted Gum (Corymbia citriodora subsp. variegata (F. Muell.)), 200 cm/min and 4500 RPM for White Cypress (Callitris glaucophylla (Thompson & Johnson)), and 150 cm/min and 3500 RPM for Shining Gum (Eucalyptus nitens (H. Deane & Maiden) Maiden) based on the billets sampled.

1. Introduction

Drilling resistance is a semi- non-destructive method that has been used for mechanical characterization of natural stone, concrete, and wood [1,2,3,4].
For inspecting wood, timber structures, trees, and tree rings, there are two manufacturers of drilling resistance measurement machines, such as the IML-RESI Power Drill® [5] and the RESISTOGRAPH® [6]. The operability of these two machines slightly differs, where in the IML-RESI Power Drill®, the user sets operational parameters, while in the RESISTOGRAPH®, these parameters are automatically configured [5,6].
The use of drilling resistance to predict wood basic density using IML-RESI Power Drill series (Resi) instrument is rapidly becoming a routine process among Australian and world-wide forest growers for standing tree wood quality assessment [7,8]. Compared to other technologies such as Pilodyn, torsiometer, and nail withdrawal, the resistance drilling proves to be a more cost-effective and rapid method for collecting wood density data and is sufficiently precise for commercial use, particularly when its use is facilitated by automated, web-based trace processing platforms [7,8,9]. In addition, drilling resistance can be used for stiffness measurements [10,11]. Furthermore, in an open forest, 40 trees can be assessed for drilling resistance, as opposed to 27 trees per hour with ST-300, and 4 trees per hour by coring [10].
There are an increasing number of studies in the scientific literature utilising the drilling resistance for wood density assessment, predominantly in tree breeding [12,13,14]. Studies have also used the approach to explore longitudinal and radial variation in wood properties within the tree [15,16,17] and silvicultural and environment effects on wood properties [15,18,19]. Work in both softwoods and hardwoods has demonstrated that drilling resistance data correlates strongly at the individual sample level with basic density [8,16,20,21].
The Resi works by driving a 3 mm wide triangular spade type bit on a 1.5 mm needle-like shaft through a tree at a constant forward feed speed and rotation rate. The resistance to turning (torque) of the spade bit is recorded electronically at 0.1 mm intervals [22] with the relative amplitude in a scale from 0 to 100%. Potential drill length can vary depending on the instrument used from 200 to 1000 mm [5,22]. The IML Resi PD 400 and PD 500 (drill depth of 400 and 500 mm, respectively) are the tools typically used by the forestry industry in Australia. The IML-RESI Power Drill series Resi instruments can operate within the range of 15–200 cm/min feed speed (=forward speed) and 1500–5000 revolutions per minute (r min−1, RPM) settings [5].
The ratio of penetration rate (feed speed) and rotational speed (RPM) has been shown to be proportional to drilling resistance [23]. The feed rate per major cutting edge in the drilling process defines the volume of wood chip cut by the needle blades (hereafter called chip thickness); where chip thickness is feed speed in m/min divided by twice the RPM [24]. Fast feed speed and slow RPM results in larger chip thickness compared to the chip size cut by slow feed speed and fast RPM. For example, feed speed of 15 cm/min and 5000 RPM cuts the smallest possible chip size of thickness 0.015 mm, while 200 cm/min and 1500 RPM will cut largest possible chip of 0.667 mm, if the Resi does not overload. Bigger chips (fast feed speed and low RPM) requires more torque force and energy, resulting in greater amplitude being recorded by the Resi tool [24].
The rotational and feed speeds of the drill bit can be adjusted to suit different species to maximise relative amplitude without overloading the instrument [24,25]. For example, high feed speed and low rotation speed may result in Resi overload particularly when a tree’s basic density is high, while low feed speed and fast rotation speed will give very low drilling resistance amplitude and traces with minimal amplitude variance [24], reducing the ability to resolve annual ring structures and predict basic density [6,24]. Typically, when drilling resistance amplitude values exceed approximately 80% the needle retracts to protect the Resi motor and gearbox from damage, and an overload message is displayed. The optimal Resi sampling conditions for basic density measurement in the forest is when the mean Resi amplitude is around 30% and does not exceed 35%–40% of amplitude [26]. This generally allows the Resi needle to drill through the tree radius without overloading, while keeping amplitude in a range where predictions of basic density are most precise.
Priority should be given to the higher feed speed to make sampling faster (resulting in more trees being sampled per day) and higher RPM to reduce the load and wear on the motor–gearbox [27]. (The same amplitude or chip thickness of 0.1 mm can be generated using several Resi settings, e.g., feed speed 30 cm/min and 1500 RPM, or 100 cm/min and 5000 RPM. In this instance, it would be better to use a higher feed speed and RPM. However, very high RPM might increase needle wear [28].
The optimal choice of drill settings can vary between or within species and sites, primarily due to variation in basic density. Currently, for plantation trees assessed with the IML Resi PD 400 or PD 500, settings of 200 cm/min and 3500 RPM for softwoods such as Southern and Radiata pines [29] and 150 cm/min and 3500 RPM for eucalypts are recommended [8]. The information about optimal settings to use for other commercially important species with different density ranges is limited. In addition, the drill settings may need to be changed in the field; for example, to prevent overload, due to unexpected variation in the trees being sampled.
This study is important for developing a standardization method for using IML-RESI Power Drill® machines, aiming to remove or minimize the effect of different drill settings to optimize data collection. This knowledge will allow the forest industry to change the settings when they are encountering higher or lower wood density during routine Resi data collection; thus, improving wood quality prediction in commercial forests.
The specific objectives of this study are as follows:
(1)
To build a function to standardise Resi amplitude across different sampling conditions;
(2)
To explore what the optimum drill settings for a range of species are.

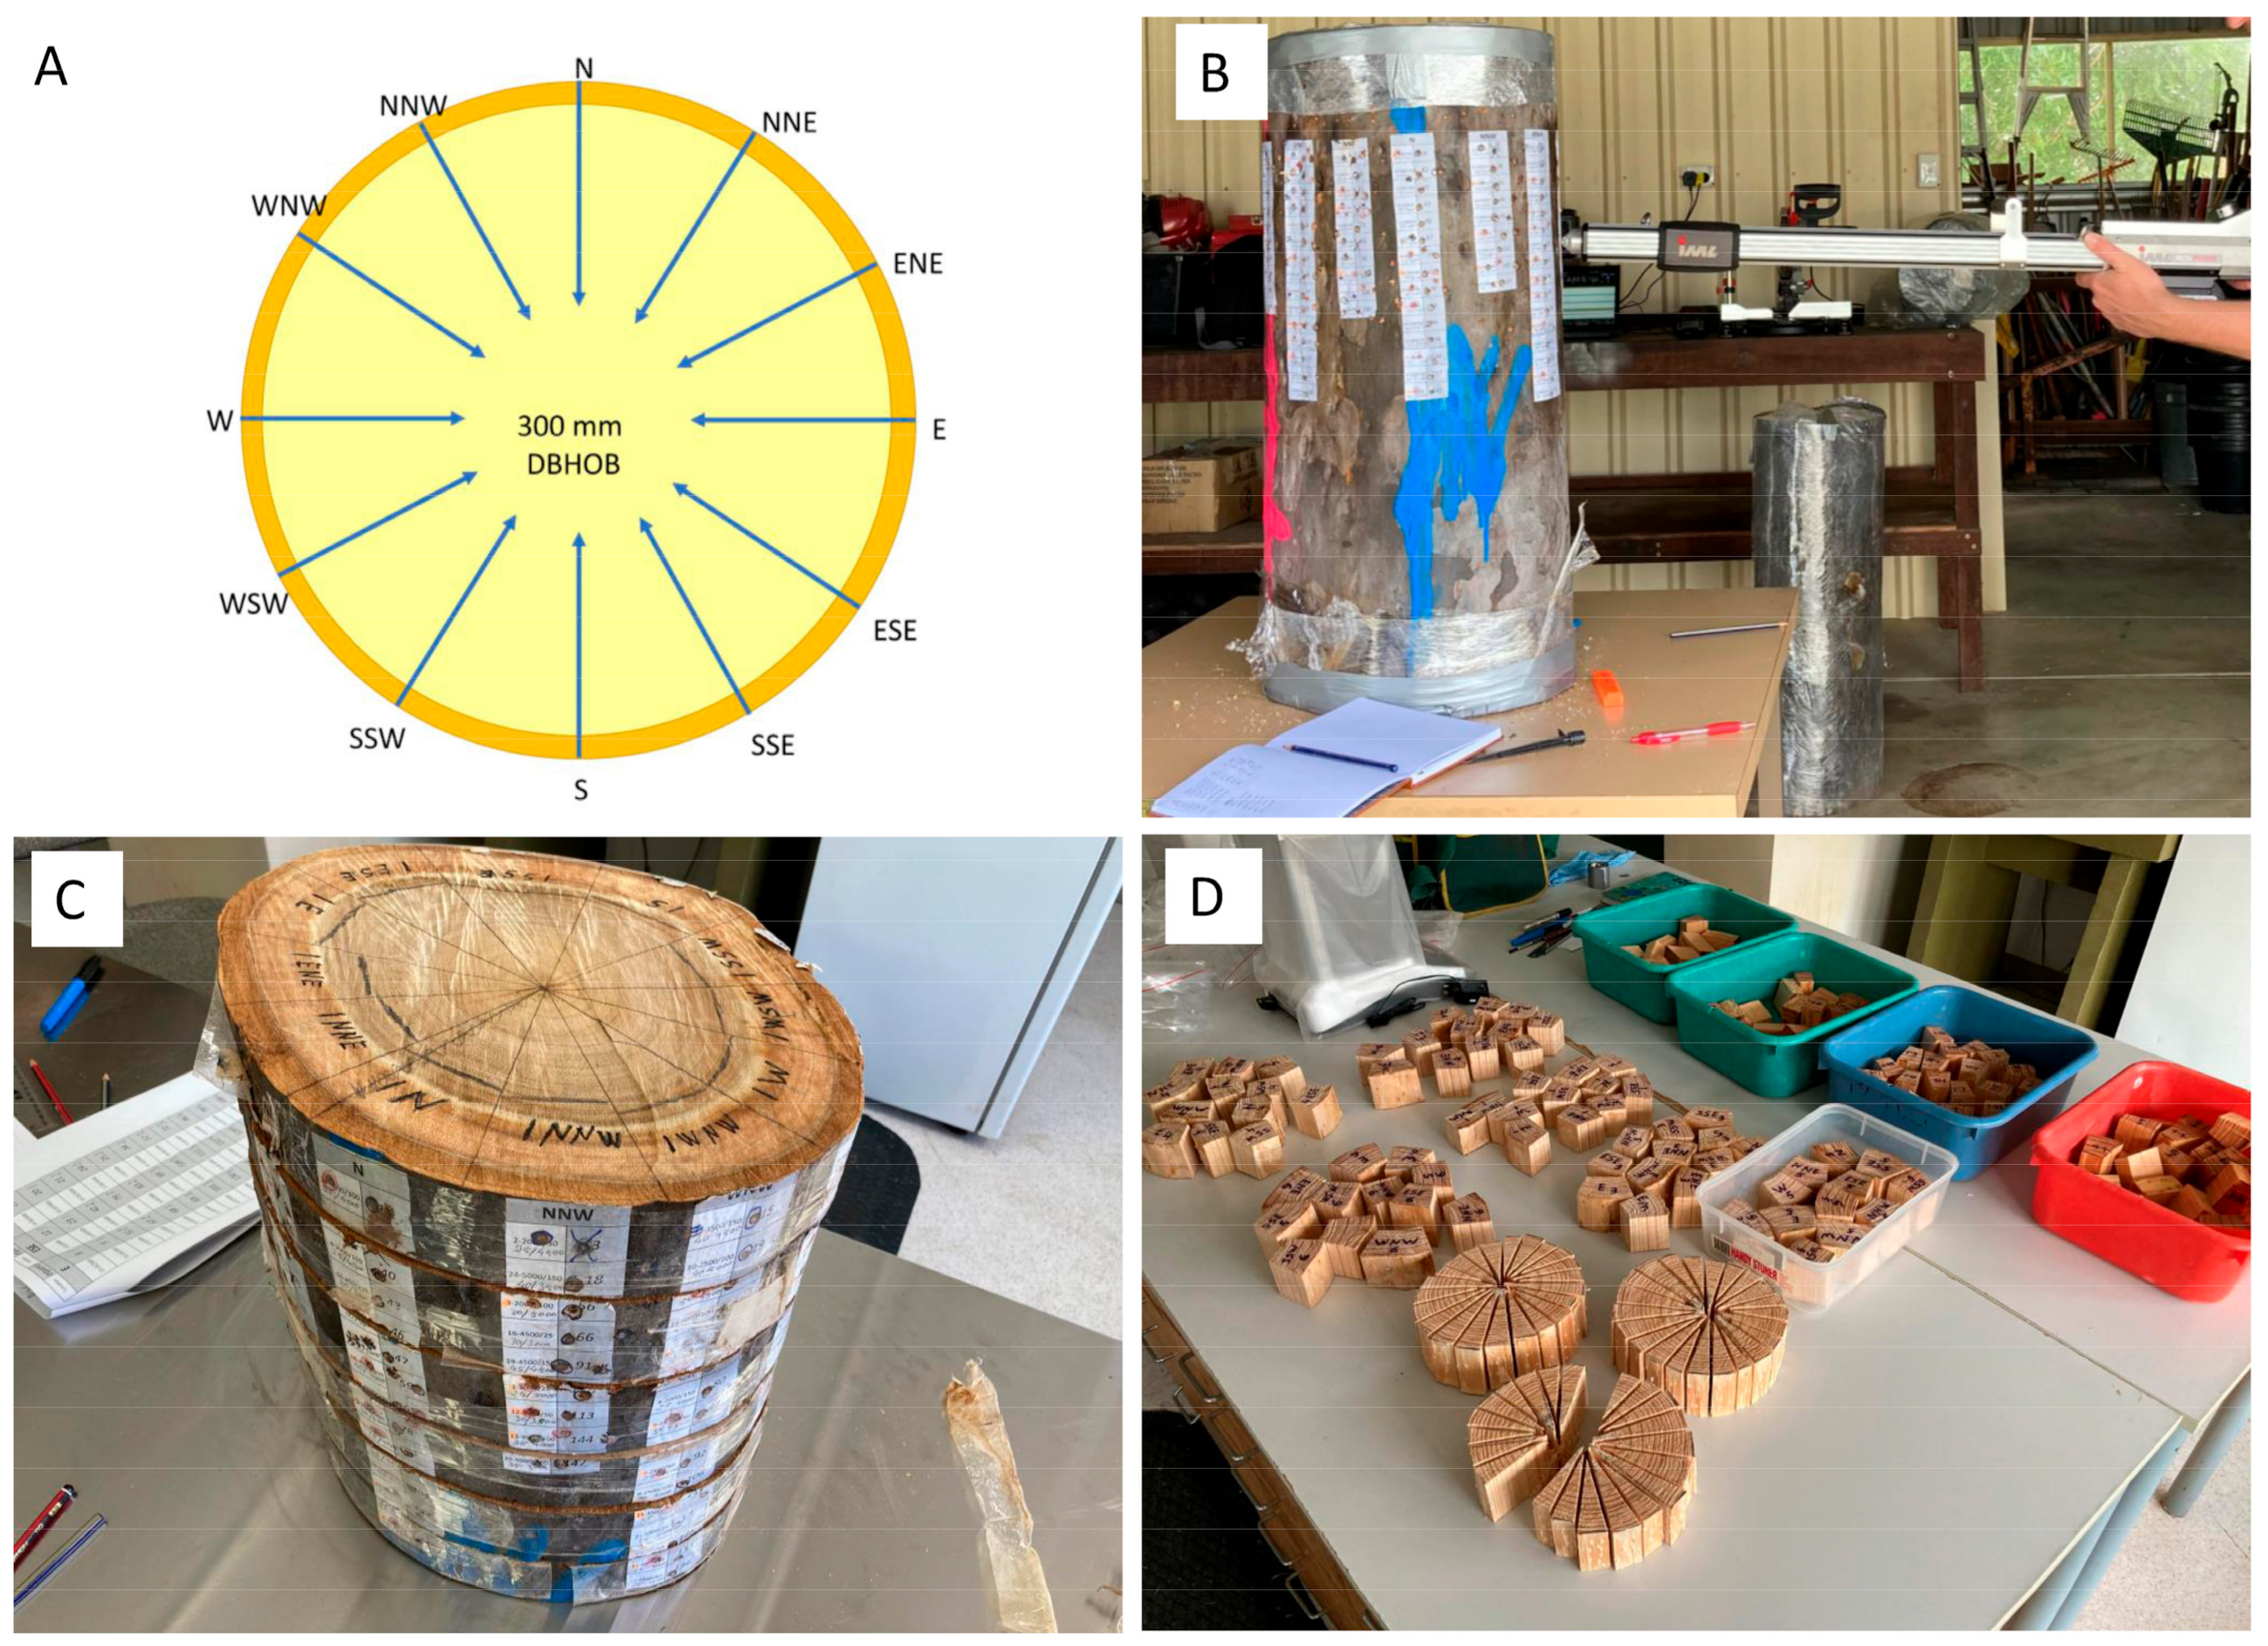
2. Materials and Methods

Billets from six species—Radiata Pine (Pinus radiata (D. Don.)), Spotted Gum (Corymbia citriodora subsp. variegata (F. Muell.)), White Cypress (Callitris glaucophylla (Thompson & Johnson)), Shinning Gum (Eucalyptus nitens (H. Deane & Maiden) Maiden), Southern Pine (Pinus elliottii var. elliottii (Engelm) × Pinus caribaea var. hondurensis (Sénéclauze)), and Hoop Pine (Araucaria cunninghamii (Mudie)) were used in this study. All species except White Cypress were plantation grown ~20 years old trees. The White Cypress were from native forest and estimated to be around 60 years old. The Radiata Pine and Shining Gum were felled in northern Tasmania, the White Cypress near Chinchilla, Queensland, the Hoop Pine near Imbil, Queensland, and the Southern Pine at Toolara State Forest in Queensland, Australia. These commercially important species in Australia were selected to represent various types and qualities of wood with contrasting basic density.
A single billet of approx. 300 mm diameter and 800 mm length from each species was collected from around breast height (BH), for use in the study. The billet ends were wrapped in plastic to slow moisture loss and the billet was returned to the laboratory. The tested billets were fresh and green and were therefore above the fibre saturation point.
Sufficient sampling locations within the billets were randomly allocated among the different aspects (Figure 1A) and over a longitudinal distance of 0.8 m around BH to allow a total of 150 individual Resi traces to be collected per billet (species). An IML Resi PD 500 tool (IML System GmbH, Wiesloch, Germany) was used in the data collection. Twenty-five separate sampling conditions were tested, consisting of a combination of 5 different feed speeds (25, 50, 100, 150, 200 cm/min) and 5 different RPM settings (2000, 2500, 3500, 4500, 5000 RPM) with the following exceptions:
  • For Spotted Gum, all these conditions could not be tested due to overloading of the Resi. Instead, 13 different feed speeds (25, 30, 35, 40, 45, 50, 55, 65, 80, 100, 120, 150, 170 cm/min) and 5 different RPM settings (3000, 3500, 4000, 4500, 5000 RPM) were tested;
  • For White Cypress, the setting of 200 cm/min 2000 RPM was replaced with 200 cm/min 3000 RPM setting due to overloading of the Resi.
Each of these settings were replicated 6 times. A set of 150 Resi traces were taken (25 condition combinations × 6 replications = 150 traces for each species) and 223 traces for Spotted Gum. A new Resi needle was used in each log with a diameter of 3.15 mm (±0.01 mm). Where possible, bark-to-bark traces were collected (Figure 1B); however, some sampling conditions (high feed speed, low RPM) resulted in instrument overload and partial traces.
Figure 1. (A) Resi traces were taken from 12 aspects over a longitudinal distance of approximately 500 mm between 1.1 and 1.6 m above ground level. Full traces were taken radially, and for further analyses, the 50 mm trace from the cambium was used. (B) Trace collection, after which (C) 50 mm discs were cut and divided into 12 sectors (D) from which the outer 50 mm was collected for basic density assessment.
Forests 15 00579 g001
When Resi sampling was completed, the billet was cut into 50 mm thick discs and each disc divided into 12 segments (Figure 1C) of which the outerwood (outer 50 mm) was removed (Figure 1D) and assessed for basic density using the water displacement method according to AS/NZS 1080.3:2000 standard [30,31]. Basic density was calculated as the ratio of oven dry mass (kg) to green volume (m3).
Chip thickness was calculated as feed speed divided by twice the RPM [24]. Resi traces were processed using the online web platform at https://forestquality.shinyapps.io/FQResi/ (accessed on 1 December 2023).
For analyses of chip thickness, we used the average amplitude of fixed drill depth of 50 mm from the cambium.
Statistical analyses were performed within the R environment (Version 4.2.2) [32] using RStudio (Version 2023.09.1+494 “Desert Sunflower”) [33]. Function y = a·xb [24] was used to define the relationship between chip thickness and drilling resistance amplitude, where y is the drilling resistance value (%) in relation to chip thickness (x, mm) and “a” and “b” are fitted constants. Linear regressions were used to explore how basic density from different species billets influences “a” and “b” parameters.

3. Results

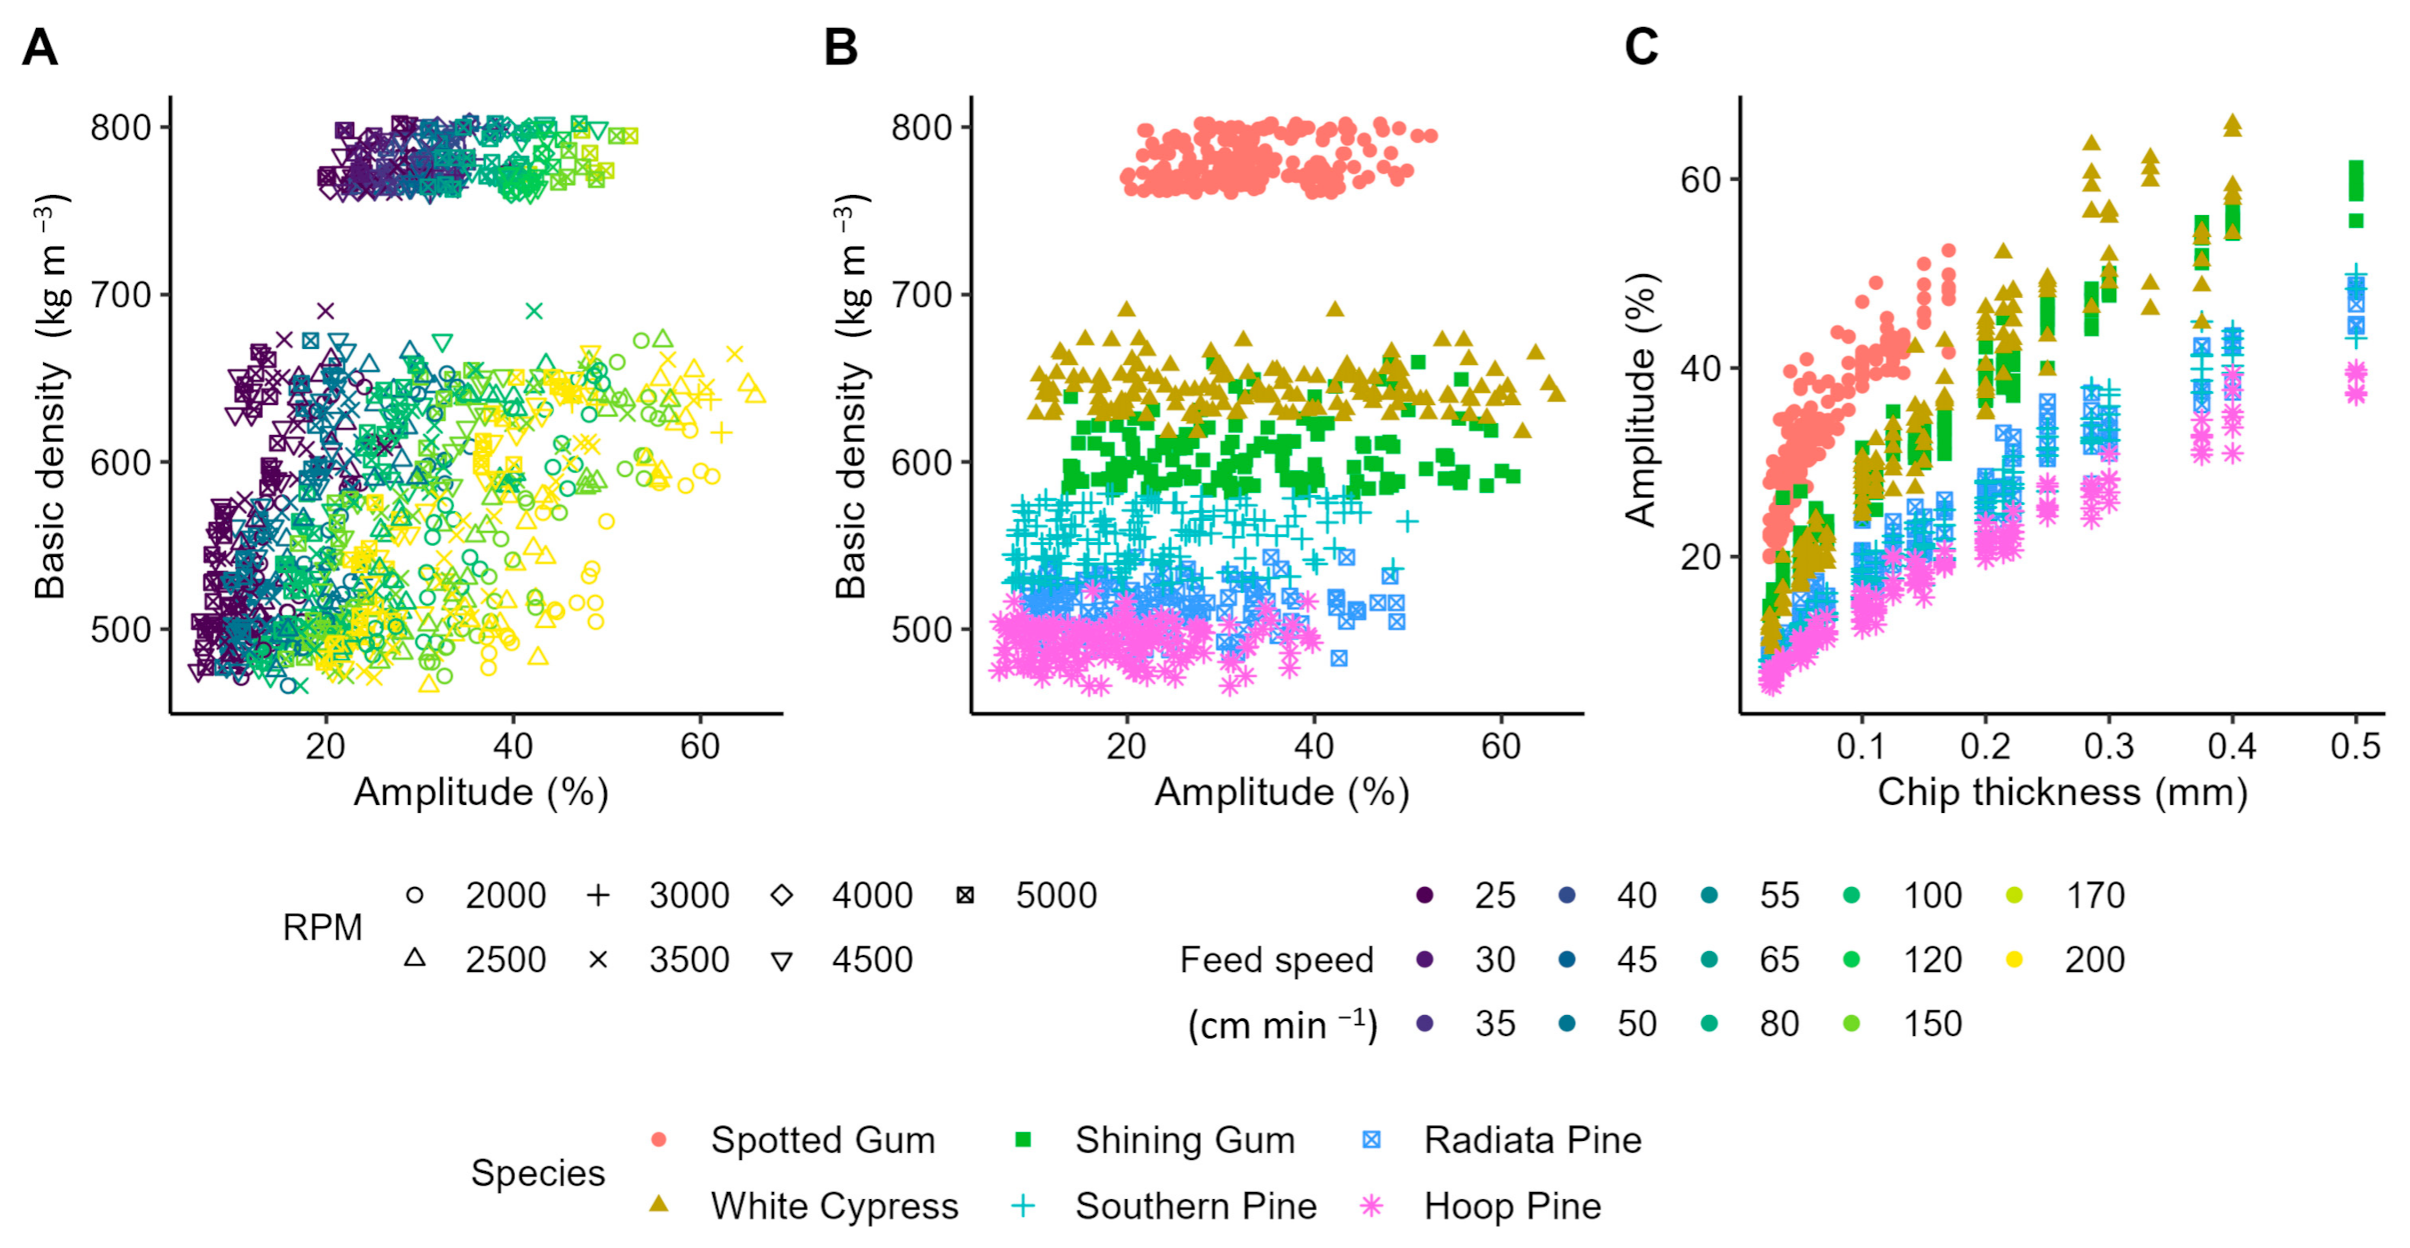
3.1. Basic Density Variation between and within Species

The average outerwood basic density across the billet from the other six species ranged from 493 kg/m3 for Hoop Pine to 779 kg/m3 for Spotted Gum (Table 1, Figure 2B). The Spotted Gum billet had the highest basic densities, with mid-range densities ranging from 604 to 647 kg/m3 for White Cypress and Shining Gum and lower densities for Southern, Radiata, and Hoop pines, ranging from 496 to 554 kg/m3 (Table 1 and Figure 2B).
Within each billet, basic density in the 50 mm outerwood of the stem varied by different amounts, with a range between 41 kg/m3 for the Spotted Gum billet to 103 kg/m3 for the Shining Gum billet (Table 1 and Figure 2B).
Across the billets, the low feed speeds and high RPM generated lower amplitudes and chip size showed a more consistent pattern in the billet of each species (Figure 2A,C).

3.2. Overload Messages and Optimal Sampling Conditions

All species billets were able to be drilled with the slow feed speed settings such as 50 cm/min and very high 5000 RPM (chip thickness = 0.050 mm). However, the use of faster drill speed settings was dependant on species and their densities (Figure 3).
The highest amount of overload messages occurred for the dense Spotted Gum billet. For this billet, overloading occurred when the amplitude exceeded 30% (Figure 3). Interestingly, the overload occurred at most settings that generated a chip thickness of 0.050 mm (e.g., 30 cm/min at 3000 RPM, 35 cm/min at 3500 RPM, and 40 cm/min at 4000 RPM). However, there was no overload for the 50 cm/min at 5000 RPM setting, which also had a chip thickness of 0.050 mm. Similarly, an overload message occurred when the RPMs were lower, specifically at 25 cm/min at 3000 RPM (chip thickness = 0.042 mm), 30 cm/min at 3500 RPM (chip thickness = 0.043 mm), and 35 cm/min at 4000 RPM (chip thickness = 0.044 mm), but not for settings of 40 cm/min at 4500 RPM (chip thickness = 0.044 mm) and 45 cm/min at 5000 RPM (chip thickness = 0.045 mm) (Figure 3). The fastest possible setting with the biggest possible chip thickness for the high density Spotted Gum billet, without overloading, was feed speed 50 cm/min and 5000 RPM (chip thickness = 0.050 mm). Low feed speeds such as 25 cm/min and 5000 RPM resulted in excessive heating of the needle, but the 50 cm/min and 5000 RPM settings also resulted in the needle becoming hot.
In the White Cypress billet, the fastest possible setting was 200 cm/min and 4500 RPM (chip thickness = 0.222 mm) at an amplitude of 45.5%, and 200 cm/min and 5000 RPM (chip thickness = 0.200 mm) at an amplitude of 43.1%. Other settings that worked for this species with similar chip sizes were 150 cm/min and 3500 RPM (chip thickness = 0.214 mm) with an amplitude of 45.2% (Figure 3).
The plantation grown Shining Gum billet could also be drilled at the 150 cm/min and 3500 RPM (chip thickness = 0.214 mm, amplitude 40.6%) setting; however, it failed with the 200 cm/min at 5000 RPM setting (chip thickness = 0.200 mm, amplitude 37.6%) (Figure 3).
The Southern Pine billet could be drilled with the setting of 200 cm/min and 3500 RPM (chip thickness = 0.286 mm, amplitude 33.9%). This was a similar result to that found for the slightly lower density Radiata Pine billet that could also be drilled at the 200 cm/min and 3500 RPM setting (chip thickness = 0.286 mm, amplitude 33.2%). The lowest density billet from Hoop Pine generated the fewest overload messages, and hence could be sampled with the fastest drilling conditions of 200 cm/min and 2500 RPM (chip thickness = 0.400 mm, amplitude 35.3%) or 150 cm/min and 2000 RPM (chip thickness = 0.375 mm, amplitude 32.5%) settings (Figure 3).
The optimal sampling conditions among species are within an amplitude range of 30 to 45.2% (Figure 3). The optimal sampling conditions means maximum amplitude (generated with fastest feed speed and lowest RPM; biggest chip size) with the most likelihood of not generating an overload message.

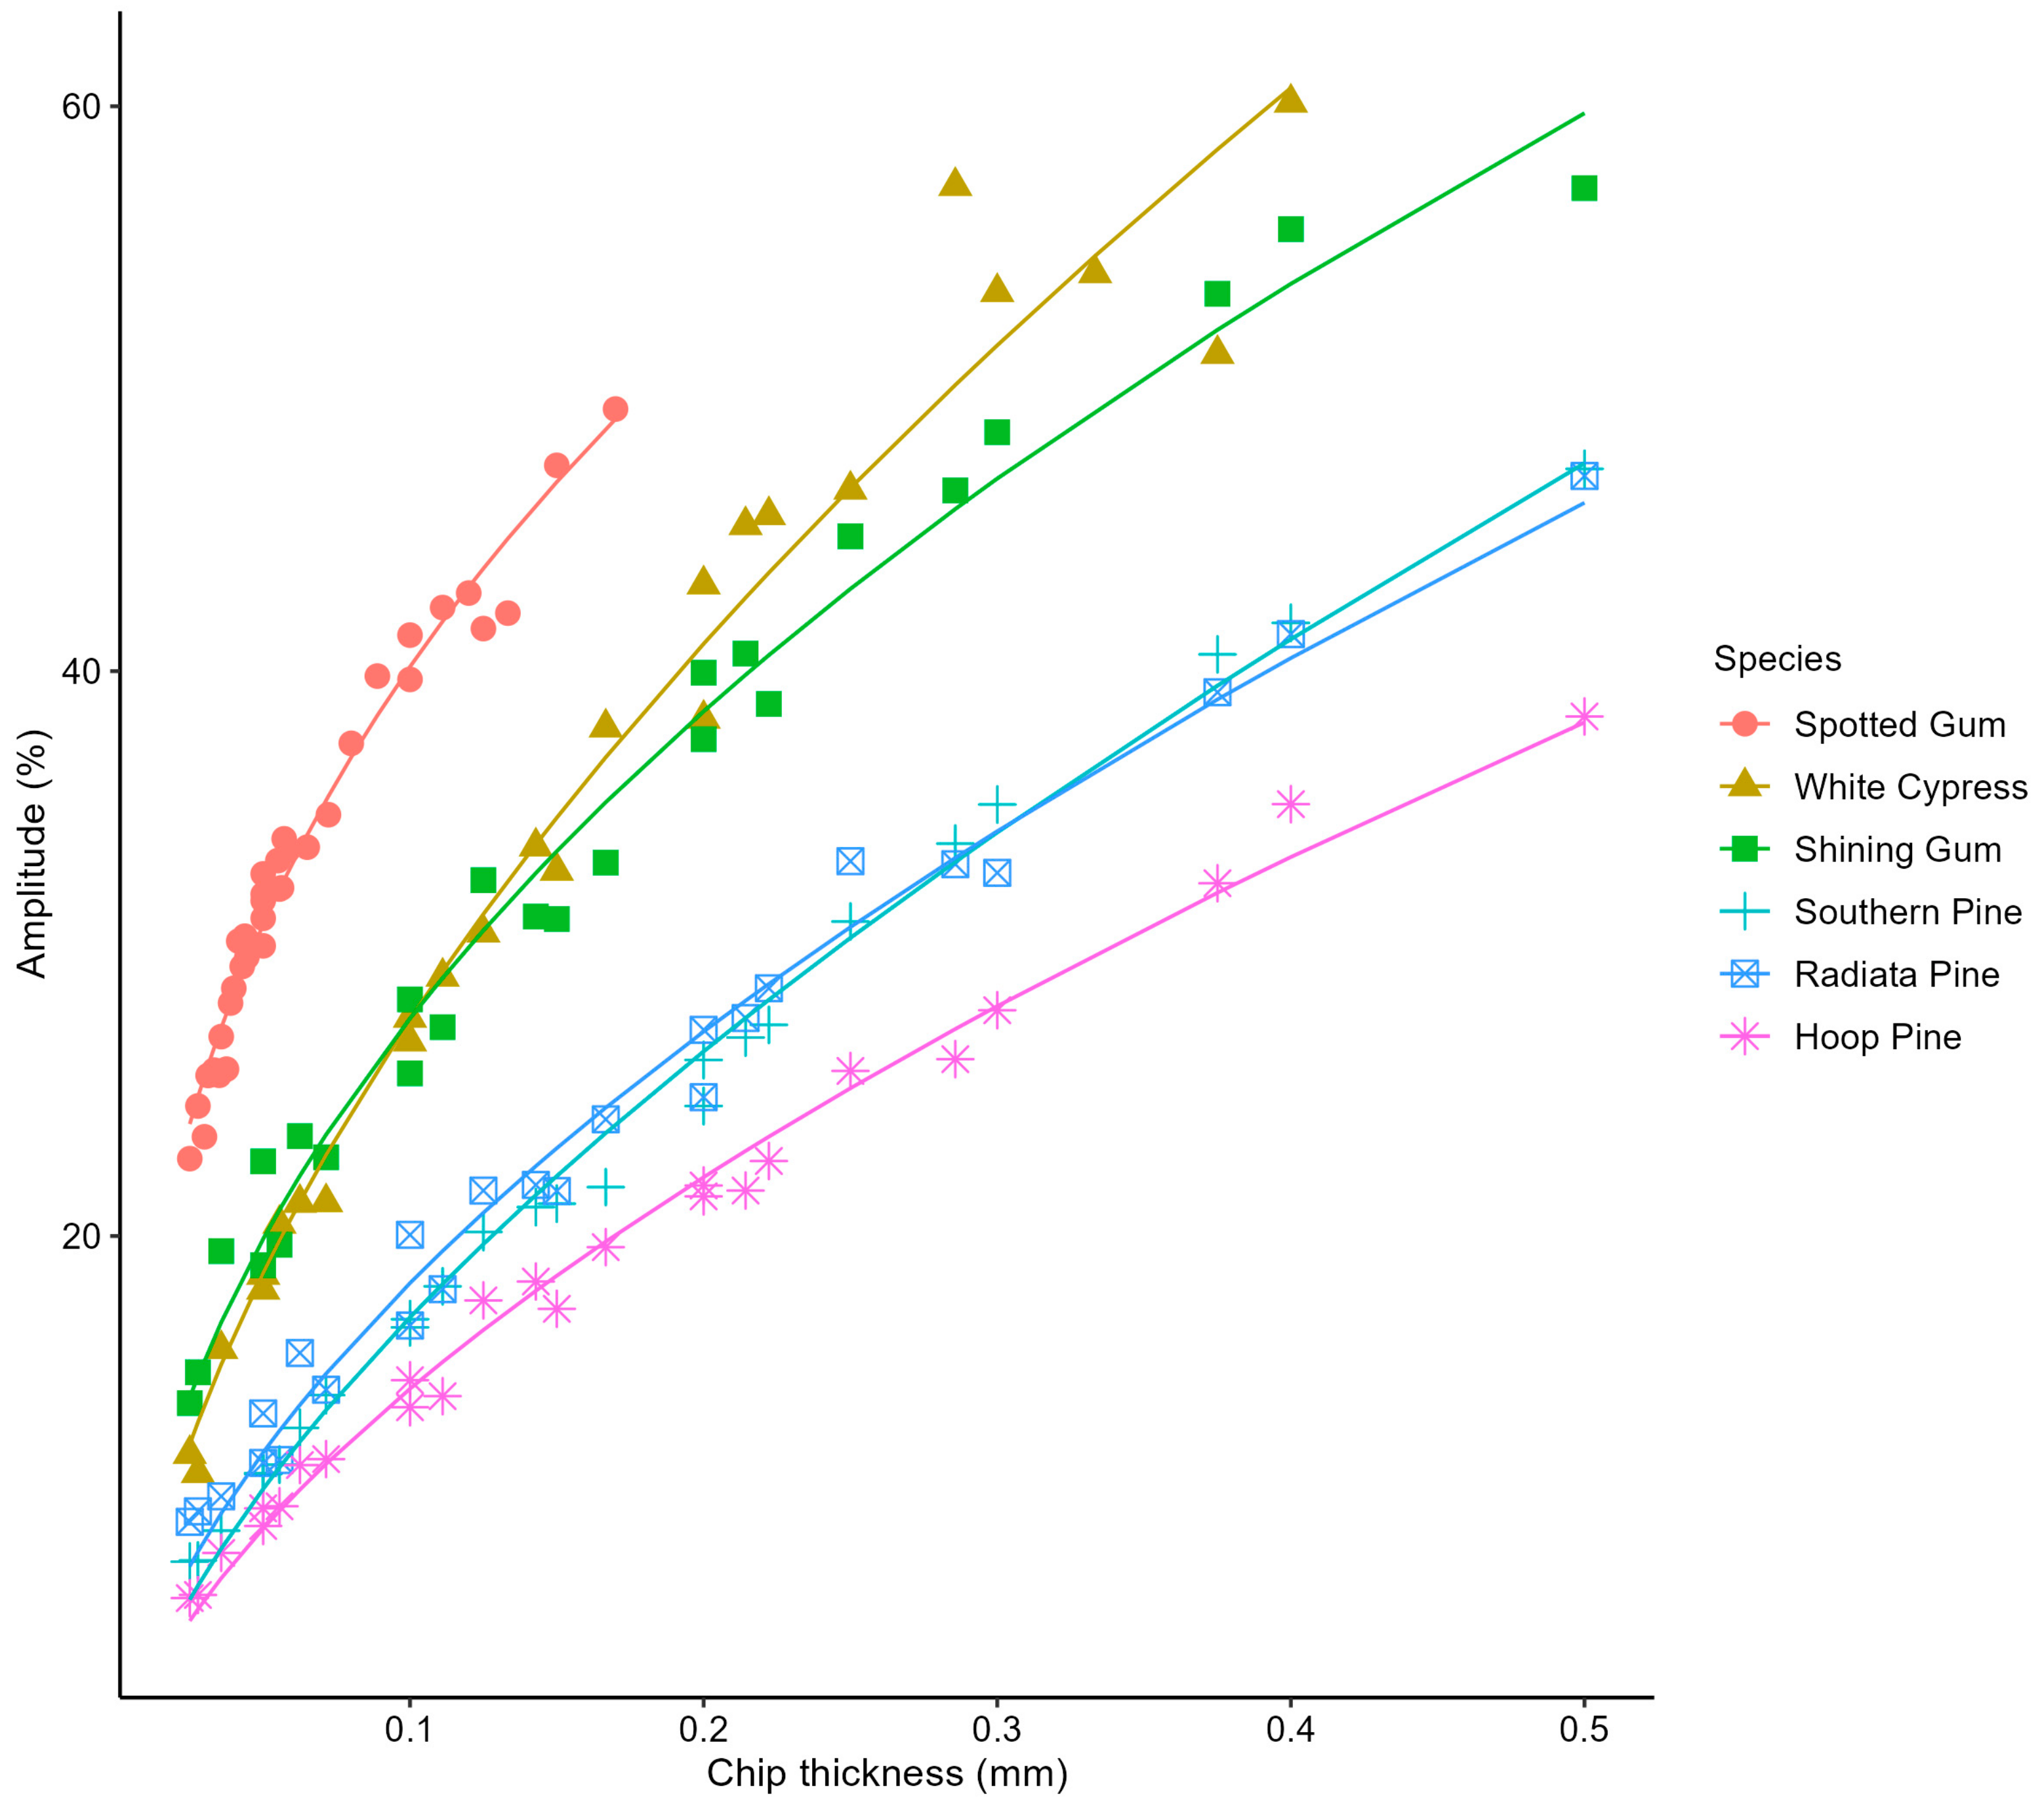
3.3. Adjustment Function for Different Sampling Conditions and Effect of Chip Thickness across Species

The function that describes the relationship between chip thickness and amplitude across the six studied wood species showed a strong relationship, with R2 values ranging from 0.97 to 0.99 and RMSE 0.80 to 2.38 (Figure 4 and Table 2).
The higher density billets (Spotted Gum, White Cypress, and Shining Gum) exhibited steeper initial slopes for smaller chip thickness, and increased at lower magnitude as chip thickness increased. For instance, Spotted Gum, with a chip thickness range of 0.025 to 0.170 mm, corresponded to amplitudes ranging from 22.7% to 49.28%. White Cypress, with a chip thickness range of 0.025 to 0.400 mm, showed amplitude variations ranging between 12.3% and 60.1%. Shining Gum, within a chip thickness range of 0.025 to 0.500 mm, resulted in amplitudes ranging from 14.1% to 57.1% (Figure 4). In contrast, lower-density species such as Southern Pine, Radiata Pine, and Hoop Pine maintained a more consistent slope with respect to chip thickness and amplitude, showing little differentiation between Southern and Radiata Pine (Figure 4). For example, when considering a chip thickness range of 0.025 to 0.500 mm, Southern Pine exhibited amplitude ranging from 8.5% to 47.2%, Radiata Pine from 9.88% to 46.9%, and Hoop Pine from 7.2% to 38.4% (Figure 4). Additionally, Southern Pine, Radiata Pine, and Hoop Pine amplitudes responded more linearly to changes in chip thickness, while other species displayed a steeper, more logarithmic trend.

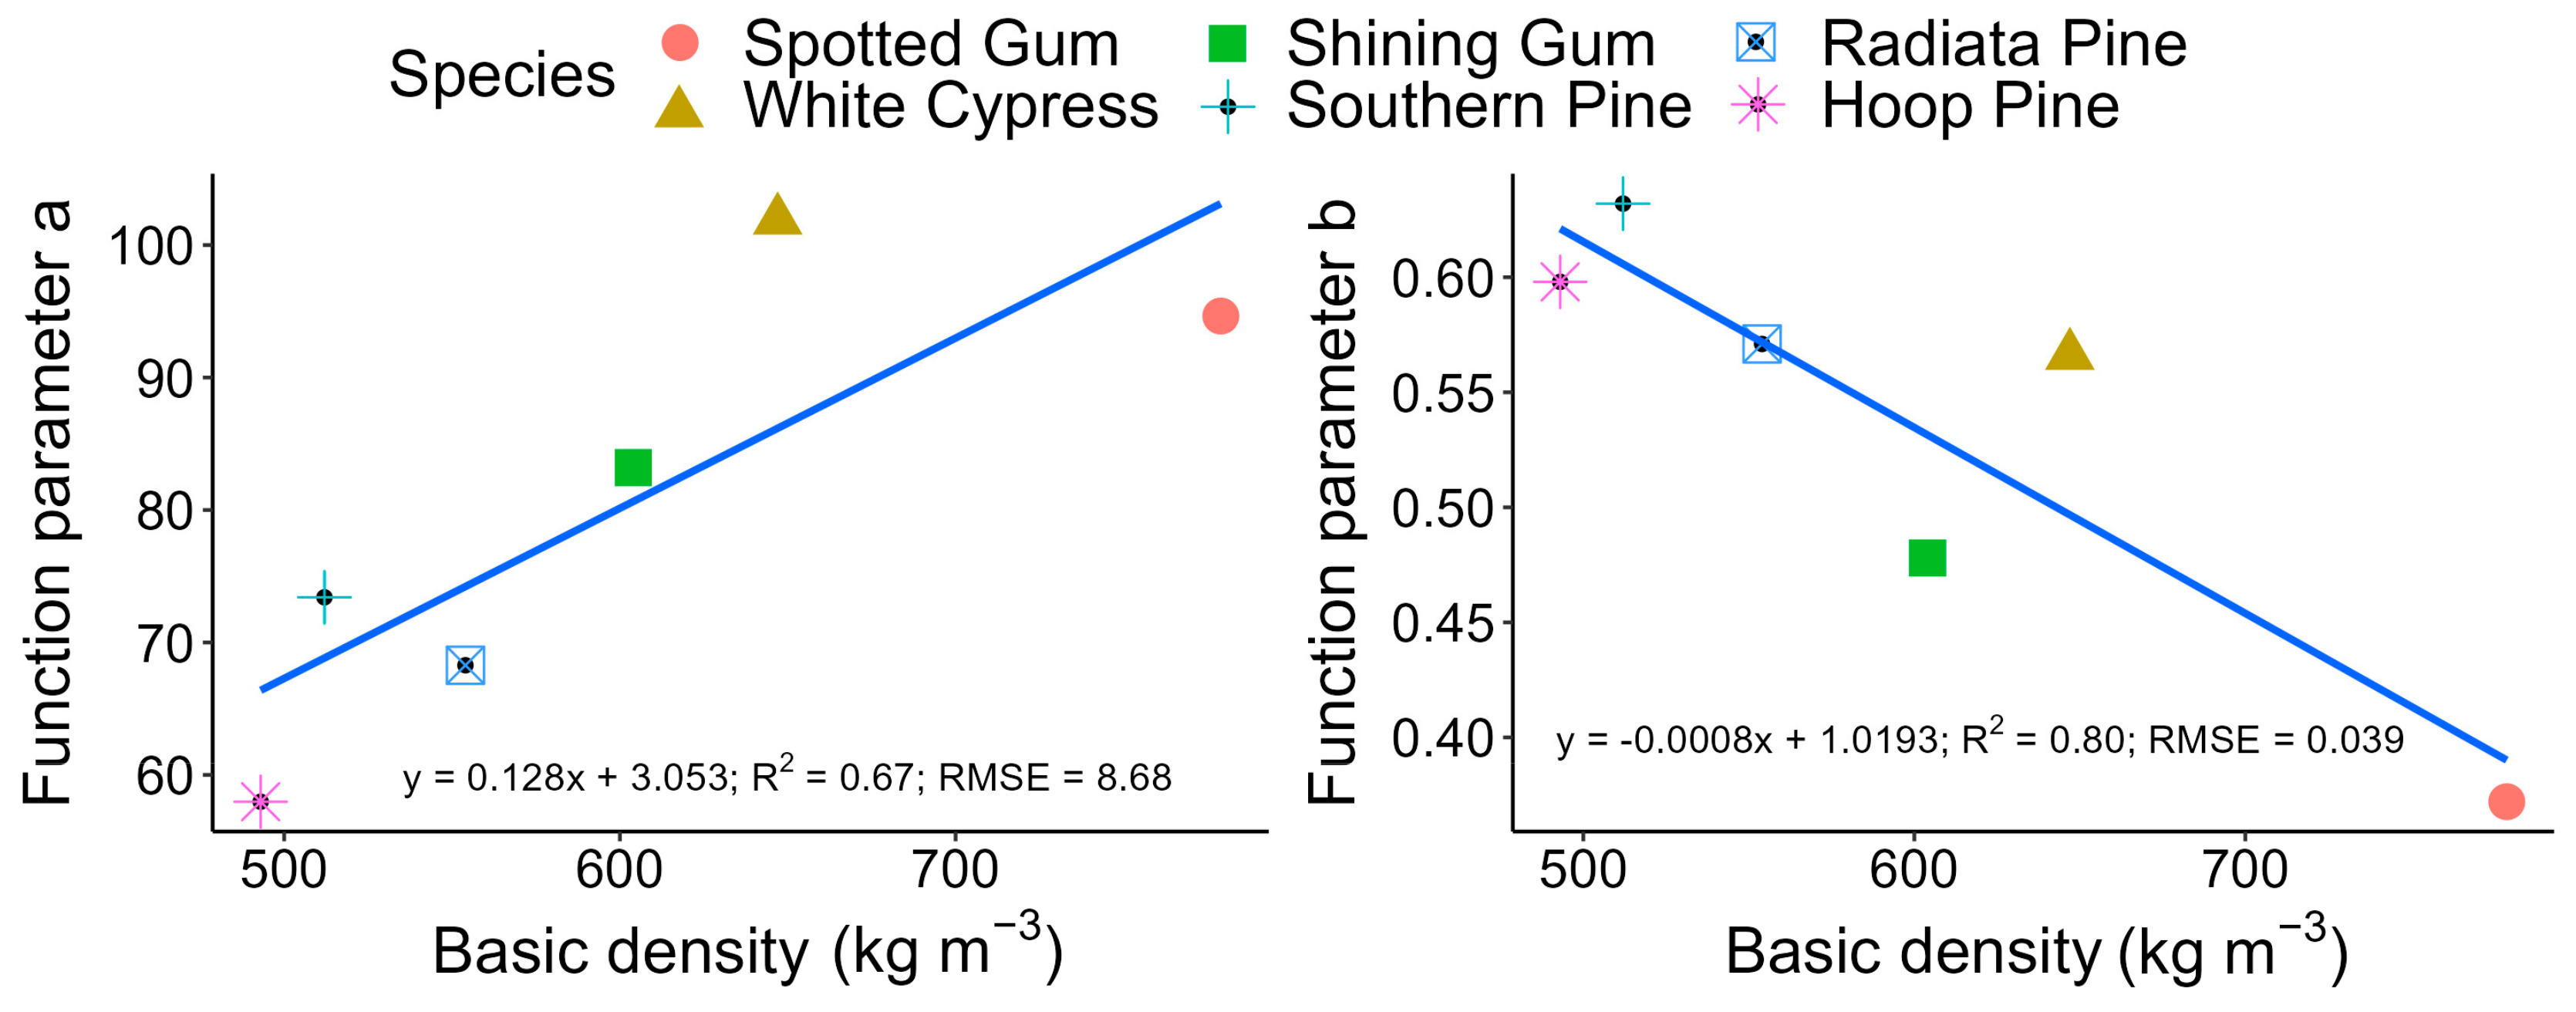
3.4. Basic Density Effect on Function Parameters

The measured outerwood basic density had a significant correlation with two function parameters, “a” and “b,” which are derived from the function y = a·xb as presented in Table 2. Variations in basic density account for 67% and 80% of the variation in these parameters, respectively (Figure 5). Function parameter “a” showed a positive correlation with basic density, while function parameter “b” demonstrates a negative correlation with basic density. Lower density species such as Hoop Pine, Radiata Pine, and Southern Pine had lower values for parameter “a” and higher values for parameter “b.” Conversely, higher density species like Spotted Gum and White Cypress exhibited higher values for parameter “a” and lower values for parameter “b” (Figure 5).

4. Discussion

Billets from six different species had varying average densities, which required different settings of feed speed and RPM for optimal Resi data collection. In higher density billets, settings of low RPM together with fast feed speeds caused overload errors and risked equipment damage. Optimising sampling conditions allowed measurements to be taken across all density ranges, while maximising amplitude and minimising risk of damage to the Resi. Combining feed speed and RPM variation into a single variable defining the volume of wood removed per revolution (chip thickness) [23,24] was found to be an effective approach to account for differences in amplitude which occur due to different sampling conditions (feed speed and RPM). This allowed simple equations to be defined for each species billet (density class) to facilitate the estimation of basic density from amplitude. Basic density, in turn, was found to correlate strongly with fitted equation parameters (a and b) for each species in the equation function y = a·xb.
Resistance drilling can be used for both qualitative and quantitative purposes. Historically, resistance drilling has primarily found qualitative applications in identifying structural decay in various contexts, such as power poles, building beams, urban tree health, and detecting insect damage [34,35,36,37,38,39]. In these cases, it has been employed to distinguish between the lower-density decayed or damaged timber and the higher-density non-decayed wood. The commercial forestry industry seeks to use resistance drilling in a quantitative manner, especially when assessing a large number of trees or logs with minimal cost per assessment [7,8]. In this application, precision becomes crucial, as it involves generating quantitative estimates of wood density. To achieve this precision, it is essential to identify, define, and quantify various sources of variance. Variance can arise within trees, between trees, and between sites, genotypes, and species [40,41,42,43].
Furthermore, other sources of variance linked to the sampling method must also be identified. These may arise from differences between individual Resi instruments, needle diameter (and wear over time), within instruments over time (i.e., calibration and instrument maintenance variation), differences between operators and between sampling conditions. Each of these areas constitutes a subject of investigation within the current research program, and this paper specifically addresses the impact of sampling conditions on amplitude.
To maximise amplitude but avoid overload issues and minimise damage to an instrument that is collecting commercial measurements of tens of thousands of trees over time, it is important to ensure the longevity of the instrument and data accuracy. The optimal drill settings across various species appear to fall within the range of 30% to 40% of the mean amplitude and this is consistent with previous studies [21,24]. Settings with a particularly high feed speed and low RPM that result in a mean amplitude exceeding 40% risk overloading the instrument. This optimal amplitude is based on the density of the 50 mm outerwood on the entry side of the tree, which means when drilling a ~30 cm tree, the amplitude may increase above 80% on the exit side of the tree, due to density variation and needle shaft friction leading to overload and failed measurement [25,44]. The optimal configuration for each species involves selecting the fastest feasible feed speed combined with the slowest RPM setting. This combination generates the largest chip thickness and amplitude without exceeding the instrument’s capacity (overload). Achieving the optimal amplitude entails employing a variety of feed speeds and RPMs, tailored to the different density ranges of various species. For instance, in the case of the lower density billet of Hoop Pine, the ideal settings are achieved with feed speeds of 150–200 cm/min and RPMs of 2000–3500. For the denser White Cypress, optimal settings include a feed speed of 150 cm/min and RPMs ranging from 4500 to 5000. In the case of the very dense Spotted Gum billet, the optimal setting ceiling appears to be 30% amplitude, attainable with a feed speed of 50 cm/min and 5000 RPM. However, the very high RPMs and low feed speeds results in very low variation in amplitude being detected across the annual rings, and the relationship between basic density tends to be weaker compared to higher feed speeds and lower RPM’s [45]. High RPM and slow feed speeds can also potentially increase heat build-up and needle wear [28]; therefore, the needle should be changed more frequently when working with higher density hardwoods. Also, slow speeds and high RPMs usually generate small chip sizes, especially chips ranging from 0 to 0.1 mm when cutting wet wood [46]. Resistance tends to be higher under these conditions [46], potentially resulting in overloading. This overloading is not solely due to drilling resistance but is particularly due to feed resistance, especially in high-density wet wood. This was the case in this study as well, where overloading occurred in Spotted Gum when using slow speeds and high RPM.
Overloading occurrences can differ between species due to basic density varying radially from pith to outerwood, and this depends on the type of wood. For example, in coniferous wood, density increases toward the outerwood, whereas in deciduous ring-porous wood, it decreases. In diffuse-porous wood, density remains relatively constant [47]. Therefore, the depth of drilling in the context of overload occurrence can be influenced by these attributes, especially in combination with the needle friction effect [25,44].
In this study, the relationship between chip thickness and amplitude was found to be non-linear. This nonlinearity in the relationship between amplitude and chip thickness can be attributed to moisture content. In the case of oven-dried samples, the relationship between chip thickness and amplitude tends to be linear [46]. However, when the moisture content is above the fibre saturation point, especially for chip thickness above 0.150 mm, the relationship becomes non-linear, and the amplitude changes becomes less responsive to increasing chip thickness [46]. To cut green wood requires much lower force compared to dry wood [48,49]. It is important to note that in this study, logs were tested in their green state. Additionally, it is worth mentioning that the differences in moisture content above the fibre saturation point were not found to be significant [46]. Therefore, variations in moisture content between standing trees, different stands, or different seasons are unlikely to result in changes in the relationship between chip thickness and amplitude due to living trees being above the fibre saturation point.
The relationship between chip thickness and amplitude was influenced by wood density, revealing distinct trends in the billets of different species. Higher density species like Spotted Gum, White Cypress, and Shining Gum exhibited a steeper initial slope for smaller chip thickness, and then increased at lower magnitude as chip thickness increased. In contrast, lower density species such as Southern Pine, Radiata Pine, and Hoop Pine maintained a more consistent slope with chip thickness and drilling resistance, showing little differentiation between Southern and Radiata Pine. The similarity between Southern Pine and Radiata Pine in terms of this trend indicates that there may be common characteristics or structural factors at play in lower density pine species. This is consistent with previous observations, where species like Silver Poplar, Southern Yellow Pine, Norway Spruce, and Scots Pine demonstrated a flatter, more linear relationship between amplitude and chip thickness [24]. This suggests a more linear response to chip thickness changes in lower density woods. Conversely, high-density species like Spotted Gum (this study) and Sugar Maple [24] displayed a steeper, more exponential trend, highlighting the energy-intensive nature of cutting larger chips in dense wood. When cutting very dense and hard timber, it is necessary to use a low feed speed and high RPM, which generates heat. It is important to note that the compressive strength of wood samples can decrease significantly with high temperature, as demonstrated by Kollmann [50]. Heating green wood leads to changes in mechanical behaviour even greater than changes from dry to green conditions [51]. This increase in temperature causes the timber to become softer, potentially leading to artificially lower amplitudes. The functions developed in this study that correlate chip thickness with amplitude for each species can facilitate the standardization of amplitude values across a range of feed speeds and RPM settings. However, additional research is required to develop a more robust model, including greater replication within each species.
The measured outerwood basic density demonstrates a significant correlation with two function parameters, namely “a” and “b”, which can be compared to those reported by Sharapov, Brischke, Militz, and Toropov [24]. In their study, a positive relationship was identified for parameter “a” (y = 0.1979x − 35.748, R2 = 0.71), while a negative relationship was observed for parameter “b” (y = −0.0005x + 0.9541, R2 = 0.28). It is important to note that our study employed green wood samples, whereas Sharapov’s study utilized dried wood samples. The influence of moisture content can introduce variations in the outcomes, with drilling resistance being more affected below the fibre saturation point [46,52,53]. Our study specifically utilized green wood for testing, as Resi sampling in forestry typically applies to standing trees with green wood above the fibre saturation point.
By establishing correlations between drilling resistance and chip thickness for various wood species, which is usually a laborious and expensive process, we have formulated equations for parameters “a” and “b”. These equations may allow for the adjustment of drilling resistance for any chip thickness, irrespective of the wood species, using the species’ basic density as a key parameter. However, it is essential to exercise caution when applying these findings, as variations may be species-specific, owing to differences between hardwood and softwood’s internal structures. Additional testing is necessary to ensure broader applicability, taking into consideration factors such as wood anatomy [54] and variations in spiral grain [55], and also greater replication within each species. In particular, hardwoods may require further research to fully understand the relationships between basic density and the parameters “a” and “b”, due to their more complex internal structures.

5. Conclusions

Resi sampling conditions—feed speed and RPM—significantly influence density predictions; hence, care is needed when sampling different species or trees with different mean density. We have identified optimal sampling conditions for the major commercial tree species grown in Australia. The use of chip thickness, along with species-specific functions correlating it with amplitude, offers a means for standardizing amplitude values across a range of feed speed and RPM settings, thereby contributing to the robustness of wood quality assessment. Also, we offer a function parameter that will help standardise Resi traces irrespective to tree species, based on basic density values for standing trees.

Author Contributions

Conceptualization, V.G., D.J.L., G.M.D., M.L. and J.J.H.; methodology, V.G., D.J.L., G.M.D., M.L. and J.J.H.; software, V.G., D.J.L. and G.M.D.; formal analysis, V.G.; investigation, V.G., D.J.L., G.M.D., M.L. and J.J.H.; resources, V.G., D.J.L. and G.M.D.; data curation, V.G., D.J.L., G.M.D. and J.J.H.; writing—original draft preparation V.G.; writing—review and editing, V.G., D.J.L., G.M.D., M.L. and J.J.H.; visualization, V.G.; supervision, D.J.L.; project administration, D.J.L.; funding acquisition, D.J.L. All authors have read and agreed to the published version of the manuscript.

Funding

This research was funded by Forestry and Wood Products Australia project “Assessing and managing mid-rotation wood quality in Australian softwood plantations to produce fit-for-purpose logs”. Project number: PNB548-2021.

Data Availability Statement

Data are available from the corresponding author upon reasonable request.

Acknowledgments

HQPlanations and Hurford’s Cypress Mill in Chinchilla in Queensland and Timberlands Pacific in Tasmania provided billets for the measurements. We would like to acknowledge five anonymous reviewers and editors who helped further improve the manuscript.

Conflicts of Interest

Author Geoff M. Downes is employed by the company Forest Quality Pty Ltd. Author Marco Lausberg is employed by the company Wood Quality Consulting. Author Jonathan J. Harrington is employed by the Scion. The remaining authors declare that the research was conducted in the absence of any commercial or financial relationships that could be construed as a potential conflict of interest. The companies Forest Quality Pty Ltd., Wood Quality Consulting, and Scion had no role in the design of the study; in the collection, analyses, or interpretation of data; in the writing of the manuscript, or in the decision to publish the results.

References

  1. Gunes, B.; Karatosun, S.; Gunes, O. Drilling resistance testing combined with SonReb methods for nondestructive estimation of concrete strength. Constr. Build. Mater. 2023, 362, 129700. [Google Scholar] [CrossRef]
  2. Felicetti, R. The drilling resistance test for the assessment of fire damaged concrete. Cem. Concr. Compos. 2006, 28, 321–329. [Google Scholar] [CrossRef]
  3. Rinn, F. Basics of micro-resistance drilling for timber inspection. Holztechnologie 2012, 53, 24–29. [Google Scholar]
  4. Lear, G.; Kasal, B.; Anthony, R. Resistance Drilling. In In Situ Assessment of Structural Timber. RILEM State of the Art Reports; Kasal, B., Tannert, T., Eds.; Springer: Dordrecht, The Netherlands, 2010; Volume 7, pp. 51–57. [Google Scholar] [CrossRef]
  5. IML—Instrumenta Mechanik Labor System GmbH. Measured Variables of the IML-RESI PowerDrill® Drill Resistance and Feed Force Measurement; IML—Instrumenta Mechanik Labor System GmbH: Wiesloch, Germany, 2022. [Google Scholar]
  6. Rinntech. Technology and Know-How for Inspecting Trees and Forests, Timber and Structures, Wood and Tree-Rings. RESISTOGRAPH® 6th Generation of Our Portable Resistance Drills Since 1986. 2023. Available online: http://www.rinntech.de/images/stories/PDF/RINNTECH_RESISTOGRAPH_650_Info.pdf (accessed on 22 September 2023).
  7. Schimleck, L.; Dahlen, J.; Apiolaza, L.A.; Downes, G.; Emms, G.; Evans, R.; Moore, J.; Pâques, L.; Van den Bulcke, J.; Wang, X. Non-destructive evaluation techniques and what they tell us about wood property variation. Forests 2019, 10, 728. [Google Scholar] [CrossRef]
  8. Downes, G.M.; Lausberg, M.; Potts, B.; Pilbeam, D.; Bird, M.; Bradshaw, B. Application of the IML Resistograph to the infield assessment of basic density in plantation eucalypts. Aust. For. 2018, 81, 177–185. [Google Scholar] [CrossRef]
  9. Gao, S.; Wang, X.; Wiemann, M.C.; Brashaw, B.K.; Ross, R.J.; Wang, L. A critical analysis of methods for rapid and nondestructive determination of wood density in standing trees. Ann. For. Sci. 2017, 74, 27. [Google Scholar] [CrossRef]
  10. Bailleres, H.; Lee, D.J.; Kumar, C.; Psaltis, S.; Hopewell, G.; Brancheriau, L. Improving Returns from Southern Pine Plantations through Innovative Resource Characterisation; Forest & Wood Products Australia: Melbourne, VIC, Australia, 2019. [Google Scholar]
  11. Sharapov, E.; Brischke, C.; Militz, H.; Smirnova, E. Prediction of modulus of elasticity in static bending and density of wood at different moisture contents and feed rates by drilling resistance measurements. Eur. J. Wood Wood Prod. 2019, 77, 833–842. [Google Scholar] [CrossRef]
  12. Nickolas, H.; Williams, D.; Downes, G.; Harrison, P.; Vaillancourt, R.; Potts, B. Application of resistance drilling to genetic studies of growth, wood basic density and bark thickness in Eucalyptus globulus. Aust. For. 2020, 83, 172–179. [Google Scholar] [CrossRef]
  13. Walker, T.D.; Isik, F.; McKeand, S.E. Genetic Variation in Acoustic Time of Flight and Drill Resistance of Juvenile Wood in a Large Loblolly Pine Breeding Population. For. Sci. 2019, 65, 469–482. [Google Scholar] [CrossRef]
  14. Fundova, I.; Funda, T.; Wu, H.X. Non-destructive wood density assessment of Scots pine (Pinus sylvestris L.) using Resistograph and Pilodyn. PLoS ONE 2018, 13, e0204518. [Google Scholar] [CrossRef]
  15. Gendvilas, V.; Neyland, M.; Rocha-Sepúlveda, M.F.; Downes, G.M.; Hunt, M.; Jacobs, A.; Williams, D.; Vega, M.; O’Reilly-Wapstra, J. Effects of thinning on the longitudinal and radial variation in wood properties of Eucalyptus nitens. For. Int. J. For. Res. 2022, 95, 504–517. [Google Scholar] [CrossRef]
  16. Singh, K.P.; Siregar, I.Z.; Abad, J.I.M.; Karlinasari, L. Non-destructive modeling using a drilling resistance tool to predict wood basic density of standing trees in a eucalypts plantation in North Sumatra, Indonesia. Biodiversitas 2022, 23, 6218–6226. [Google Scholar] [CrossRef]
  17. Tomczak, K.; Tomczak, A.; Jelonek, T. Measuring Radial Variation in Basic Density of Pendulate Oak: Comparing Increment Core Samples with the IML Power Drill. Forests 2022, 13, 589. [Google Scholar] [CrossRef]
  18. Rocha-Sepúlveda, M.F.; Vega, M.; Harrison, P.A.; Joyce, K.; Vaillancourt, R.E.; Potts, B.M. Using ensemble learning to model climate associated variation in wood properties of planted Eucalyptus nitens in north-western Tasmania. New For. 2022, 54, 867–895. [Google Scholar] [CrossRef]
  19. Krajnc, L.; Gričar, J.; Jevšenak, J.; Hafner, P.; Brus, R. Tree rings, wood density and climate–growth relationships of four Douglas-fir provenances in sub-Mediterranean Slovenia. Trees 2023, 37, 449–465. [Google Scholar] [CrossRef]
  20. Rinn, F.; Schweingruber, F.-H.; Schär, E. Resistograph and X-ray density charts of wood. Comparative evaluation of drill resistance profiles and X-ray density charts of different wood species. Holzforsch. Int. J. Biol. Chem. Phys. Technol. Wood 1996, 50, 303–311. [Google Scholar] [CrossRef]
  21. Downes, G.M.; Harrington, J.J.; Drew, D.M.; Lausberg, M.; Muyambo, P.; Watt, D.; Lee, D.J. A Comparison of Radial Wood Property Variation on Pinus radiata between an IML PD-400 ‘Resi’ Instrument and Increment Cores Analysed by SilviScan. Forests 2022, 13, 751. [Google Scholar] [CrossRef]
  22. Gao, S.; Wang, X.; Brashaw, B.K.; Ross, R.J.; Wang, L. Rapid assessment of wood density of standing tree with nondestructive methods—A review. In Proceedings of the 2012 International Conference on Biobase Material Science and Engineering, Changsha, China, 21–23 October 2012. [Google Scholar]
  23. Dumitrescu, T.F.; Pesce, G.L.; Ball, R.J. Optimization of drilling resistance measurement (DRM) user-controlled variables. Mater. Struct. 2017, 50, 243. [Google Scholar] [CrossRef]
  24. Sharapov, E.; Brischke, C.; Militz, H.; Toropov, A. Impact of drill bit feed rate and rotational frequency on the evaluation of wood properties by drilling resistance measurements. Int. Wood Prod. J. 2019, 10, 128–138. [Google Scholar] [CrossRef]
  25. Nutto, L.; Biechele, T. Drilling resistance measurement and the effect of shaft friction–using feed force information for improving decay identification on hard tropical wood. In Proceedings of the 19th International Nondestructive Testing and Evaluation of Wood Symposium, Rio de Janeiro, Brazil, 22–25 September 2015; pp. 154–161. [Google Scholar]
  26. Downes, G.; (Forest Quality Pty. Ltd. Franklin, TAS, Australia). Personal Communication, 2023.
  27. Blank, P.; (IML Australia, Toowoomba, QLD, Australia). Personal Communication, 2023.
  28. Sharapov, E.; Wang, X.; Smirnova, E.; Wacker, J.P. Wear behavior of drill bits in wood drilling resistance measurements. Wood Fiber Sci. 2018, 50, 154–166. [Google Scholar] [CrossRef]
  29. Downes, G.; Watt, D.; Petfield, D.; Lausberg, M.; Harrington, J.; Lee, D. Resi tool wood quality sampling and data management manual. In FWPA Project No PNB548-2021 “Assessing and Managing Mid-Rotation Wood Quality in Australian Softwood Plantations to Produce Fit-for-Purpose Logs”; Subproject 1a; University of the Sunshine Coast: Maroochydore, QLD, Australia, 2021; pp. 1–35. [Google Scholar]
  30. Heinrichs, J.F.; Lassen, L. Improved technique for determining the volume of irregularly shaped wood blocks. For. Prod. J. 1970, 20, 24. [Google Scholar]
  31. AS/NZ 1080.3:2000; Timber—Method of Test—Method 3: Density. Standards Australia: Sydney, NSW, Australia, 2000.
  32. R Core Team. R: A Language and Environment for Statistical Computing; R Foundation for Statistical Computing: Vienna, Austria, 2022. [Google Scholar]
  33. R Core Team. RStudio: Integrated Development for r. Computer Program; RStudio, PBC: Boston, MA, USA, 2022; Available online: http://www.rstudio.com/ (accessed on 1 December 2023).
  34. Allison, R.B.; Wang, X.; Senalik, C.A. Methods for Nondestructive Testing of Urban Trees. Forests 2020, 11, 1341. [Google Scholar] [CrossRef]
  35. Nocetti, M.; Mannucci, M.; Brunetti, M. Automatic assessment of insect degradation depth in structural solid wood elements by drilling resistance measurements. Constr. Build. Mater. 2023, 366, 130273. [Google Scholar] [CrossRef]
  36. Sharapov, E.; Brischke, C.; Militz, H.; Smirnova, E. Effects of white rot and brown rot decay on the drilling resistance measurements in wood. Holzforschung 2018, 72, 905–913. [Google Scholar] [CrossRef]
  37. Sharapov, E.; Brischke, C.; Militz, H. Assessment of Preservative-Treated Wooden Poles Using Drilling-Resistance Measurements. Forests 2020, 11, 20. [Google Scholar] [CrossRef]
  38. Brunetti, M.; Aminti, G.; Vicario, M.; Nocetti, M. Density Estimation by Drilling Resistance Technique to Determine the Dynamic Modulus of Elasticity of Wooden Members in Historic Structures. Forests 2023, 14, 1107. [Google Scholar] [CrossRef]
  39. Nowak, T.P.; Jasieńko, J.; Hamrol-Bielecka, K. In situ assessment of structural timber using the resistance drilling method—Evaluation of usefulness. Constr. Build. Mater. 2016, 102, 403–415. [Google Scholar] [CrossRef]
  40. Zobel, B.J.; Van Buijtenen, J.P. Wood Variation, Its Causes and Control; Springer: Berlin/Heidelberg, Germany, 1989. [Google Scholar] [CrossRef]
  41. Moore, J.R.; Lyon, A.J.; Searles, G.J.; Lehneke, S.A.; Ridley-Ellis, D.J. Within-and between-stand variation in selected properties of Sitka spruce sawn timber in the UK: Implications for segregation and grade recovery. Ann. For. Sci. 2013, 70, 403–415. [Google Scholar] [CrossRef]
  42. Gapare, W.J.; Ivković, M.; Dillon, S.K.; Chen, F.; Evans, R.; Wu, H.X. Genetic parameters and provenance variation of Pinus radiata D. Don. ‘Eldridge collection’ in Australia 2: Wood properties. Tree Genet. Genomes 2012, 8, 895–910. [Google Scholar] [CrossRef]
  43. McGavin, R.L.; Bailleres, H.; Fehrmann, J.; Ozarska, B. Stiffness and density analysis of rotary veneer recovered from six species of Australian plantation hardwoods. BioResources 2015, 10, 6395–6416. [Google Scholar] [CrossRef]
  44. Sharapov, E.; Wang, X.; Smirnova, E. Drill bit friction and its effect on resistance drilling measurements in logs. In Proceedings of the 20th International Nondestructive Testing and Evaluation of Wood Symposium, Madison, WI, USA, 12–15 September 2017; pp. 405–415. [Google Scholar]
  45. Yao, J.; Lu, J.; Ding, X. Investigating the Resistance Expression Method of Wood Resistance Drill Instruments. For. Prod. J. 2023, 73, 231–238. [Google Scholar] [CrossRef]
  46. Sharapov, E.; Brischke, C.; Militz, H.; Smirnova, E. Combined effect of wood moisture content, drill bit rotational speed and feed rate on drilling resistance measurements in Norway spruce (Picea abies (L.) Karst.). Wood Mater. Sci. Eng. 2020, 15, 198–204. [Google Scholar] [CrossRef]
  47. Lachenbruch, B.; Moore, J.R.; Evans, R. Radial Variation in Wood Structure and Function in Woody Plants, and Hypotheses for Its Occurrence. In Size-and Age-Related Changes in Tree Structure and Function; Springer: Berlin/Heidelberg, Germany, 2011; pp. 121–164. [Google Scholar]
  48. Gerhards, C.C. Effect of moisture content and temperature on the mechanical properties of wood: An analysis of immediate effects. Wood Fiber Sci. 1982, 14, 4–36. [Google Scholar]
  49. Pichler, P.; Springer, S.; Leitner, M. Evaluation of wood cutting forces in dry and wet conditions by small-scale chipping tests applying different analysis methods. Wood Mater. Sci. Eng. 2019, 14, 185–190. [Google Scholar] [CrossRef]
  50. Kollmann, F. The Mechanical Properties of Wood of Different Moisture Content within −200 Degrees to +200 Degrees C Temperature Range; National Advisory Committee for Aeronautics Technical Memorandum no. 984; National Advisory Committee for Aeronautics: Washington, DC, USA, 1 September 1941. [Google Scholar]
  51. Barnett, J.R.; Jeronimidis, G. Wood Quality And Its Biological Basis. In Wood Quality and Its Biological Basis; Blackwell Publishing: Oxford, UK, 2003; p. 226. [Google Scholar]
  52. Guedes, T.O.; Moreira da Silva, J.R.; Hein, P.R.G.; Ferreira, S.C. Cutting energy required during the mechanical processing of wood species at different drying stages. Maderas. Cienc. Tecnol. 2020, 22, 477–482. [Google Scholar] [CrossRef]
  53. Johnstone, D.M.; Ades, P.K.; Moore, G.M.; Smith, I.W. Predicting wood decay in eucalypts using an expert system and the IML-Resistograph drill. Arboric. Urban For. 2007, 33, 76. [Google Scholar] [CrossRef]
  54. Arnič, D.; Krajnc, L.; Gričar, J.; Prislan, P. Relationships between wood-anatomical features and resistance drilling density in Norway spruce and European beech. Front. Plant Sci. 2022, 13, 872950. [Google Scholar] [CrossRef]
  55. Sharapov, E.; Brischke, C.; Militz, H. Effect of Grain Direction on Drilling Resistance Measurements in Wood. Int. J. Archit. Herit. 2021, 15, 250–258. [Google Scholar] [CrossRef]
Figure 2. Range of basic densities of 50 mm outerwood blocks and different sampling conditions across the sampled billets and their species. Each plotted value represents the average amplitude over the outer 50 mm and the measured basic density of the corresponding wood sample. Note that each species is represented by a single billet, within an 800 mm longitudinal distance around the breast height of the standing tree. (A) The effect on amplitude of feed speed and RPM. (B) Amplitude and basic density across the sampled billets. (C) Chip thickness vs. amplitude across the billets.
Forests 15 00579 g002
Figure 3. Relationship between mean amplitude, feed speed, and RPM across the billets of commercial species. Dotted line defines the bottom range of optimal sample conditions, and the upper limit on the y-axis is where overloading starts occurring. Each dot represents mean of six replications.
Forests 15 00579 g003
Figure 4. Relationship between chip thickness and drilling resistance amplitude across the billets of six species. Each dot represents mean of six replications.
Forests 15 00579 g004
Figure 5. Relationship between basic density and function parameters “a” and “b”, which are derived from the function y = a·xb as presented in Table 2 and Figure 4.
Forests 15 00579 g005
Table 1. Basic density of 50 mm outerwood blocks across samples within the log, calculated using the water displacement method according to AS/NZS 1080.3:2000 standard. Basic density was calculated as the ratio of oven dry mass (kg) to green volume (m3) [30,31].
BilletMean Outerwood Basic Density (kg m−3)Standard Deviation (kg m−3)Min Basic Density (kg m−3)Max Basic Density (kg m−3)
Spotted Gum77913761802
White Cypress64713618690
Shining Gum60422557660
Southern Pine55416523581
Radiata Pine51214483543
Hoop Pine49311466523
Table 2. Function y = a·xb of the relationship between chip thickness (x) and drilling resistance amplitude (y) across the six billets of Australian commercial species.
BilletsMean Basic
Density (kg/m3)
Function (Drilling Resistance) R2RMSE
Spotted Gum779y = 94.64x0.3720.971.08
White Cypress 647y = 101.88x0.5660.972.38
Shining Gum 604y = 83.20x0.4780.981.64
Radiata Pine 554y = 68.28x0.5710.991.22
Southern Pine512y = 73.41x0.6320.990.84
Hoop Pine493y = 57.97x0.5980.990.80
Disclaimer/Publisher’s Note: The statements, opinions and data contained in all publications are solely those of the individual author(s) and contributor(s) and not of MDPI and/or the editor(s). MDPI and/or the editor(s) disclaim responsibility for any injury to people or property resulting from any ideas, methods, instructions or products referred to in the content.

