Article

Comparison of Different Models to Simulate Forest Fire Spread: A Case Study

1
Key Laboratory of Sustainable Forest Ecosystem Management-Ministry of Education, College of Forestry, Northeast Forestry University, Harbin 150040, China
2
Heilongjiang Forest Protection Research Institute, Harbin 150040, China
3
Key Laboratory of Forest Tree Genetics and Breeding of Liaoning Province, College of Forestry, Shenyang Agricultural University, Shenyang 110866, China
4
Key Laboratory of Forest Protection of National Forestry and Grassland Administration, Ecology and Nature Conservation Institute, Chinese Academy of Forestry, Beijing 100091, China
*
Authors to whom correspondence should be addressed.
These authors contributed equally to this work.
Forests 2024, 15(3), 563; https://doi.org/10.3390/f15030563
Submission received: 4 March 2024 / Revised: 17 March 2024 / Accepted: 17 March 2024 / Published: 20 March 2024
(This article belongs to the Section Natural Hazards and Risk Management)

Abstract

:
With the development of computer technology, forest fire spread simulation using computers has gradually developed. According to the existing research on forest fire spread, the models established in various countries have typical regional characteristics. A fire spread model established in a specific region is only suitable for the local area, and there is still a great deal of uncertainty as to whether or not the established model is suitable for fire spread simulation for the same fuel in other regions. Although many fire spread models have been established, the fuel characteristics applicable to each model, such as the fuel loading, fuel moisture content, combustibility, etc., are not similar. It is necessary to evaluate the applicability of different fuel characteristics to different fire spread models. We combined ground investigation, historical data collection, model improvements, and statistical analysis to establish a multi-model forest fire spread simulation method (FIRER) that shows the burning time, perimeter, burning area, overlap area, and spread rate of fire sites. This method is a large-scale, high-resolution fire growth model based on fire spread in eight directions on a regular 30 m grid. This method could use any one of four different physical models (McArthur, Rothermel, FBP, and Wang Zhengfei (China)) for fire behavior. This method has an option to represent fire breaks from roads, rivers, and fire suppression. We can evaluate which model is more suitable in a specific area. This method was tested on a single historical lightning fire in the Daxing’an Mountains. Different scenarios were tested and compared: using each of the four fire behavior models, with fire breaks on or off, and with a single or suspected double fire ignition location of the historical fire. The results show that the Rothermel model is the best model in the simulation of the Hanma lightning fire; the overlap area is 5694.4 hm2. Meanwhile, the real fire area in FIRER is 5800.9 hm2; both the Kappa and Sørensen values exceed 0.8, providing high accuracy in fire spread simulations. FIRER performs well in the automatic identification of fire break zones and multiple ignited points. Compared with FARSITE, FIRER performs well in predicting accuracy. Compared with BehavePlus, FIRER also has advantages in simulating large-scale fire spread. However, the complex data preparation stage of FIRER means that FIRER still has great room for improvement. This research provides a practical basis for the comparison of the practicability and applicability of various fire spread models and provides more effective practical tools and a scientific basis for decision-making and the management of fighting forest fires.

1. Introduction

The forest ecosystem is one of the most important terrestrial ecosystems in the world and an important part of the global ecosystem. Forests play an important role in maintaining water and soil conditions and regulating the climate [1]. Forest fires are natural or anthropogenically produced disasters in forest ecosystems with strong bursts and high randomness and are extremely difficult to fight. Many forest types have evolved to survive even with high-intensity fires, e.g., the C-3 type a determined by Canadian Forest Fire Behavior Prediction (FBP) and global boreal forests. Despite this, the effects of large, high-intensity fires are unwanted because of the impacts on human safety, infrastructure, property, wildlife habitat, forestry, disruptions, etc., [2,3,4]. Forest fire behavior is a general descriptive term to designate what a fire does, from ignition to extinguishment. Improving our understanding of its behavior helps to improve firefighting efficiency and ensure safety through forecasting the fire behavior of forest fires and prescribed burnings.
At present, a large number of studies have been carried out on forest fire spread [5]. The research methods include the real measurement of fire lines based on planned burning and laboratory simulation combustion; remote sensing via satellites, aircraft, and unmanned aerial vehicles (UAVs); and forest fire spread modeling. Garnica et al. [6] evaluated the effects of wind speed, temperature, humidity, and other environmental factors on fire behavior via prescribed burning and explored the optimal conditions for prescribed burning in Mexican pine and oak forests. Other studies have focused on the mechanisms of fire spread at different wind speeds, moisture contents, slopes, and other conditions [7,8,9,10,11,12] and the statistical analysis of forest fire behavior characteristics based on a large number of burning experiments [13,14,15,16,17]. The advantage of measuring fire behavior characteristics through prescribed burning and laboratory burning experiments is that we can obtain accurate fire behavior data and other factors of fire environments and fuel while approaching fire lines. A limitation is that laboratory burning experiments cannot simulate the complexity of real fires. Dasgupta et al. [18] used Moderate-resolution Imaging Spectroradiometer (MODIS) data to estimate the fuel moisture content and simulated fire spread combined with FARSITE. Mueller et al. [19] monitored the fire spread in prescribed burning using airborne radar and measured the spread rate based on airborne infrared images. Cardil et al. [20] utilized satellite active fire data (Visible Infrared Imaging Radiometer observations) to simulate three fires (USA, 2016; Chile, 2016; and Spain, 2017) by using a convex hull algorithm, thereby opening up a new field for satellite forest fire monitoring. The temporal, spatial, and spectral resolutions in remote sensing monitoring have steadily improved with the developments in technology and equipment [21]. However, satellites cannot monitor successfully because of smoke breaks, and most aircraft and UAVs cannot approach burned areas for accurate measurements because of smoke and strong winds and to avoid interference with aerial fire suppression activities.
Based on physics, combustion, fluid dynamics, and other mechanisms, the forest fire spread simulation program established using computer technology has more advantages in predicting forest fire behavior and in simulating forest fire spread compared with the direct measurement approach of fire lines and indirect measurements based on remote sensing. Fons [22] and Emmons [23] performed a preliminary study on a fire behavior model; McArthur [24] established a fire behavior model based on statistics; the fire behavior prediction system is a subsystem of the Canadian Forest Fire Danger Rating System (CFFDRS) established in Canada [25]; and Rothermel [26] established a semi-physical and semiempirical fire behavior model. With in-depth study, laboratory burning experiments have gradually entered a bottleneck, and most studies are focused on the applicability of Rothermel and other classic fire behavior models to different regions and different mechanisms. As well as the established traditional physical and empirical models, more types of forest fire behavior models have been established, with progress made in their abilities [27]; flame geometry modeling has focused on the effect of the wind on flame characteristics [28]. Based on logistics, the established probabilistic models are based more on the occurrence of extreme fire behavior such as spotting fires and canopy fires [29]. Because of the ability of the meta-cellular automata model to simulate the evolutionary process of complex systems, it is widely used in forest fire spread simulations [30,31,32]. With the in-depth study of machine learning, the algorithms of random forests, neural networks, and support vector machines have performed well in forest fire spread simulations [33,34,35].
With the development of computer technology, forest fire spread simulation using computers has gradually developed. Kourtz and O’Regan [36] first simulated fire spread in no-wind and no-slope conditions using computers. Green et al. developed a landscape simulation system (IGNITE) [37,38]. A Prometheus system was established to simulate the spread of fire lines in Canada using Richards and Bryce’s wave propagation algorithm [39,40]. FARSITE computes wildfire growth and behavior for long time periods under heterogeneous conditions of terrain, fuel, and weather. It uses existing fire behavior models for surface fire spread, crown fire initiation and crown fire spread, postfrontal combustion, and dead fuel moisture [41,42,43,44]. More forest fire spreading software has been developed in recent years, besides Prometheus v6.2.4, BehavePlus v6, FARSITE v4.1, etc., [45]. Stacy et al. [46] evaluated BehavePlus v6 [47], REDapp v6.2.3 (based on FBP) [48], CanFIRE v2.08 [49], and the Crown Fire Initiation and Spread System (CFIS) v4 [50], based on prescribed burning fire behavior characteristics. All four modelling systems produced reasonable rates of spread predictions. Joakuin et al. [51] developed Wildfire analyst (WFA). Santiago et al. [2,52] developed an app version of WFA, which makes it possible to predict forest fire behavior with mobile devices. The accuracy of the app was verified by BehavePlus v6. Paulo et al. [53] developed an application program to guide prescribed burning based on safe fire behavior; the program links the fire environment, fire behavior, fuel consumption, and forest growth. With the improvements achieved in the ability of computer-simulated human-learning behavior, machine learning and neural networks have been gradually applied to forest fire spread simulations [54,55].
According to the existing research on forest fire spread, the models established in various countries have typical regional characteristics. Due to the interaction of different climate types, vegetation types, topographies, and geomorphologies, fuel characteristics such as the loading, moisture content, flammability, etc., in different regions are not similar. The established fire spread model in a specific region is only suitable for the local area, and there is still a great deal of uncertainty as to whether or not the established model is suitable for fire spread simulation for the fuel in other regions. Integrating multiple fire spread models into the program and using the same research data to compare different models horizontally can refine the traditional fire spread simulation study. Through comparisons with the real fire data, the established program can help to find out which model is more suitable for the area interacted with, according to the climate and vegetation type.
To evaluate the adaptation of the forest fire spread model suitable for Daxing’an Mountains, we selected four common forest fire spread models (McArthur, Rothermel, FBP [42], and Wang Zhengfei (China)) as the model foundation. We established a method (FIRER) based on multi-model integration, which integrates meteorological data, terrain data, and ground investigation data. We simulated a lightning fire with a known ignition point and firebreaks and evaluated each model in the zonal vegetation of the Larix gmelinii forest in northern China. We can filter the most appropriate model to predict forest fire spread by using FIRER in a specific forest ecosystem. The ecological significance of FIRER is that by using it for fire spread prediction, a reference can be proposed for assessing the effects of fire on animal habitat areas, the forest water quality, and forest regeneration. More importantly, this has implications for reducing the adverse effects of fire disturbance on forest ecosystems. Our study provides a practical basis for the applicability of each fire spread model and provides an effective tool and scientific basis for firefighting and management.

2. Design and Development of FIRER

2.1. Model and Algorithm

The methods for spatial spreading during fire spread are all the same, and, for the purpose of inter-model comparisons, we simply explore how the outputs of the different models differ from the real fire when the four models use the same data; the fire spread algorithms are not deeply investigated in this study.
The model is the basis of establishing a forest fire spread simulation method. As in Behave and Prometheus, traditional software packages are mostly based on a single model in the research area, and comparisons of the accuracy of multiple models in the same area are rare. The method includes four classical fire behavior models: (1) the McArthur model (McA) [24]; (2) the Rothermel model (RoE) [26]; (3) the FBP system [42]; and (4) the Wang Zhengfei model (WZF) [56] from China. The RoE model is summarized on the basis of a large number of prescribed burnings combined with laboratory burning experiments and is the model basis of the BehavePlus v6 software, as well as the model basis of the National Forest Fire Danger Rating System (NFDRS) for predicting fire behavior; the fuel classification is also based on NFDRS. The FBP model is the model basis of Prometheus and is also a subsystem of the CFFDRS for forest fire behavior prediction; the fuel classification is also based on CFFDRS. The McA model is based on a large number of field prescribed-burning experiments and is highly applicable in Australia, and the WZF model is based on a large number of prescribed burnings in the Greater and Lesser Hinggan Ridge and the Sichuan area, and the fuel types used in the model are closely related to the present study. All four models have added corresponding coefficients to predict the spread rate under different wind speeds and slopes, and the four models have no method of predicting the spread direction, which can only rely on the fire spread algorithm. Therefore, RoE, FBP, and McA, which perform well in specific areas, were selected for this study and compared with the local WZF model at the same time.
The advantages and disadvantages of each model are shown in Table 1.
The basic equations of each model are as follows:
(1)
McArthur model [24]:
R = 0.13 × 3.35 W e 0.0897 M + 0.0403 V 0.299 W e ( 1.686 + 0.0403 V ) × ( 30 M ) M 18.8 % 18.8 % M 30
where R is the fire spread rate (km/h); W is the fuel load (t/hm2); e is the natural logarithm; M is the fuel moisture content (%); and V is the average value for wind speed at a 10 m height (m/min).
(2)
Rothermel model [26]:
R = I R ξ   ( 1   + φ w + φ s ) P b ε Q ig
where R is the fire spread rate (ft/min); IR is the reaction intensity (Btu/ft2·min); ξ is the heat transfer flux ratio (non-dimensional); φw is the wind speed coefficient (non-dimensional); φs is the slope coefficient (non-dimensional); ρb is the fuel bulk density (lb/ft3); ε is the effective heating coefficient (non-dimensional); and Qig is the pre ignition heat (Btu/lb).
The related equations are listed in the research of Rothermel [26], and only the basic model form is listed in this study.
(3)
FBP system [42]:
Fuel Type C-1:
R = 0.0788 × I S I 1.888 I S I 20 R = 85 × [ 1 e 0.0378 × ( I S I 12 ) ] I S I > 20
where R is the fire spread rate, and ISI is the initial spread index in the FBP system.
Fuel Type C-2:
R = 112.8 × ( 1 e 0.0323 × I S I ) 1.863
Fuel Type C-3:
R = 100.3 × ( 1 e 0.0509 × I S I ) 3.53
Fuel Type C-6:
R = 8.67 + 145.5 × ( 1 e 0.01689 × I S I ) h < 10 R = 100.3 × ( 1 e 0.0509 × I S I ) 3.53   10 h 20 R = 0.01544 × I S I 2.16 h > 20 , I S I 18 R = 30 × [ 1 e 0.0440 × ( I S I 11 ) ] h > 20 , I S I > 18
Fuel Type D-1:
R = 0.0518 × I S I 1.574 I S I 30 R = 30 × [ 1 e 0.0305 × ( I S I 15 ) ] I S I > 30
Fuel Type O-1:
R = 4.88 × I S I 0.626 × ( C / 100 )   4.364 W  
where C is the proportion of cured or dead fuel (%) and W is the fuel loading (t/hm2).
(4)
Wang Zhengfei model [56]:
R = R 0 K w K s / c o s θ
where R is the fire spread rate (m/min); Kw is the wind speed correction coefficient (non-dimensional); R0 is the initial spread rate with no wind and no slope (m/min); Ks is the correction coefficient of the fuel configuration pattern (non-dimensional); and θ is the average slope in the minimum unit in the fire spread simulation.
These four fire behavior models do not predict the spatial spread but only the value of the average fire spread rate. The uncertainties associated with the different ways of spatializing the fire spread are not investigated here; we concentrate, rather, on the uncertainties linked to the fire behavior models. Therefore, a single spatial spread model is used: the maze algorithm inspired by Sun et al. [57]. It uses raster data, and each raster contains information such as the terrain and fuel. Starting from the ignition point, its eight neighbors are represented as east (E), southeast (SE), south (S), southwest (SW), west (W), northwest (NW), north (N), and northeast (NE). Starting from the E direction clockwise, for each direction, we calculate the cumulative time to that direction if it is less than the extended spread time (the value to identify whether the fire spread in the direction or not), and the direction has no test. If the fire has spread in this direction or the cumulative time is greater than the extended spread time, then the path is recorded further in that direction and put into the stack, and the cumulative time of that pixel is set to the extended spread time. If the accumulation time around an orientation exceeds the extended spread time, then the next orientation is detected by one step back. When all the eight directions around the fire point are detected as above, the spreading detection process is finished. The advantages of the maze algorithm are as follows: (1) it solves the problem of the overlapping boundaries of multiple fire sites, (2) its programming is relatively simple and straightforward to implement, and (3) the calculation durations are also within an acceptable range. Since the maze algorithm cannot predict the length of the calculation time, it cannot see the complete simulation fire site before the calculation is completed.
FIRER considers the influence of the moisture content on the fire spread, and the moisture content prediction model is integrated. We select the delay equilibrium moisture content method to directly estimate the fuel moisture content in hours. We select the Nelson equilibrium moisture content model by Larch [58,59], and the model form is as follows:
E = α + β ln Δ G = α + β ln ( R T / m ln H )
where R is the universal gas constant with a value of 8.314 J·K−1·mol−1T is the temperature (K); H is the relative humidity (%); m is the relative molecular weight of H2O with a value of 18 g·mol−1; and α and β are estimated parameters; the specific parameter estimation method is shown in [60].

2.2. Data

To simulate the fire spread, terrain data, fuel data, and meteorological data need to be compiled. Based on terrain data and burned area data, the topographic map and other data are geo-corrected to obtain accurate vector Geographic Information System (GIS) data. The Digital Elevation Model (DEM) data (resolution 30 m) are downloaded from the Shuttle Radar Topography Mission (SRTM) in Google Earth Engine (GEE). From the DEM data, GIS data, such as the elevation of the research area, the real fire range, the administrative division, and firebreaks such as roads and rivers are extracted, and they are combined with the ignition point obtained from the fire investigation.
The four selected fire behavior models were initially built with different fuel classifications. The National Fire Danger Rating System (NFDRS) and the CFFDRS each have their own unique fuel classification system [61]. The fuel classification system in the NFDRS is mainly based on trees, shrubs, grass, and rainfall. The fuel classification system in the CFFDRS is mainly based on the dominant population and forest age.
Kriging is a geostatistical interpolation method based on the spatial covariance of the data and has been shown to perform well in meteorological data estimation [62]. Meteorological data, such as wind speed (m/s), wind direction (360°), air temperature (°C), relative humidity (%), rainfall in the past hour (mm), and cloud cover (%) can significantly affect forest fire spread [63]. We use Kriging to downscale the meteorological data.

2.3. Function Design

This method has been built in Microsoft Visual Basic. The flowchart is shown in Figure 1, and the method is named FIRER (Forest Fire Spreading Simulator). FIRER’s main window (Figure 2) includes the menu bar, coordinate bar, status bar, burning time designated area, input data indication area, statistical area, and control button area. The user interface includes all the functions of FIRER, including data reading, the spreading simulation, parameter setting, and result saving. The simulation of forest fire spread can be started by setting the fire parameters.
The top of FIRER’s user interface (Figure 2) comprises the start and end time of the fire, and selectable data include elevation maps and the slope, aspect, canopy density, and fuel model. Firebreaks can delay the fire spread, and whether they exist or not has a serious impact on continuous fire spread [64]. According to the terrain data and firefighting situation in the research area, rivers, roads, and artificial fighting in the research area are substituted into the forest fire spread model as forest firebreaks [65]. Because the data accuracy of firebreaks can only include “yes” or “no” and the width and area of firebreaks cannot be accurately obtained, the forest fire spread will be enclosed in the area surrounded by firebreaks once firebreaks are enabled.
Because lightning-ignited forest fires often have multiple ignition points, FIRER supports two ways of entering the ignition coordinates: by entering a list of point coordinates or by multi-selections with the mouse on the map. FIRER can simulate the fire spread shape at different time intervals and mark them with different colors; the spread diagram at the end of spread simulation is saved as a graphic file. The perimeter, area, estimated spread rate, and accuracy evaluation index of the fire simulation are entered into a dedicated database for easy querying.

2.4. Model Evaluation

The Kappa value methodology [66] is used to analyze the consistency between real and simulated burned areas on the basis of the same gridding for the two images. The higher the Kappa value, the higher the consistency level. FIRER uses the Kappa value to test the consistency between the simulated burned area and real burned area. The calculation formula for Kappa is as follows:
K = p o p c 1 p c
where po is the percentage of consistency between the real and simulated fire observations, and pc is the expected value.
Where:
p o = s n
p c = a 1 b 1 + a 0 b 0 n 2
where n represents the grid total pixels; a1 represents the ignition grid pixels for the real fire; a0 stands for the non-ignition-grid pixels for the real fire; b1 stands for the ignition grid pixels in the simulated fire; b0 represents the non-ignition-grid pixels in the simulated fire; and s stands for the number of pixels corresponding to the grid in the real fire and the simulated fire.
The Sørensen value compares the similarity of two samples in ecology. The higher the Sørensen value, the higher the consistency level. The Sørensen value is used to test the consistency between the simulated burned area and the real burned area in FIRER.
S = 2 a 2 a + b + c
where a is the number of pixels corresponding to the grid in the real fire and the simulated fire; b stands for the non-ignition-grid pixels in the simulated fire located in the real fire; and represents the non-ignition-grid pixels in the real fire located in the simulated fire.
Using the same research data, we conducted fire spread simulations under different fire spread models, and based on the fire spread simulation results, we compared the Kappa value and Sørensen value of the four models to quantify the relationship between the fire spread simulation results of the different models and the real fire sites and then screened them to find the model with the closest fire spread results to the actual fire scene, and that model is the suitable fire spread model for the area. With further parameter corrections, the fire spread simulation can be improved.

3. Application Example
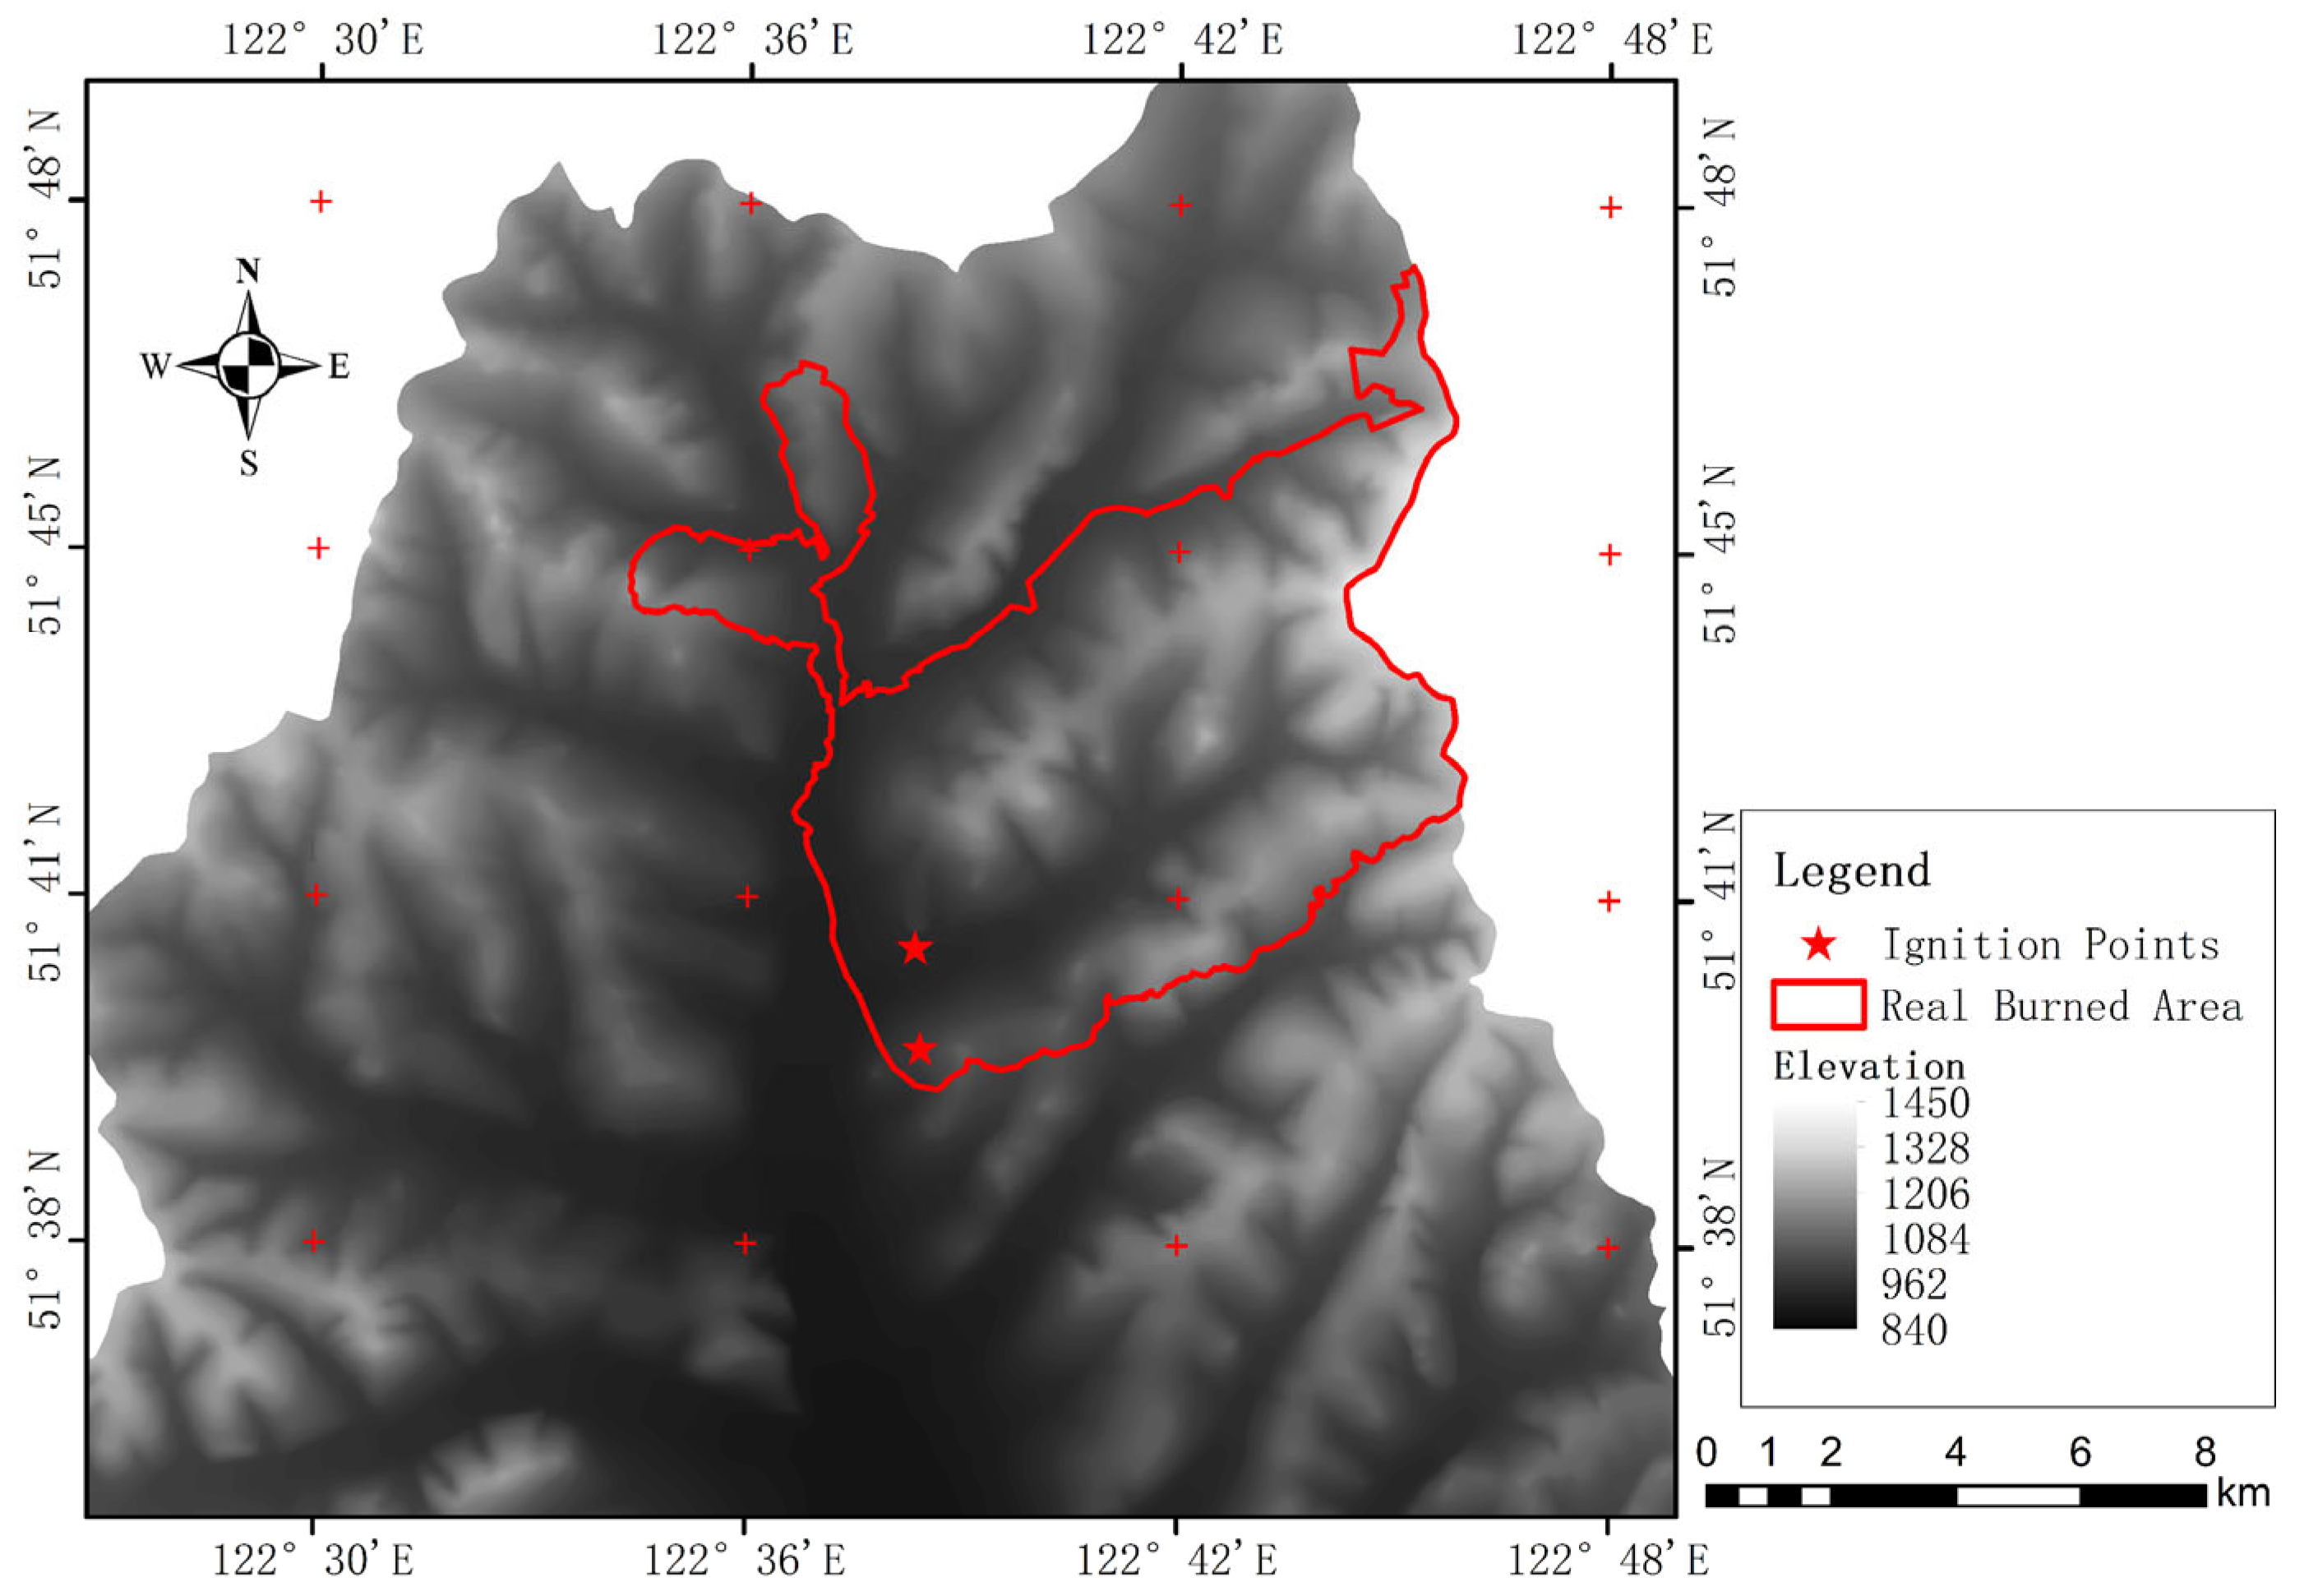
In this study, a lightning forest fire with known ignition points (Hanma, Daxing’an Mountains, China) was selected to verify FIRER’s accuracy. By collecting the vegetation data, elevation data, and real-time meteorological data in the burned area, combined with FIRER, we simulated the lightning fire spread in Hanma and evaluated the method according to the results.

3.1. Research Area

The Hanma National Nature Reserve (51°20′02″–51°49′48″ N, 122°23′34″–122°52′46″ E) is located in the Daxing’an Mountains, Northeast China (Figure 3). The reserve is a total 107,348 hm2 and is sub-divided into a core area of 45,610 hm2, a buffer area of 37,250 hm2, and an experimental area of 23,590 hm2. The forest cover rate in Hanma is 88.4%. The climate type is a cold temperate continental climate, with an annual average temperature of −5.3 °C; the highest temperature is 35.4 °C in summer, and the lowest temperature is −49.6 °C in winter. The average annual rainfall is 450 mm, mainly between July and September (accounting for 70% of the annual rainfall), and the snow depth in winter is approximately 300 mm. The nature reserve is far away from towns and villages, and there are no logging activities there. Firefighting is difficult because there are not enough roads in this area. Once a forest fire occurs, the fire will spread rapidly [67].

3.2. Fire Conditions

A lightning fire occurred in Hanma, Daxing’an Mountains, Inner Mongolia, 19:00, 1 June 2018, and was extinguished by 10:00, 6 June. The burned area in the Daxing’an Mountains, Inner Mongolia was 4500 hm2. The burned area (122°38′27″ E, 51°40′41″ N) was located on the west side of the main ridge of the Daxing’an Mountains, north of the Hanma Nature Reserve. The main tree species exposed to this fire were Larix gmelinii, Pinus sylvestris var. mongolica, and Pinus elliottii. The lack of effective precipitation nearly 20 days before fire occurrence, extremely dry fuel, and changeable wind directions easily led to the rapid spread of the fire lines and burned areas. Rapid surface fires and high-intensity crown fires led to a three-dimensional burning phenomenon. The fire investigation department determined that it was a huge forest fire caused by lightning with a certain ignition point (122°38′24.92″ E, 51°40′42.28″ N) (Figure 4) and a second suspected ignition point (122°38′20.4″ E, 51°41′34.8″ N).

3.3. Fire Simulation Scheme
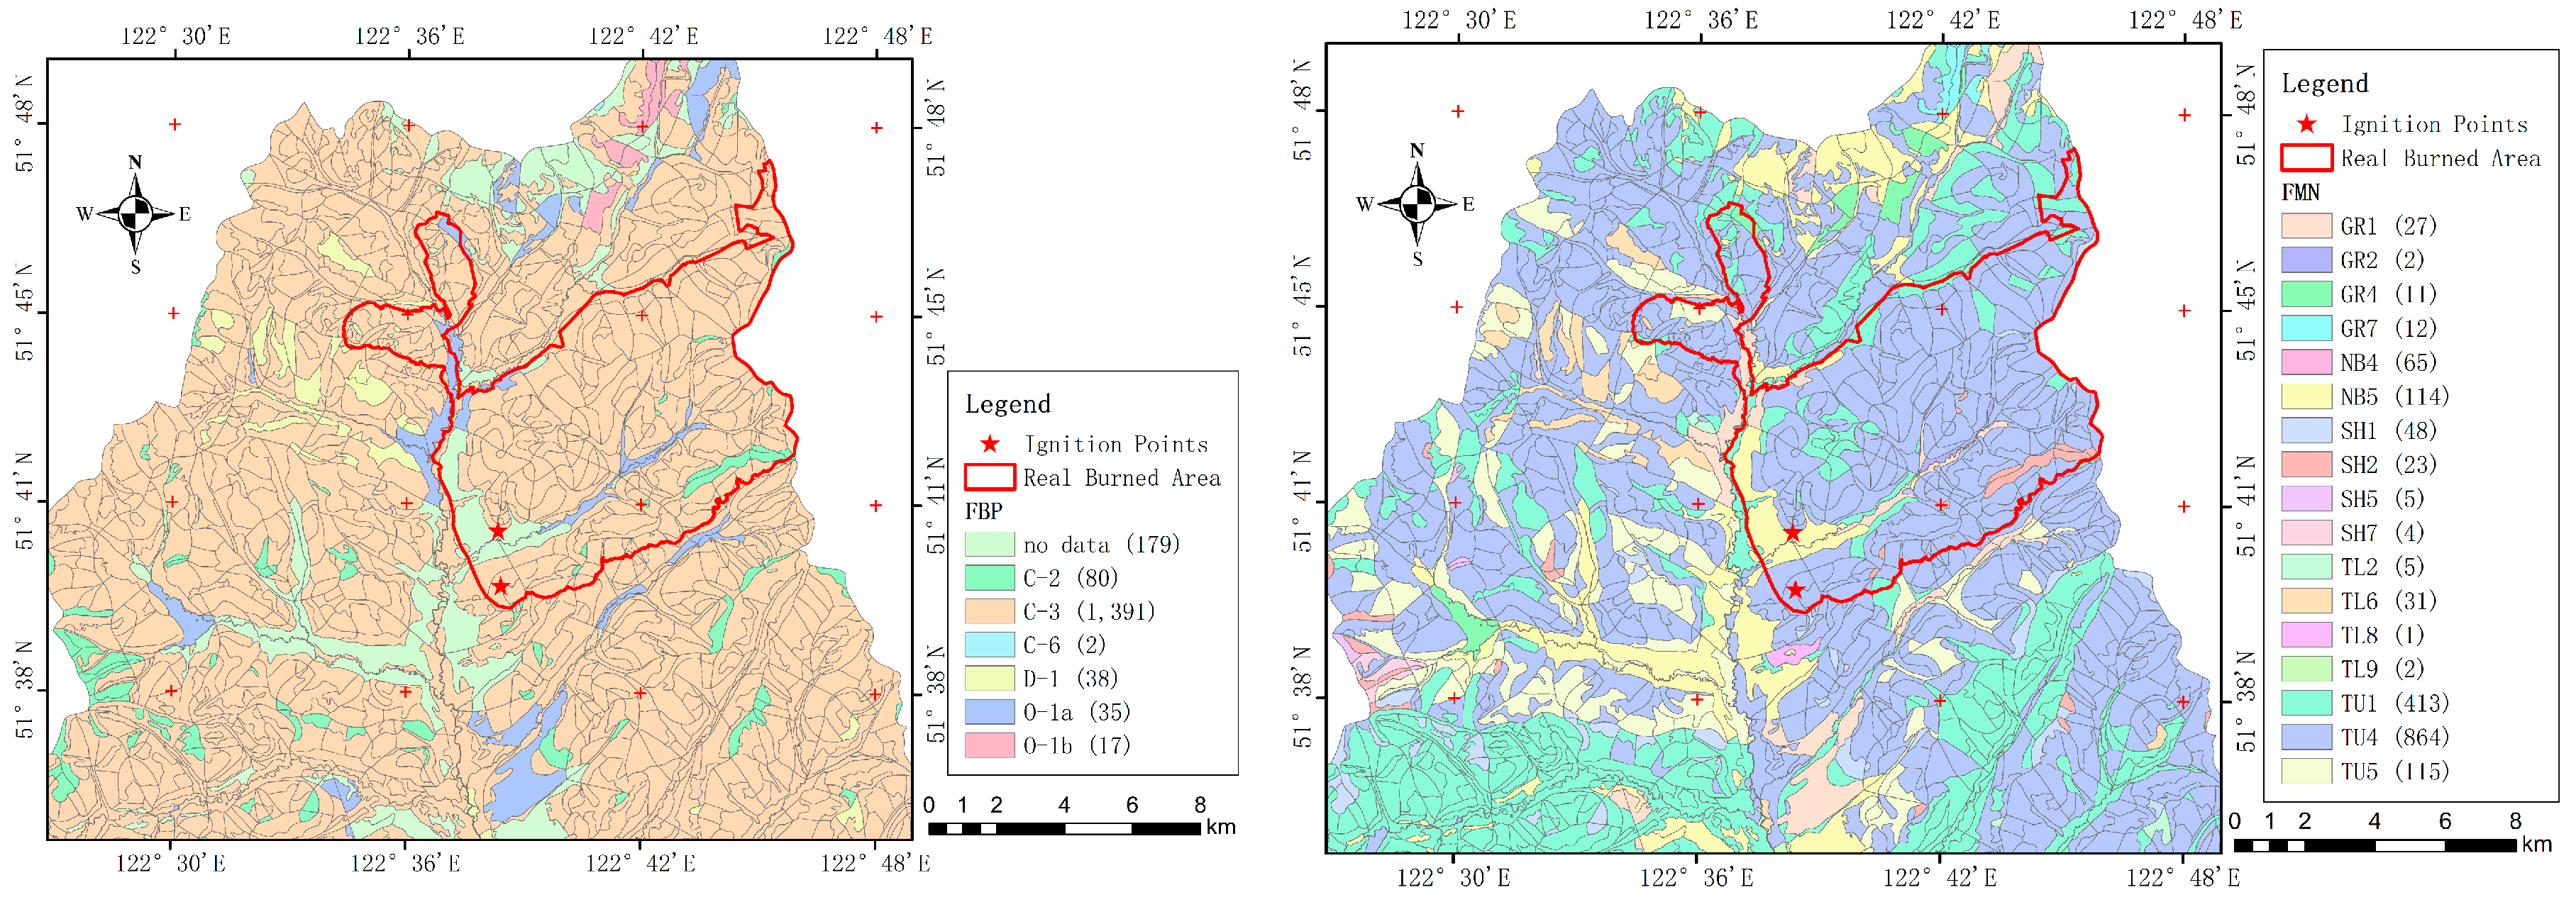
The main purpose of this verification is twofold: (1) to investigate the role of firebreaks in the fire spread simulation and specific fire behavior and (2) to evaluate the plausibility of the second suspected ignition point. Based on the fire investigation data, we selected a certain ignition point as a single ignition point for the simulation. According to the features of lightning fires and the burned area, we suspected that there was another ignition point for the Hanma fire. We set the two ignition points (the suspected ignition point and the definite ignition point for the fire investigation) to simulate the fire spread in the double-ignition-point model. In this study, according to the duration of the Hanma lightning fire (120 h), it was divided into 12 sections (10 h in each section), and 12 levels of coloring were performed to facilitate the observation of the fire spread in the different periods.

3.4. Basic Data

The meteorological data of the Hanma lightning fire (0:00, 1 June 2018–0:00, 6 June) are shown in Figure 5. The wind speed and direction in the research area changed during the fire duration, and the temperature difference and humidity difference between day and night were large, which caused great difficulty for the firefighters.
The terrain data are shown in Figure 6. In the research area, there is a west slope and a south slope, which both have high solar radiation, and the fuel is relatively dry, which creates extremely favorable conditions for fire spread.
According to the fuel type classification system in the NFDRS and CFFDRS, we classify the fuels in the area of interest (Figure 7): TU1, TU4 (NFDRS), and C-3 (CFFDRS) are the dominant fuel types in the Hanma area. The spatial distribution of this fuel type is contiguous. Combined with the dry conditions in the forest and the changeable wind direction, it is easy to form a three-dimensional burning phenomenon dominated by rapid surface fire and high-intensity crown fire.

3.5. Results

Based on the RoE, FBP, MCA, and WZF models and the basic data for the Hanma area, we simulate whether the Hanma lightning fire included firebreaks and single/double-ignition-point conditions to determine the real fire scenario. Only one model result will be output each time the simulation is started. While simulating using other models, the interface of FIRER needs to be initialized.

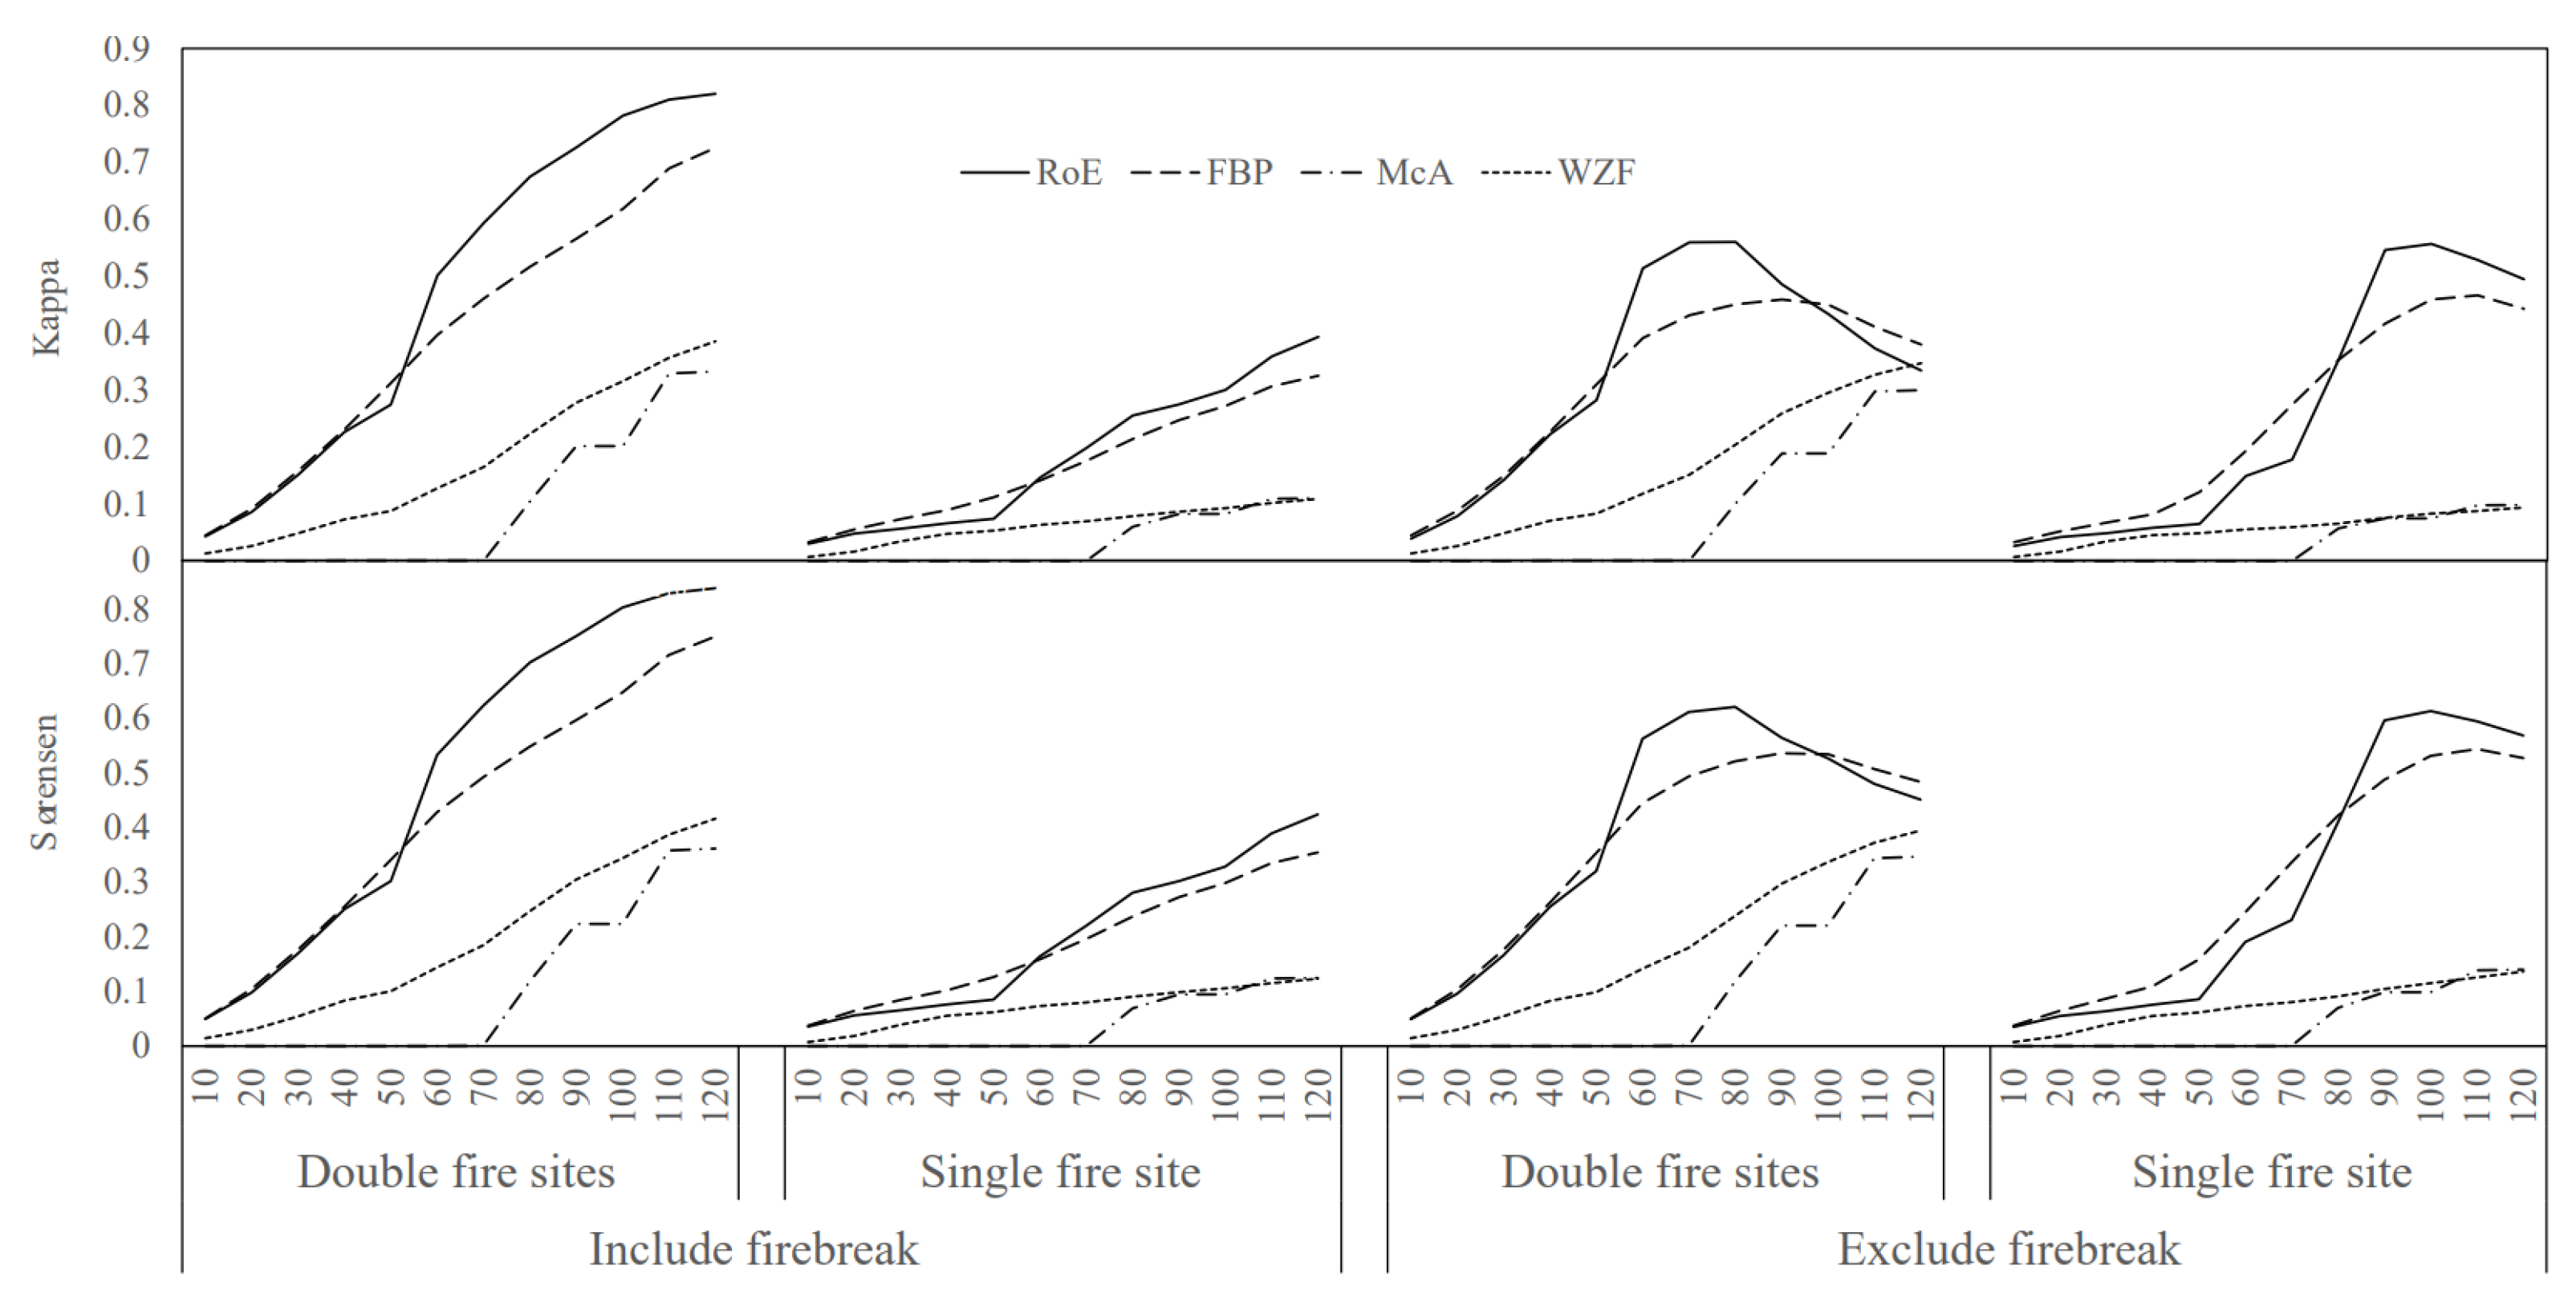
3.5.1. Influence of Fire Scenario on Spread Simulation

The simulation results are shown in Figure 8, where, for each of the four models, the Kappa and Sørensen values are presented separately for a simulation with the inclusion of firebreaks, where we take roads, rivers, and artificial fighting area as firebreaks, and for a simulation without firebreaks, as well as for the ‘single-ignition-point’ scenario and the ‘double-ignition-point’ scenario. The Kappa value and Sørensen value increase gradually in the firebreak scenario. The overlap rates between RoE simulated and FBP simulated and the real burned area are increased in the first period of simulation. They then decrease when entering the firebreak zone, leading to the highest overlap rate of 0.5603 for Kappa. Thus, the simulated fire has reached the range of real fires. In the ‘firebreak exclusion scenario’, the simulated fire will spread out of the real fire area, and the overlap rate will decrease. For the WFZ-simulated and McA-simulated fires, the overlap rate is very similar between the ‘firebreak inclusion scenario’ and the ‘firebreak exclusion scenario’, which may be due to the applicability of the model itself, which leads to a slow fire spread rather than an existing firebreak. The initial spread rates in the scenarios with a ‘double ignition point’ are higher than in the scenarios with a ‘single ignition point’, and the ‘double-ignition-point’ scenarios always appear closer to the real observed fire. The spread rate with a single ignition point is slow, and the time lag is very strong; it does not conform to the real situation of fire spread.
According to the simulated results above, the scenario including firebreaks is more similar to real fires than that excluding firebreaks. The scenario with double ignition points is more similar to a real fire than a single ignition point, and the possibility of the suspected ignition point was confirmed. Above all, we should screen the best model in scenarios with double ignition points and including firebreaks.

3.5.2. Spread Model Comparison in the Fixed Scenario

Focusing now only on the four models with the inclusion of firebreaks and with double ignition points, the additional outputs shown in Table 2 allow a deeper comparison among these four models. The real burned area of 4500 hm2 is less than the simulated area because FIRER only calculates the enclosed area, and the fire investigation data are from the forestland area. From the fire spread simulation results, the burned area simulation results are smaller than the actual burned area of 7780.2 hm2; the RoE spread simulation area is the largest, at 5800 hm2. The FMP simulation’s spread burned area is relatively small. The McA and WZF simulations’ burned area is significantly smaller than that for RoE, less than one-third of the actual fire area. The spread simulation results for the perimeter of the fire site are similar to the area of the fire area. The spread simulation results for the fire perimeter are similar to those of the burned area simulation, the spread simulation results for RoE are closer to the actual fire site, and the spread simulation perimeter for FBP is also close to the actual fire. In addition, although the spread simulation area for WZF is larger than that for McA, its spread simulation perimeter is smaller than that for McA.
Out of the four models, the RoE model exhibits the best results in each index and has good simulation results, with Kappa values and Sørensen values above 0.8. The Rothermel model also shows excellent performance in real-time fire spread simulations. If provided with larger maps for vegetation, terrain, and meteorological data from historical fires, the FIRER application could easily be extended to cover the conditions of all of China.

3.5.3. Extended Analysis of the Optimal RoE-Based Model

The ignition and spread process of the Hanma lightning fire within 120 h is shown in Figure 9. We colored the forest fire spread over 12 h in intervals of 1 h to show the spread process of the Hanma fire.
Table 3 is the quantization of Figure 9. With increasing time, the perimeter and simulated area gradually increase. Although the overlap area with the real fire also gradually reaches the maximum, there is still a large difference compared to the real burned area, and the spread simulation situation is relatively conservative. The overlap area is 5694.4 hm2. Meanwhile, the real fire area in FIRER is 5800.9 hm2; a total of 98.2% of the simulated fire area matched the real fire area. In terms of the spread rate, the trend is not fixed due to the changeable weather conditions. From the increase in each fire spread index, the development trend of the Hanma forest fire was slow in the early stage, increased rapidly from 50 h to 60 h, and then gradually decreased until extinguishment. This trend was consistent with the change in the trend of wind, indicating that the wind speed was an important factor in the fire spread.

4. Discussion

4.1. Forest Fire Spread Model

In our study, compared with other fire spread models, the Rothermel model showed the highest accuracy in its fire spread simulation of Hanma. The reason may be related to the fuel data in each model. The McArthur model performs well on flat and flammable grassland and eucalyptus forests [24]. However, the topography of Hanma is highly undulating, and the typical fuel type is the Larix gmelinii forest low-flammability fuel [68], where the fire spread rate is 0.2~0.6 m·min−1 [69]. The WZF model was established through hundreds of field combustion experiments in the Greater and Lesser Khingan Mountains [70]. Although the fuel data for the WZF model is more similar to the study area, it only considers the height of the surface fuel bed. The WZF model was established on the basis of hundreds of outdoor burning experiments in the Daxing’an Mountains, and although it is more consistent with the study area on the basis of fuel data, its fire spread simulation accuracy is not high because it only considers the height of the surface fuel bed and does not consider the fuel flammability in different forest types. The FBP model focuses on the heterogeneity of fuel types in fire spread [71]. When using the FBP model to classify the fuel type in the study area, 179 sub-compartments could not match the appropriate fuel type in the CFFDRS and were judged as having no data. The fire line could not spread in no-data sub-compartments because there were no fuel data, so the final Kappa coefficient in the FBP model was lower than in the Rothermel model.
The Rothermel model is the basis for BehavePlus v6, FARSITE v4.1, WFA, and other software [51], but BehavePlus underestimates the trends in forest fire spread. The purpose of forest fire prediction is to reduce the loss of forest resources and to ensure the safety of firefighters, and a low estimation of fire behavior is not conducive to this purpose. The same underestimation trend appears in FIRER. In the practical application of fire simulation, we should adhere to the principle of overestimating and not underestimating to minimize casualties. Salis et al. [72] and Acra et al. [73] found that when simulating forest fires in the Mediterranean by FARSITE which is based on Rothermel model, the Kappa value and Sørensen value of the custom fuel model were much higher than when using the standard fuel model (30%–36% in terms of Kappa, 26%–33% in terms of Sørensen). To improve the prediction accuracy of the Rothermel model in specific regions, we should revise the parameters for the fuel model [74]; on the other hand, we can determine which model is more suitable in which regions through more extensive data collection and models that are compared based on more real fires. Moreover, the forest fire backward deduction based on the burning range also brings new ideas to fire spread simulations [52].

4.2. Forest Fire Spread Algorithm

The maze algorithm is used to simulate forest fire spread in our study, and the Kappa coefficient is 0.8208, and the Sørensen coefficient is 0.8386. In Yin et al.’s [75] study, the Kappa coefficient was 0.7398 when using the maze algorithm. The high Kappa coefficient of FIRER may be because it fully considers the flammability of fuel in different forest types, while it only pays attention to the fuel loading of different fuel types. The cellular automata algorithm is a popular algorithm which is well used in fire spread simulation. Although the algorithm has a rapid computational speed [30], in terms of accuracy, it is not superior to the maze algorithm used by FIRER. The Kappa coefficients in related studies are also lower, such as Kappa = 0.74, Hyrcanian, Iran, 2010 in Eskandari [76], and Kappa = 0.6352, Greater Khingan Mountains, China, May 2006, as reported by Rui et al. [77]. Sun et al. [78] modified the cellular automata algorithm adaptively; the Kappa coefficient was 0.6214 when simulating the forest fire in Mianning, Sichuan that occurred in 2020. Judging from the Sørensen value, the results obtained for FIRER using the maze algorithm are not inferior to those obtained using cellular automata [32]. Meanwhile, the cellular automata had advantages in simulating forest fire spread compared to FARSITE using Huygens principle [79]. It can be inferred that FIRER using the maze algorithm is superior to FARSITE using Huygens principle. It can be seen that FIRER has a great advantage in terms of algorithms, both compared to different software for the same algorithm and compared to cellular automata and their adaptive forms.
Although machine learning algorithms such as artificial neural networks have been shown to have advantages over meta-cellular automata for forest fire spread simulations [1], especially in solving complex problems with strong uncertainty [33,34], no study has been able to demonstrate how the maze algorithm differs in accuracy from machine learning algorithms. As machine learning is increasingly being applied to the scientific study of forest fires, this problem may be solved.

4.3. Forest Fire Spread Simulation

Early software could only simulate fire spread under homogeneous fuel [36] and meteorological conditions [37]. With the breakthrough of Rothermel [39] and Rothermel and Bryce [40] for fire spread under heterogeneous conditions, more software capable of simulating fire spread under multiple factor interactions has been develop ed [44]. FIRER can also simulate fire spread under heterogeneous fuel, meteorological, and terrain conditions, similar to FARSITE [42], PiroPinus [53], etc. Although many forest fire management departments have used software such as BehavePlus v6, FIRESTAR [80], and Prometheus v6.0 to predict forest fire spread, they have not used the Kappa coefficient or Sørensen coefficient to evaluate spread simulation accuracy. Jahdi et al. [81] used FARSITE to simulate two fires in summer and autumn in northern Iran in 2010, and the Kappa coefficient was 0.5 when the wind speed was even at 0.8 when the wind coefficient was corrected. We have achieved higher accuracy in fire spread simulations than with wind speed corrections, even with the kriging interpolation of the wind speed only. If complex wind speed coefficient corrections are taken into consideration in future studies, then fire spread simulations will be better. Li et al. [66] showed a recognition accuracy Kappa coefficient of 0.79 when using remote sensing images for the identification of the Hanma fire-burned area, which is lower than that in our study. Although our study found that the Kappa value and Sørensen value in FIRER were higher than other software, the simulated fire area is lower than that of real fire. Jahdi et al. used FARSITE and FlamMap minimum travel time (MTT) to simulate wildfires of the Golestan National Park in Iran; they found that the simulated fire area is significantly higher than the real fire area [82]. This may be the result in the existence of firebreak, which were not set up in other studies. Most of the model foundations in different software packages are based on several popular models, but the basic data in the software are not consistent. Some meteorological data are too average, and some fuel data are only represented by the field investigation. In our study, more detailed processing has been performed for various influencing factors so that FIRER has more advantages than other software.
In contrast to Drury [46], who used four software programs to compare the results of fire spread simulations for different models, in our study, only one program was used to compare the results of fire spread simulations for the same data. Multi-scale prediction has become an important method of predicting the occurrence and spread of forest fires [20]. In the new period of space–aircraft–ground-integrated monitoring of forest fires, the integration of various monitoring methods can meet the basic needs of forest fire prevention. Combined with remote sensing interpretation, field investigation, and other means of carrying out the simulation of forest fires, FIRER has a high degree of accuracy. The disadvantage of FIRER is that a large number of meteorological, fuel, terrain, and other basic data need to be unified, rasterized, and integrated into FIRER, which makes the preparation process tedious. In contrast, the modular fire behavior simulation of BehavePlus is more convenient with regard to data entry [45]; meanwhile, compared with BehavePlus [45] and CFIS [50], FIRER is insufficient in predicting special fire behaviors such as crown fires and spotting fires. Although FIRER can simulate fire spread under multiple ignition points, compared to the model from Monedero et al. [52], which can determine ignition points through backwards fire spread simulation, FIRER can only perform simple analysis in inferring ignition points and cannot be used as a tool for the precise positioning of ignition points. Follow-up research, such as that on spot fires and the width of firebreaks, can be combined with various fire behavior models to realize spot fire predictions. To make FIRER compatible with more data and to realize multi-data fusion, we will study the raster and fine processing of related data and eliminate the tedious process of data format conversion.

4.4. Deficiencies and Prospects of FIRER

In the design and development of FIRER, we consider meteorological data as a whole and ignore the effects of the slope and aspect; however, the occurrence of high-energy fire behaviors, such as spot fires and fire storms, is closely related to the wind speed and direction, and the microclimate in forests plays an important role in fire spread. The mountain microclimate simulation model (MTCLIM) is an excellent microclimate temperature and humidity model [83], and its Excel version is known as MTCLIM-EX. WindNinja [84] software was used to simulate the change in the forest fire wind field. MTCLIM-EX and Windninja can predict another point in meteorological data according to the changes in terrain, vegetation, and meteorological parameters at known points, and the accuracy of the forest fire spread model can be greatly improved by combining the above open source software in follow-up research.
In FIRER, the preliminary data processing needs to convert a large amount of meteorological, vegetation, topographic, and other data into raster data, which requires a lot of preparatory work, for which there is no effective solution at present. A large amount of basic data investigation, deciphering, analyzing, and converting is needed to realize large-scale forest fire spread prediction, and this cumbersome preparatory work limits the expansion of FIRER. In addition, FIRER has limitations in adapting to different environmental variables; it can only input a single meteorological data point, which does not have high fire spread simulation efficiency for regions with complex topography and easy to form microclimates. Meanwhile, the fuel data inputted by FIRER are classified according to the fuel classification methods [25,61] from the NFDRS and CFFDRS, which also causes limitations in terms of predicting other regions.
The Rothermel model for the United States and the FBP model for Canada are certainly excellent forest fire spread models, but in order to establish a forest fire behavior spread simulation system suitable for forest ecosystems in China, the applicability of the model will be reduced without considering the regional characteristics of model use. If we want to solve this problem, we must start from the roots. Both the Rothermel model and the FBP system are based on a large number of basic fuel investigations and field burning experiments, a large number of statistics, and physics [26,42]. Subsequent studies can be combined with FIRER to filter and improve the model based on geographical differences by collecting forest fire data obtained in different forest ecosystems. Furthermore, the fuel classification system, moisture content prediction system, fire weather forecast system, and other modules can be integrated into FIRER to construct an integrated forest fire system. The establishment of FIRER will improve the accuracy of forest fire prediction to realize accurate real-time spread simulation, improve the efficiency of forest firefighting, ensure the personal safety of firefighters, and reduce the loss from forest fires. Otherwise, by coupling information on wildlife habitat areas, forest water quality, and stand growth, we can further explore how fire affects animal migration and the mechanism of fire spread on forest water quality. The spatial heterogeneity is caused by factors such as vegetation and terrain, which means that forest fire spread is also spatially heterogeneous, and this spatial heterogeneity in fire spread causes forest resource loss and forest regeneration patchiness, all of which can be discussed using FIRER combined with the relevant data.
As a scientific research tool, FIRER still needs to be improved in future research. Firstly, it can integrate more types of models, such as physical models, semi-physical models, etc. We will try using forest fire spread algorithms such as random forests and neural networks, and the output results also need to be diversified and visualized. More vegetation types will also be taken into consideration. FIRER, as a forest fire spread simulation tool, is of great significance for forest fire management, especially for firefighting. FIRER can achieve forest fire spread simulation under different time steps, make instant predictions of fire spread, guide the deployment of firefighting forces, and provide early warning of sudden changes in fire behavior such as the fire spread speed, which can effectively improve the efficiency of forest firefighting and reduce casualties among firefighters. FIRER is also of significance for post-fire fuel management. FIRER can predict whether an area is burned and also quantify the spread rate of different burned areas, which we can combine with the fuel data for the area. FIRER can empirically analyze the fuel combustion status and then provide a reference for the fuel management.
Fire is an important and indispensable factor in forest ecosystems. High-intensity fire can destroy stand conditions, while low-intensity fire can promote energy flow and tree growth. By combining the fire spread rate calculated by FIRER with the fuel combustion consumption, the forest fire intensity can be quantified accurately. The precise quantification of the fire disturbance intensity, combined with the fire resistance of different individuals, populations, and communities, can predict the impact of fire on biodiversity and also assess the role of forest fire as a suppressor or facilitator of ecosystems. Accurate quantification of fire disturbance intensity can assess the post-fire recovery process of ecosystems, guide the development of appropriate post-fire forest ecosystem management measures, and provide a reference for ecosystem management.

5. Conclusions

We established a multi-model forest fire spread simulation method (FIRER), which is based on the Rothermel model, FBP system, McArthur model, and Wang Zhengfei model and in which a forest fire can be simulated based on vegetation, terrain, and meteorological data that were compiled using the maze algorithm. The results show the following: (1) FIRER can automatically identify firebreaks and can simulate fire spread in scenarios that include firebreaks; (2) the established multi-ignition point simulation mechanism has a good effect, and the possibility of the existence of suspected ignition points is confirmed through fire simulation; (3) through the comparative analysis of multiple models, the Rothermel model is the best model in the spread simulation of the Hanma lightning fire; (4) through the accurate acquisition of other historical fire data, the model parameters can be further modified to achieve accurate fire spread simulation. This study only focuses on the Hanma lightning fire, and we should collect more data from historical forest fire cases to validate the prediction accuracy of FIRER on special fuel types, such as grassland and burned area reburning, etc. Future studies will access the occurrence probability and diverse fire spread simulations such as canopy fires and underground fires, so that FIRER can be better adapted to different forest fire scenarios and improve the accuracy of forest fire prediction.

Author Contributions

J.N.: formal analysis, data curation, writing—original draft; H.L.: data curation, writing—original draft; W.Y.: investigation, resources; J.D.: data curation; L.S.: writing—review and editing; G.Y.: funding acquisition, writing—review and editing; M.W.: funding acquisition, writing—review and editing; H.Y.: program, funding acquisition. All authors have read and agreed to the published version of the manuscript.

Funding

This work was supported by the National Key Research and Development Program of China (2023YFD2202005), Fundamental Research Funds for the Central Universities (2572023CT01-01), National Natural Science Foundation of China (31700575), National Funded Postdoctoral Program of China (GZC20230398), the Postdoctoral Foundation Program of Heilongjiang (LBH-Z23051), and National Forestry and Grassland Administration of China Key Emergency Science and Technology Program (CAFYBB2021ZB001).

Data Availability Statement

The data that support this study will be shared upon reasonable request to the corresponding author.

Conflicts of Interest

The authors declare no conflict of interest.

References

  1. Wu, Z.C.; Wang, B.; Li, M.Z.; Tian, Y.P.; Quan, Y.; Liu, J.Y. Simulation of forest fire spread based on artificial intelligence. Ecol. Indic. 2022, 136, 108653. [Google Scholar] [CrossRef]
  2. Monedero, S.; Ramirez, J.; Cardil, A. Predicting fire spread and behaviour on the fireline. Wildfire analyst pocket: A mobile app for wildland fire prediction. Ecol. Model. 2019, 392, 103–107. [Google Scholar] [CrossRef]
  3. Morgan, G.W.; Tolhurst, K.G.; Poynter, M.W.; Cooper, N.; McGuffog, T.; Ryan, R.; Wouters, M.A.; Stephens, N.; Black, P.; Sheehan, D.; et al. Prescribed burning in south-eastern Australia: History and future directions. Aust. For. 2020, 83, 4–28. [Google Scholar] [CrossRef]
  4. Piqué, M.; Domènech, R. Effectiveness of mechanical thinning and prescribed burning on fire behavior in Pinus nigra forests in NE Spain. Sci. Total Environ. 2018, 618, 1539–1546. [Google Scholar] [CrossRef] [PubMed]
  5. Monica, D.; Sigfrido, W.; Karina, L. Visualization and modeling of forest fire propagation in Patagonia. Environ. Model. Softw. 2022, 158, 105526. [Google Scholar] [CrossRef]
  6. Garnica, J.G.F.; Carmona, J.X.; Durán, Á.A. Monitoreo del comportamiento del fuego en una quema controlada en un rodal de pino-encino. Rev. Chapingo 2010, 16, 49–59. [Google Scholar] [CrossRef]
  7. Silvani, X.; Morandini, F. Fire spread experiments in the field: Temperature and heat fluxes measurements. Fire Saf. J. 2009, 44, 279–285. [Google Scholar] [CrossRef]
  8. Sullivan, A.L. Wildland surface fire spread modelling, 1990–2007. 1: Physical and quasi-physical models. Int. J. Wildland Fire 2009, 18, 349. [Google Scholar] [CrossRef]
  9. Sullivan, A.L.; Swedosh, W.; Hurley, R.J.; Sharples, J.J.; Hilton, J.E. Investigation of the effects of interactions of intersecting oblique fire lines with and without wind in a combustion wind tunnel. Int. J. Wildland Fire 2019, 28, 704. [Google Scholar] [CrossRef]
  10. Dupuy, J.L.; Maréchal, J. Slope effect on laboratory fire spread: Contribution of radiation and convection to fuel bed preheating. Int. J. Wildland Fire 2011, 20, 289. [Google Scholar] [CrossRef]
  11. Tihay, V.; Morandini, F.; Santoni, P.; Perez-Ramirez, Y.; Barboni, T. Combustion of forest litters under slope conditions: Burning rate, heat release rate, convective and radiant fractions for different loads. Combust. Flame 2014, 161, 3237–3248. [Google Scholar] [CrossRef]
  12. Li, H.; Liu, N.; Xie, X.; Zhang, L.; Yuan, X.; He, Q.; Viegas, D.X. Effect of fuel bed width on upslope fire spread: An experimental study. Fire Technol. 2020, 57, 1063–1076. [Google Scholar] [CrossRef]
  13. Boboulos, M.; Purvis, M.R. Fire behavior of mediterranean pine forest litter assessed in a specifically designed experimental rig. Exp. Tech. 2012, 36, 57–66. [Google Scholar] [CrossRef]
  14. Mulvaney, J.J.; Sullivan, A.L.; Cary, G.J.; Bishop, G.R. Repeatability of free-burning fire experiments using heterogeneous forest fuel beds in a combustion wind tunnel. Int. J. Wildland Fire 2016, 25, 445. [Google Scholar] [CrossRef]
  15. Rossa, C.G.; Fernandes, P.M. Fuel-related fire-behaviour relationships for mixed live and dead fuels burned in the laboratory. Can. J. For. Res. 2017, 47, 883–889. [Google Scholar] [CrossRef]
  16. Xie, X.; Liu, N.; Lei, J.; Shan, Y.; Zhang, L.; Chen, H.; Yuan, X.; Li, H. Upslope fire spread over a pine needle fuel bed in a trench associated with eruptive fire. Proc. Combust. Inst. 2017, 36, 3037–3044. [Google Scholar] [CrossRef]
  17. Yang, Z.; Zhang, H.; Zhang, L.; Chen, H. Experimental Study on Downslope Fire Spread over a Pine Needle Fuel Bed. Fire Technol. 2018, 54, 1487–1503. [Google Scholar] [CrossRef]
  18. Dasgupta, S.; Qu, J.; Hao, X.; Bhoi, S. Evaluating remotely sensed live fuel moisture estimations for fire behavior predictions in Georgia, USA. Remote Sens. Environ. 2007, 108, 138–150. [Google Scholar] [CrossRef]
  19. Mueller, E.V.; Skowronski, N.; Clark, K.; Gallagher, M.; Kremens, R.; Thomas, J.C.; El Houssami, M.; Filkov, A.; Hadden, R.M.; Mell, W.; et al. Utilization of remote sensing techniques for the quantification of fire behavior in two pine stands. Fire Saf. J. 2017, 91, 845–854. [Google Scholar] [CrossRef]
  20. Cardil, A.; Monedero, S.; Ramírez, J.; Silva, C.A. Assessing and reinitializing wildland fire simulations through satellite active fire data. J. Environ. Manag. 2019, 231, 996–1003. [Google Scholar] [CrossRef]
  21. Yang, G.; Ning, J.B.; Shu, L.F.; He, C.; Di, X.Y. Study on the accuracy of forest fire prediction by satellite hot spots in Dax-ing’an Mountains of Heilongjiang, northeastern China. J. Beijing For. Univ. 2017, 39, 1–9. [Google Scholar] [CrossRef]
  22. Fons, W.L. Analysis of Fire Spread in Light Forest Fuels. J. Agric. Res. 1946, 72, 92–121. [Google Scholar]
  23. National Academy of Sciences and National Research Council. Fire Research Abstracts and Reviews; The National Academies Press: Washington, DC, USA, 1963; Volume 5. [Google Scholar] [CrossRef]
  24. McArthur, A.G. Fire Behaviour in Eucalypt Forests; ACT: Canberra, Australia, 1967; p. 107. [Google Scholar]
  25. Van Wagner, C.E. Development and Structure of the Canadian Forest Fire Weather Index System; Forestry Technical Report 35; Canadian Forestry Service, Headquarters: Ottawa, ON, Canada, 1987; 35p. [Google Scholar]
  26. Rothermel, R.C. A Mathematical Model for Predicting Fire Spread in Wildland Fuels; USDA Forest Service General Technical Report 115; USDA Forest Service: Ogden, UT, USA, 1972. [Google Scholar]
  27. Or, D.; Furtak-Cole, E.; Berli, M.; Shillito, R.; Ebrahimian, H.; Vahdat-Aboueshagh, H.; McKenna, S.A. Review of wildfire modeling considering effects on land surfaces. Earth-Sci. Rev. 2023, 245, 104569. [Google Scholar] [CrossRef]
  28. Liu, N.A. Wildland surface fire spread: Mechanism transformation and behavior transition. Fire Saf. J. 2023, 141, 103974. [Google Scholar] [CrossRef]
  29. Perrakis, D.; Cruz, M.; Alexander, M.; Hanes, C.; Thompson, D.; Taylor, S.W.; Stocks, B. Improved logistic models of crown fire probability in Canadian conifer forests. Int. J. Wildland Fire 2023, 32, 1455–1473. [Google Scholar] [CrossRef]
  30. Li, Y.; Wu, G.; Zhang, S.; Li, M.; Nie, B.; Chen, Z. A Novel Method of Modeling Grassland Wildfire Dynamics Based on Cellular Automata: A Case Study in Inner Mongolia, China. ISPRS Int. J. Geo-Inf. 2023, 12, 474. [Google Scholar] [CrossRef]
  31. Corcoran, J.; Higgs, G.; Rohde, D.; Chhetri, P. Investigating the association between weather conditions, calendar events and socio-economic patterns with trends in fire incidence: An Australian case study. J. Geogr. Syst. 2011, 13, 193–226. [Google Scholar] [CrossRef]
  32. Trucchia, A.; D’Andrea, M.; Baghino, F.; Fiorucci, P.; Ferraris, L.; Negro, D.; Gollini, A.; Severino, M. PROPAGATOR: An Operational Cellular-Automata Based Wildfire Simulator. Fire 2020, 3, 26. [Google Scholar] [CrossRef]
  33. Jain, P.; Coogan, S.C.; Subramanian, S.G.; Crowley, M.; Taylor, S.; Flannigan, M.D. A review of machine learning applications in wildfire science and management. Environ. Rev. 2020, 28, 478–505. [Google Scholar] [CrossRef]
  34. Burge, J.; Bonanni, M.R.; Hu, R.L.; Ihme, M. Recurrent Convolutional Deep Neural Networks for Modeling Time-Resolved Wildfire Spread Behavior. Fire Technol. 2023, 59, 3327–3354. [Google Scholar] [CrossRef]
  35. Li, X.; Wang, X.; Sun, S.; Wang, Y.; Li, S.; Li, D. Predicting the Wildland Fire Spread Using a Mixed-Input CNN Model with Both Channel and Spatial Attention Mechanisms. Fire Technol. 2023, 59, 2683–2717. [Google Scholar] [CrossRef]
  36. Kourtz, P.H.; O’Regan, W.G. A model a small forest fire to simulate burned and burning areas for use in a detection model. For. Sci. 1971, 17, 163–169. [Google Scholar]
  37. Green, D.G.; Gill, A.M.; Noble, I.R. Fire shapes and the adequacy of fire-spread models. Ecol. Model. 1983, 20, 33–45. [Google Scholar] [CrossRef]
  38. Green, D.G. Shapes of simulated fires in discrete fuels. Ecol. Model. 1983, 20, 21–32. [Google Scholar] [CrossRef]
  39. Richards, G. A general mathematical framework for modeling Two-Dimensional wildland fire spread. Int. J. Wildland Fire 1995, 5, 63–72. [Google Scholar] [CrossRef]
  40. Richards, G.; Bryce, R. A computer algorithm for simulating the spread of wildland fire perimeters for heterogeneous fuel and meteorological conditions. Int. J. Wildland Fire 1995, 5, 73–79. [Google Scholar] [CrossRef]
  41. Van Wagner, C.E. Conditions for the start and spread of crown fire. Can. J. For. Res. 1977, 7, 23–34. [Google Scholar] [CrossRef]
  42. Alexander, M.E.; Lawson, B.D.; Stocks, B.J.; Van Wagner, C.E. Environment Canada, Canadian Forestry Service; Interim Edition; Northern Forest Research Centre: Edmonton, AB, Canada, 1984. [Google Scholar]
  43. Nelson, R.M., Jr. Prediction of diurnal change in 10-h fuel stick moisture content. Can. J. For. Res. 2000, 30, 1071–1087. [Google Scholar] [CrossRef]
  44. Clark, T.L.; Coen, J.L.; Latham, D.J. Description of a coupled atmosphere–fire model. Int. J. Wildland Fire 2004, 13, 49–63. [Google Scholar] [CrossRef]
  45. Andrews, P.L. Current status and future needs of the BehavePlus Fire Modeling System. Int. J. Wildland Fire 2014, 23, 21–33. [Google Scholar] [CrossRef]
  46. Drury, S.A. Observed versus predicted fire behavior in an Alaskan black spruce forest ecosystem: An experimental fire case study. Fire. Ecol. 2019, 15, 35. [Google Scholar] [CrossRef]
  47. Andrews, P.L.; Bevins, C.D.; Seli, R.C. BehavePlus Fire Modeling System, Version 4.0: User’s Guide; USDA Forest Service General Technical Report RMRS-GTR-106WWW; USDA Forest Service, Rocky Mountain Research Station: Fort Collins, CO, USA, 2008. [Google Scholar] [CrossRef]
  48. McLoughlin, N.R. REDapp—The Universal Fire Behavior Calculator; Version 1.0 User Guide; Government of Alberta: Edmonton, AB, Canada, 2016. [Google Scholar]
  49. de Groot, W.J.; Cantin, A.S.; Flannigan, M.D.; Soja, A.J.; Gowman, L.M.; Newbery, A. A comparison of Canadian and Russian boreal forest fire regimes. For. Ecol. Manag. 2013, 294, 23–34. [Google Scholar] [CrossRef]
  50. Alexander, M.E.; Cruz, M.G.; Lopes, A.M.G. CFIS: A software tool for simulating crown fire initiation and spread. For. Ecol. Manag. 2006, 234, S133. [Google Scholar] [CrossRef]
  51. Ramírez, J.; Monedero, S.; Buckley, D. New approaches in fire simulations analysis with Wildfire Analyst. In Proceedings of the 5th International Wildland Fire Conference, Sun City, South Africa, 9–13 May 2011. [Google Scholar] [CrossRef]
  52. Monedero, S.; Ramirez, J.; Molina-Terrén, D.; Cardil, A. Simulating wildfires backwards in time from the final fire pe-rimeter in point-functional fire models. Environ. Model. Softw. 2017, 92, 163–168. [Google Scholar] [CrossRef]
  53. Fernandes, P.M.; Loureiro, C.; Botelho, H. PiroPinus: A spreadsheet application to guide prescribed burning operations in maritime pine forest. Comput. Electron. Agric. 2012, 81, 58–61. [Google Scholar] [CrossRef]
  54. Chetehouna, K.; Tabach, E.E.; Bouazaoui, L.; Gascoin, N. Predicting the flame characteristics and rate of spread in fires propagating in a bed of Pinus pinaster using Artificial Neural Networks. Process Saf. Environ. 2015, 98, 50–56. [Google Scholar] [CrossRef]
  55. Zhai, C.; Zhang, S.; Cao, Z.; Wang, X. Learning-based prediction of wildfire spread with real-time rate of spread measurement. Combust. Flame 2020, 215, 333–341. [Google Scholar] [CrossRef]
  56. Wang, Z.F. The measurement method of the wildfire initial spread rate. Mt. Res. 1983, 1, 42–51. [Google Scholar]
  57. Sun, P.; Wu, X.P.; Jin, S.; Yu, H.Z.; Zhu, M.; Wang, X.H. Study on a forest fire behavior space simulation system with batch processing capacity. J. Cent. South Univ. For. Technol. 2014, 34, 41–45. [Google Scholar] [CrossRef]
  58. Yu, H.Z.; Jin, S.; Di, X.Y. Prediction models for ground surface fuels moisture content of Larix gmelinii stand in Dax-ing’anling of China based on one-hour time step. Chin. J. Appl. Ecol. 2013, 24, 1565–1571. [Google Scholar] [CrossRef]
  59. Yu, H.Z.; Shu, L.Z.; Yang, G.; Deng, J.F. Comparison of vapour-exchange methods for predicting hourly twig fuel moisture contents of larch and birch stands in the Daxinganling Region, China. Int. J. Wildland Fire 2021, 30, 462–466. [Google Scholar] [CrossRef]
  60. Jin, S.; Li, L. Validation of the method for direct estimation of timelag and equilibrium moisture content of forest fuel. Sci. Silvae Sin. 2010, 46, 95–102. [Google Scholar] [CrossRef]
  61. Elhag, M.; Boteva, S. The Canadian versus the National Forest Fire Danger Rating Systems tested in Mediterranean for-ests fire Crete, Greece. Environ. Dev. Sustain. 2021, 23, 4973–4983. [Google Scholar] [CrossRef]
  62. Jain, P.; Flannigan, M.D. Comparison of methods for spatial interpolation of fire weather in Alberta, Canada. Can. J. For. Res. 2017, 47, 1646–1658. [Google Scholar] [CrossRef]
  63. Simpson, C.C.; Pearce, H.G.; Sturman, A.P.; Zawar-Reza, P. Verification of WRF modelled fire weather in the 2009–2010 New Zealand fire season. Int. J. Wildland Fire 2014, 23, 34–45. [Google Scholar] [CrossRef]
  64. Zong, X.Z.; Tian, X.R.; Wang, X.L. An optimal firebreak design for the boreal forest of China. Sci. Total Environ. 2021, 781, 146822. [Google Scholar] [CrossRef]
  65. Duguy, B.; Alloza, J.A.; Röder, A.; Vallejo, R.; Pastor, F. Modelling the effects of landscape fuel treatments on fire growth and behaviour in a Mediterranean landscape (eastern Spain). Int. J. Wildland Fire 2007, 16, 619–632. [Google Scholar] [CrossRef]
  66. Li, X.T.; Qin, X.L.; Liu, Q.; Liu, S.C. Application of wide data of GF-6 in the identification of forest burned area—Take Hanma Daxing’an Mountains for example. Satell. Appl. 2019, 9, 41–44. [Google Scholar]
  67. Guo, K.; Liu, H.; Bao, H.; Hu, J.; Wang, S.; Zhang, W.; Zhao, Y.; Jiang, G. Habitat selection and their in-terspecific interactions for mammal assemblage in the Greater Khingan Mountains, northeastern China. Wildl. Biol. 2017, 2017, 1–8. [Google Scholar] [CrossRef]
  68. Yang, G.; Ning, J.B.; Shu, L.F.; Zhang, J.L.; Yu, H.Z.; Di, X.Y. Spotting ignition of larch (Larix gmelinii) fuel bed by different firebrands. J. For. Res. 2022, 33, 171–181. [Google Scholar] [CrossRef]
  69. Zong, X.Z.; Tian, X.R. Impacts of fuel treatment on potential fire behavior of main forest types in Daxing’anling. Sci. Silvae Sin. 2021, 57, 139–149. [Google Scholar] [CrossRef]
  70. Wang, Z.F. Current forest fire danger rating system. J. Nat. Disaster 1992, 3, 39–44. [Google Scholar] [CrossRef]
  71. Dupuy JLLawson, B.D.; Stocks, B.J.; Alexander, M.E.; Wagner, C.V. A system for predicting fire behavior in Canadian forests. The 8th National Conference on Fire and Forest Meteorology. Detroit. MI Soc. Am. For. 1985, 1985, 6–16. [Google Scholar]
  72. Salis, M.; Arca, B.; Alcasena, F.J.; Arianoutsou, M.; Bacciu, V.; Duce, P.; Duguy, B.; Koutsias, N.; Mallinis, G.; Mitsopoulos, I.D.; et al. Predicting wildfire spread and behaviour in Mediterranean landscapes. Int. J. Wildland Fire 2016, 25, 1015–1032. [Google Scholar] [CrossRef]
  73. Arca, B.; Duce, P.; Laconi, M.; Pellizzaro, G.; Salis, M.; Spanò, D.P. Evaluation of FARSITE simulator in Mediterranean maquis. Int. J. Wildland Fire 2007, 16, 563–572. [Google Scholar] [CrossRef]
  74. Maréchal, J.; Portier, D.; Valette, J.C. The effects of slope and fuel bed width on laboratory fire behavior. Int. J. Wildland Fire 2011, 20, 272. [Google Scholar] [CrossRef]
  75. Yin, H.; Jin, H.; Zhao, Y.; Fan, Y.G.; Qin, L.W.; Chen, Q.H.; Huang, L.Y.; Jia, X.; Liu, L.; Dai, Y.H.; et al. The Simulation of Surface Fire Spread Based on Rothermel Model in windthrow area of Changbai Mountain (Jilin, China). In Proceedings of the 2nd International Workshop on Advances in Energy Science and Environment Engineering (AESEE 2018) (Advances in Energy Science and Environment Engineering II), Zhuhai, China, 2–4 February 2018; pp. 131–137. [Google Scholar]
  76. Eskandari, S. Application of a CA-based model to predict the fire front in Hyrcanian forests of Iran. Arab. J. Geosci. 2016, 9, 688. [Google Scholar] [CrossRef]
  77. Rui, X.; Hui, S.; Yu, X.T.; Zhang, G.Y.; Wu, B. Forest fire spread simulation algorithm based on cellular automata. Nat. Hazards 2018, 91, 309–319. [Google Scholar] [CrossRef]
  78. Sun, L.; Xu, C.; He, Y.; Zhao, Y.; Xu, Y.; Rui, X.; Xu, H. Adaptive forest fire spread simulation algorithm based on cellular automata. Forests 2021, 12, 1431. [Google Scholar] [CrossRef]
  79. Ghisu, T.; Arca, B.; Pellizzaro, G.; Duce, P. An optimal Cellular Automata algorithm for simulating wildfire spread. Environ. Model. Softw. 2015, 71, 1–14. [Google Scholar] [CrossRef]
  80. Morvan, D.; Méradji, S.; Accary, G. Physical modelling of fire spread in Grasslands. Fire Saf. J. 2008, 44, 50–61. [Google Scholar] [CrossRef]
  81. Jahdi, R.; Darvishsefat, A.A.; Etemad, V.; Mostafavi, M.A. Wind Effect on wildfire and simulation of its spread (Case study: Siahkal Forest in Northern Iran). J. Agric. Sci. Technol. 2014, 5, 1109–1121. [Google Scholar]
  82. Jahdi, R.; Salis, M.; Darvishsefat, A.A.; Alcasena, F.; Mostafavi, M.A.; Etemad, V.; Lozano, O.M.; Spano, D. Evaluating fire modelling systems in recent wildfires of the Golestan National Park, Iran. Forestry 2016, 89, 136–149. [Google Scholar] [CrossRef]
  83. Hungerford, R.D.; Nemani, R.R.; Running, S.W.; Coughlan, J.C. MTCLIM: A Mountain Microclimate Extrapolation Model; Research Paper INT-414; USDA Forest Service: Washington, DC, USA, 1989. [Google Scholar]
  84. Wagenbrenner, N.S.; Forthofer, J.M.; Lamb, B.K.; Shannon, K.S.; Butler, B.W. Downscaling surface wind predictions from numerical weather prediction models in complex terrain with WindNinja. Atmos. Chem. Phys. 2016, 16, 5229–5241. [Google Scholar] [CrossRef]
Figure 1. FIRER design flowchart.
Forests 15 00563 g001
Figure 2. FIRER user interface. ((A) aspect; (B) slope; (C) canopy (D) fuel model RoE).
Forests 15 00563 g002
Figure 3. Location of the experimental stand.
Forests 15 00563 g003
Figure 4. Burned area investigation.
Forests 15 00563 g004
Figure 5. Main meteorological data during the lightning fire spread.
Forests 15 00563 g005
Figure 6. DEM obtained from the SRTM for the real burned area and other areas in Hanma.
Forests 15 00563 g006
Figure 7. Fuel types classified by CFFDRS (left) and NFDRS (right) in real burned area and other areas in Hanma.
Forests 15 00563 g007
Figure 8. FIRER spread simulation results in different scenarios.
Forests 15 00563 g008
Figure 9. Simulated fire in 120 h with 12-level coloring with geographical coordinates and elevation.
Forests 15 00563 g009
Table 1. Features of classic forest fire behavior models.
ModelFeature
McArthurAdvantage: Does well in grassland fires.
Disadvantage: Limited by fuel type and climate.
RothermelAdvantage: Performs complete fire behavior simulation, combining the wind, slope, and other factors.
Disadvantage: Impossible to simulate the dynamic forest fire spread for fixed parameters.
FBPAdvantage: Forecasts fire behavior characteristics and mechanisms accurately combined with the wind and slope, combining methods of statistics.
Disadvantage: Only suitable for Canada and not for other regions due to special fuel types and weather conditions.
Wang ZhengfeiAdvantage: Adds correction coefficients for wind and slope.
Disadvantage: Large error of over 60° for slope.
Table 2. Spread simulation results of four models with double fire sites and firebreaks.
Perimeter/kmArea/hm2Overlap Area/hm2KappaSørensen
Real fire83.97780.2---
RoE86.75800.95694.40.82080.8386
FBP79.84826.24728.00.72570.7501
McA52.11810.11734.60.33250.3617
WZF39.22136.72064.10.38550.4163
Table 3. Parameters from the simulated fire with double fire sites and firebreaks.
Burning Time/hPerimeter/kmArea/hm2Overlap Area/hm2Spread Rate/m·min−1
Real TimeIncreaseReal TimeIncreaseReal TimeIncreaseReal TimeIncrease
1013.9 253.4 200.3 23.1
2016.52.6472.8219.4403.4203.113.7−9.4
3021.85.3801.3328.5728.6325.212.1−1.6
4029.57.71221.4420.11128.9400.312.30.2
5033.33.81493.6272.21399.6270.711.1−1.2
6052.519.22958.61465.02863.81464.214.63.5
7060.58.03663.0704.43567.9704.114.4−0.2
8067.06.54357.9694.94261.4693.514.0−0.4
9073.06.04832.1474.24733.9472.513.5−0.5
10082.29.25383.9551.85285.8551.913.70.2
11084.01.85675.9292.05577.7291.912.7−1.0
12086.72.75800.9125.05694.4116.712.1−0.6
Real fire83.9 7780.2
Disclaimer/Publisher’s Note: The statements, opinions and data contained in all publications are solely those of the individual author(s) and contributor(s) and not of MDPI and/or the editor(s). MDPI and/or the editor(s) disclaim responsibility for any injury to people or property resulting from any ideas, methods, instructions or products referred to in the content.

