Article

Influence of Date Palm-Based Biochar and Compost on Water Retention Properties of Soils with Different Sand Contents

1
Groupe d’Etude sur les Géomatériaux et Environnements Anthropisés (GEGENA UR3795), Université de Reims Champagne-Ardenne, 51100 Reims, France
2
Eremology and Combating Desertification Lab. (LR16IRA01), Institute of Arid Regions, Medenine, Medenine 4100, Tunisia
3
Desertification Research Center (CIDE) (CSIC-UV-GVA), 46113 Moncada, Spain
4
Department of Agricultural Chemistry, Geology and Edaphology, University of Murcia, Campus Espinardo, 30100 Murcia, Spain
5
Laboratoire d’Études et de Recherche sur le Matériau Bois (LERMAB), INRAE, University of Lorraine, 88000 Epinal, France
6
Institute Jean Lamour, University of Lorraine, UMR 7198 CNRS, 54000 Nancy, France
7
Laboratory for Improving Agricultural Production and Protection of Resources in Dry Areas, University of Batna, Batna 05000, Algeria
8
Laboratory of Promoting Innovation in Agriculture in Arid Regions, University of Mohamed Khider, Biskra 07000, Algeria
9
National Institute of Agronomic Research of Algeria, Touggourt 30200, Algeria
10
Department of Soil Science of Athens, Institute of Soil and Water Resources, Hellenic Agricultural Organization DEMETER, 14123 Lykovrisi, Greece
*
Author to whom correspondence should be addressed.
Forests 2024, 15(2), 304; https://doi.org/10.3390/f15020304
Submission received: 12 January 2024 / Revised: 29 January 2024 / Accepted: 3 February 2024 / Published: 5 February 2024

Abstract

:
Generally, soils of arid and semi-arid regions have low water retention properties due to high sand and low organic carbon contents. This study aimed at quantifying the effect of date palm-based organic amendments (OAs) on the water retention properties of two soils (sandy loam and silty loam), as well as the influence of sand supplementation (0.5–2 mm) on the magnitude of the effect of OAs. Different grain size distributions were obtained by adding sand to natural soils. For this purpose, sand was added to the two soils (1/3 and 2/3) and different soil-OA combinations were tested at a dose of 3% by mass: compost alone, biochar alone and a mixture of biochar and compost (50:50 in mass), in addition to unamended control soils. Soil water contents were measured at nine matric potentials ranging from the saturation to the permanent wilting point. Biochar was more efficient than compost at improving soil water retention. The effect of organic amendments on water retention increased with sand content. In most cases, soil water content values were significantly higher for biochar-amended soils than for unamended or compost-amended soils. The weakness of the effect of compost addition (if alone) was probably due to its properties and notably its high mineral content and electrical conductivity. Soil sand supplementation led to higher differences between the OA-amended soils and unamended soils. Changes in available water capacity reached +26% and +80% in a sandy loamy soil enriched with 2/3 sand and amended with compost and with biochar, respectively, compared to the unamended soil. These results show that sand content (and more generally, soil texture) influences the effect of OA application. Thus, the application of biochar from date palm residues in soil seems to be an effective solution to improve the water retention properties of coarse textured soils and contribute to optimizing the use of water resources in irrigated areas.

Graphical Abstract

1. Introduction

In arid and semi-arid areas of North Africa, access to water is often a major challenge due to a lack of rainfall and limited surface water resources. It can be achieved by tapping into underground aquifers of varying depths. To obtain water of satisfactory quality, notably with low salt content, and in sufficient quantity, it is necessary to pump water from deep underground aquifers, such as the North-Western Sahara Aquifer System that spreads below Algeria, Tunisia and Libya [1]. Although the volumes of water in these deep aquifers are significant, they are little renewed [2]. Water from these aquifers must therefore be used efficiently to preserve this scarce resource.
Water is used in particular to irrigate agricultural crops in oases. The main irrigation technique employed is basin irrigation, which involves flooding cultivated plots with water. However, as most soils are sandy, low in organic matter and therefore have low soil water retention (SWR) properties, much of the irrigation water rapidly infiltrates below the soil surface. This induces a risk of contamination of shallow groundwater resources by nutrients, salts or organic or inorganic pesticides, which adds to the risk of soil surface salinization with excessive use of poor-quality irrigation water under a high evaporation climate [3].
One way of improving irrigation efficiency is to enhance the SWR. For that, various studies have shown the influence of organic matter content on increasing this property [4,5]. Panagea et al. [6] studied the impact of soil organic carbon (SOC) changes due to different management strategies on the SWR of loamy soils in long-term experiments in Europe. They did not observe statistically significant differences in the SWR after an increase of 10 g(C).kg−1 (soil). A review by Minasny and McBratney [7], based on 60 published studies and more than 50,000 measurements globally, also estimated the effect of an increase of 10 g(C).kg−1 (soil) from practices favoring the sequestration of SOC (e.g., the application of organic amendments including compost, but not biochar) on soil water retention. They also showed that increasing the SOC has a small effect on soil water content. However, they showed that the increase in water content is more significant for sandy soils. They quantified the increase in field capacity, wilting point and available water capacity (AWC) at 2.33, 0.96 and 1.9 mm (H2O).100 mm−1 (soil), respectively, on average in coarse textured soils. Other innovative organic materials such as biochar have shown promising effects on the physical properties of soils and notably on SWR, with an enhancement of water retention [8,9,10,11]. In a pot experiment, the addition of 2% corn residue biochar improved the soil physical properties of a sandy loam soil from an arid region, and more particularly increased water-stable aggregates and decreased water dispersible clay [12]. However, in the same study, biochar from poultry manure increased the soil sodium adsorption ratio. The literature associates this effect with physico-chemical dispersion and a reduction in soil structural stability [13]. The effects of biochar are highly heterogeneous since its properties depend on both the feedstock and the production conditions, especially the pyrolysis temperature [14,15].
In arid regions of North Africa, oases are the main drivers of the economy. They provide income for the Saharan population, and they are a source of livestock production [16]. Date palm is the main crop in the oases, providing, for instance, between 20% and 60% of the agricultural income of over 1.4 million people in Morocco [17]. El Janati et al. [18] reported that 1 ha of palm grove produces around 2.4 t of dried date palm residues per year. This renewable resource is poorly recovered and mostly abandoned in fields, which can cause insect and disease infestation, or other environmental issues like accidental fires [19]. In recent studies, date palm residues co-composted with sheep manure showed promise for increasing the soil fertility and corn yields in an arid agroecosystem [20]. Nitrogen and phosphorus uptake by silage corn was also enhanced over two growing seasons following a single application, suggesting a long-lasting effect of this compost. The authors also suggested that compost may have positive effects on the plant’s water supply, but this has not been measured.
The influence of the addition of sand on the magnitude of the effect of OAs on soil water retention for a given soil has, however, never been investigated to our knowledge. The objective of the present study was to fill this knowledge gap. For this purpose, semi-arid silt-rich soils from Spain were artificially enriched with coarse sand in different proportions and supplemented with organic amendments (OAs): compost and biochar from date palm residues. Then, to quantify the influence of sand content and OA application, soil water retention measurements were performed at nine matric potential values.

2. Materials and Methods
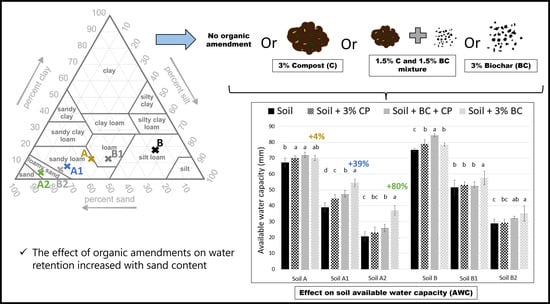
2.1. Studied Soils

In March 2022, the top 20 cm of two soils were sampled in the semi-arid region of Murcia (eastern Spain) where the average annual precipitation rate is only 256 mm year−1. The first was a cultivated sandy loam from Cañada de Gallego (GPS coordinates 37°31′30″ N, 1°24′47″ W; Soil A) and the second was a non-cultivated silty loam from Saladares del Guadalentín (37°50′23″ N, 1°21′39″ W; Soil B). Soil samples were air-dried, sieved through a 2 mm sieve, packaged in plastic boxes and stored at room temperature until use. Soil water retention measurements were then measured with disturbed soils in the laboratory.

2.2. Organic Amendments

The compost was produced in Gabès (Tunisia) by the “Association pour la sauvegarde de l’oasis de Chenini” (ASOC) from a mixture of about two-thirds, by volume, date palm residues (Phoenix dactylifera L.) and one-third sheep manure. The product obtained after 5 months of composting was air-dried and stored at room temperature until the experiments.
Biochar from date palm residues (rachis) collected in the Murcia region was obtained via slow pyrolysis under a constant nitrogen flow at a temperature of 450 °C ± 5 °C at LERMAB (Laboratory for Studies and Research on Wood Materials) in Épinal (Northeast France). The pyrolysis duration was two hours with a temperature rise of 4.9 °C min−1. The biochar was ground in an automatic mortar and then sieved at 1 mm.

2.3. Studied Mixtures

Sand content was artificially increased by supplementing the natural soils with washed quartz sand (grain size distribution in mass: 0.5–1.0 mm: 56%; 1.0–2.0 mm: 44%). Soils A1 and B1 were obtained by adding sand to a final proportion of 2/3 original soil A or B and 1/3 sand (in mass). Soils A2 and B2 were obtained by adding sand to a final proportion of 1/3 original soil A or B and 2/3 sand.
For each soil, three different combinations of OAs were tested at a dose of 3% on a mass basis (equivalent to 72 t ha−1 at a bulk density of 1.2 and 0.2 m soil depth): compost alone (thereafter referred to as X + C), biochar alone (X + BC) and a mixture of compost and biochar (50:50, X + BC + C). Unamended soils were used as controls. In total, 24 conditions were studied (6 soils × 4 treatments).

2.4. Physico-Chemical Analyses

Soil granulometry was determined using Robinson’s pipette method. The organic carbon content of the two original soils and the compost were measured via sulfochromic oxidation [21]. The carbonate content was measured in soils [22]. The cation exchange capacity (CEC) of the soils was measured using the Metson method [23]. Soil and compost pH and electrical conductivity (EC) were measured at a ratio of 10 g of soil to 50 mL of deionized water [24].
The total carbon content of the biochar was measured in the SOCOR company (Dechy, France) via combustion using an elemental analyzer [25]. The mineral content of the OAs was determined after 6 h of heating at 550 °C in a muffle furnace. The potential CEC of biochar was measured after pH adjustment to 7 and washing of samples until EC < 0.2 mS.cm−1 [26]. Biochar pH and EC were determined at a ratio of 5 g of soil to 50 mL of deionized water [27]. The particle size distribution of the compost was determined by sieving with mesh sizes of 4 mm, 2 mm, 1 mm, 0.5 mm and 0.2 mm.
The physisorption of dinitrogen at 77 K was performed on the biochar using Micromeritics ASAP2020 adsorption apparatus. The samples were outgassed for 12 h at 350 °C before analysis. The specific surface area was calculated using the Brunauer-Emmett-Teller (BET) method (completed with the Rouquerol correction).
The preliminary assessment of biochar hydrophobicity was undertaken using the Water Droplet Penetration Time (WDPT) test and a 50 μL pipette. Three drops of water were placed randomly onto a bed of biochar, and the penetration time was recorded. The shortest measurable penetration time was considered to be 1 s [28].

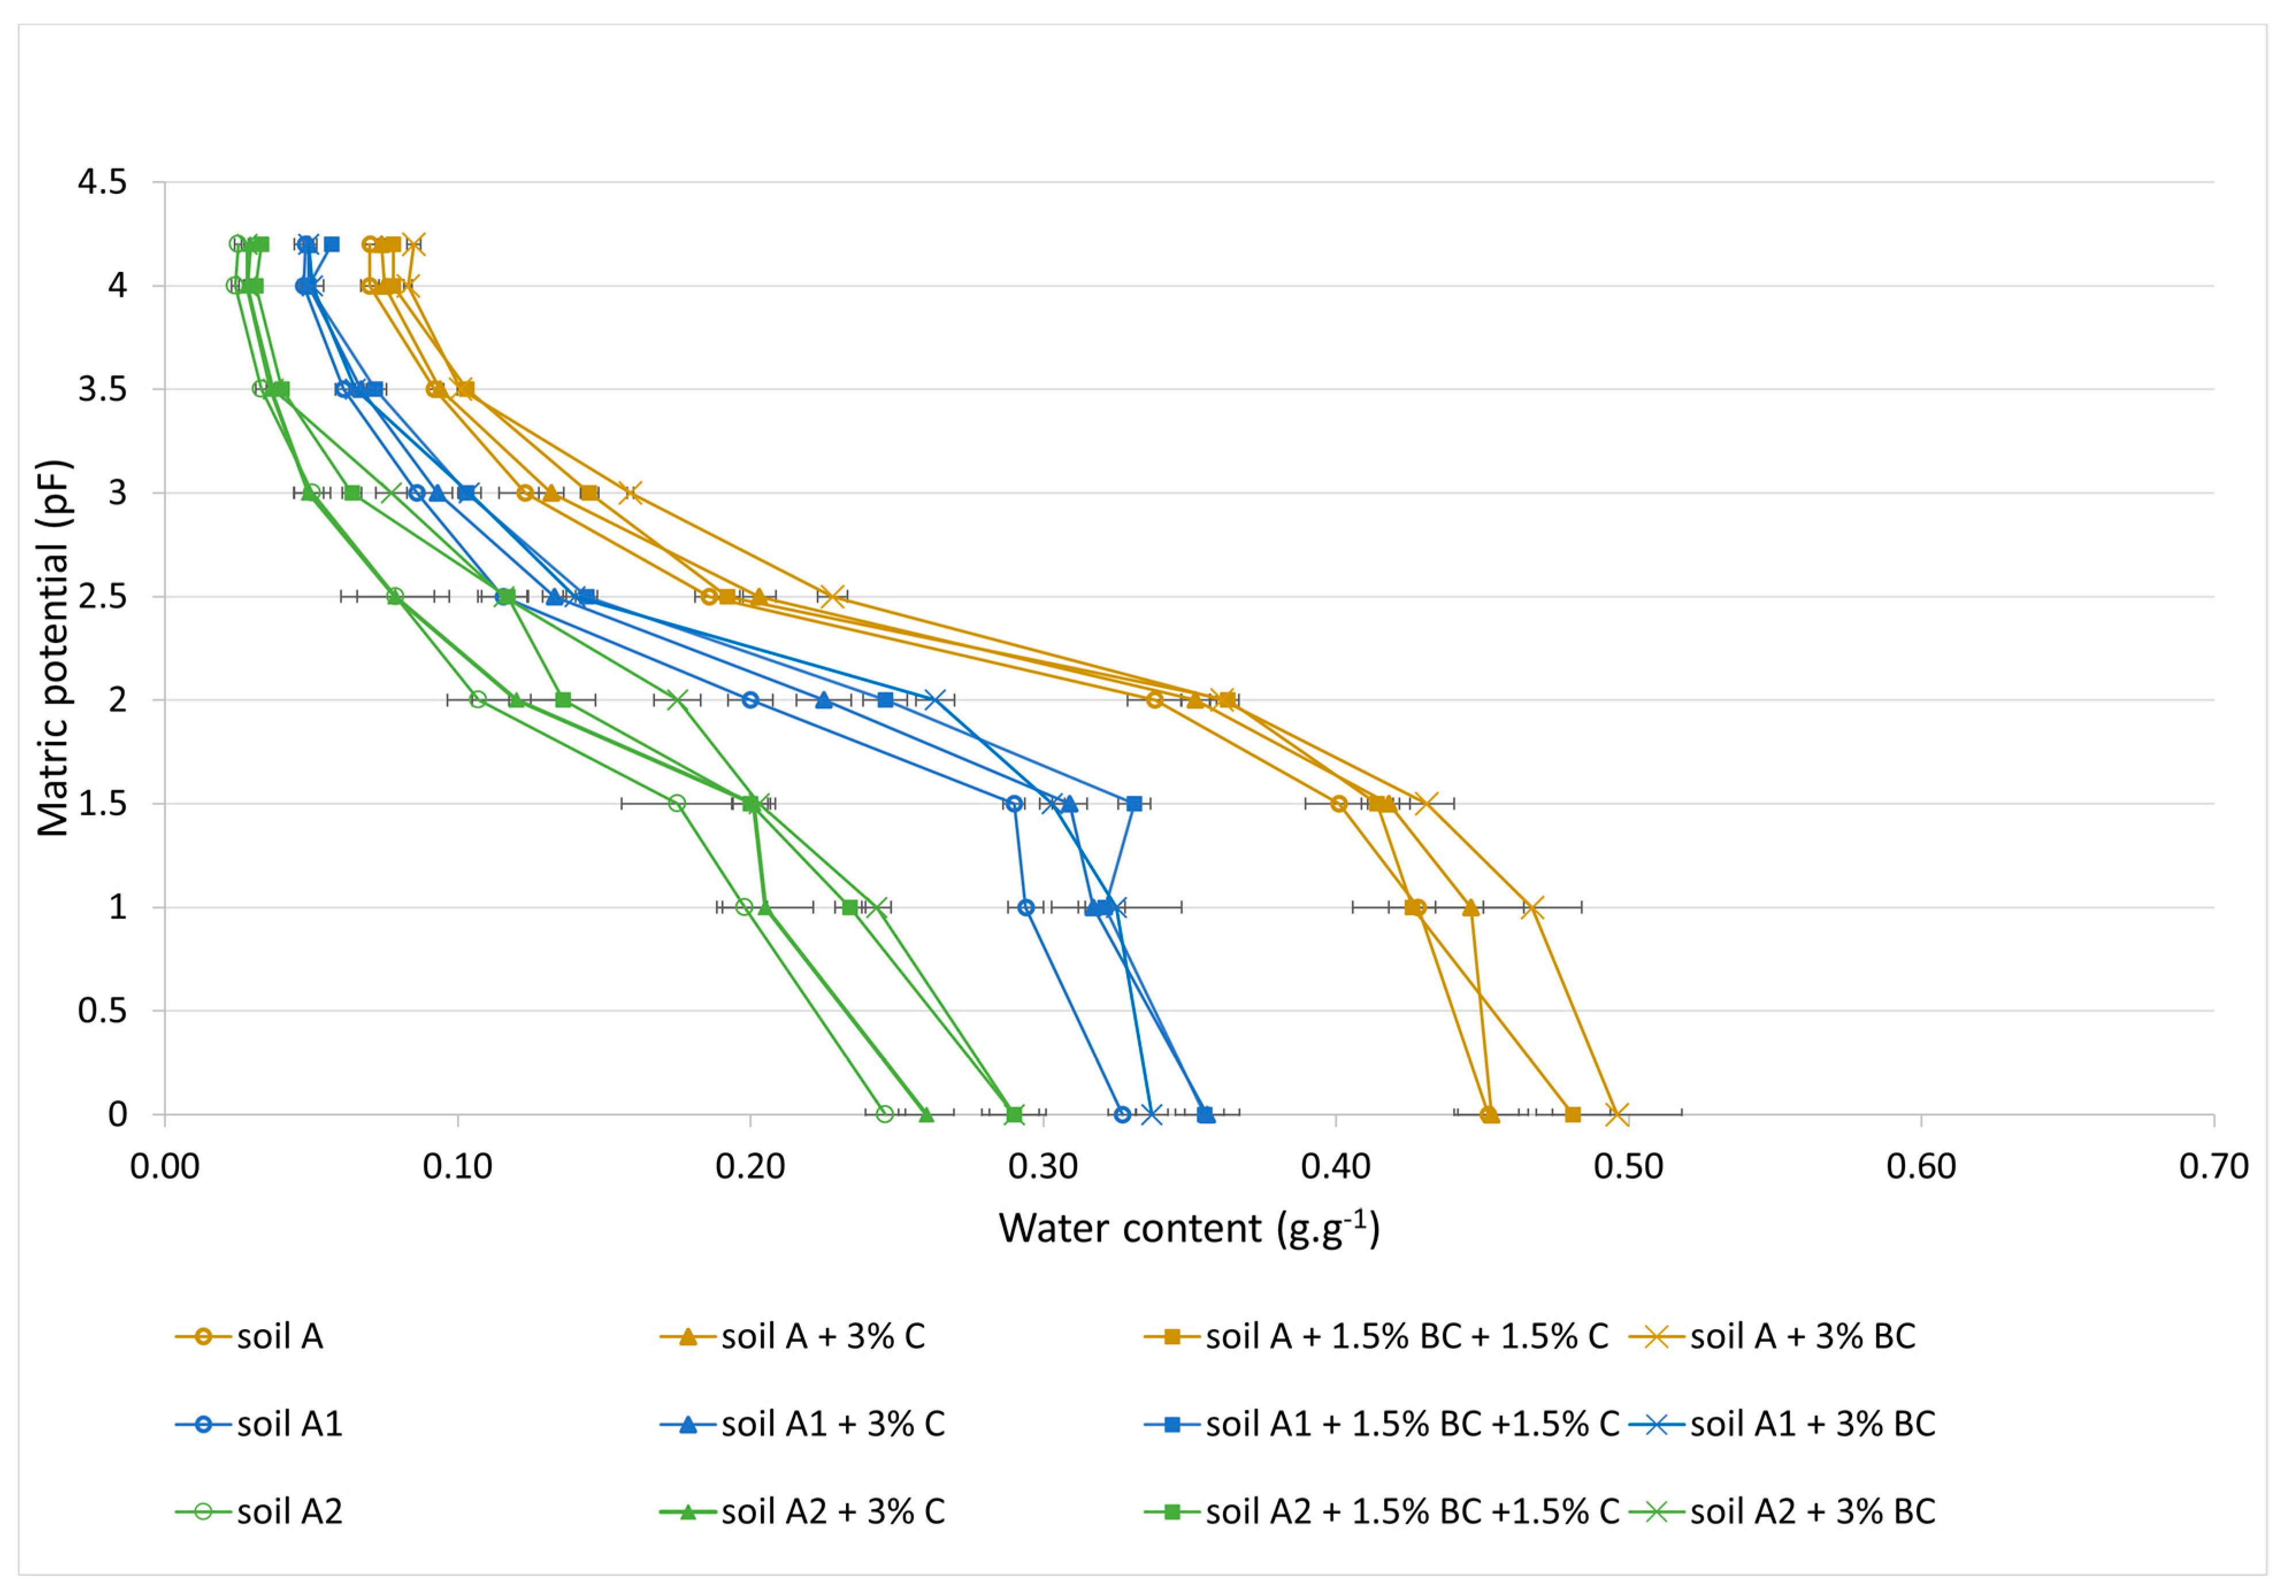
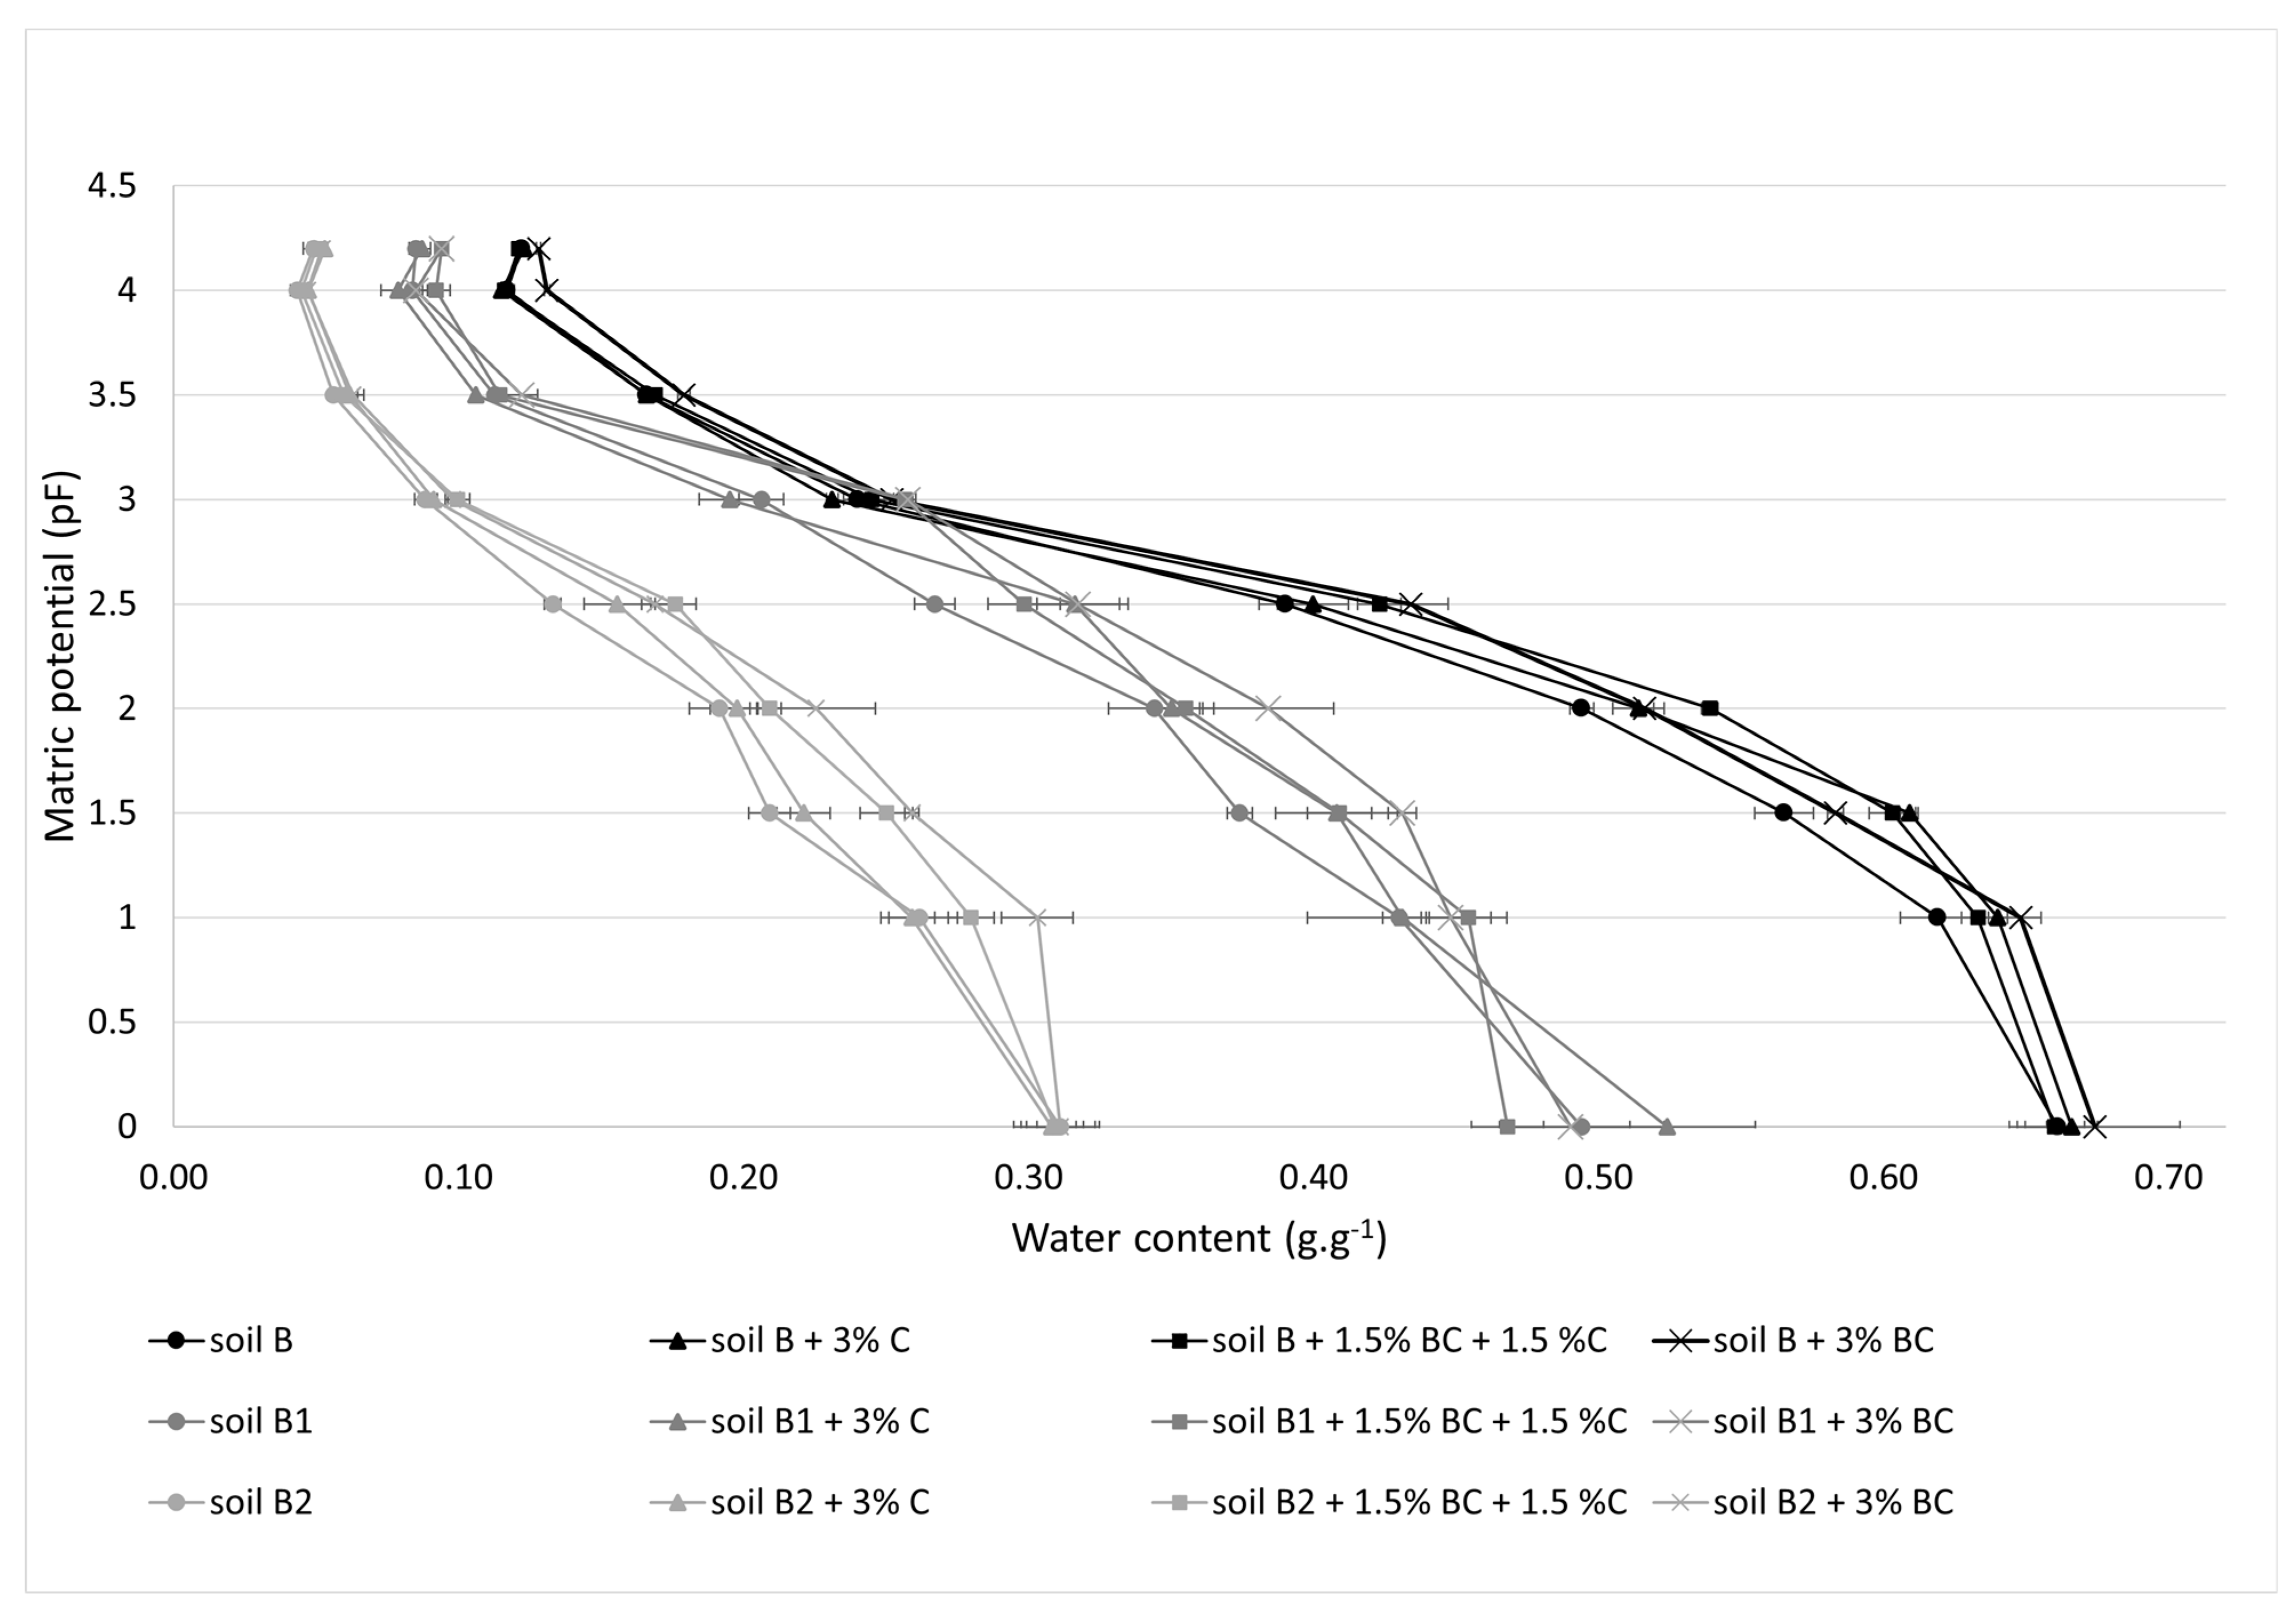
2.5. Water Retention Measurements

The water content was measured using pressure membrane apparatus at nine different matric potentials, ranging from the saturation to the permanent wilting point (pF = 0, 1, 1.5, 2, 2.5, 3, 3.5, 4 and 4.2). A ceramic tension plate was used for all matric potentials. Matric potentials are expressed as pF. The minimum number of SWR measurements was 5 per treatment and for each matric potential.
The mixtures were placed in rubber cylinders of around 21 cm3 (2.6 cm radius and 1 cm height) at the same bulk density as the respective original soils A and B, i.e., 1.26 ± 0.02 g.cm3 and 1.01 ±0.04 g.cm3 respectively. Cylinders containing the samples were saturated on the ceramic tension plate via capillarity using distilled water at atmospheric pressure for approximately 1 h before hermetically sealing the apparatus, applying the pressure corresponding to the matric potential and waiting for 7 days for equilibration. The soils were then weighed using a precision balance and dried at 105 °C for 48 h. For soil saturation measurements (pF = 0), after complete saturation, the soils were directly weighed. The soil water content was calculated by subtracting the soil mass before and after drying.
The available water capacity (AWC) was calculated using the following equation:
AWC = (WFC − WPWP) × Bulk density × h
where:
  • WFC is the mass water content at field capacity (pF = 2.0),
  • WPWP is the mass water content at the permanent wilting point (pF = 4.2),
  • h is the depth of the soil horizon considered (0–20 cm).

2.6. Statistical Analyses

Water contents were expressed as the mean value ± SD (standard deviation) of 5 replicate samples at each matric potential. Three-way analysis of variance (ANOVA) tests were carried out using R 4.3.0 statistical software [29] to test for interactive effects of soil type, sand addition and organic amendments on AWC.
The different mixtures were compared to their respective control (unamended) soil. One-way ANOVA was performed to assess the response of the SWR to the addition of organic amendments. Tukey’s HSD test (α = 5%) was applied to separate the means.

3. Results and Discussion

3.1. Physico-Chemical Properties of the Soils and Organic Amendments

The natural soils studied differed notably by their textures, soil A having a higher sand content than soil B (Table 1). Soils A and B were both alkaline and relatively poor in organic carbon. EC was 4.0 mS.cm−1 in soil A, implying that this soil contained a relatively high soluble salt content. Soil B was moderately saline with an EC value of 2.5 mS.cm−1. The CEC of soil B was low but slightly higher than that of soil A, likely due to its higher clay content. After sand supplementation, soil sand contents ranged from 18.4% (silty loam, soil B) to 84.5% (loamy sand, soil A2). The soils classified from the finest to the coarsest texture were B, B1, A, A1, B2 and A2.
The compost had a neutral pH while the biochar had a very alkaline pH (Table 1). The compost’s mineral content was high considering this type of product. The biochar’s potential CEC was high but its surface area was quite low. Indeed, the biochar’s CEC was not positively correlated with surface area, as was shown in the studies of Budai et al. [30] and Kloss et al. [14].

3.2. Influence of Sand Content and Organic Amendments on Soil Water Retention Properties

The water contents for the nine matric potentials are presented in Table 2 for soils A, A1 and A2 and Table 3 for soils B, B1 and B2. Water contents decreased with an increase in sand content for all the pFs and treatments, as expected. Water contents at field capacity were 0.338, 0.200 and 0.107 g.g−1 for unamended soils A, A1 and A2, respectively (Table 2), and 0.494, 0.344 and 0.192 g.g−1 for unamended soils B, B1 and B2 (Table 3).
The biochar-amended soils A1-BC and A2-BC had a significantly higher water content than unamended soils A1 and A2 for all pFs, except A1-BC at pFs ≥ 3.5. In the same soils, the water content also increased with biochar + compost addition. For the original soil A, an increase in SWR was measured with biochar alone (A-BC), while there was no significant increase at pF = 1 and pF = 2.5 with biochar + compost (A-BC-C). The improvement in water retention properties with biochar was more pronounced for sand-enriched soils (Table 2 and Figure 1).
For soils B, B1 and B2, the SWR was significantly higher with biochar addition than for unamended soils at most pFs, even if none of the treatments had any influence at soil saturation (Table 3 and Figure 2). Opposite to C and BC-C treatments, at pF = 1, this effect was only observed with biochar treatment. Furthermore, there was a consistent and significant increase in SWR between pFs ≥ 1.5 and ≤3.5 with biochar alone in soils B, B1 and B2. This means that date palm biochar acts as a water-retention agent in medium and coarse textured soils in a range of potentials that enable plants to be supplied with water. This apparently contradicts the results of Jeffery et al. [31], who showed that biochar did not enhance the SWR in sandy soils, but the soils selected for that study were already rich in SOC, and the biochar used was highly hydrophobic. In our case, no hydrophobic property of the surface of the biochar used was observed using the WDPT test, since the penetration time of the water drops was lower than 1 s with pure biochar.
Treatment with date palm compost led to intermediate soil water content values between the unamended soils and biochar treatments. For example, at pF = 3, A1-C soil water content amounted to 0.093 g.g−1, which was significantly different from the control soil A1 (0.091 g.g−1) and A1-BC-C and A1-BC treatments (0.103 g.g−1 and 104 g.g−1, respectively). Moreover, in the loamy sand A2, the improvement in SWR was not significant. SWR values with the compost were significantly lower than with the biochar treatments at pFs < 3.5, except at pF = 1.5.
Our findings are in agreement with the review conducted by Blanco-Canqui [9] which showed that biochar application enhances soil’s water retention in sandy soils, but neutral to moderate responses were observed in medium or clay textured soils. Garg et al. [32] determined a clay content threshold (6–8%) beyond which the effects of biochar are considerably reduced. They suggested that pore-filling using clay reduces the porosity of biochar and its water retention capacity. In the present study, we observed limited effects of date palm biochar on soils with a clay fraction ≥12%, corresponding to the clay content of the soils A, B and B1.
The contribution of calcium carbonate to the SWR properties was considered negligible since natural soils A and B contained similar and relatively low CaCO3 content. Several studies have indicated a relatively weak relation between this mineral fraction and SWR characteristics [33,34].

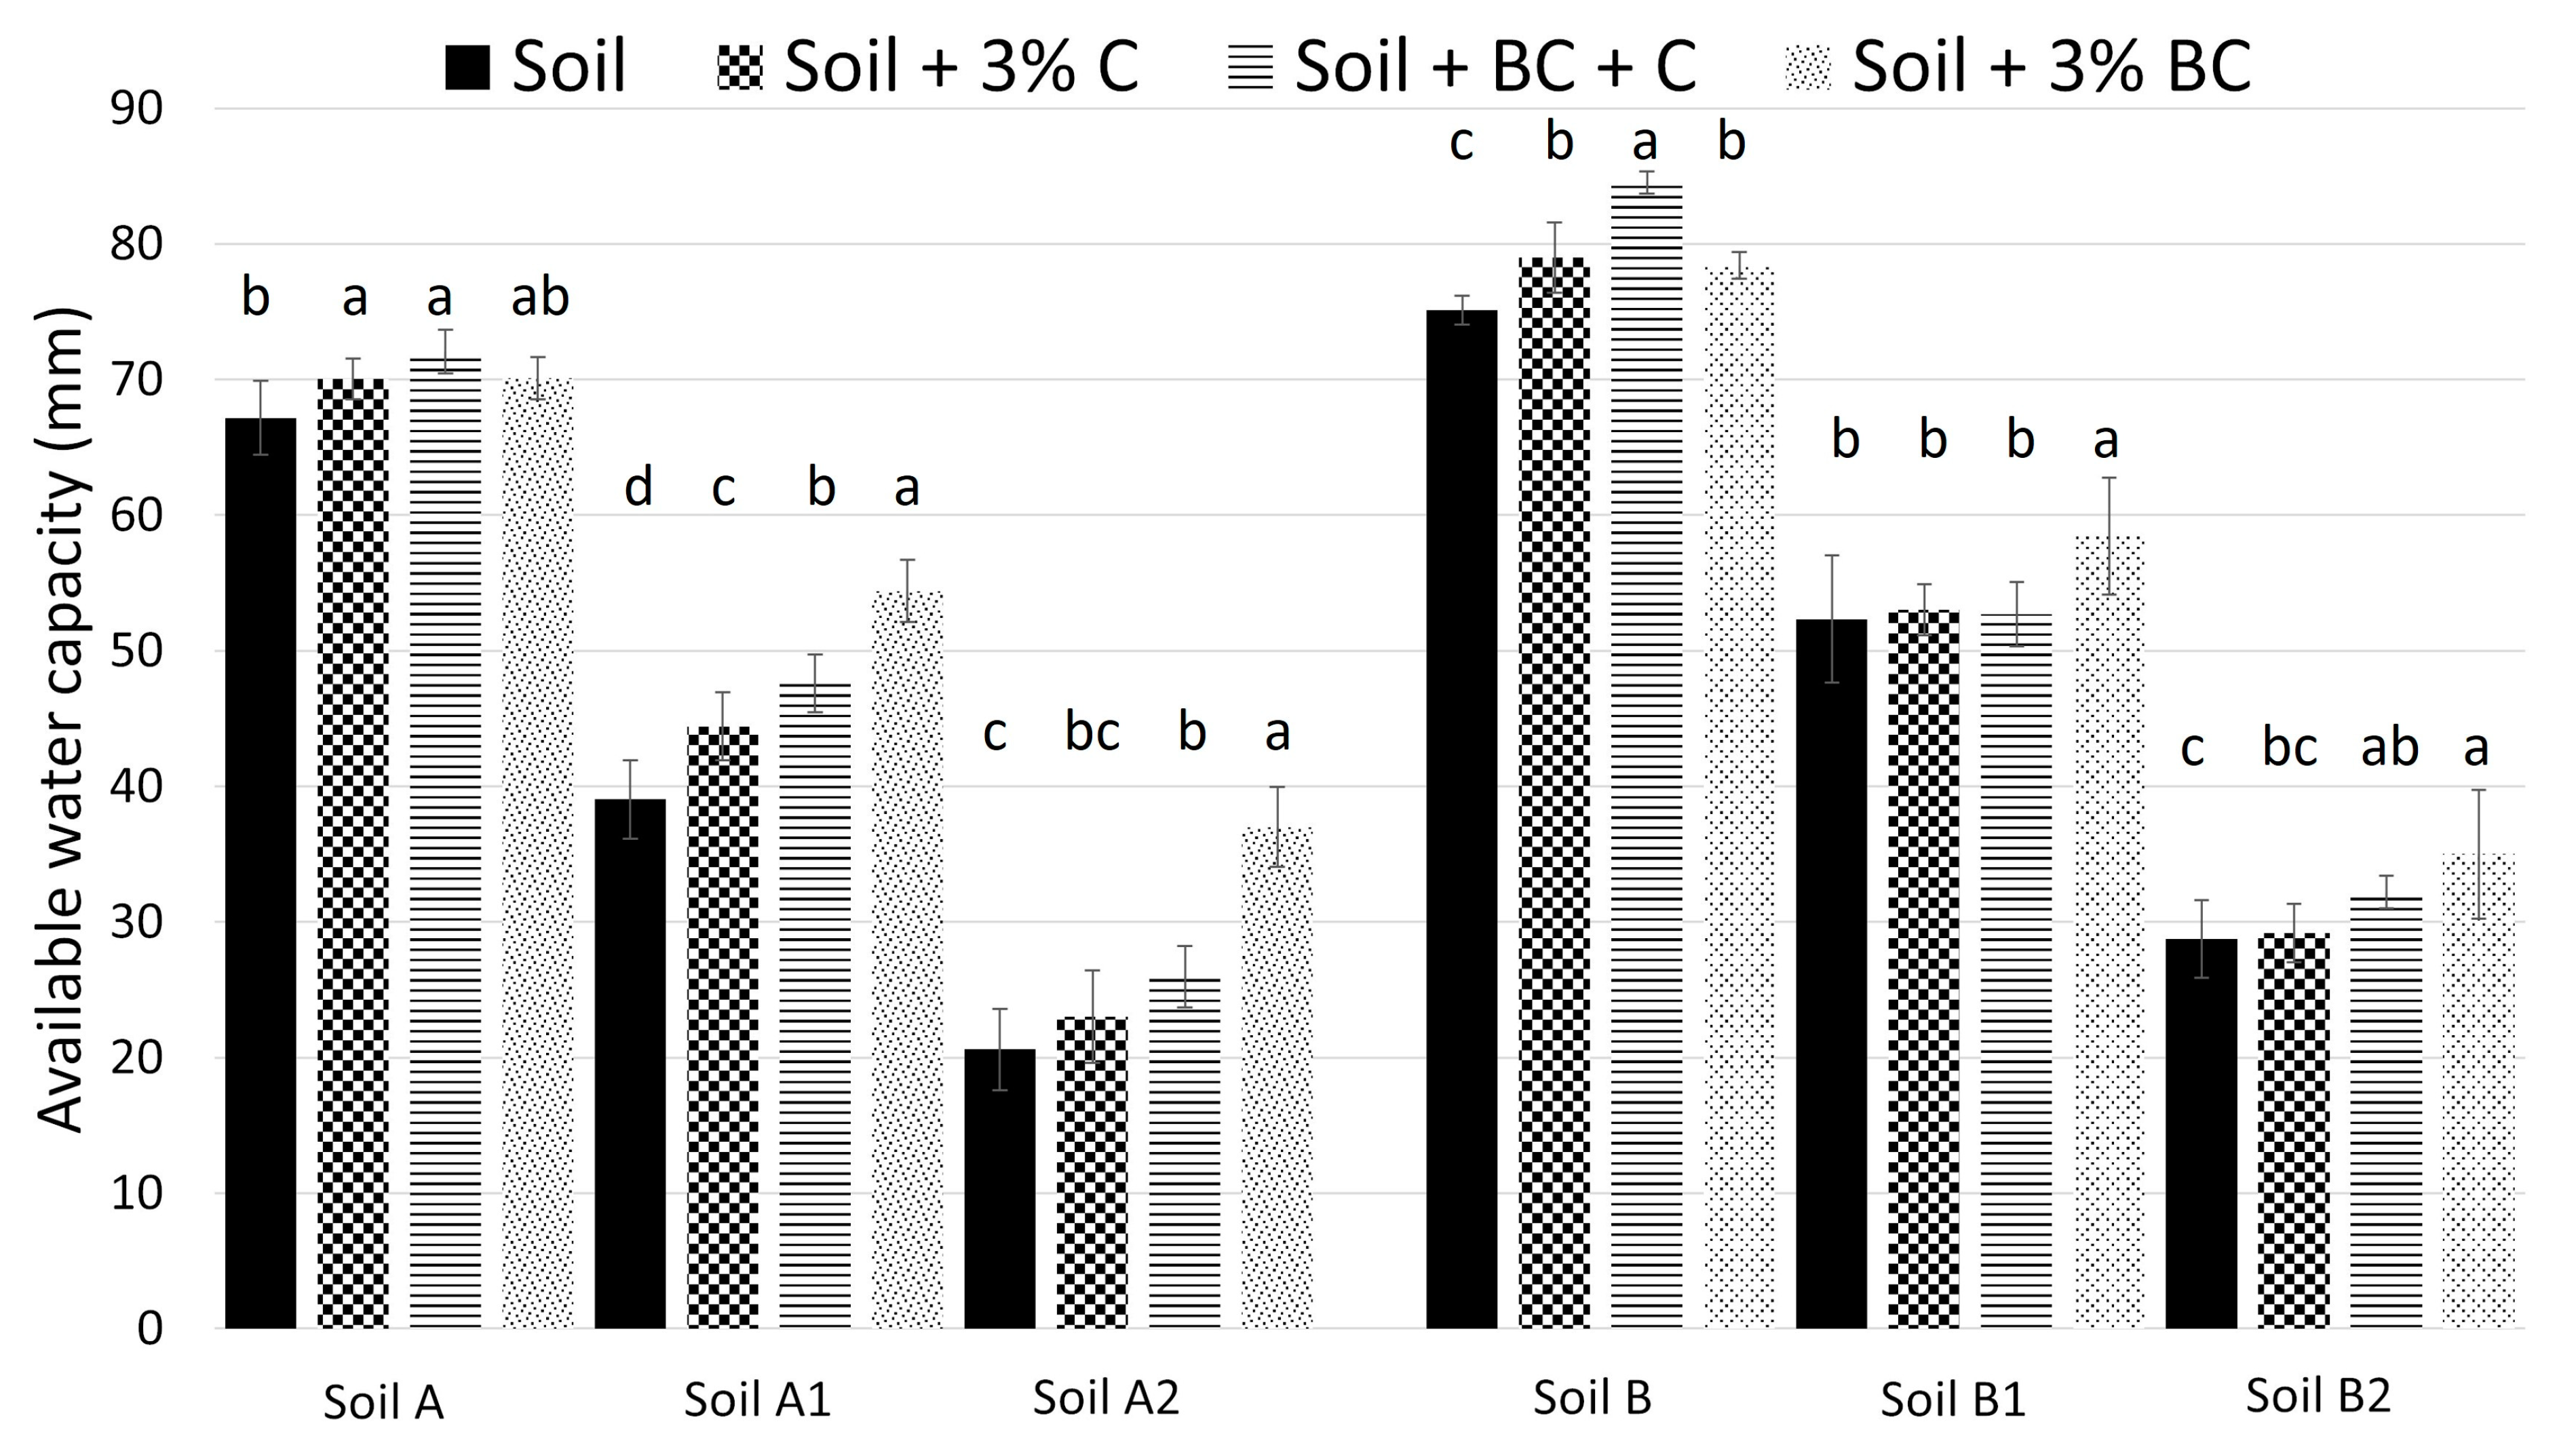
3.3. Available Water Capacity

ANOVA tests performed on the AWC results showed that significant effects of sand, soil and between both factors were observed (Table 4).
Amendment with biochar led to a significant increase in AWC for A1 and A2 soils but not for the original soil A (Figure 3). With sand supplementation, the difference in AWC between amended and unamended soils increased. The enhancement of AWC was significant for all OA (compost, biochar and a mixture of both). Compared to the value of the respective unamended soils, the AWC was increased by 26%, 39% and 80% in A2 + BC + C, A1 + BC and A2 + BC, respectively (Figure 3). This clearly indicated the combined effect of the dose of added biochar as well as the influence of sand.
Similar results were observed for B1 and B2 soils with an increase in AWC after the addition of biochar (+12 and 22%, respectively). Comparing all soils, the improvement in AWC with biochar ranged between 4% in the silt loam (B) and 80% in the loamy sand (A2). Thus, for the studied mixtures, the higher the sand content, the greater the effect of the OA on the AWC. Therefore, the effects of biochar are more pronounced on soils containing less than 12% clay and more than 45% sand (soils A1, B2 and A2).
The differences in AWC are primarily due to the effects of OAs on water content at field capacity. The porosity of the amended soils may be affected through changing the pore space between particles (interpores) and by adding pores already present in the OAs (intrapores). In the case of biochar, Kameyama et al. [35] measured the pore sizes and pore distribution of various biochars using the mercury intrusion porosimetry method. The authors used a capillary rise equation and were able to calculate the diameter size of capillary pores corresponding to the available water capacity (AWC) of biochars. They found a good correlation between the volume of pores with a diameter in the range of 0.2 μm to 9 μm and the AWC of a selection of biochars. These results illustrate the compatibility between the pore size of certain biochars and the range of pores associated with AWC in soil. The increase in water content at the permanent wilting point was only slightly significant. In the case of biochar, this can be explained by the small surface area measured on the biochar (Table 1), since the permanent wilting point is closely related to the specific surface area of soil [36,37]. This is in agreement with Chen et al. [38], which showed that the addition of biochar had little effect on soil water contents at a matric potential of higher than 10,000 hPa (pF > 4).
The effects of date palm biochar on soil properties observed in the present study are consistent compared with earlier studies. We observed more significant effects with biochar treatment applied at 3% by mass compared with the mixture of compost (1.5% by mass) and biochar (1.5% by mass) treatment. These doses of biochar are equivalent to 72 and 36 t.ha−1, respectively, and the increases in AWC of the coarse textured soils were more significant with a high dose of biochar. Some authors mentioned that biochar addition at 10 t.ha−1 does not affect the soil water content at field capacity (and consequently AWC), but higher rates (i.e., ≥30 t.ha−1) significantly increased AWC [39,40]. Khalifa and Yousef [41] applied date palm biochar in a sandy soil at doses of 1, 5 and 10% by mass. They noticed an improvement in AWC of 32, 72 and 109%, respectively. Basso et al. [42] measured a 44% increase in AWC in a sandy loam amended with 3% hardwood fast pyrolyzed at 500 °C. In the present study, the same dose led to +39% AWC in the soil with the texture most similar to the one studied by Basso et al. [42]. However, the increase recorded is much lower than the +130% AWC reported by Esmaeelnejad et al. (2016) [43] with an input of 2% (by mass) apple wood biochar in soils with a texture similar to that in the present study. Indeed, our results showed no significant effect of biochar on soil A.
Date palm compost alone showed weak effects on soil water retention whatever the soil texture. Our results were not consistent with those of Ibrahim and Horton [44] who measured a +27% increase in AWC in a loamy sand soil with the same compost rate. Moreover, the authors found that the biochar-compost mixture (50:50 in mass) had the most significant effect on improving soil water retention and AWC compared with the same OA applied individually. The slight differences observed in the present study could be linked to the nature of the compost. The compost used contained a high mineral content, and the presence of fine sand was observed after the determination of the mineral content. It was probably due to the artisanal nature of compost production, with no suitable infrastructure, and the use of poor water quality, leading to the accumulation of soluble salts and high EC level in the final product (Table 1). The effects of added organic matter may therefore have been less important. Biochar organic carbon content was much higher than that of the compost used (Table 1). Therefore, based on the same amount of organic carbon applied, our results could have been different from those mentioned above.
The experiments were conducted in a laboratory without plants, so that the effects of the soluble salt content of the soils were not assessed. Electrical conductivity in soil A was equivalent to the level of the threshold value set by Allison et al. [45], the salinity threshold above which most cultivated plants’ productivity is significantly reduced. In field experiments, this parameter would influence negatively the rate of water uptake and plant growth due to the increase in osmotic pressure in soil solution.
The present study did not reveal any additive effect with a compost and biochar mixture, regarding SWR properties. However, some recent studies have shown that there is an abiotic interaction between these products (e.g., which may involve the clogging of biochar’s porous structure by fine compost particles), and it cannot be ruled out that this could have an impact on the hydrological properties of the biochar and compost mixture [46].
The expected greater resistance of biochar to biodegradation compared to compost would imply that its effects on water retention would be more durable. However, particular care should be taken when applying biochars to soil, especially in arid areas. There is a lack of knowledge concerning biochar transport from the soil, through runoff or wind erosion. Some studies have already measured significant losses of biochar particles during and after spreading to soil caused by wind erosion, and water preferential erosion of black carbon in various contexts [47,48]. To minimize the release of black carbon dust into the atmosphere, studies have recommended incorporating biochar into pellets or mixing it with manure or compost, preferably with a moisture content higher than 15% [49,50], even if the production of pellets leads to a high reduction in the biochar porosity [51].
Other potential modifications of soil properties after biochar and compost addition need to be further investigated, as well as a cost-benefit analysis of these organic amendments. Indeed, previous studies have shown the potential negative effect of increasing soil salinity with OA, depending on the organic materials’ properties, such as their content in soluble salts and their applied rate [52,53].

4. Conclusions

The aim of this study was to quantify the influence of organic amendment application and sand supplementation on the water retention properties of two coarse textured soils.
The results showed an overall increase in the soil water retention properties with the addition of OAs derived from date palm residues in the tested soils. The addition of compost and/or biochar increased soil water retention, but the effect was more pronounced for biochar. For most pFs, with the addition of biochar, soil water content (SWR) values were significantly higher than in the control soil. This enhancement was higher for sand-enriched soils, showing the influence of sand content, and more generally of soil texture, on the magnitude of the effect of OA application. Limited effects of date palm biochar were observed in soil with low sand content and clay content higher than 12%.
Compost showed little effect on available water capacity (AWC) values whatever the soil texture. This is not consistent with many studies in the literature, but this may be due to the nature of the compost. It contains a high mineral content (73.7%), reducing the influence of organic matter which is in a low proportion. Compared to the respective unamended soils, the values of AWC increased by 26, 39 and 80% for A2 + BC + C, A1 + BC and A2 + BC, respectively. In addition to the influence of sand, these values also showed the influence of the application rate of biochar on the soil. An addition of 3% biochar led to significant differences and higher values of AWC than an addition of 1.5% biochar.
In general, these results show that organic amendment like biochar addition to sandy soils, such as those in Saharan desert regions, could contribute to optimizing the use of water resources. Future directions should include the evaluation of plant growth and long-term in situ experiments.

Author Contributions

Conceptualization, E.L.G. and X.M.; Methodology, E.L.G., X.M. and V.M.; Formal Analysis, E.L.G., X.M., V.M. and S.F.; Investigation, E.L.G., X.M. and M.G.; Resources, D.S.I., M.J.D.-I. and P.G.; Writing—Original Draft Preparation, E.L.G., X.M., M.G. and B.M.; Writing—Review & Editing, M.S., V.K. and A.T.; Supervision, X.M., M.G. and B.M.; Project Administration, X.M.; Funding Acquisition, X.M., M.M. and B.B. All authors have read and agreed to the published version of the manuscript.

Funding

This study was funded by PRIMA, a program funded by the EC under the H2020 framework and the ANR (ANR-21-PRIM-0004).

Data Availability Statement

Data are contained within the article.

Acknowledgments

We thank Catherine Airey-Lauvaux, Université de Reims Champagne-Ardenne, for improving the text of the manuscript.

Conflicts of Interest

The authors declare no conflicts of interest.

References

  1. Hakimi, Y.; Orban, P.; Deschamps, P.; Brouyere, S. Hydrochemical and Isotopic Characteristics of Groundwater in the Continental Intercalaire Aquifer System: Insights from Mzab Ridge and Surrounding Regions, North of the Algerian Sahara. J. Hydrol. Reg. Stud. 2021, 34, 100791. [Google Scholar] [CrossRef]
  2. Gonçalvès, J.; Petersen, J.; Deschamps, P.; Hamelin, B.; Baba-Sy, O. Quantifying the Modern Recharge of the “Fossil” Sahara Aquifers. Geophys. Res. Lett. 2013, 40, 2673–2678. [Google Scholar] [CrossRef]
  3. de Haas, H. Migration, Agricultural Transformations and Natural Resource Exploitation in the Oases of Morocco and Tunisia; Final Scientific Report IMAROM Research Project (Interaction between Migration, Land and Water Management and Resource Exploitation in the Oases of the Maghreb); University of Amsterdam: Amsterdam, The Netherlands, 2001. [Google Scholar]
  4. Rawls, W.J.; Pachepsky, Y.A.; Ritchie, J.C.; Sobecki, T.M.; Bloodworth, H. Effect of Soil Organic Carbon on Soil Water Retention. Geoderma 2003, 116, 61–76. [Google Scholar] [CrossRef]
  5. Weber, P.L.; Blaesbjerg, N.H.; Moldrup, P.; Pesch, C.; Hermansen, C.; Greve, M.H.; Arthur, E.; de Jonge, L.W. Organic Carbon Controls Water Retention and Plant Available Water in Cultivated Soils from South Greenland. Soil Sci. Soc. Am. J. 2023, 87, 203–215. [Google Scholar] [CrossRef]
  6. Panagea, I.S.; Berti, A.; Čermak, P.; Diels, J.; Elsen, A.; Kusá, H.; Piccoli, I.; Poesen, J.; Stoate, C.; Tits, M.; et al. Soil Water Retention as Affected by Management Induced Changes of Soil Organic Carbon: Analysis of Long-Term Experiments in Europe. Land 2021, 10, 1362. [Google Scholar] [CrossRef]
  7. Minasny, B.; McBratney, A. Limited Effect of Organic Matter on Soil Available Water Capacity: Limited Effect of Organic Matter on Soil Water Retention. Eur. J. Soil Sci. 2018, 69, 39–47. [Google Scholar] [CrossRef]
  8. Omondi, M.O.; Xia, X.; Nahayo, A.; Liu, X.; Korai, P.K.; Pan, G. Quantification of Biochar Effects on Soil Hydrological Properties Using Meta-Analysis of Literature Data. Geoderma 2016, 274, 28–34. [Google Scholar] [CrossRef]
  9. Blanco-Canqui, H. Biochar and Soil Physical Properties. Soil Sci. Soc. Am. J. 2017, 81, 687–711. [Google Scholar] [CrossRef]
  10. Yang, X.; Ali, A. Chapter 9—Biochar for Soil Water Conservation and Salinization Control in Arid Desert Regions. In Biochar from Biomass and Waste; Ok, Y.S., Tsang, D.C.W., Bolan, N., Novak, J.M., Eds.; Elsevier: Amsterdam, The Netherlands, 2019; pp. 161–168. ISBN 978-0-12-811729-3. [Google Scholar]
  11. Razzaghi, F.; Obour, P.B.; Arthur, E. Does Biochar Improve Soil Water Retention? A Systematic Review and Meta-Analysis. Geoderma 2020, 361, 114055. [Google Scholar] [CrossRef]
  12. Saffari, N.; Hajabbasi, M.A.; Shirani, H.; Mosaddeghi, M.R.; Mamedov, A.I. Biochar Type and Pyrolysis Temperature Effects on Soil Quality Indicators and Structural Stability. J. Environ. Manag. 2020, 261, 110190. [Google Scholar] [CrossRef]
  13. Saidi, D.; Bissonnais, Y.L.; Duval, O.; Daoud, Y.; Halitim, A. Effet du sodium échangeable et de la concentration saline sur les propriétés physiques des sols de la plaine du Cheliff (Algérie). Étude Gest. Sols 2004, 11, 137. [Google Scholar]
  14. Kloss, S.; Zehetner, F.; Dellantonio, A.; Hamid, R.; Ottner, F.; Liedtke, V.; Schwanninger, M.; Gerzabek, M.H.; Soja, G. Characterization of Slow Pyrolysis Biochars: Effects of Feedstocks and Pyrolysis Temperature on Biochar Properties. J. Environ. Qual. 2012, 41, 990–1000. [Google Scholar] [CrossRef]
  15. Tomczyk, A.; Sokołowska, Z.; Boguta, P. Biochar Physicochemical Properties: Pyrolysis Temperature and Feedstock Kind Effects. Rev. Environ. Sci. Biotechnol. 2020, 19, 191–215. [Google Scholar] [CrossRef]
  16. Tengberg, M. Beginnings and Early History of Date Palm Garden Cultivation in the Middle East. J. Arid. Environ. 2012, 86, 139–147. [Google Scholar] [CrossRef]
  17. Kingdom of Morocco—MAPM-Ministry of Agriculture, Maritime Fisheries, Rural Development and Waters and Forests Programme de Plantation de 3 Millions de Palmier Dattier (2009–2020): Dépassement Des Objectifs Fin de Cette Année | Ministère de l’agriculture. Available online: https://www.agriculture.gov.ma/fr/actualites/programme-de-plantation-de-3-millions-de-palmier-dattier-2009-2020-depassement-des (accessed on 17 December 2023).
  18. el Janati, M.; Akkal-Corfini, N.; Ahmed, B.; Oukarroum, A.; Robin, P.; Sabri, A.; Chikhaoui, M.; Thomas, Z. Benefits of Circular Agriculture for Cropping Systems and Soil Fertility in Oases. Sustainability 2021, 13, 17. [Google Scholar] [CrossRef]
  19. el Janati, M.; Robin, P.; Akkal-Corfini, N.; Bouaziz, A.; Sabri, A.; Chikhaoui, M.; Thomas, Z.; Oukarroum, A. Composting Date Palm Residues Promotes Circular Agriculture in Oases. Biomass Conv. Bioref. 2022, 13, 14859–14872. [Google Scholar] [CrossRef]
  20. el Janati, M.; Akkal-Corfini, N.; Robin, P.; Oukarroum, A.; Sabri, A.; Thomas, Z.; Chikhaoui, M.; Ahmed, B. Compost from Date Palm Residues Increases Soil Nutrient Availability and Growth of Silage Corn (Zea mays L.) in an Arid Agroecosystem. J. Soil Sci. Plant Nutr. 2022, 22, 3727–3739. [Google Scholar] [CrossRef]
  21. NF ISO 14235. 1998. Available online: https://www.boutique.afnor.org/fr-fr/norme/nf-iso-14235/qualite-du-sol-dosage-du-carbone-organique-par-oxydation-sulfochromique/fa040485/14434 (accessed on 2 February 2024).
  22. NF EN ISO 10693. 2014. Available online: https://www.boutique.afnor.org/fr-fr/norme/nf-en-iso-10693/qualite-du-sol-determination-de-la-teneur-en-carbonate-methode-volumetrique/fa181520/43347 (accessed on 2 February 2024).
  23. NF X31-130. 1999. Available online: https://www.boutique.afnor.org/fr-fr/norme/nf-x31130/qualite-des-sols-methodes-chimiques-determination-de-la-capacite-dechange-c/fa049698/16623 (accessed on 2 February 2024).
  24. NF ISO 10390. 2005. Available online: https://www.boutique.afnor.org/fr-fr/norme/nf-iso-10390/qualite-du-sol-determination-du-ph/fa117123/25226 (accessed on 2 February 2024).
  25. NF EN ISO 21663. 2020. Available online: https://m.boutique.afnor.org/fr-fr/norme/nf-en-iso-21663/combustibles-solides-de-recuperation-methodes-de-determination-de-la-teneur/fa196260/260687 (accessed on 2 February 2024).
  26. Munera-Echeverri, J.L.; Martinsen, V.; Strand, L.T.; Zivanovic, V.; Cornelissen, G.; Mulder, J. Cation Exchange Capacity of Biochar: An Urgent Method Modification. Sci. Total Environ. 2018, 642, 190–197. [Google Scholar] [CrossRef] [PubMed]
  27. Singh, B.; Camps-Arbestain, M.; Lehmann, J. Biochar: A Guide to Analytical Methods; Csiro Publishing: Clayton, Australia, 2017; ISBN 978-1-4863-0510-0. [Google Scholar]
  28. de Jesus Duarte, S.; Hubach, A.; Glaser, B. Soil Water Balance and Wettability Methods in Soil Treated with Biochar and/or Compost. Carbon Res. 2022, 1. [Google Scholar] [CrossRef]
  29. R Core Team. R: A Language and Environment for Statistical Computing; R Foundation for Statistical Computing: Vienna, Austria, 2021. [Google Scholar] [CrossRef]
  30. Budai, A.; Wang, L.; Gronli, M.; Strand, L.T.; Antal, M.J., Jr.; Abiven, S.; Dieguez-Alonso, A.; Anca-Couce, A.; Rasse, D.P. Surface Properties and Chemical Composition of Corncob and Miscanthus Biochars: Effects of Production Temperature and Method. J. Agric. Food Chem. 2014, 62, 3791–3799. [Google Scholar] [CrossRef] [PubMed]
  31. Jeffery, S.; Meinders, M.B.J.; Stoof, C.R.; Bezemer, T.M.; van de Voorde, T.F.J.; Mommer, L.; van Groenigen, J.W. Biochar Application Does Not Improve the Soil Hydrological Function of a Sandy Soil. Geoderma 2015, 251–252, 47–54. [Google Scholar] [CrossRef]
  32. Garg, A.; Wani, I.; Zhu, H.; Kushvaha, V. Exploring Efficiency of Biochar in Enhancing Water Retention in Soils with Varying Grain Size Distributions Using ANN Technique. Acta Geotech. 2022, 17, 1315–1326. [Google Scholar] [CrossRef]
  33. Jensen, N.H.; Balstrøm, T.; Breuning-Madsen, H. The Relations between Soil Water Retention Characteristics, Particle Size Distributions, Bulk Densities and Calcium Carbonate Contents for Danish Soils. Hydrol. Res. 2005, 36, 235–244. [Google Scholar] [CrossRef]
  34. Mosaddeghi, M.R.; Mahboubi, A.A. Point Pedotransfer Functions for Prediction of Water Retention of Selected Soil Series in a Semi-Arid Region of Western Iran. Arch. Agron. Soil Sci. 2011, 57, 327–342. [Google Scholar] [CrossRef]
  35. Kameyama, K.; Miyamoto, T.; Iwata, Y. The Preliminary Study of Water-Retention Related Properties of Biochar Produced from Various Feedstock at Different Pyrolysis Temperatures. Materials 2019, 12, 1732. [Google Scholar] [CrossRef]
  36. Li, L.; Zhang, Y.-J.; Novak, A.; Yang, Y.; Wang, J. Role of Biochar in Improving Sandy Soil Water Retention and Resilience to Drought. Water 2021, 13, 407. [Google Scholar] [CrossRef]
  37. Petersen, C.T.; Hansen, E.; Larsen, H.H.; Hansen, L.V.; Ahrenfeldt, J.; Hauggaard-Nielsen, H. Pore-Size Distribution and Compressibility of Coarse Sandy Subsoil with Added Biochar. Eur. J. Soil Sci. 2016, 67, 726–736. [Google Scholar] [CrossRef]
  38. Chen, X.; Li, L.; Li, X.; Kang, J.; Xiang, X.; Shi, H.; Ren, X. Effect of Biochar on Soil-Water Characteristics of Soils: A Pore-Scale Study. Water 2023, 15, 1909. [Google Scholar] [CrossRef]
  39. Głąb, T.; Palmowska, J.; Zaleski, T.; Gondek, K. Effect of Biochar Application on Soil Hydrological Properties and Physical Quality of Sandy Soil. Geoderma 2016, 281, 11–20. [Google Scholar] [CrossRef]
  40. Xiao, Q.; Zhu, L.; Shen, Y.; Li, S. Sensitivity of Soil Water Retention and Availability to Biochar Addition in Rainfed Semi-Arid Farmland during a Three-Year Field Experiment. Field Crops Res. 2016, 196, 284–293. [Google Scholar] [CrossRef]
  41. Khalifa, N.; Yousef, L.F. A Short Report on Changes of Quality Indicators for a Sandy Textured Soil after Treatment with Biochar Produced from Fronds of Date Palm. Energy Procedia 2015, 74, 960–965. [Google Scholar] [CrossRef]
  42. Basso, A.S.; Miguez, F.E.; Laird, D.A.; Horton, R.; Westgate, M. Assessing Potential of Biochar for Increasing Water-Holding Capacity of Sandy Soils. GCB Bioenergy 2013, 5, 132–143. [Google Scholar] [CrossRef]
  43. Esmaeelnejad, L.; Shorafa, M.; Gorji, M.; Hosseini, S.M. Enhancement of Physical and Hydrological Properties of a Sandy Loam Soil via Application of Different Biochar Particle Sizes during Incubation Period. Span. J. Agric. Res. 2016, 14, e1103. [Google Scholar] [CrossRef]
  44. Ibrahim, A.; Horton, R. Biochar and Compost Amendment Impacts on Soil Water and Pore Size Distribution of a Loamy Sand Soil. Soil Sci. Soc. Am. J. 2021, 85, 1021–1036. [Google Scholar] [CrossRef]
  45. Allison, L.E.; Brown, J.W.; Hayward, H.E.; Richards, A.; Bernstein, L.; Fireman, M.; Pearson, G.A.; Bower, C.A.; Hatcher, J.T.; Reeve, R.C.; et al. Agriculture Handbook No. 60; United States Department of Agriculture: Washington, DC, USA, 1954.
  46. Aubertin, M.-L.; Sebag, D.; Jouquet, P.; Pillot, D.; Lamoureux-Var, V.; Kowalewski, I.; Girardin, C.; Houot, S.; Rumpel, C. Abiotic Interactions of Biochar and Compost During Their Blending May Reduce Biochar Thermal Stability. SSRN Electron. J. 2022. [Google Scholar] [CrossRef]
  47. Ravi, S.; Li, J.; Meng, Z.; Zhang, J.; Mohanty, S. Generation, Resuspension, and Transport of Particulate Matter from Biochar-Amended Soils: A Potential Health Risk. GeoHealth 2020, 4. [Google Scholar] [CrossRef] [PubMed]
  48. Rumpel, C.; Chaplot, V.; Planchon, O.; Bernadou, J.; Valentin, C.; Mariotti, A. Preferential Erosion of Black Carbon on Steep Slopes with Slash and Burn Agriculture. CATENA 2006, 65, 30–40. [Google Scholar] [CrossRef]
  49. Sizirici, B.; Fseha, Y.H.; Yildiz, I.; Delclos, T.; Khaleel, A. The Effect of Pyrolysis Temperature and Feedstock on Date Palm Waste Derived Biochar to Remove Single and Multi-Metals in Aqueous Solutions. Sustain. Environ. Res. 2021, 31. [Google Scholar] [CrossRef]
  50. Woolf, D.; Amonette, J.E.; Street-Perrott, F.A.; Lehmann, J.; Joseph, S. Sustainable Biochar to Mitigate Global Climate Change. Nat. Commun. 2010, 1, 56. [Google Scholar] [CrossRef] [PubMed]
  51. Kim, P.; Hensley, D.; Labbé, N. Nutrient Release from Switchgrass-Derived Biochar Pellets Embedded with Fertilizers. Geoderma 2014, 232–234, 341–351. [Google Scholar] [CrossRef]
  52. Gondek, M.; Weindorf, D.C.; Thiel, C.; Kleinheinz, G. Soluble Salts in Compost and Their Effects on Soil and Plants: A Review. Compost. Sci. Util. 2020, 28, 59–75. [Google Scholar] [CrossRef]
  53. Saifullah; Dahlawi, S.; Naeem, A.; Rengel, Z.; Naidu, R. Biochar Application for the Remediation of Salt-Affected Soils: Challenges and Opportunities. Sci. Total Environ. 2018, 625, 320–335. [Google Scholar] [CrossRef] [PubMed]
Figure 1. Water retention curves of the soils A, A1 and A2.
Forests 15 00304 g001
Figure 2. Water retention curves of the soils B, B1 and B2.
Forests 15 00304 g002
Figure 3. Available water capacities of the soils with and without organic amendments. C = compost, BC = biochar. The letters indicate whether the differences between the four treatments for each soil were significant at the 5% level.
Forests 15 00304 g003
Table 1. Physico-chemical properties of the soils and organic amendments.
ParametersUnitSoil ASoil A1Soil A2Soil BSoil B1Soil B2CompostBiochar
Particle size distribution% Clay11.67.73.918.512.36.2
% Silt34.923.311.663.142.121.0
% Sand53.569.084.518.445.672.8
% 2–4 mm 3.2
% 1–2 mm 12.5
% 0.5–1 mm 12.6
% 0.2–0.5 mm 18.4
% <0.2 mm 53.3
Bulk density-1.26 ± 0.04 1.01 ± 0.02
pH (water)-7.9 ± 0.04 8.1 ± 0.02 7.0 ± 0.19.7 ± 0.1
ECmS.cm−14.0 ± 0.12.7 ± 0.11.7 ± 0.12.5 ± 0.12.4 ± 0.12.1 ± 0.19.2 ± 0.37.6 ± 0.3
Corg%1.26 1.33 13.7 ± 0.1
Ctotal% 62.5
CECcmol.kg−16.1 8.7 126 ± 5
Total CaCO3%11.6 8.4
Surface aream2.g−1 13.5
Mineral content% 73.7 ± 0.215.2 ± 0.6
Table 2. Water contents (g(water).g−1(soil)) measured in the natural soil A, soil A1 and soil A2 at different matric potentials.
pF011.522.533.544.2
A0.452 b0.428 c0.401 c0.338 b0.186 b0.123 c0.092 b0.070 c0.070 d
A + C0.453 b0.446 b0.418 ab0.352 a0.203 a0.132 c0.094 b0.075 b0.074 c
A + BC + C0.481 a0.426 c0.414 b0.363 a0.192 ab0.145 b0.103 a0.078 b0.078 b
A + BC0.496 a0.467 a0.431 a0.361 a0.228 a0.159 a0.101 a0.083 a0.085 a
A10.327 c0.294 b0.290 c0.200 d0.115 b0.091 c0.061 c0.047 a0.048 b
A1 + C0.356 a0.317 a0.309 b0.225 c0.133 a0.093 b0.067 b0.049 a0.049 b
A1 + BC + C0.355 a0.321 a0.331 a0.246 b0.144 a0.103 a0.072 a0.049 a0.057 a
A1 + BC0.337 b0.325 a0.303 b0.263 a0.140 a0.104 a0.065 bc0.050 a0.049 b
A20.246 b0.198 b0.175 b0.107 d0.079 b0.050 c0.033 c0.024 c0.025 c
A2 + C0.260 b0.205 b0.201 a0.120 c0.079 b0.049 c0.036 b0.028 b0.029 b
A2 + BC + C0.290 a0.234 a0.200 a0.136 b0.117 a0.064 b0.040 a0.031 a0.033 a
A2 + BC0.290 a0.243 a0.203 a0.175 a0.116 a0.077 a0.037 b0.028 b0.028 b
C = compost, BC = biochar. The letters indicate whether the differences in water content between the four treatments for each soil and each matric potential were significant at the 5% level.
Table 3. Water contents (g(water).g−1(soil)) measured in the natural soil B, soil B1 and soil B2 at different matric potentials.
pF011.522.533.544.2
B0.661 a0.619 b0.565 c0.494 c0.390 b0.240 b0.166 c0.117 b0.122 bc
B + C0.666 a0.640 a0.609 a0.514 b0.400 b0.231 c0.166 c0.115 b0.123 b
B + BC + C0.660 a0.633 ab0.603 a0.539 a0.423 a0.245 b0.169 b0.116 b0.121 c
B + BC0.674 a0.648 a0.583 b0.516 b0.434 a0.252 a0.179 a0.131 a0.128 a
B10.494 ab0.430 a0.374 c0.344 b0.267 b0.206 b0.113 b0.084 b0.085 b
B1 + C0.524 a0.431 a0.408 b0.350 b0.316 a0.195 b0.106 c0.079 b0.087 b
B1 + BC + C0.468 b0.454 a0.409 b0.355 b0.298 a0.257 a0.114 b0.092 a0.094 a
B1 + BC0.490 ab0.448 a0.431 a0.384 a0.317 a0.258 a0.122 a0.085 ab0.094 a
B20.311 a0.262 bc0.209 b0.192 c0.133 c0.088 b0.056 b0.043 b0.049 a
B2 + C0.308 a0.259 c0.221 b0.198 bc0.156 b0.091 b0.062 a0.047 a0.053 a
B2 + BC + C0.309 a0.280 b0.250 a0.209 b0.176 a0.099 a0.060 ab0.045 ab0.050 a
B2 + BC0.311 a0.303 a0.259 a0.225 a0.169 a0.098 a0.063 a0.047 a0.052 a
C = compost, BC = biochar. The letters indicate whether the differences in water content between the four treatments for each soil and each matric potential were significant at the 5% level.
Table 4. Results of three-way ANOVA analyses performed on the AWC values.
F Values—Three-Way ANOVA
SoilSandTreatmentSoil × SandSoil × TreatmentSand × TreatmentSoil × Sand × Treatment
SWR60.27 ***340.6 ***0.5699858.4 ***9.289 ***72.97 ***686.4 ***
SWR = soil water retention. *** p-value < 0.001.
Disclaimer/Publisher’s Note: The statements, opinions and data contained in all publications are solely those of the individual author(s) and contributor(s) and not of MDPI and/or the editor(s). MDPI and/or the editor(s) disclaim responsibility for any injury to people or property resulting from any ideas, methods, instructions or products referred to in the content.

