Brief Report

Vegetation Effects on Phosphorus Runoff from Headwater Catchments in a Cool-Temperate Region with Landslides, Northern Japan

1
Department of Applied Chemistry and Bioscience, Chitose Institute of Science and Technology, Chitose 066-8655, Japan
2
Forestry Research Institute, Hokkaido Research Organization, Bibai 079-0198, Japan
3
School of Human Science and Environment, University of Hyogo, Himeji 670-0092, Japan
4
Graduate School of Bioagricultural Sciences, Nagoya University, Nagoya 464-8601, Japan
*
Author to whom correspondence should be addressed.
Forests 2024, 15(2), 229; https://doi.org/10.3390/f15020229
Submission received: 10 December 2023 / Revised: 16 January 2024 / Accepted: 19 January 2024 / Published: 25 January 2024

Abstract

:
Forest vegetation and soils in headwaters can control runoff and surface erosion. However, it remains unclear how vegetation affects nutrient exports from cool-temperate forest headwaters during intense rain events that transport sediment-associated nutrients, such as phosphorus (P). To clarify this, we targeted an upstream landslide area and analyzed P contents in surface soils and total P (TP) in stream water of the undisturbed (UF) and landslide-bearing forest (LB) catchments. The soil P content was higher in the UF catchment than in the LB catchment, but differences in the average TP concentration and load during low flows between these catchments were not significant. Conversely, the overall runoff and the TP load were three and ten times higher in the LB catchment than in the UF catchment, respectively, during a rain event with daily precipitation of 49 mm, despite the soil P content being much lower in the LB catchment. Particulate P (PP) accounted for more than 90% of the TP load during the rain event in the LB catchment, whereas dissolved P accounted for more than 80% of the TP load in the UF catchment. Therefore, soil surface mobility strongly affected P transport in the forest catchments. Our study suggests that vegetation not only reduces PP loads by controlling runoff, but also influences stream P forms in cool-temperate forests.

1. Introduction

The increasing magnitude and frequency of heavy rainfalls can transport large amounts of nutrients from terrestrial to aquatic ecosystems owing to the increasing volume of stream water [1,2,3,4]. Especially, landslide areas caused by natural disasters, such as earthquakes and heavy rainfall, drain large amounts of sediment-associated nutrients, i.e., particulate nutrients, via surface erosion because of the absence of vegetation [5,6]. Because bare soil surfaces in the landslide areas have little capacity to moderate surface water infiltration, rainfall directly removes soil nutrients, and surface runoff often transports particulate nutrients from soils to water courses. These particulate nutrients may then reach enclosed waters, such as lakes and coastal seas, where they can cause water degradation and severely affect primary production [7].
In Japan, forests occupy approximately two-thirds of the land cover. Unlike landslide areas, forests in Japan are expected to mitigate storm runoff and soil erosion [8]. This is because forest vegetation and litter intercept part of the rainfall, thereby reducing the raindrop impact on soil surfaces [9]. Additionally, an aggregate structure develops in forest soils; thus the infiltration capacity is high, which reduces peak runoff and the rate of soil erosion more effectively than other land cover types [10,11]. Therefore, nutrient concentrations in forest streams are generally low [12,13]. Ide et al. [14] indicated that large volumes of drainage water from forests should flow into downstream rivers and dilute nutrient concentrations during storms in a river basin with several land cover types in western Japan. They also suggested that the effectiveness of forest buffers against increased nutrient concentrations during storms was little different between coniferous and broad-leaved forests, while forest coverage has been recognized as one of the important factors influencing nutrient concentrations in river basins (e.g., [15,16,17,18,19,20,21]).
Phosphorus (P) is a limiting factor controlling primary production in aquatic ecosystems and is often transported from land to downstream lakes and coastal waters [22]. The P exported from forests influences the productivity of freshwater bacterioplankton, algae, and macrophytes, although the P concentration in forest streams is generally low [23,24]. Because forests occupy much of the land cover in Japan, the total amount of P exported from forests can critically affect nutrient levels in downstream rivers and waters [14]. A dissolved form of P in a forest stream can be sorbed onto the bed sediment surfaces, and some of the bioavailable dissolved P is assimilated into biomass during low flows; thus, sediment loads can act as a sink of P within the stream channel [25]. On the other hand, most P draining from forests is associated with sediment loads and exported in a particulate form during raid increases in runoff in response to intensive rainfalls [26,27,28]. Several studies have implicated that both the magnitude and frequency of precipitation change in response to climate change in cold-region forests [29,30,31]. Fujibe et al. [32,33] showed that the frequency of intensive rainfall and dry weather has been increasing in Japan. Ide et al. [26] showed that intensive rainfall following dry conditions caused a rapid increase in particulate P load from a temperate forested catchment. The total amount of particulate P exported from forests is predicted to increase in northern Japan under climate change conditions [34].
On the other hand, in cold-region forests, such as boreal forests, deciduous forest stands supply much of the leaf litter to soils, and a large amount of organic matter is accumulated in forest soils; consequently, dissolved organic matter (DOM) in soil solutions plays a critical role in nutrient transport [35,36]. This is attributable to the slow decomposition of soil organic matter, such as litter leaf; thus, large carbon pools exist in soil solids and solutions, which provide high concentrations and molecular weights of DOM in stream water [37,38]. Since terrigenous DOM forms a complex with nutrients, much P can be transported in a dissolved form from soils to watercourses in cold-region forests. Kortelainen et al. [36] observed that 70%–90% of P was exported in a dissolved form in 21 unmanaged boreal streams. However, little information is available regarding how the existence of forest vegetation affects P transport processes, including P forms in stream water, in cool-temperate forests.
This study aimed to examine how the existence of the forest vegetation affects P exported from a cool-temperate forest in northern Japan in response to an intensive rain event. To achieve this, we targeted an upstream landslide area induced by a massive earthquake, observed rainfall and stream runoff, and analyzed the soil and water chemistry in the undisturbed and landslide-bearing forest catchments in the region. We first compared soil P content and stream P concentrations and loads during low flows between the catchments. Then we examined vegetation effects on P runoff characteristics in a cool-temperate forest by comparing changes in stream P concentrations and loads during an intensive rain event between the catchments.

2. Materials and Methods

2.1. Site Description

This study was conducted in an upstream area of the Habiu River Basin, which was a headwater part of the Atsuma River Basin in Iburi Subprefecture, northern Japan (42°46′N, 141°58′E; 120–200 m a.s.l.; Figure 1). This region was severely affected by the 2018 Hokkaido Eastern Iburi earthquake [39]. The underlying bedrock consists of Neogene sedimentary rock. Soils in our study catchments were composed of humus layers (i.e., andosol, 0–0.5 m deep), pyroclastic deposits (i.e., tephra, 0.5–2.0 m deep), and weathered bedrock layers (2.0–2.6 m deep). According to Istiyanti and Goto [40], physical properties of these soils were as follows: bulk density of ca. 0.5–1.0 g cm–3, soil particle density of 2.4–2.8 g cm–3, and void ratio of ca. 2–4. The climate is classified as cool temperate [41], and the dominant forest vegetation is a mixture of secondary deciduous forest, which consists mainly of Betulaceae and Fagaceae, such as Japanese white birch (Betula platyphylla) and mizunara (Quercus crispula), and coniferous forest, such as Japanese larch (Larix kaempferi) and Sakhalin fir (Abies sachalinensis). The average annual precipitation and air temperature from 1992 to 2021 were 1040 mm y–1 and 7 ℃, respectively [42].
We targeted two neighboring, forested headwater catchments (distance between the catchments: 370 m). One catchment included the landslide area, which was located mainly on the left bank, and was thus called the landslide-bearing forest (LB) catchment in this study. The failure depth of the landslide area ranged from 0.4 to 1.6 m in this catchment, causing the absence of the humus layer and exposure of the weathered soils on the landslide scars. The area and the landslide coverage of the catchment were 0.7 ha and 52%, respectively. Approximately 35% of the catchment was covered by forest canopy, and the remaining 13% surfaces were covered by herbaceous vegetation. The other catchment was little damaged by the earthquake, covered by cool-temperate forests, and thus called the undisturbed forest (UF) catchment in this study. The area and the landslide coverage of this catchment were 1.1 ha and 0%, respectively. The average slope gradients of the LB and UF catchments were 25° and 33°, respectively. Each catchment has a perennial stream.

2.2. Hydrological Surveys and Soil and Water Samplings

A triangular-notch weir was installed at the end of each catchment (Figure 1). Water levels were recorded at 10-min intervals using a capacitance water level gauge (SE-TR/WT500, TruTrack, Christchurch, New Zealand) at each weir. The actual water level and the runoff volume at each weir were also measured monthly using a metal measure and a measuring cylinder, respectively. Rainfall was recorded at 10-min intervals using a tipping-bucket rain gauge (7852, Davis Instruments, Hayward, CA, USA) installed at the exposed area near the LB catchment.
Soil samples were collected from a soil depth of 0–5 cm in each catchment on 15 September 2022. The samples were collected at nine locations from the lower to the upper positions on each of the left and right banks, which totaled 18 locations within each catchment. Litter leaves were removed from the soil surface when collecting soil samples derived from the humus layer in the UF catchment and some undefined mixture of humus and weathered soils in the LB catchment. Stream water between rain events was manually sampled once a month from April to November 2022. Intensive sampling was also conducted at hourly intervals for 24 h using an automatic sampler (Sigma 900, Hach Company, Loveland, CO, USA) installed at the end of each catchment during a rain event that occurred on 24 June 2022. The total rainfall and the 10-day antecedent rainfall of the rain event were 49 mm and 23.4 mm, respectively. The stream water samples were stored at a temperature of 5 ℃ in the dark until analysis.

2.3. Chemical Analyses

The soil samples were oven-dried at 105 ℃ for three hours, sieved through a 1-mm mesh, and then ground to powder using a mortar. An amount of 0.5–1 g of the ground soil sample was digested with concentrated nitric acid and hydrogen peroxide using an acid-circulating decomposition system (ECOPRE system, ACTAC, Tokyo, Japan), and then soil phosphorus content was measured using inductively coupled plasma optical emission spectroscopy (IRIS Advantage ICP-OES, Thermo Fisher Scientific, Whatman, MA, USA). The carbon content of the ground soil samples was determined using an elemental analyzer (vario MAX CNS, Elementar, Langenselbold, Germany).
The total phosphorus (TP) in the water samples was measured using the molybdenum blue (ascorbic acid) absorptiometry after the water samples were digested with potassium peroxydisulfate (JIS K 0102 [43]). Dissolved phosphorus (DP) was measured using the same method as TP after the water samples were filtered through glass-fiber filters with a nominal pore size of 0.7 μm (GF/F, Whatman, MA, USA). Particulate phosphorus (PP) was calculated by subtracting DP from TP. Dissolved organic carbon (DOC) and dissolved silica (SiO2) were analyzed using the combustion catalytic oxidation method (TOC-L, SHIMADZU Corp., Kyoto, Japan) and the molybdenum yellow absorptiometry, respectively, after the water samples were filtered through glass-fiber filters. For the analysis of suspended sediment (SS), the water samples were filtered through glass-fiber filters, and the residues were then oven-dried at 105 ℃ for two hours and weighed.
Statistical analyses were performed using R (version 4.1.3), which is an open-source environment for statistical computing (R Foundation for Statistical Computing, Vienna).

3. Results

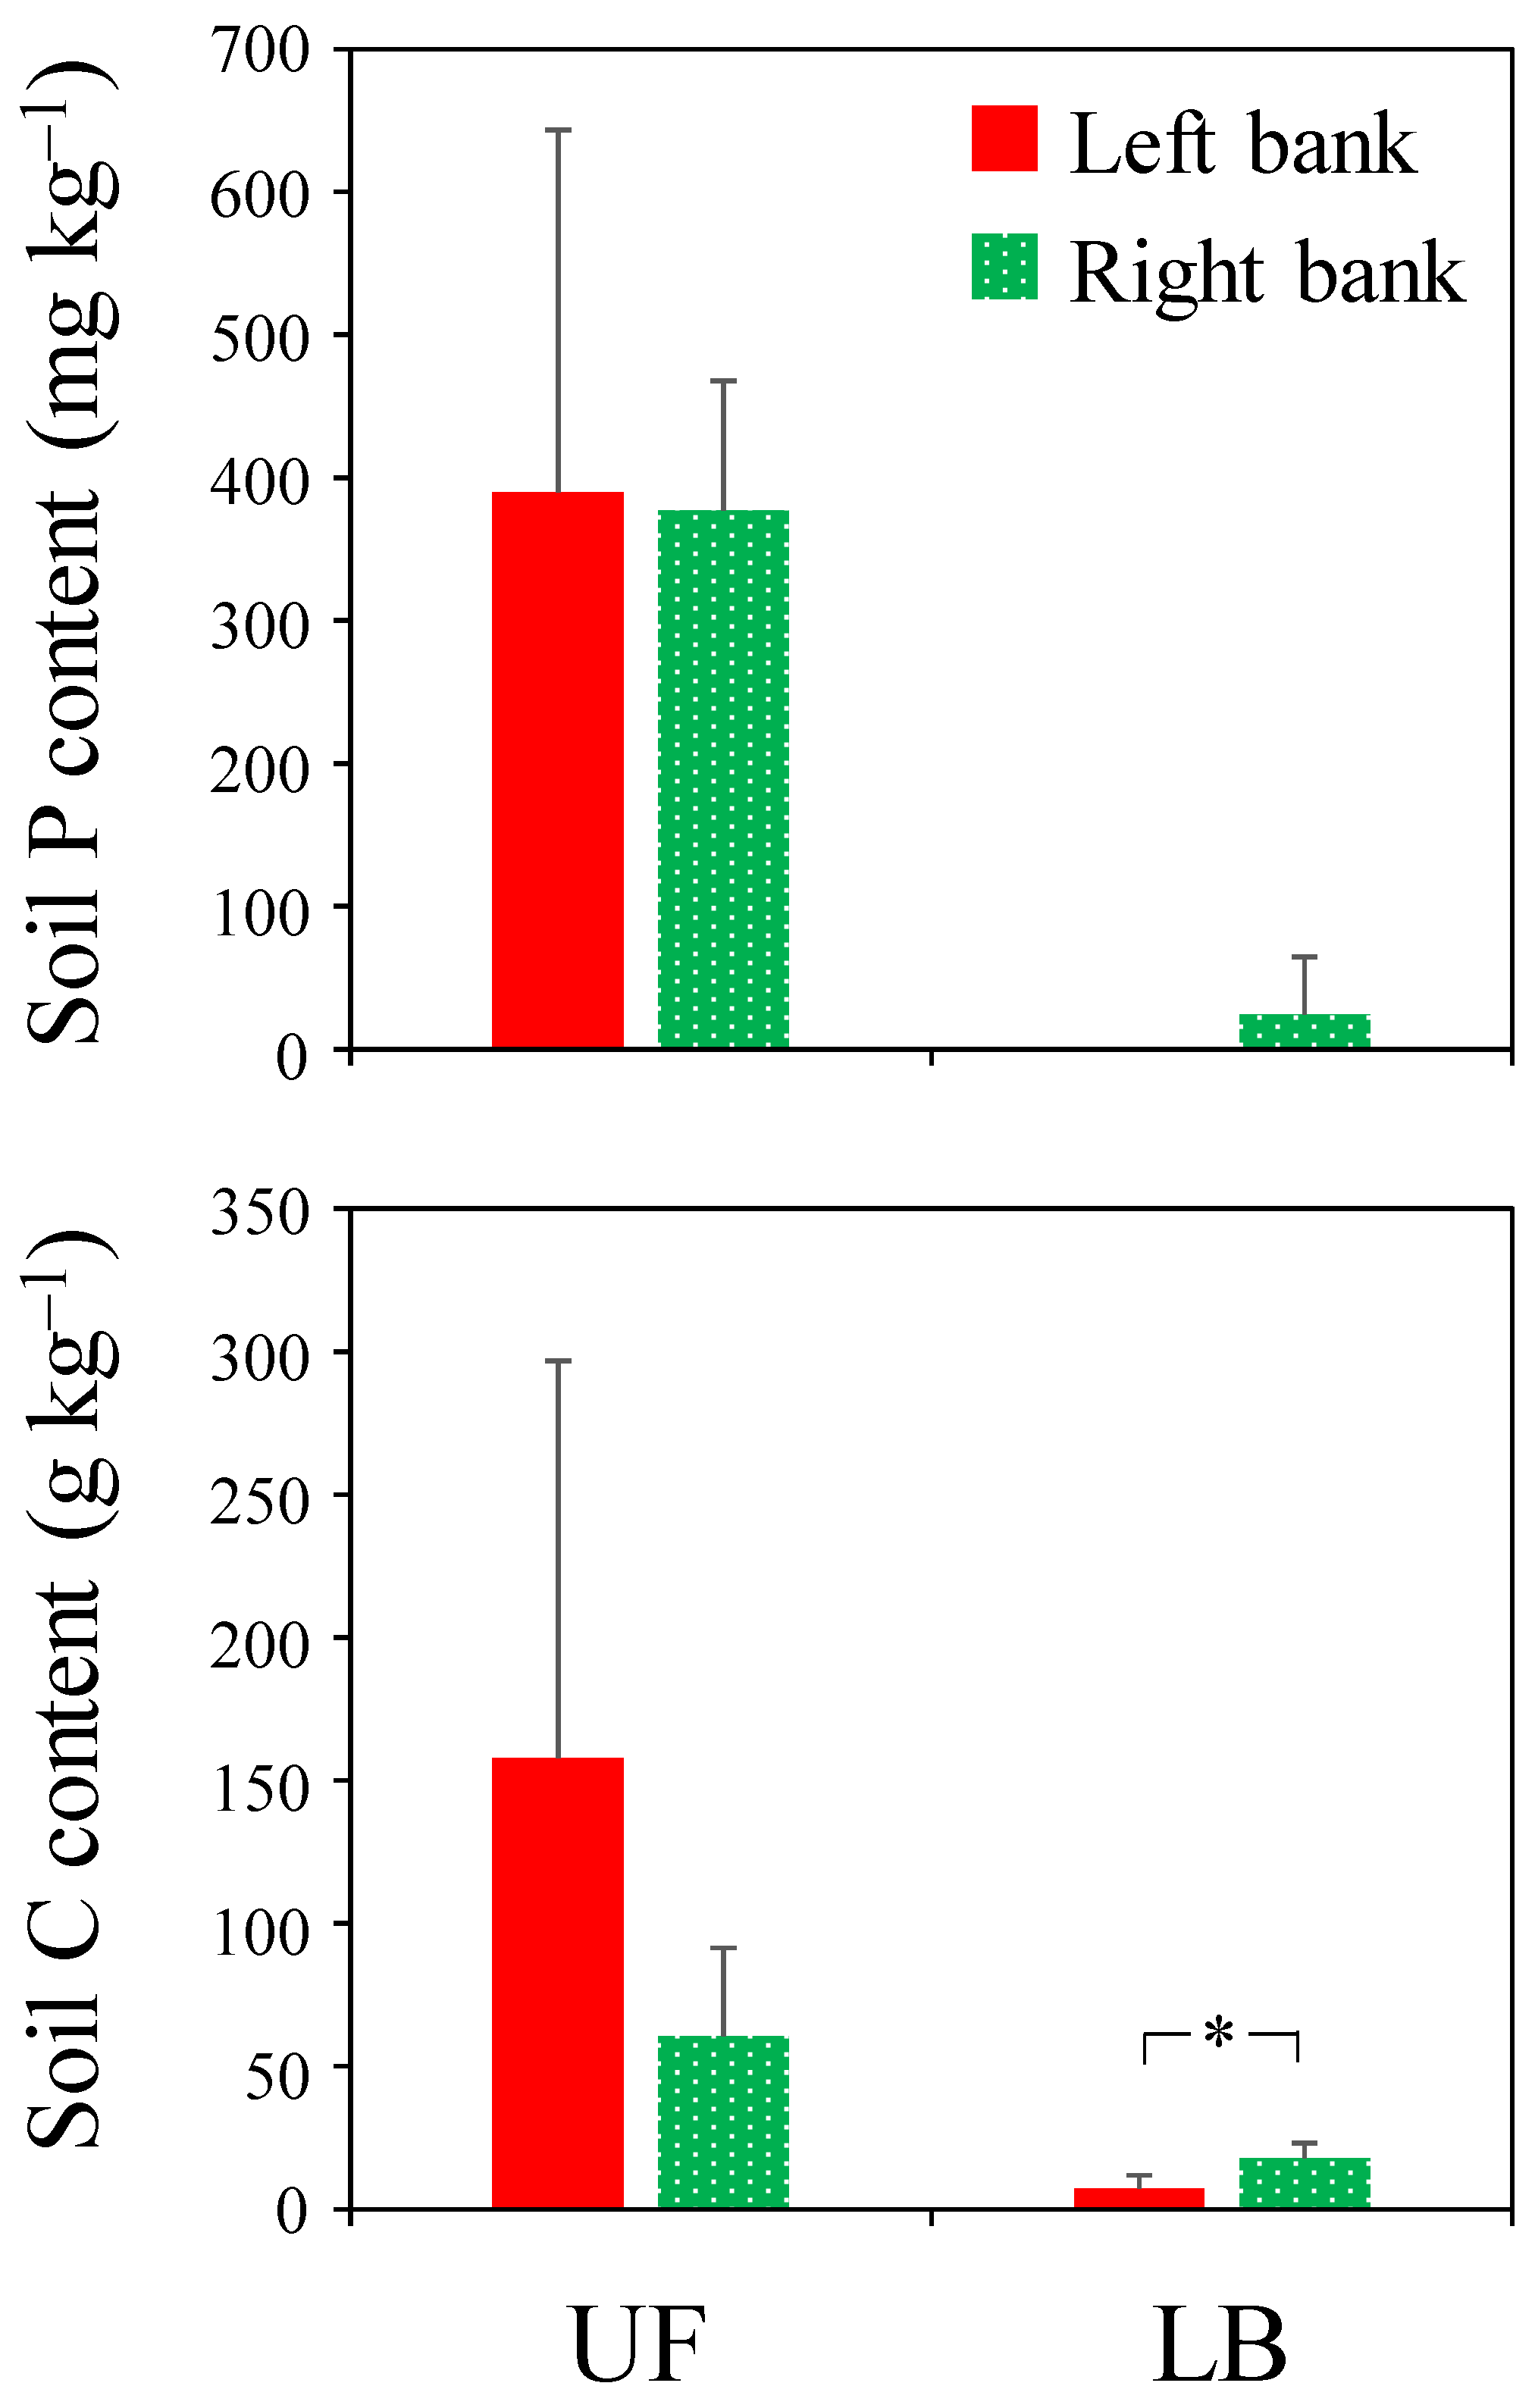
3.1. Soil Phosphorus and Carbon

The soil phosphorus (P) content was significantly higher in the undisturbed forest (UF) catchment than in the landslide-bearing forest (LB) catchment (U-test, p < 0.05; Figure 2). There was no significant difference in the soil P content between the left and right banks in the UF catchment (U-test, p = 0.537). On the other hand, the soil P content in the LB catchment was clearly higher on the right bank than on the left bank, as it was below the detection limit on the left bank.
The soil carbon (C) content was significantly higher in the UF catchment than in the LB catchment (U-test, p < 0.001; Figure 2). There was no significant difference in the soil C content between the left and right banks in the UF catchment (U-test, p = 0.251). On the other hand, the soil C content in the LB catchment was significantly higher on the right bank than on the left bank (U-test, p < 0.01).

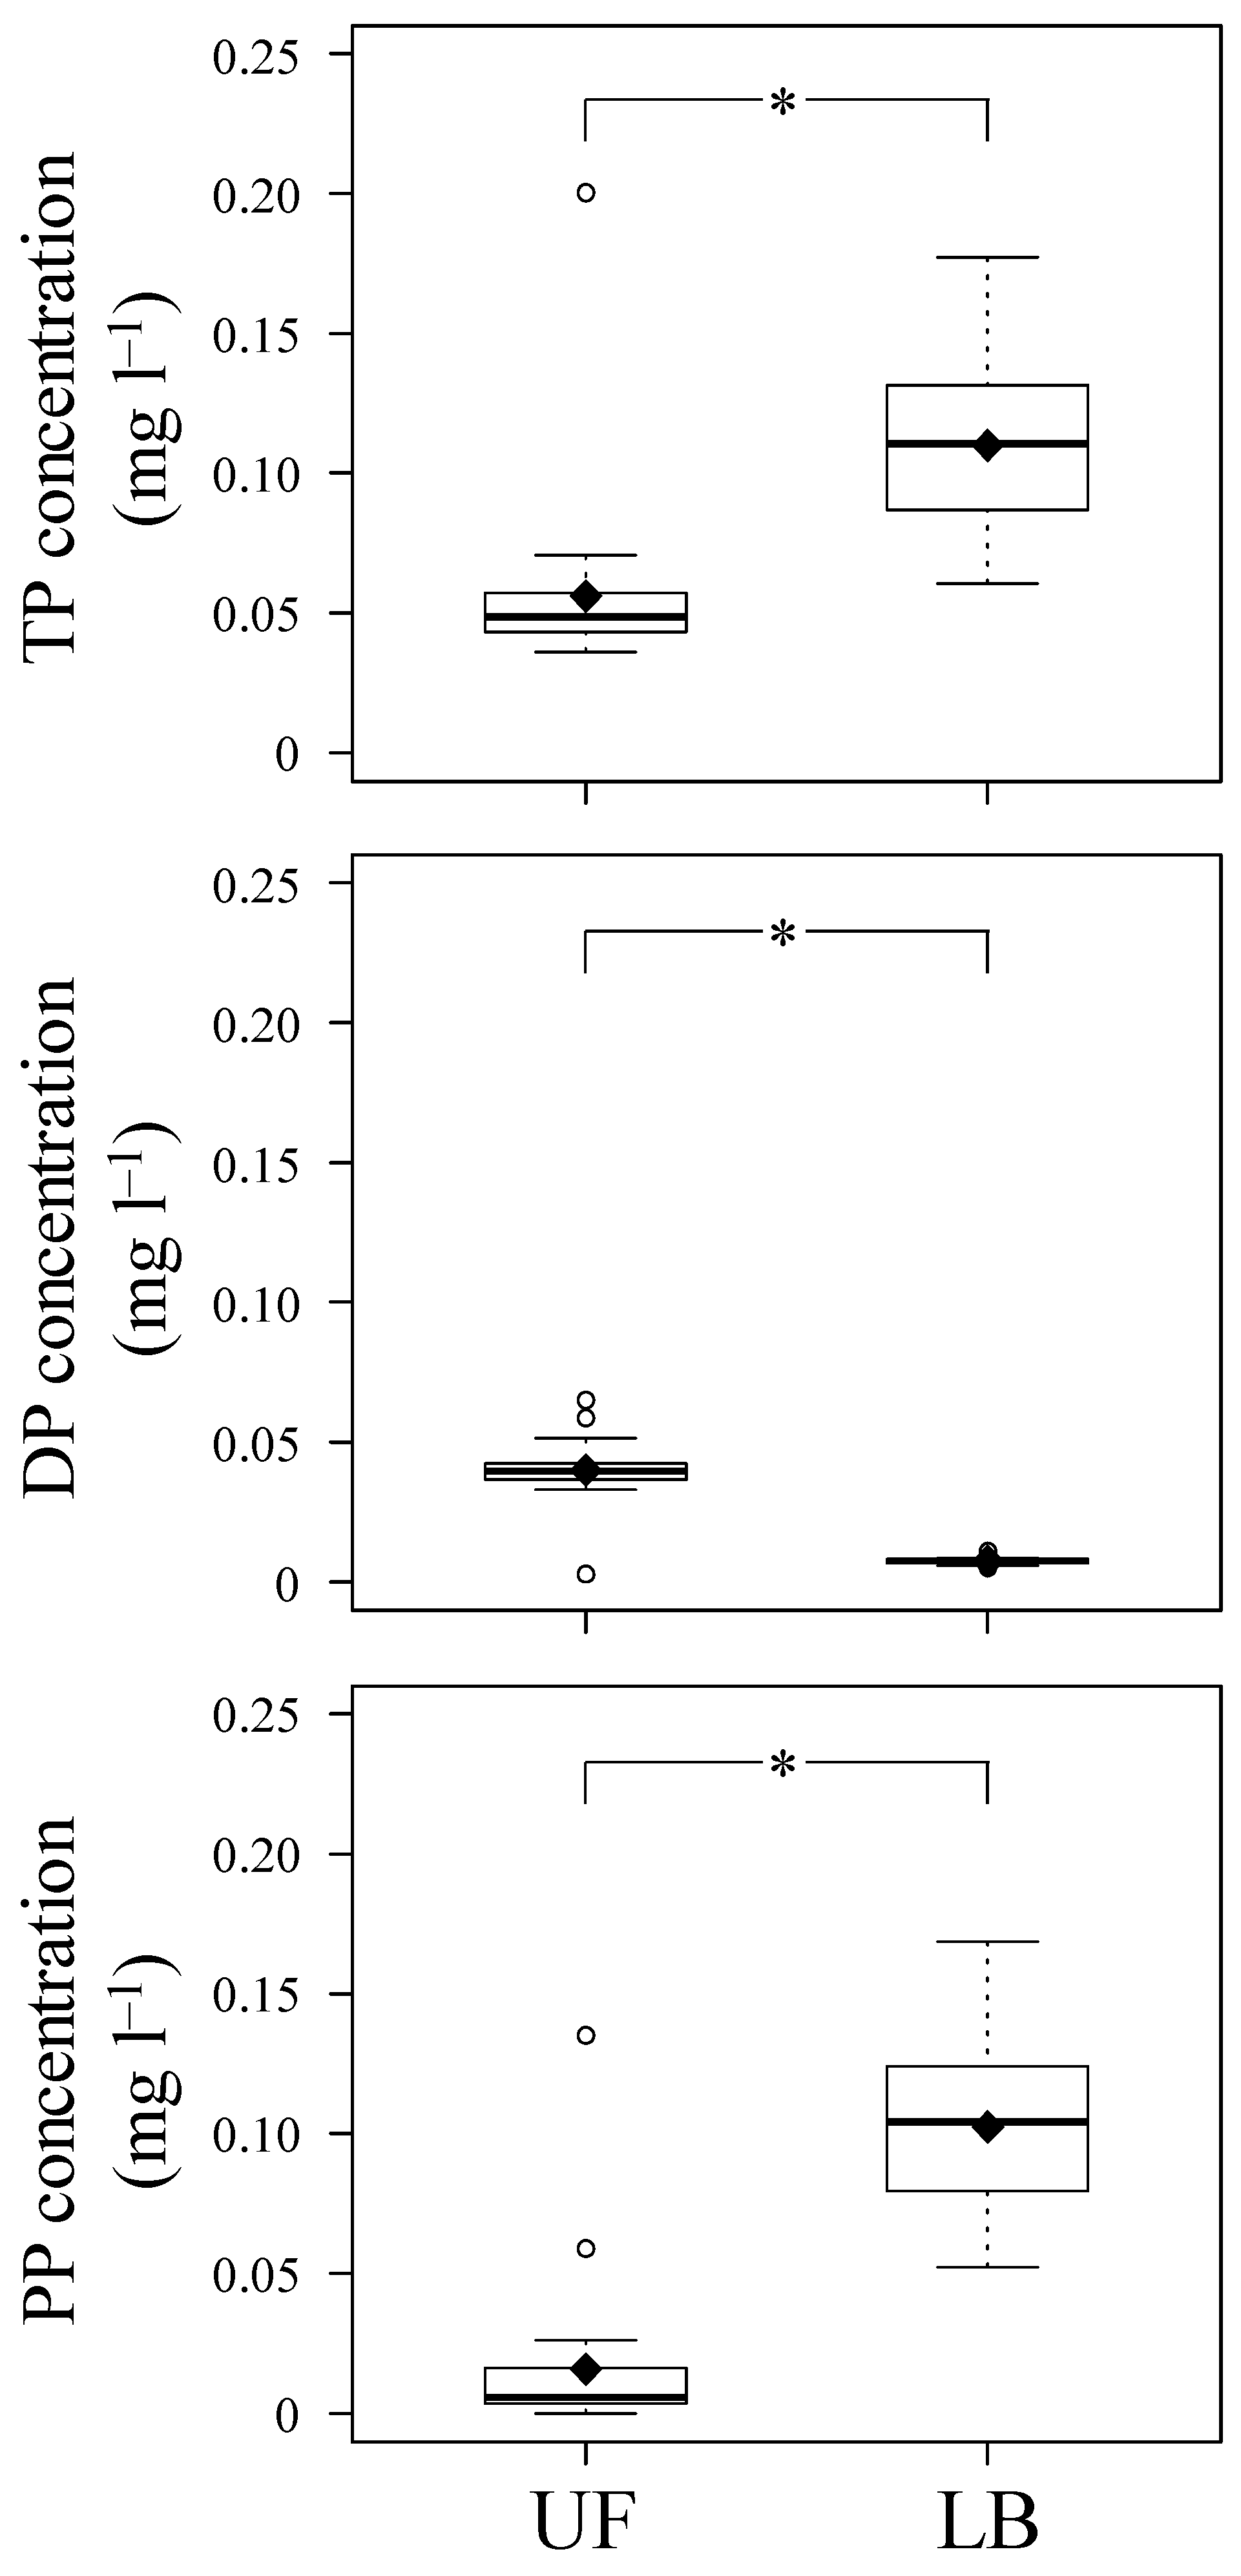
3.2. Stream Phosphorus during Low Flows

The variability in the TP concentration was significantly higher in the LB catchment than in the UF catchment (test of homogeneity of variance, p < 0.001; Figure 3). However, there was no significant difference in the average TP concentration during low flows between the two catchments (U-test, p = 0.148). Similarly, there was no significant difference in the average TP load between the two catchments (U-test, p = 0.272). The TP load during low flows greatly varied depending on runoff in both catchments (Figure A1).

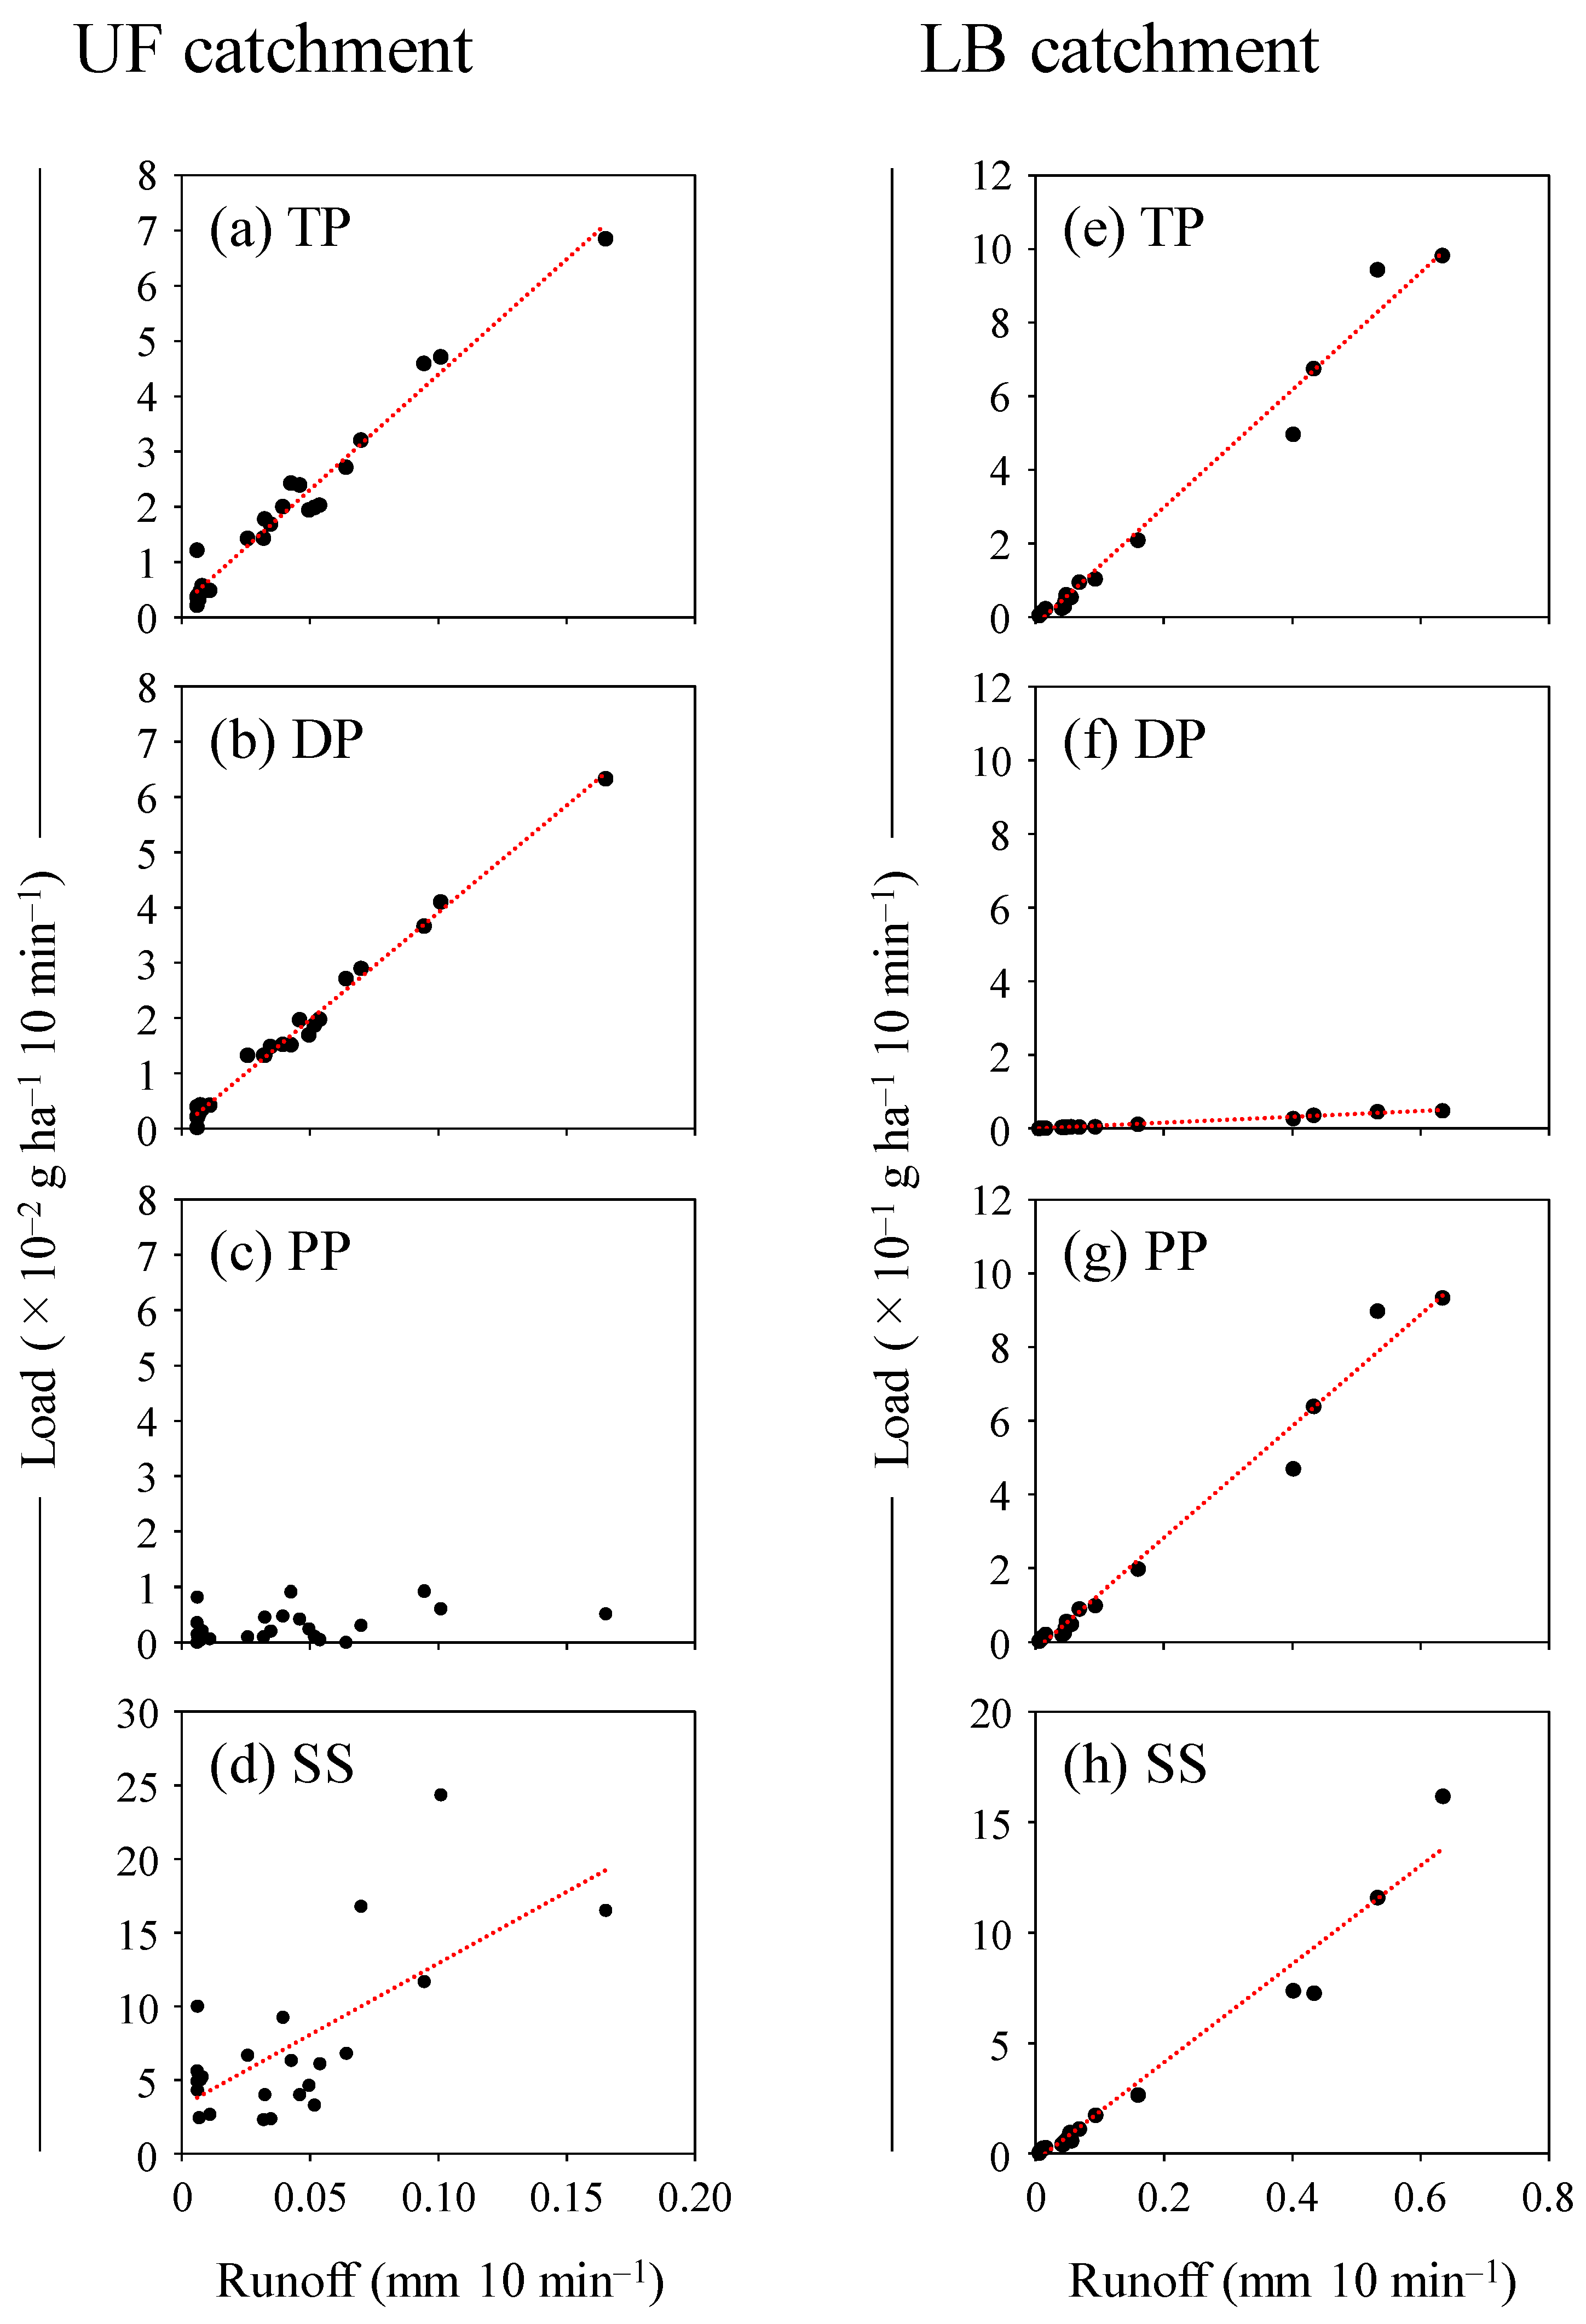
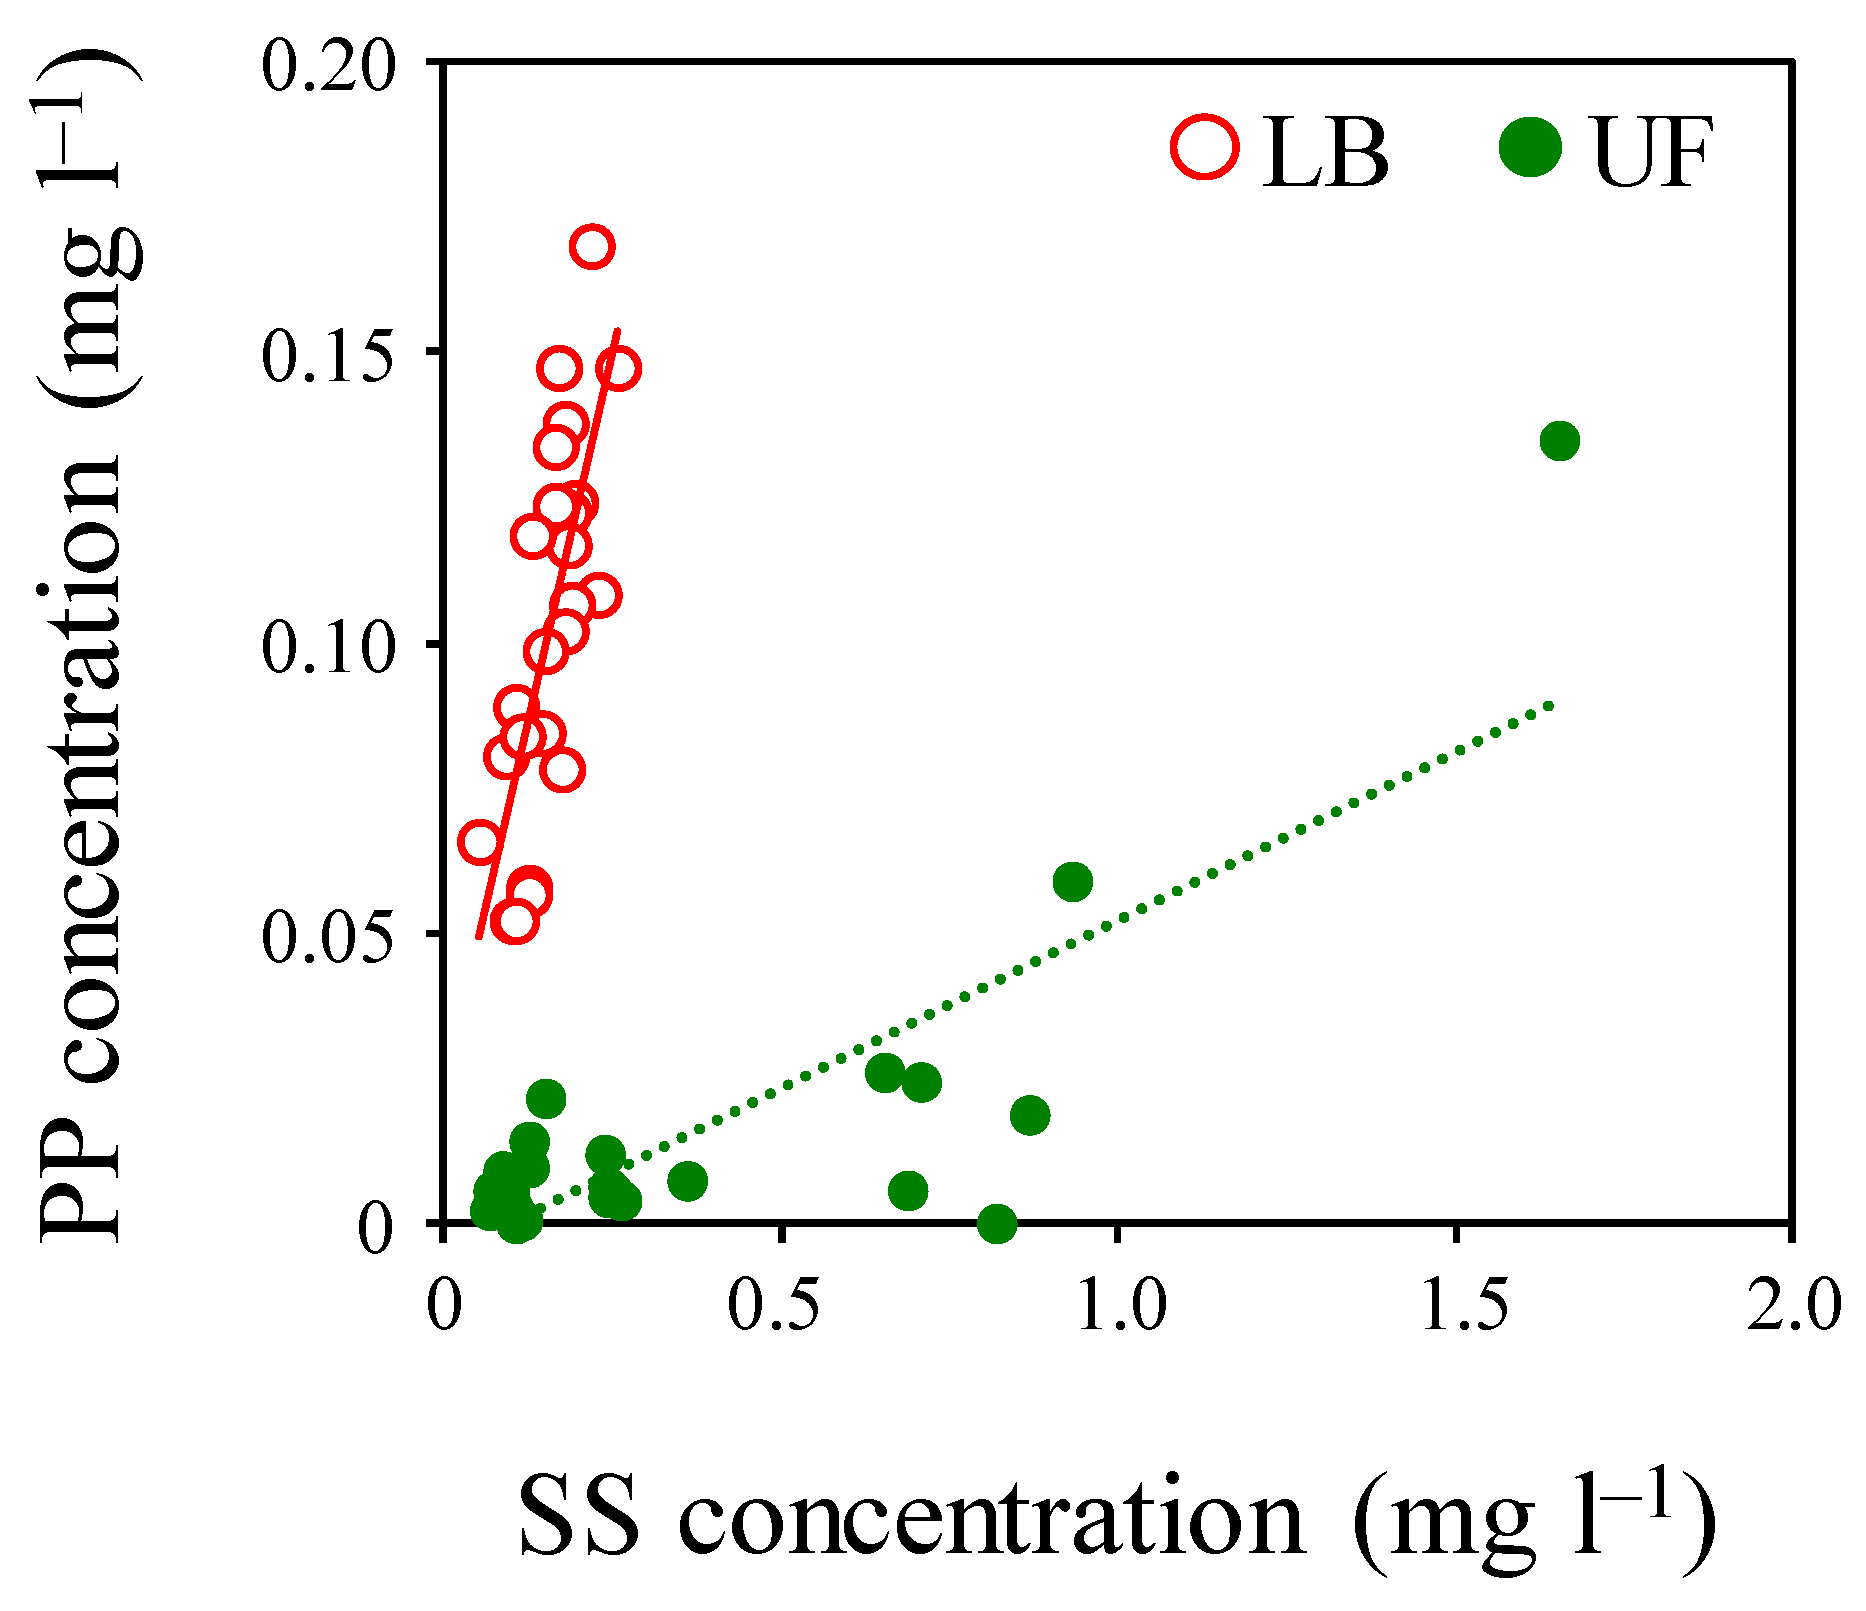
3.3. Stream Phosphorus during a Rain Event

The maximum peak runoff was delayed by just 10 min from the maximum peak rainfall during a rain event in the LB catchment (Figure 4), indicating that runoff rapidly increased in response to rainfall. On the other hand, the maximum peak runoff was delayed by an hour from the maximum peak rainfall in the UF catchment. Additionally, the total amount of runoff during the rain event in the UF catchment was approximately one-third of that in the LB catchment (Table 1). Reflecting these runoff characteristics, TP concentrations in stream water were higher in the LB catchment than in the UF catchment during the rain event, excluding the first water samples (Figure 4). Similarly, PP concentrations were higher in the LB catchment than in the UF catchment, excluding the first water samples, although DP concentrations were generally higher in the UF catchment. The average TP and PP concentrations were significantly higher in the LB catchment than in the UF catchment, whereas the average DP concentration was significantly higher in the UF catchment (U-test, p < 0.001 in all cases; Figure 5). The total TP and PP loads during the rain event were higher by an order of magnitude or more in the LB catchment than in the UF catchment, whereas the total DP load differed little between the two catchments (Table 1). The total DP load accounted for more than 80% of the total TP load in the UF catchment.
DOC concentrations were higher in the UF catchment than in the LB catchment during the rain event (Figure 4). They were slightly higher during the former half of the event than during the latter half in the UF catchment, whereas they changed little during the rain event in the LB catchment. SiO2 concentrations were also higher in the UF catchment than in the LB catchment during the rain event (Figure 4). They slightly increased during the falling (recession) limb of hydrograph in the UF catchment.
The TP, DP, PP, and SS loads were positively proportional to runoff during the rain event in the UF and LB catchments (Figure 6a,b,d–h). However, the slope of the regression line between the PP load and runoff was not statistically significant in the UF catchment (Figure 6c; test for regression slope, p = 0.054). Similarly, the determination coefficient of the regression line between the load and runoff for SS was smaller than those for TP and DP in the UF catchment.
PP concentrations were significantly correlated with SS concentrations during the rain event in the UF and LB catchments (t-test, p < 0.001; Figure 7). The slope of the regression line between the PP and SS concentrations was significantly larger in the LB catchment than in the UF catchment (test of homogeneity of regression, p < 0.001). This represented the larger PP-to-SS ratio in the LB catchment than in the UF catchment. Based on the slopes of the regression lines (Figure 7), approximately 51% and 6% of SS, on average, were made up of PP in the LB and UF catchments, respectively.

4. Discussion

The much higher soil P content in the undisturbed forest (UF) catchment than in the landslide-bearing forest (LB) catchment (Figure 2) indicated that P was accumulated in the surface soils presumably due to litter accumulation, decomposition, and thereby the supply of organic matter and nutrients to the soil surfaces in the cool-temperate forest. This was also supported by the much higher soil C content in the UF catchment than in the LB catchment. Conversely, the LB catchment lacked many sources of litter because the landslide area accounted for more than half of the catchment. The remaining vegetation and soils on the right bank could be sources of stream P in the LB catchment (Figure 1 and Figure 2).
The average TP concentration during low flows was little different between the two catchments (Figure 3). However, the average TP concentration and the total amount of the TP load during the rain event were approximately two and ten times higher in the LB catchment than in the UF catchment, respectively (Figure 5 and Table 1). This was attributable to the absence of forest vegetation and soils in the landslide area of the LB catchment (Figure 1). A much larger amount of runoff and the SS load in the LB catchment than in the UF catchment (Table 1) suggests that surface runoff occurred in the landslide area and contributed to the rapidly increased stream water and the surface erosion during the rain event. This was also supported by the fact that most of the TP was exported in a particulate form, i.e., PP, during the rain event in the LB catchment (Figure 4 and Table 1), although high levels of TP and PP were observed on the first sampling data in the UF catchment possibly due to the collection of P attached to sediments accumulated in the weir during the antecedent period by an automatic sampler. Because the soil P content was undetectable on the left bank in the LB catchment, the remaining forest vegetation on the right bank could supply P to the surface soils. The low coverage of forest vegetation in the LB catchment suggests that canopy and litter interception was insufficient to prevent P-bearing soil surfaces from being impacted by raindrops; thus, a large amount of P attached to surface soils was transported to the stream channel. This was also supported by the strong positive relationships between runoff and the PP and SS loads during the rain event in the LB catchment (Figure 6g,h).
SS has been recognized as a carrier of nutrients in forest streams and particularly tends to adsorb and bond with P [26,44,45]. In the present study, the PP-to-SS ratio during the rain event was, on average, tenfold higher in the LB catchment than in the UF catchment, whereas the SS concentration was much lower in the LB catchment (Figure 7). This was attributable to the fact that finer sediment particles were transported from the LB catchment than from the UF catchment because many substances including nutrients are preferentially associated with a finer fraction of the soil, which has a larger specific surface area [46]. Soil disturbances, such as landslides, break the structure of soil aggregates and thus the fine fraction would become enriched in the sediment particles transported from the landslide area during rain events [47,48,49]. Kyuka et al. [50] reported that the SS yield accounted for approximately 90% of the total sediment yield in the downstream river of our study site, i.e., the Atsuma River. It is therefore plausible that a large amount of P attached to fine sediment particles during rain events was transported from the landslide-bearing forest headwaters in the Eastern Iburi region to the outlet of the Atsuma River.
The average TP concentration during the rain event was little different from that during low flows in the UF catchment even though the total rainfall during the rain event was intense (Figure 3 and Figure 5). Higher levels of SiO2 during the rain event in the UF catchment than in the LB catchment (Figure 4) imply that base flow and subsurface flow made a larger contribution to runoff during the rain event in the UF catchment [51,52,53]. This is also supported by the fact that, during the rain event, the maximum peak runoff was much lower and the lag time between the maximum peak rainfall and runoff was longer in the UF catchment than in the LB catchment (Figure 4), indicating that runoff gradually increased in response to rainfall in the UF catchment.
Most P was exported in a dissolved form (DP), and DP concentrations were generally higher than PP concentrations during the rain event in the UF catchment (Figure 4 and Table 1), suggesting that subsurface flow transported DP from soils to the stream channel. Several studies have reported that most P was exported in a particulate form (PP) from forest catchments [26,27,54,55,56,57,58]. Ide et al. [26,54,59] described that a large amount of PP was intensively exported from a Japanese cypress (Chamaecyparis obtusa) plantation under poor management practices during rain events. This was attributable to the fact that in such plantations, poor management practices have resulted in bare soil surfaces and the subsequent high mobility of soil particles by raindrops. Conversely, in the UF catchment, litter was accumulated, and the organic layer was present because deciduous broad-leaved forest stands were dominant, which was reflected in the higher levels of soil C content and DOC concentration than in the LB catchment. Leaf litter is not only an important source of soil nutrients but also a primary source of dissolved organic matter in forested headwater streams [60,61,62,63,64], and some studies have shown that DOC load was greater in deciduous broad-leaved forests than in other forests, such as coniferous and mixed forests [65,66]. Bol et al. [67] reported that dissolved organic P (DOP) is the mobile form of organic P, which principally derives from leaching of plant litter and microbial metabolites, exudation by plant roots, and solubilization of soil organic matter during degradation. DP should contain colloid-associated P and nanoparticle-associated P because the definitions of colloidal and nanoparticulate size ranges overlap with that of the dissolved component of P [68,69,70]. Gottselig et al. [71] showed that the binding of P to the nanoparticulate medium-size fraction was strongly affected by the presence of organic matter. DP and DOC concentrations in the UF catchment were slightly higher during the former half of the rain event than during the latter half (Figure 4), implying that much DOP was leached from subsurface soils to the stream channel with increasing runoff during the rising limb of the hydrograph. This is also supported by the fact that changes in the DP load could be explained mostly by runoff (Figure 6b; Ide et al. [54]). Missong et al. [72] showed that colloids were important in facilitating P leaching from forest topsoils because 12%–91% of the P leached was associated with colloids in soil solutions, depending on the soil types. Taken together, our results suggest that the existence of forest stands plays an important role not only in intercepting rainfall, controlling runoff, and preventing surface soil erosion, but also in changing the chemical composition of stream P by supplying organic matter to soil surfaces in cool-temperate forests.

5. Conclusions

This study investigated the effects of vegetation on phosphorus runoff in a cool-temperate forest in northern Japan by comparing the soil P content and the stream TP concentration and load between the undisturbed (UF) and the landslide-bearing small forest (LB) catchments. We found that a much larger amount of TP was exported in the LB catchment than in the UF catchment during an intense rain event even though the soil P content was much lower in the LB catchment. This indicates that low coverage of forest vegetation and soils in the catchment increased runoff and thereby enhanced the mobility of P attached to sediment particles, leading to a large P loss. In other words, our results indicate that forest vegetation could control runoff and P transport processes during an intensive rain event. Additionally, the higher proportion of DP than PP in TP in the UF catchment suggests that the existence of forest vegetation and soils affects the P forms in stream water in the cool-temperate forest. Because this study targeted just one intensive rain event, further research is needed to more accurately understand P transport processes in cool-temperate forest catchments by targeting multiple rain events with different rainfall intensities.

Author Contributions

Conceptualization, J.I. and Y.A.; Field investigation, J.I., R.N., Y.A. and R.H.; Chemical analysis, R.N., R.H. and I.E.; Data analysis, J.I. and R.N.; Writing—original draft preparation, J.I.; Writing—review and editing, J.I., Y.A., I.E. and T.G. All authors have read and agreed to the published version of the manuscript.

Funding

This work was supported in part by the Grant-in-Aid for Scientific Research (Grant Nos. JP18K11623; JP19K22444; JP 20KK0241; JP21K18113; JP22H02385) from the Japan Society for the Promotion of Science, Joint Usage Research in ADAM from the Research Institute for Sustainable Humanosphere, Kyoto University, the FY2022 special research fund, and the SNC research fund from the Chitose Institute of Science and Technology.

Data Availability Statement

Any data used in this study may be obtained by sending a written request to the corresponding author.

Acknowledgments

We thank Karibu Fukuzawa, Wataru Ishizuka, Hisayuki Wada, and Toshiro Yamada for helping our chemical analyses. We also thank our laboratory members at the Chitose Institute of Science and Technology for helping with the field surveys.

Conflicts of Interest

The authors declare no conflicts of interest.

Appendix A

Figure A1. Hyeto-hydrograph and temporal variations in total phosphorus (TP) concentrations in the undisturbed (UF) and landslide-bearing forest (LB) catchments during the observation period. Note that rainfall data were missing during 11–22 November; runoff data in the UF catchment were missing during 6–9 August and 4 October–10 November; runoff data in the LB catchment were missing during 1–11 April, 6–14 August, 6–19 September, and 4 October–10 November; and the TP concentration data in the LB catchment was missing in June.
Forests 15 00229 g0a1

References

  1. Forber, K.J.; Withers, P.J.A.; Ockenden, M.C.; Haygarth, P.M. The Phosphorus Transfer Continuum: A Framework for Exploring Effects of Climate Change. Agric. Environ. Lett. 2018, 3, 180036. [Google Scholar] [CrossRef]
  2. Jeppesen, E.; Kronvang, B.; Meerhoff, M.; Søndergaard, M.; Hansen, K.M.; Andersen, H.E.; Lauridsen, T.L.; Liboriussen, L.; Beklioglu, M.; Özen, A.; et al. Climate Change Effects on Runoff, Catchment Phosphorus Loading and Lake Ecological State, and Potential Adaptations. J. Environ. Qual. 2009, 38, 1930–1941. [Google Scholar] [CrossRef]
  3. Sinha, E.; Michalak, A.M.; Balaji, V. Eutrophication Will Increase during the 21st Century as a Result of Precipitation Changes. Science 2017, 357, 405–408. [Google Scholar] [CrossRef] [PubMed]
  4. Wang, M.; Kroeze, C.; Strokal, M.; van Vliet, M.T.H.; Ma, L. Global Change Can Make Coastal Eutrophication Control in China More Difficult. Earth’s Futur. 2020, 8, e2019EF001280. [Google Scholar] [CrossRef]
  5. Gabet, E.J.; Fierer, N.; Chadwick, O.A. Prediction of Sediment-bound Nutrient Delivery from Semi-arid California Watersheds. J. Geophys. Res. Biogeosci. 2005, 110, 1–8. [Google Scholar] [CrossRef]
  6. Lin, Y.; Deng, H.; Du, K.; Rafay, L.; Zhang, G.; Li, J.; Chen, C.; Wu, C.; Lin, H.; Yu, W.; et al. Combined Effects of Climate, Restoration Measures and Slope Position in Change in Soil Chemical Properties and Nutrient Loss across Lands Affected by the Wenchuan Earthquake in China. Sci. Total Environ. 2017, 596–597, 274–283. [Google Scholar] [CrossRef]
  7. Villa, P.; Bresciani, M.; Bolpagni, R.; Braga, F.; Bellingeri, D.; Giardino, C. Impact of Upstream Landslide on Perialpine Lake Ecosystem: An Assessment Using Multi-Temporal Satellite Data. Sci. Total Environ. 2020, 720, 137627. [Google Scholar] [CrossRef] [PubMed]
  8. Otsuki, K.; Kume, A.; Ogawa, S. Forest Management in Japan. In Proceedings of the Japan-Korea Joint Seminar on Hydrology and Water Resources, Fukuoka, Japan, 26–28 November 2001; pp. 1–12. [Google Scholar]
  9. Miura, S.; Ugawa, S.; Yoshinaga, S.; Yamada, T.; Hirai, K. Floor Cover Percentage Determines Splash Erosion in Chamaecyparis Obtusa Forests. Soil Sci. Soc. Am. J. 2015, 79, 1782–1791. [Google Scholar] [CrossRef]
  10. Pimentel, D.; Harvey, C.; Resosudarmo, P.; Sinclair, K.; Kurz, D.; McNair, M.; Crist, S.; Shpritz, L.; Fitton, L.; Saffouri, R.; et al. Environmental and Economic Costs of Soil Erosion and Conservation Benefits. Science 1995, 267, 1117–1123. [Google Scholar] [CrossRef] [PubMed]
  11. Durán Zuazo, V.H.; Rodríguez Pleguezuelo, C.R. Soil-Erosion and Runoff Prevention by Plant Covers. A Review. Agron. Sustain. Dev. 2008, 28, 65–86. [Google Scholar] [CrossRef]
  12. Binkley, D.; Burnham, H.; Lee Allen, H. Water Quality Impacts of Forest Fertilization with Nitrogen and Phosphorus. For. Ecol. Manage. 1999, 121, 191–213. [Google Scholar] [CrossRef]
  13. Carpenter, S.R.; Caraco, N.F.; Correll, D.L.; Howarth, R.W.; Sharpley, A.N.; Smith, V.H. Nonpoint Pollution of Surface Waters with Phosphorus and Nitrogen. Ecol. Appl. 1998, 8, 559–568. [Google Scholar] [CrossRef]
  14. Ide, J.; Takeda, I.; Somura, H.; Mori, Y.; Sakuno, Y.; Yone, Y.; Takahashi, E. Impacts of Hydrological Changes on Nutrient Transport from Diffuse Sources in a Rural River Basin, Western Japan. J. Geophys. Res. Biogeosci. 2019, 124, 2565–2581. [Google Scholar] [CrossRef]
  15. Brett, M.T.; Arhonditsis, G.B.; Mueller, S.E.; Hartley, D.M.; Frodge, J.D.; Funke, D.E. Non-Point-Source Impacts on Stream Nutrient Concentrations along a Forest to Urban Gradient. Environ. Manag. 2005, 35, 330–342. [Google Scholar] [CrossRef]
  16. Jordan, T.E.; Correll, D.L.; Weller, D.E. Relating Nutrient Discharges from Watersheds to Land Use and Streamflow Variability. Water Resour. Res. 1997, 33, 2579–2590. [Google Scholar] [CrossRef]
  17. Osborne, L.; Wiley, M. Empirical Relationships between Land Use/Cover and Stream Water Quality in an Agricultural Watershed. J. Environ. Manag. 1988, 26, 9–27. [Google Scholar]
  18. Salvia-Castellví, M.; François Iffly, J.; Vander Borght, P.; Hoffmann, L. Dissolved and Particulate Nutrient Export from Rural Catchments: A Case Study from Luxembourg. Sci. Total Environ. 2005, 344, 51–65. [Google Scholar] [CrossRef] [PubMed]
  19. Tufford, D.L.; McKellar, H.N.; Hussey, J.R. In-Stream Nonpoint Source Nutrient Prediction with Land-Use Proximity and Seasonality. J. Environ. Qual. 1998, 27, 100–111. [Google Scholar] [CrossRef]
  20. Tufford, D.L.; Samarghitan, C.L.; McKellar, H.N.; Porter, D.E.; Hussey, J.R. Impacts of Urbanization on Nutrient Concentrations in Small Southeastern Coastal Streams. J. Am. Water Resour. Assoc. 2003, 39, 301–312. [Google Scholar] [CrossRef]
  21. Wahl, M.H.; McKellar, H.N.; Williams, T.M. Patterns of Nutrient Loading in Forested and Urbanized Coastal Streams. J. Exp. Mar. Bio. Ecol. 1997, 213, 111–131. [Google Scholar] [CrossRef]
  22. Correll, D.L. The Role of Phosphorus in the Eutrophication of Receiving Waters: A Review. J. Environ. Qual. 1998, 27, 261. [Google Scholar] [CrossRef]
  23. Lennon, J.; Pfaff, L. Source and Supply of Terrestrial Organic Matter Affects Aquatic Microbial Metabolism. Aquat. Microb. Ecol. 2005, 39, 107–119. [Google Scholar] [CrossRef]
  24. Jansson, M.; Berggren, M.; Laudon, H.; Jonsson, A. Bioavailable Phosphorus in Humic Headwater Streams in Boreal Sweden. Limnol. Oceanogr. 2012, 57, 1161–1170. [Google Scholar] [CrossRef]
  25. Bowes, M.J.; House, W.A. Phosphorus and Dissolved Silicon Dynamics in the River Swale Catchment, UK: A Mass-Balance Approach. Hydrol. Process. 2001, 280, 261–280. [Google Scholar] [CrossRef]
  26. Ide, J.; Haga, H.; Chiwa, M.; Otsuki, K. Effects of Antecedent Rain History on Particulate Phosphorus Loss from a Small Forested Watershed of Japanese Cypress (Chamaecyparis Obtusa). J. Hydrol. 2008, 352, 322–335. [Google Scholar] [CrossRef]
  27. Meyer, J.L.; Likens, G.E. Transport and Transformation of Phosphorus in a Forest Stream Ecosystem. Ecology 1979, 60, 1255. [Google Scholar] [CrossRef]
  28. Osaka, K.; Chishiro, S.; Matsumoto, Y.; Iwata, T.; Okuda, N. Hydrological Control of the Chemical Characteristics of Suspended Particulate Phosphorus in the Yasu River Watershed, Japan: Implications for Its Source and Bioavailability. Hydrol. Process. 2022, 36, e14734. [Google Scholar] [CrossRef]
  29. Likens, G.E. A Long-Term Record of Ice Cover for Mirror Lake, New Hampshire: Effects of Global Warming? SIL Proc. 1922–2010 2000, 27, 2765–2769. [Google Scholar] [CrossRef]
  30. Stottlemyer, R.; Toczydlowski, D. Effect of Reduced Winter Precipitation and Increased Temperature on Watershed Solute Flux, 1988–2002, Northern Michigan. Biogeochemistry 2006, 77, 409–440. [Google Scholar] [CrossRef]
  31. Pendergrass, A.G.; Knutti, R. The Uneven Nature of Daily Precipitation and Its Change. Geophys. Res. Lett. 2018, 45, 11980–11988. [Google Scholar] [CrossRef]
  32. Fujibe, F.; Yamazaki, N.; Katsuyama, M.; Kobayashi, K. The Increasing Trend of Intense Precipitation in Japan Based on Four-Hourly Data for a Hundred Years. SOLA 2005, 1, 41–44. [Google Scholar] [CrossRef]
  33. Fujibe, F.; Yamazaki, N.; Kobayashi, K. Long-Term Changes of Heavy Precipitation and Dry Weather in Japan (1901–2004). J. Meteorol. Soc. Japan 2006, 84, 1033–1046. [Google Scholar] [CrossRef]
  34. Park, J.; Duan, L.; Kim, B.; Mitchell, M.J.; Shibata, H. Potential Effects of Climate Change and Variability on Watershed Biogeochemical Processes and Water Quality in Northeast Asia. Environ. Int. 2010, 36, 212–225. [Google Scholar] [CrossRef] [PubMed]
  35. Bolan, N.S.; Adriano, D.C.; Kunhikrishnan, A.; James, T.; McDowell, R.; Senesi, N. Dissolved Organic Matter: Biogeochemistry, Dynamics, and Environmental Significance in Soils. In Advances in Agronomy Vol.110; Sparks, D.L., Ed.; Elsevier: Burlington, NJ, USA, 2011; pp. 1–75. ISBN 978-0-12-385531-2. [Google Scholar]
  36. Kortelainen, P.; Mattsson, T.; Finér, L.; Ahtiainen, M.; Saukkonen, S.; Sallantaus, T. Controls on the Export of C, N, P and Fe from Undisturbed Boreal Catchments, Finland. Aquat. Sci. 2006, 68, 453–468. [Google Scholar] [CrossRef]
  37. Prescott, C.E.; Vesterdal, L. Decomposition and Transformations along the Continuum from Litter to Soil Organic Matter in Forest Soils. For. Ecol. Manag. 2021, 498, 119522. [Google Scholar] [CrossRef]
  38. Ward, N.D.; Richey, J.E.; Keil, R.G. Temporal Variation in River Nutrient and Dissolved Lignin Phenol Concentrations and the Impact of Storm Events on Nutrient Loading to Hood Canal, Washington, USA. Biogeochemistry 2012, 111, 629–645. [Google Scholar] [CrossRef]
  39. Ritonga, R.P.; Gomi, T.; Tarigan, S.D.; Kaswanto, R.L.; Kharismalatri, H.S.; Noviandi, R.; Arata, Y.; Ishikawa, Y. Land Cover and Characteristics of Landslides Induced by the 2018 Mw 6.7 Eastern Iburi Earthquake, Hokkaido. Int. J. Eros. Control Eng. 2021, 13, 76–83. [Google Scholar] [CrossRef]
  40. Istiyanti, M.L.; Goto, S. Characteristics of Physical Properties of the Sliding and Its Surrounding Layers in Landslides Caused by the 2018 Hokkaido Eastern Iburi Earthquake. Geoenvironmental Disasters 2022, 9, 21. [Google Scholar] [CrossRef]
  41. Nakata, Y.; Hayamizu, M.; Ishiyama, N. Assessing Primary Vegetation Recovery from Earthquake-Induced Landslide Scars: A Real-Time Kinematic Unmanned Aerial Vehicle Approach. Ecol. Eng. 2023, 193, 107019. [Google Scholar] [CrossRef]
  42. Japan Meteorological Agency Past Meteorological Data. Available online: http://www.data.jma.go.jp/obd/stats/etrn/index.php (accessed on 23 November 2023).
  43. Namiki, H. (Ed.) Analytical Method of Water Quality for Industrial Wastewater (JIS K0102); Japan Industrial Standard Association: Tokyo, Japan, 1993. (In Japanese) [Google Scholar]
  44. Holtan, H.; Kamp-Nielsen, L.; Stuanes, A.O. Phosphorus in Soil, Water and Sediment: An Overview. Hydrobiologia 1988, 170, 19–34. [Google Scholar] [CrossRef]
  45. Paudel, B.; Montagna, P.A.; Adams, L. The Relationship between Suspended Solids and Nutrients with Variable Hydrologic Flow Regimes. Reg. Stud. Mar. Sci. 2019, 29, 100657. [Google Scholar] [CrossRef]
  46. Walling, D.E. Erosion and Sediment Yield Research—Some Recent Perspectives. J. Hydrol. 1988, 100, 113–141. [Google Scholar] [CrossRef]
  47. Sato, H. Watershed Assessment Using Stream Turbidity Based on Suspended Fine Solid Generation and Inorganic-Organic Composition. Bull. Hokkaido For. Res. Inst. 2005, 42, 1–50. (In Japanese) [Google Scholar]
  48. Ewane, E.B.; Lee, H.-H. Effects of Vegetation Cover on Sediment Particle Size Distribution and Transport Processes in Natural Rainfall Conditions on Post-Fire Hillslope Plots in South Korea. Soil Res. 2016, 54, 937. [Google Scholar] [CrossRef]
  49. Schomakers, J.; Mayer, H.; Lee, J.Y.; Lee, T.Y.; Jien, S.H.; Mentler, A.; Hein, T.; Huang, J.C.; Hseu, Z.Y.; Cheng, L.W.; et al. Soil Aggregate Breakdown and Carbon Release along a Chronosequence of Recovering Landslide Scars in a Subtropical Watershed. Catena 2018, 165, 530–536. [Google Scholar] [CrossRef]
  50. Kyuka, T.; Shimizu, Y.; Tanabe, S.; Kon, H.; Okayasu, T.; Hashiba, M.; Tsuchida, K.; Nishiyama, N.; Yamaguchi, S. Changes in Fine Sediment Transport Characteristics in the Atsuma River. Bull. River Cent. Hokkaido 2021, 32, 167–183. (In Japanese) [Google Scholar]
  51. Gomi, T.; Asano, Y.; Uchida, T.; Onda, Y.; Sidle, R.C.; Miyata, S.; Kosugi, K.; Mizugaki, S.; Fukuyama, T.; Fukushima, T. Evaluation of Storm Runoff Pathways in Steep Nested Catchments Draining a Japanese Cypress Forest in Central Japan: A Geochemical Approach. Hydrol. Process. 2010, 24, 550–566. [Google Scholar] [CrossRef]
  52. Klaus, J.; McDonnell, J.J. Hydrograph Separation Using Stable Isotopes: Review and Evaluation. J. Hydrol. 2013, 505, 47–64. [Google Scholar] [CrossRef]
  53. Wels, C.; Cornett, R.J.; Lazerte, B.D. Hydrograph Separation: A Comparison of Geochemical and Isotopic Tracers. J. Hydrol. 1991, 122, 253–274. [Google Scholar] [CrossRef]
  54. Ide, J.; Nagafuchi, O.; Chiwa, M.; Kume, A.; Otsuki, K.; Ogawa, S. Effects of Discharge Level on the Load of Dissolved and Particulate Components of Stream Nitrogen and Phosphorus from a Small Afforested Watershed of Japanese Cypress (Chamaecyparis Obtusa). J. For. Res. 2007, 12, 45–56. [Google Scholar] [CrossRef]
  55. Preston, S.D.; Alexander, R.B.; Schwarz, G.E.; Crawford, C.G. Factors Affecting Stream Nutrient Loads: A Synthesis of Regional SPARROW Model Results for the Continental United States. J. Am. Water Resour. Assoc. 2011, 47, 891–915. [Google Scholar] [CrossRef]
  56. Takeda, I. The Effect of Delayed Thinning on Nonpoint Pollutants from Artificial Coniferous Forests (I). Water Sci. 2002, 265, 1–22. (In Japanese) [Google Scholar]
  57. Takeda, I. The Effect of Delayed Thinning on Nonpoint Pollutants from Artificial Coniferous Forests (II). Water Sci. 2002, 266, 47–71. (in Japanese). [Google Scholar]
  58. Takeda, I. The Effect of Delayed Thinning on Nonpoint Pollutants from Artificial Coniferous Forests (III). Water Sci. 2002, 267, 63–84. (In Japanese) [Google Scholar]
  59. Ide, J.; Chiwa, M.; Higashi, N.; Maruno, R.; Mori, Y.; Otsuki, K. Determining Storm Sampling Requirements for Improving Precision of Annual Load Estimates of Nutrients from a Small Forested Watershed. Environ. Monit. Assess. 2012, 184, 4747–4762. [Google Scholar] [CrossRef] [PubMed]
  60. Abelho, M. From Litterfall to Breakdown in Streams: A Review. Sci. World J. 2001, 1, 656–680. [Google Scholar] [CrossRef] [PubMed]
  61. Berg, B. Nutrient Release from Litter and Humus in Coniferous Forest Soils-a Mini Review. Scand. J. For. Res. 1986, 1, 359–369. [Google Scholar] [CrossRef]
  62. Krishna, M.P.; Mohan, M. Litter Decomposition in Forest Ecosystems: A Review. Energy Ecol. Environ. 2017, 2, 236–249. [Google Scholar] [CrossRef]
  63. Meyer, J.L.; Wallace, J.B. Leaf Litter as a Source of Dissolved Organic Carbon in Streams. Ecosystems 1998, 1, 240–249. [Google Scholar] [CrossRef]
  64. Ge, X.; Zeng, L.; Xiao, W.; Huang, Z.; Geng, X.; Tan, B. Effect of Litter Substrate Quality and Soil Nutrients on Forest Litter Decomposition: A Review. Acta Ecol. Sin. 2013, 33, 102–108. [Google Scholar] [CrossRef]
  65. Amiotte-suchet, P.; Linglois, N.; Leveque, J.; Andreux, F. 13C Composition of Dissolved Organic Carbon in Upland Forested Catchments of the Morvan Mountains (France): Influence of Coniferous and Deciduous Vegetation. J. Hydrol. 2007, 335, 354–363. [Google Scholar] [CrossRef]
  66. Lee, M.-H.; Payeur-Poirier, J.-L.; Park, J.-H.; Matzner, E. Variability in Runoff Fluxes of Dissolved and Particulate Carbon and Nitrogen from Two Watersheds of Different Tree Species during Intense Storm Events. Biogeosciences 2016, 13, 5421–5432. [Google Scholar] [CrossRef]
  67. Bol, R.; Julich, D.; Brödlin, D.; Siemens, J.; Kaiser, K.; Dippold, M.A.; Spielvogel, S.; Zilla, T.; Mewes, D.; von Blanckenburg, F.; et al. Dissolved and Colloidal Phosphorus Fluxes in Forest Ecosystems—An Almost Blind Spot in Ecosystem Research. J. Plant Nutr. Soil Sci. 2016, 179, 425–438. [Google Scholar] [CrossRef]
  68. Martin, J.; Dai, M.; Cauwet, G. Significance of Colloids in the Biogeochemical Cycling of Organic Carbon and Trace Metals in the Venice Lagoon (Italy). Limnol. Oceanogr. 1995, 40, 119–131. [Google Scholar] [CrossRef]
  69. Hill, D.M.; Aplin, A.C. Role of Colloids and Fine Particles in the Transport of Metals in Rivers Draining Carbonate and Silicate Terrains. Limnol. Oceanogr. 2001, 46, 331–344. [Google Scholar] [CrossRef]
  70. Jarvie, H.P.; Neal, C.; Rowland, A.P.; Neal, M.; Morris, P.N.; Lead, J.R.; Lawlor, A.J.; Woods, C.; Vincent, C.; Guyatt, H.; et al. Role of Riverine Colloids in Macronutrient and Metal Partitioning and Transport, along an Upland–Lowland Land-Use Continuum, under Low-Flow Conditions. Sci. Total Environ. 2012, 434, 171–185. [Google Scholar] [CrossRef] [PubMed]
  71. Gottselig, N.; Nischwitz, V.; Meyn, T.; Amelung, W.; Bol, R.; Halle, C.; Vereecken, H.; Siemens, J.; Klumpp, E. Phosphorus Binding to Nanoparticles and Colloids in Forest Stream Waters. Vadose Zone J. 2017, 16, 1–12. [Google Scholar] [CrossRef]
  72. Missong, A.; Holzmann, S.; Bol, R.; Nischwitz, V.; Puhlmann, H.; Wilpert, K.V.; Siemens, J.; Klumpp, E. Leaching of Natural Colloids from Forest Topsoils and Their Relevance for Phosphorus Mobility. Sci. Total Environ. 2018, 634, 305–315. [Google Scholar] [CrossRef] [PubMed]
Figure 1. Location and map of the undisturbed (UF) and landslide-bearing forest (LB) catchments.
Forests 15 00229 g001
Figure 2. Soil phosphorus (P) and carbon (C) contents on the left and right banks of the undisturbed (UF) and landslide-bearing forest (LB) catchments. Error bars represent standard deviations. An asterisk represents a significant difference in the soil C content between the left and right banks (U-test, p < 0.05).
Forests 15 00229 g002
Figure 3. Boxplots for the total phosphorus (TP) concentration and load obtained monthly during the observation period in the undisturbed (UF) and landslide-bearing forest (LB) catchments. Closed diamonds and open circles represent mean and outlier values, respectively. Whiskers represent highest and lowest values within 1.5 times the interquartile range.
Forests 15 00229 g003
Figure 4. Hyeto-hydrograph and temporal variations in concentrations of total phosphorus (TP), dissolved phosphorus (DP), particulate phosphorus (PP), dissolved organic carbon (DOC), and dissolved silica (SiO2) during a rain event in the undisturbed (UF) and landslide-bearing forest (LB) catchments.
Forests 15 00229 g004
Figure 5. Boxplots for total phosphorus (TP), dissolved phosphorus (DP), and particulate phosphorus (PP) concentrations during a rain event in the undisturbed (UF) and landslide-bearing forest (LB) catchments. Closed diamonds and open circles represent mean and outlier values, respectively. Whiskers represent highest and lowest values within 1.5 times the interquartile range. Asterisks represent significant differences in the concentrations between the two catchments (U-test, p < 0.001).
Forests 15 00229 g005
Figure 6. Relationships between the load and runoff for total phosphorus (TP), dissolved phosphorus (DP), particulate phosphorus (PP), and suspended sediment (SS) during a rain event in the undisturbed (UF) and landslide-bearing forest (LB) catchments. Broken lines represent regression lines ((a) y = 41.68x + 0.22, R2 = 0.97; (b) y = 38.75x + 0.04, R2 = 0.99; (d) y = 97.01x + 3.22, R2 = 0.49; (e) y = 15.94x–0.22, R2 = 0.98; (f) y = 0.79x, R2 = 0.99; (g) y = 15.15x–0.20, R2 = 0.98; (h) y = 22.3x–0.33, R2 = 0.97). Note that the slope of the regression line between the PP load and runoff in the UF catchment was not statistically significant (p = 0.054); hence, no line is shown in (c).
Forests 15 00229 g006
Figure 7. Relationship between particulate phosphorus (PP) and suspended sediment (SS) concentrations during a rain event in the undisturbed (UF) and landslide-bearing forest (LB) catchments. Broken and solid lines represent regression lines in the UF and LB catchments, respectively (UF: y = 0.06x + 0.01, R2 = 0.65; LB: y = 0.51x + 0.02, R2 = 0.55).
Forests 15 00229 g007
Table 1. Rainfall, runoff, runoff coefficient, and the total load of total phosphorus (TP), dissolved phosphorus (DP), particulate phosphorus (PP), and suspended sediment (SS) during an intensive rain event in the undisturbed (UF) and landslide-bearing forest (LB) catchments.
UF CatchmentLB Catchment
Rainfall (mm d−1)49.0
Runoff (mm d−1)5.715.7
Runoff coefficient0.10.3
TP load (g ha−1 d−1)2.723.6
DP load (g ha−1 d−1)2.31.3
PP load (g ha−1 d−1)0.422.4
SS load (g ha−1 d−1)10.332.4
Disclaimer/Publisher’s Note: The statements, opinions and data contained in all publications are solely those of the individual author(s) and contributor(s) and not of MDPI and/or the editor(s). MDPI and/or the editor(s) disclaim responsibility for any injury to people or property resulting from any ideas, methods, instructions or products referred to in the content.

