Article

Estimation of Carbon and Nitrogen Contents in Forest Ecosystems in the Background Areas of the Russian Arctic (Murmansk Region)

Institute of Industrial Ecology Problems of the North, Kola Scientific Centre, Russian Academy of Sciences, 184209 Apatity, Russia
*
Authors to whom correspondence should be addressed.
Forests 2024, 15(1), 29; https://doi.org/10.3390/f15010029
Submission received: 8 November 2023 / Revised: 6 December 2023 / Accepted: 20 December 2023 / Published: 22 December 2023
(This article belongs to the Special Issue Monitoring of Forest Ecosystems at Different Scales)

Abstract

:
In this study, carbon and nitrogen contents in the undisturbed terrestrial ecosystems in the northern taiga zone of Russia’s Murmansk region were estimated. The goal of this study was to examine the carbon and nitrogen dynamics in atmospheric precipitation, assimilating organs of coniferous trees (Picea obovata and Pinus sylvestris), needle litter, soils, and soil water. The objects of our research were the most common dwarf shrub-green moss spruce forests and lichen-dwarf shrub pine forests of the boreal zone. The study was carried out on permanent plots between 1999 and 2020. The long-term dynamics of carbon concentrations in snow demonstrated a trend towards increasing carbon concentrations in forested and treeless areas of the Murmansk region. It was shown that in representative spruce and pine forests, the concentrations and atmospheric precipitation of carbon compounds and carbon leaching with soil water were higher below the tree crowns, compared to between the crowns. In soil water, a decrease was found in carbon concentration with the soil profile depth. For soils, the highest carbon concentrations were found in the organic and illuvial soil horizons. The main soil sinks of carbon and nitrogen in northern taiga forests were found to be located in the organic soil horizon below the crowns. In northern taiga forests, the carbon content of living Picea obovata and Pinus sylvestris needles and Pinus sylvestris needle litter had minor variability; no significant interbiogeocoenotic and age differences were found. We found that the nitrogen content in brown needles and needle litter was significantly lower compared to photosynthetically active needles, probably due to retranslocation processes (withdrawal before needle abscission), corroborating the literature in the results session. The largest stocks of carbon and nitrogen in northern taiga forests are concentrated in the soil organic horizon, and the removal of these elements with soil water is insignificant. Carbon and nitrogen stocks in living and fallen needles are lower than in soil. The least amount of carbon and nitrogen is contained in atmospheric precipitation.

1. Introduction

Long-term monitoring of forest ecosystems is an important activity to assess and predict the condition of forests. Within the framework of monitoring, quantitative assessment of carbon and nitrogen cycle components, which are sensitive indicators of the condition of organic matter in forest ecosystems, is important and necessary. Presently, close attention, both internationally and nationally, is paid to assessing the contribution of terrestrial ecosystems to the regulation of carbon cycles, which indicates the need to collect data on the carbon and nitrogen content and stocks in various climatic zones and in various ecosystems. The regional calculation of the carbon budget of forests is an important topic to confirm the sink role of forests, as temperate and boreal forests are considered important carbon sinks. That said, N is an important limiting factor for vegetation growth, especially in cold temperate and boreal forests, where N addition significantly increases primary productivity and carbon uptake. Many research groups have conducted large-scale studies of carbon and nitrogen contents in various components of forest biogeocenoses—terrestrial and underground biomass fractions, soil, atmospheric deposition, soil water, and others [1,2,3,4,5,6,7,8]. However, the carbon and nitrogen contents in various components of representative northern taiga forests of the Murmansk region remain poorly studied.
The Murmansk region is the northernmost region of European Russia, located north of the Arctic Circle and completely within the Russian Arctic. Climate change has a significant impact on the natural environment of the Arctic. Forest ecosystems are exposed to multiple stress agents, a combination of natural and anthropogenic agents. Northern taiga forests are characterized by low productivity and low forest stand heights with a minor amount of undergrowth. The low productivity of the forest ecosystems at the northern forest line is due to a combination of low temperatures and a short growing season [9].
Soil factors largely control the direction of metabolic processes in biogeocoenoses and the productivity of phytocoenoses and determine the productivity of soil biota [10]. The controlling factors of soil-forming processes in the Far North are low ambient temperatures, an abundance of precipitation combined with low evaporation, and low ash content of plant litter [11,12,13]. Conifer litter is one of the most important factors in the biogeochemical cycles of forest ecosystems, acting as a source of organic carbon and mineral nutrients that become available to biota as a result of decomposition and mineralization, especially in northern forest ecosystems where nitrogen depositions are low. Litter quantity and quality are influenced by climate [14], the composition of plant communities, and the age of dominant plants, etc. [15,16]. Carbon is the main component of atmospheric precipitation and originates from both biogenic and anthropogenic sources. The transfer of organic carbon from the atmosphere to the soil surface occurs in the form of wet (through precipitation) and dry (by deposition of particles and gases on the surface) deposition. Field studies of carbon fluxes in precipitation are relatively rare, in part because organic matter concentrations in the precipitation and the associated atmospheric deposition rates are not typically measured by large-scale monitoring networks [17,18]. Thus, quantitatively estimating the supply of carbon with atmospheric deposition into forest ecosystems is an important component of biogeochemical studies.
Most soil chemical reactions take place in the soil solution, which also plays a vital role in soil formation, plant nutrition, and the activity of soil biota [19,20]. The soil solution acts as the link between the solid phase of the soil and the roots of plants, since all nutrients, as well as potentially toxic substances, enter the roots through this pathway. In this connection, the soil solution chemistry can serve as an indicator of the impact of atmospheric pollution and other stress factors on forest ecosystems. Dissolved organic matter (DOM) in soils plays an important role in the biogeochemical carbon, nitrogen, and phosphorus cycles, soil formation, and pollutant transport. The most important sources of DOM in soils are litter and humus [21]. Despite ongoing research, knowledge about the formation of DOM in soils and its response to changes in the natural environment and climate is still limited [21,22,23,24,25]. Long-term studies of DOM transport in soils and its removal from the soil layer are few in Russia [9,26,27,28,29]. More research is needed into the dynamics of DOM in soils of different nature zones and under different types of land use. In addition, when studying carbon and nitrogen cycles, a coupled analysis of various components of forest ecosystems (atmospheric precipitation, soils, soil water, phytomass, and mortmass) is important, taking into account the intra- and interbiogeocoenotic vegetation cover mosaics.
The goal of this study is to estimate the content and dynamics of carbon and nitrogen in the main components (atmospheric precipitation, assimilating organs of woody plants, soils, litter) of northern taiga forests in the background areas of the Russian Arctic, specifically in the Murmansk region.

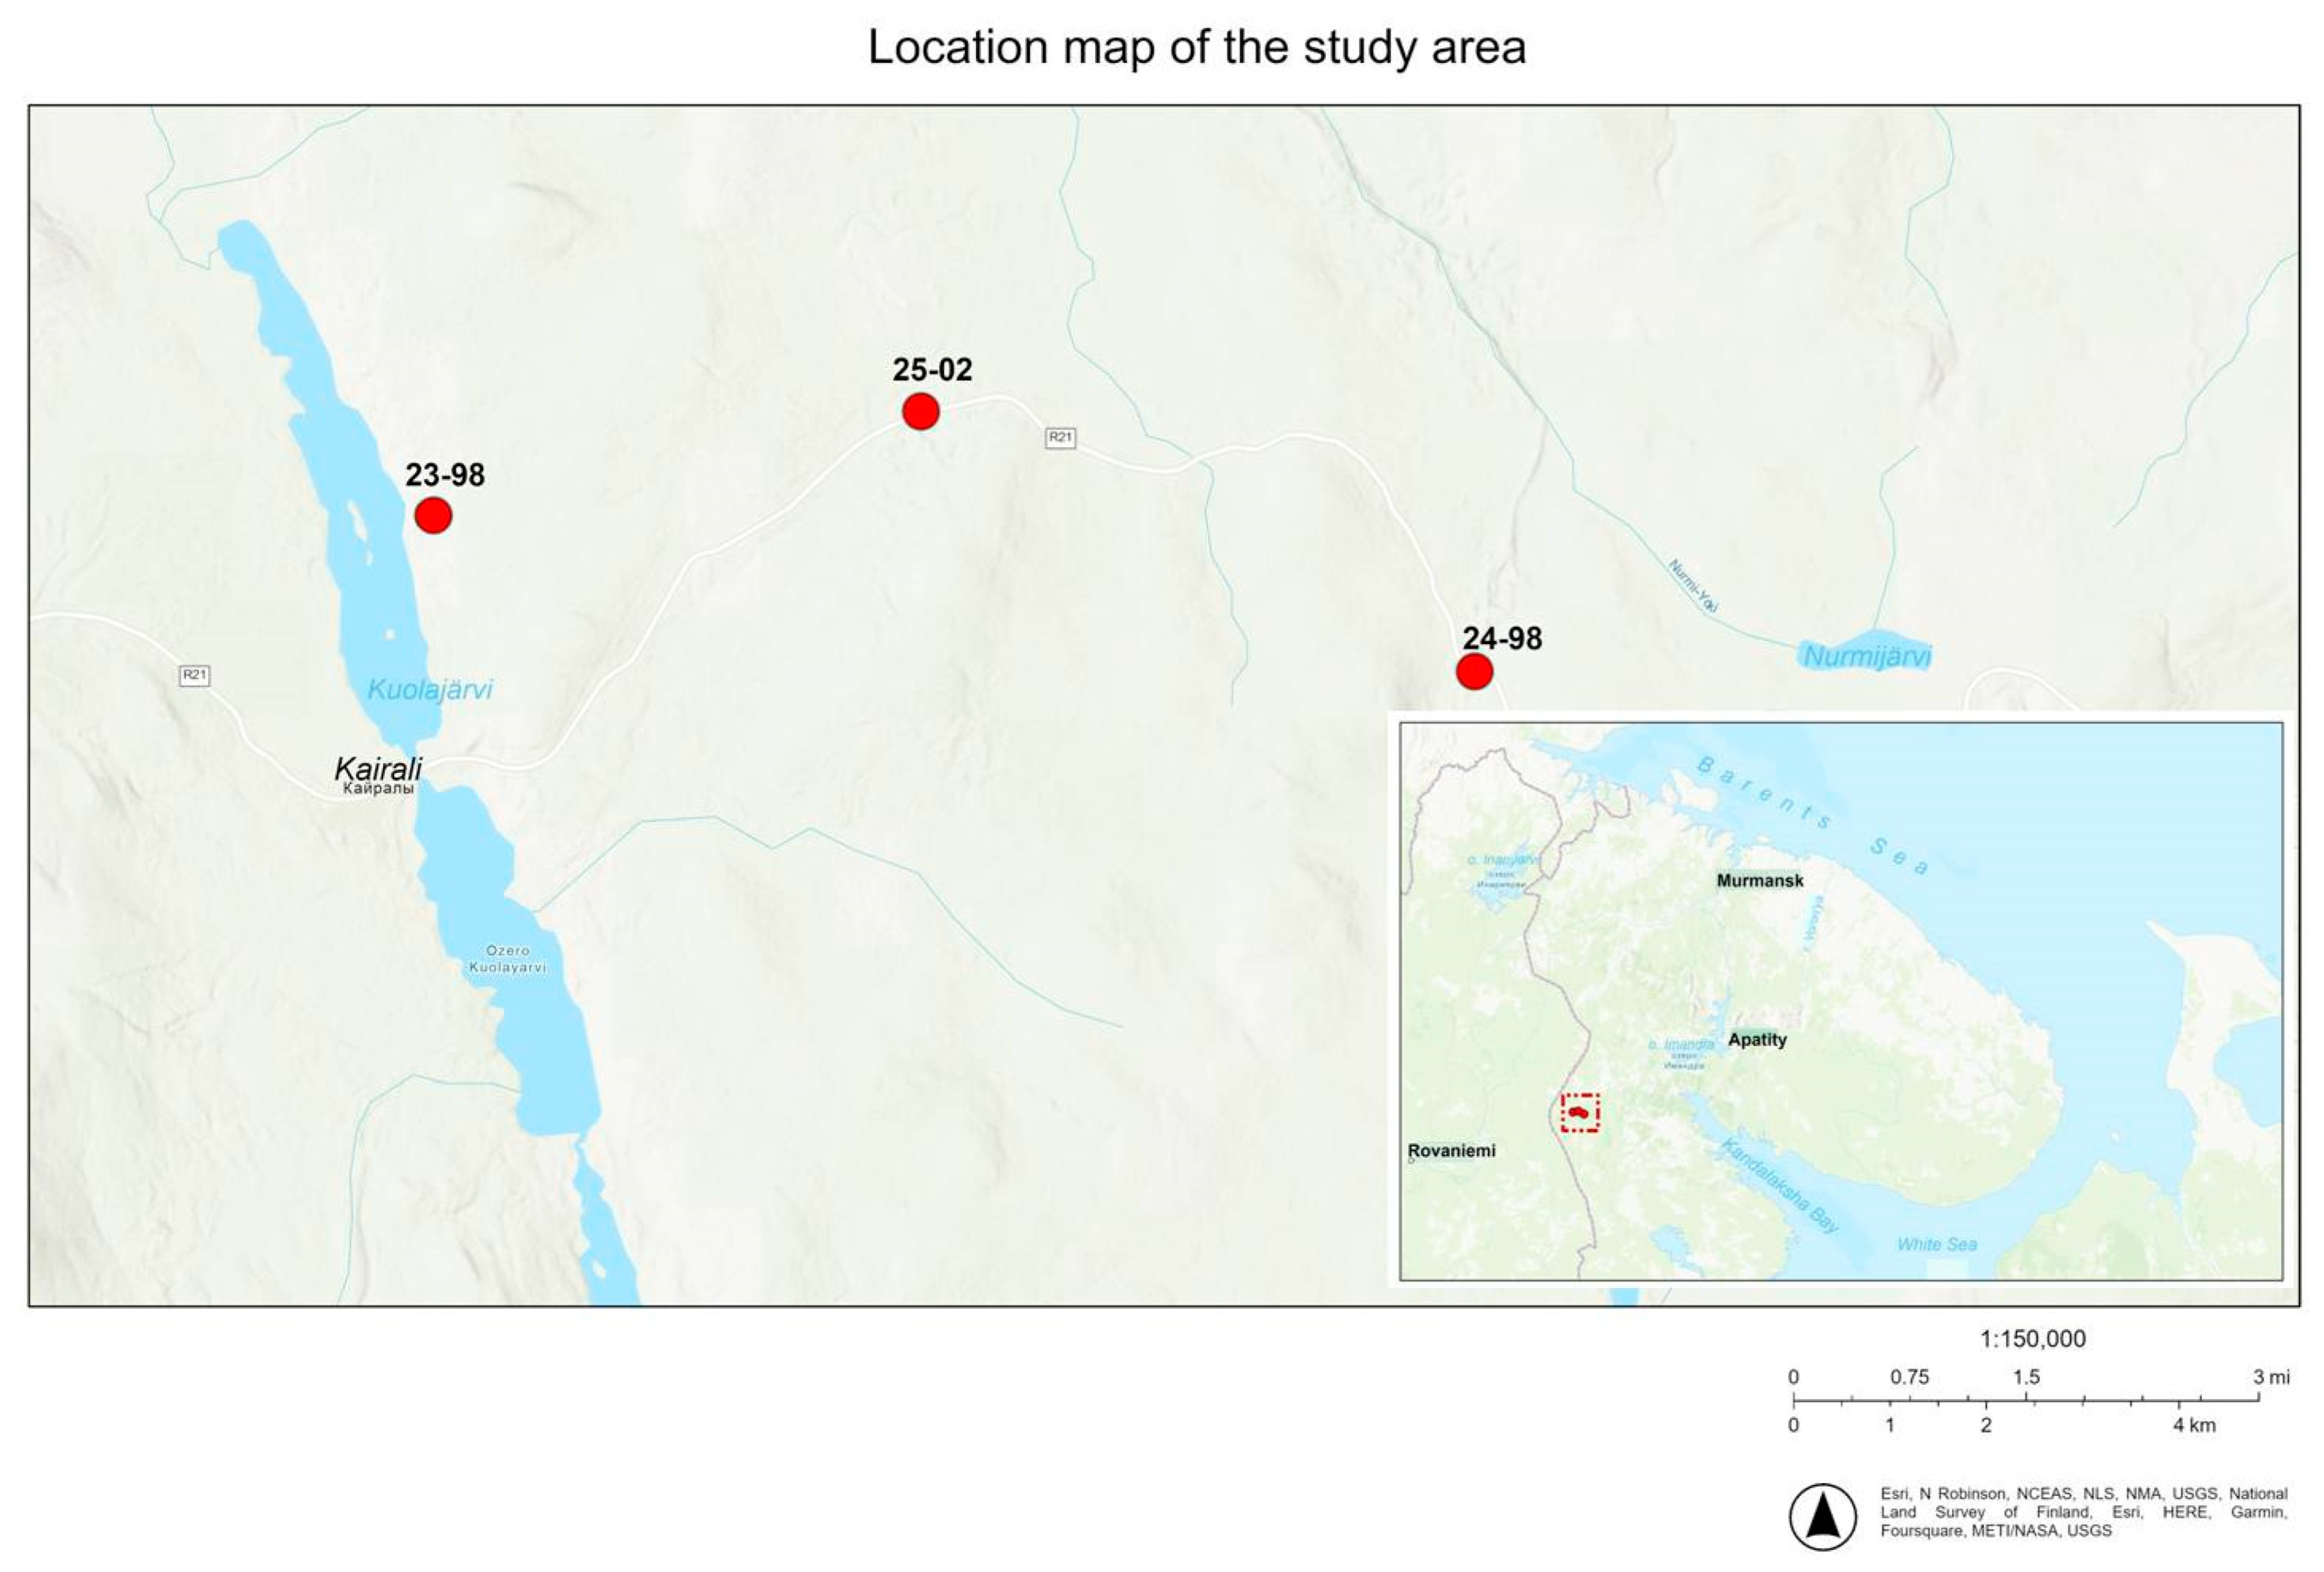
2. Materials and Methods

We studied dwarf shrub-green moss spruce forests and lichen-shrub pine forests dominant in the boreal zone undisturbed (background) areas of Russia’s Murmansk region. Long-term field research was carried out in 1999–2020 on three permanent monitoring plots (PMPs) by the Institute of Industrial Ecology Problems of the North KSC RAN (Figure 1). The plots are typical of the regional background areas in the study area and meet all the criteria for control plots, as recommended by international programs [30]. Detailed stand characteristics at the plots are given in Table 1. The following components of forest ecosystems were studied: atmospheric precipitation, soils and soil water, living (photosynthetically active) needles, and Picea obovata Ledeb. and Pinus sylvestris L. needle litter.
Pine forest soils are represented by illuvial–ferruginous podzols (Rustic Albic Podzols (Arenic), WRB); spruce forest soils are represented by illuvial–humus podzols (Carbic Albic Podzols (Arenic), WRB) [31,32] with the characteristic profile O–E –BHF (BF, BH) –C, and they demonstrate various degrees of soil moisture. In spruce and pine forests in the studied areas, the depth of soil profile was from 30 to 40 cm (organic horizon: L—from 0.1 to 1 cm, F—from 0.5 to 2.5 cm, H—from 2.5 to 5.2 cm, mineral horizon: E—from 3 to 16 cm, B—from 7 to 30 cm, C—from 30 to 40 cm). Rustic Podzols are found under shrub, shrub-lichen, and lichen pine forests in drier locations, while Carbic Podzols are common in more humid locations [33]. The soils of the northern taiga forests of the Murmansk region feature a shallow organic horizon and limited organic matter content, mineral horizons poor in nitrogen and humus, and are typically acidic. In the studied areas below crown of spruce forests, pH varies from 3.94 to 5.33, and in pine forests, from 3.41 to 4.1 in the organic soil horizon. In the mineral horizon of spruce forest soils, pH ranges from 3.93 to 5.55, and in pine forest soils, from 3.62 to 5.30. In between the crowns of spruce forests in the organic horizon of soils, pH varies from 3.82 to 4.63, and in pine forests, from 3.19 to 4.17, and in the mineral one, from 4.3 to 5.26 for spruce forests, and from 3.32 to 5.22 for pine forests. Organic matter plays an important role in the formation of the soil profile of Al-Fe-humus podzols. The organic horizon is mainly composed of organic remains. It contains at least half of all organic matter in these soils [34]. Mineral horizons differ in organic matter content. The illuvial horizon within the soil mineral profile is the horizon of maximum humus accumulation, while the overlying podzolic horizon contains less humus.
In the study areas, the annual precipitation amounted to 981 mm, the average annual air temperature was 1.1 °C, the average temperature in July and January was 15 °C and −11.4 °C, respectively. Snow depth in pine forests was 55.1 cm below crowns, and 61 cm for spruce forests. In between crown spaces, the depth of snow cover in pine forests was 89 cm, and in spruce forests, it was 71 cm. The depth of snow cover in open areas was 79 cm.
Snow, rainwater, and soil water samples were collected annually (1999–2020). Snow cores were collected using a plastic core sampler over the entire depth of the snow pack to the soil surface annually before the onset of snowmelt (usually in the first week of April). Core diameter: 110 mm. Collection was carried out below the tree crowns, between the crowns, and in treeless (open) spaces in triplicate. Rainwater was collected using precipitation funnels (five below the crowns, five between the crowns, four in open areas), composed of a plastic pipe with a funnel (diameter: 14.5 mm). A plastic bag was placed inside the pipe and secured with a cap. To prevent the ingress of plant litter, insects, and other particles, the surface of the pipe was covered with a removable fine mesh made of synthetic material before securing it with a cap. Soil water was sampled using Derome gravity lysimeters [35] (12 pcs. per PMP), located at different depths in accordance with the soil profile (organic A0, eluvial E+B, illuvial BC/C) and taking into account the mosaic structure of the biogeocoeonosis (under the crowns and between the crowns in different parcels) [36]. During field sampling, the volume of rain and soil water accumulated in the funnels and lysimeters over a monthly period was measured using plastic measuring cups. Lysimetric and rainwater samples were collected monthly from May to October from 1999 through 2020.
Soil and live Picea obovata and Pinus sylvestris needles were collected in five folds at the end of the growing season once every five to seven years. Soil samples were collected at the end of the growing season (August) in the dominant parcels below and between the crowns. In spruce forest, the dominant parcel was shrub-green moss, while in pine forest, it was lichen shrub. Samples were collected according to soil horizons: litter/organic horizon (OL, OF, OH), eluvial horizon (E), illuvial horizon (BHF), and bedrock (C). Soil samples were dried at room temperature and then sieved. Fine soil fraction (<1.0 mm) was subjected to analytical processing. Tree needle samples were collected from the upper third of the crown. In the laboratory, spruce and pine needles were sorted by age (current year needles, annual, and perennial needles). Pinus sylvestris needle litter was collected in a lichen-green moss-shrub pine forest below the crowns and between the crowns. Conical funnels (surface area—0.5 m2) for collecting needle litter were installed at the PMPs (six between the crowns, six below the crowns). In pine forests, needle litter was collected twice annually—in June and October from 2015 to 2017.
Chemical analytical studies of the samples were carried out at the Physicochemical Analysis Resource Sharing Center at the Institute of Industrial Ecology Problems of the North KSC RAN. Water samples were filtered through a blue-ribbon filter paper. Carbon was measured by chromatometry or permanganatometry, depending on the concentration. Total nitrogen (N) was determined using the Kjeldahl method [37]. The carbon content (Corg) in soil, needle, and litter samples was determined by the Tyurin method. Descriptive statistics (mean and standard error) and trends for estimating the content of carbon and nitrogen in atmospheric precipitation, soil and soil water, living needles, and needle litter were obtained in Microsoft Excel 2019. To compare the composition of various components of ecosystems in different biogeocoenoses and compare the content of carbon and nitrogen below and between the crowns, the Mann–Whitney U test and the Statistica 13.3 software were used.

3. Results and Discussion

3.1. Carbon and Nitrogen in the Atmospheric Precipitation

Winter atmospheric precipitation is confined to a period of biological dormancy. In boreal forests, the duration of annual snow cover is 100–200 days, which determines the significant role of precipitation in the form of snow in biogeochemical cycles. Atmospheric precipitation in the form of rain plays an important role in chemical cycles and the functioning of forest ecosystems. The chemical composition of rainfall changes significantly after passing through the forest canopy. During this interaction, physicochemical reactions occur, leading to changes in water acidity and the concentrations of most elements.
In spruce and pine forests, the concentrations of carbon and nitrogen in snow and rainwater below the crowns were significantly (p < 0.05) higher than between the crowns and in the open spaces (Table 2). Increased concentrations of carbon and nitrogen below the crowns indicate the wash-off and leaching of elemental compounds from plant tissues. Carbon concentrations in the snow below and between the crowns in lichen-shrub pine forests were up to two times higher (p < 0.05) compared to spruce forests, lichen-shrub pine forests, and treeless areas. In rainwater, carbon concentrations below the crowns in spruce forests were up to two times higher (p < 0.05) than in pine forests. Increased carbon concentrations in rainfall below the crowns in spruce forests are attributable to the thicker spruce canopy compared to pine. Between the crowns in pine forests, nitrogen concentrations are higher (up to 1.1 times) compared to spruce forests.
Long-term dynamics of carbon concentrations in the atmospheric precipitation in pine and spruce forests demonstrated significant variability, both below and between the crowns. In the rainwater below the crowns in the lichen-green moss-shrub pine forest, a trend (R2 = 0.78) was found in 1999–2009 of decreasing carbon concentrations—from 77 to 61 mg/L. In 2013–2020, in the rainwater in the treeless area, a trend (R2 = 0.83) was found for increasing carbon concentrations—from 3.2 to 5.52 mg/L. In snow, in recent years, there was a trend of increasing carbon concentrations in the treeless area, as well as below the crowns in the dwarf shrub-green moss spruce forest and both below and between the crowns in the lichen-shrub pine forest (Figure 2). An increase in carbon concentrations in snow, clearly observable below the crowns, may be associated with an increase in the number of thaw days in the Murmansk region over the period 2000–2012 [38].
Carbon deposition with snow below and between the crowns does not differ significantly, despite the 1.2–1.3 times higher precipitation between the crowns. Below the crowns of spruce forests, the average annual carbon deposition for the period from 1999 to 2020 was 0.09 g m−2 yr−1, between the crowns, 0.07 g m−2 yr−1, and in pine forests, 0.07 and 0.06 g m−2 yr−1, respectively. Carbon deposition by rain in spruce and pine forests was significantly higher below the crowns than between the crowns; the amount of precipitation between the crowns was significantly (up to two times) higher than below the crowns. In spruce forests, carbon deposition below the crowns and nitrogen deposition between and below the crowns was higher than in pine forests (Figure 3).

3.2. Carbon and Nitrogen in the Soil

The soil cover of an ecosystem determines its condition and sustainability and plays an important role in the formation, maintenance, and conservation of biological diversity [39]. Soils of boreal forests contain approximately 30% of the planet-wide soil carbon stocks and are one of the most important components in estimating ecosystem carbon pools [40]. Despite the high content of organic matter in soils of boreal forests, data on carbon and nitrogen stocks in background areas under northern taiga conditions are insufficient.
The carbon content in the organic soil horizon in spruce and pine forests varied from 12% to 57%. In mineral horizons, a significant decrease in carbon content was found compared to the organic horizon. Mineral horizons were found to be rich in organic matter. The illuvial horizon (B) of the mineral profile was found to be the horizon with the highest carbon accumulation (0.40%–1.62%), while the podzolic horizon (E) contained less carbon (0.21%–0.72%). The carbon content in the C horizon decreased with the soil profile depth (below the B horizon) to 0.06%–0.67% (C horizon). The carbon content in the soils of pine and spruce forests below and between the crowns was mostly comparable. Significant differences were found only in the E horizon (p < 0.05) in the lichen-shrub pine forest, where the carbon content between the crowns was higher than below the crowns. The carbon content in the OF and OH horizons of the pine forest was higher (p < 0.05) than in the spruce forest. In the B horizon, to the contrary, a higher carbon content was observed in the spruce forest than in the pine forest (Table 3).
Nitrogen content is closely related to carbon content, because almost all the nitrogen in soil is found in the organic matter. The nitrogen concentration in the organic soil horizon in the pine and spruce forests was 5.2–13.3 and 4.7–18.7 g/kg, respectively. The illuvial horizon (B) of the mineral profile was the horizon with the highest nitrogen accumulation (0.29–0.89 g/kg). In the podzolic horizon, compared to the illuvial horizon, the nitrogen concentration was lower at 0.10–0.50 g/kg. With depth, the nitrogen concentration gradually decreased to 0.10–0.51 g/kg (C horizon). The organic matter of the northern taiga forest litter was depleted of nitrogen, with the C:N ratio typically exceeding 30. In pine forests, the C:N ratio is up to 60–82. The C:N ratio in the top horizons of the litter is largely controlled by the conditions of decomposition of plant residues (microbiological activity, differences in water and light regimes, etc.) [41]. In the mineral horizons, especially in the B horizon, the nitrogen content in organic matter increased, but insufficiently (C:N = 15–25).
In the pine forest, the nitrogen content below and between the crowns was comparable. In the spruce forest, the nitrogen concentration in the OF and OH horizons below the crowns was up to 1.4 times higher (p < 0.05) than between the crowns. The presence of intrabiogeocoenotic differences in spruce forest is due to the structure of spruce crowns; this tree species has a stronger influence on the conditions below the crowns, compared to pine.
In the spruce forest, the nitrogen concentration below the crowns in all soil horizons and in the OL and C horizons between the crowns was significantly (p < 0.05) higher than in the pine forest. This can be explained by the higher content of nitrogen compounds in the atmospheric precipitation in spruce forests compared to pine forests.
In the E horizon below the crowns, the carbon concentration in the spruce forest was higher than in the lichen-shrub pine forest.
Carbon and nitrogen stocks in the soils of northern taiga forests showed intrabiogeocoenotic differences. The bulk of soil carbon and nitrogen was concentrated below the crowns and varied from 2 to 18 t/ha and 0.015 to 0.624 t/ha, respectively. The lowest carbon and nitrogen stocks were found in the OL horizon, and the highest were found in the OH horizon (Figure 4).

3.3. Carbon and Nitrogen in the Soil Water

Soil solution is the most active soil phase. It is there that the vast majority of all chemical reactions in the soil occur. Water is the link in the system organisms–soil–rocks–atmosphere. Metabolism occurs mainly through the liquid phase, i.e., soil solution, ground, and surface water [42].
Carbon concentrations in organic soil horizon water below the crowns in the spruce and pine forests were up to six times higher, in the eluvial soil horizon, up to 3.5 times higher, and in the illuvial horizon of spruce forest soils, up to 2.5 times higher (p < 0.05) compared to between the crowns (Table 4). In soil water, a decrease in carbon and nitrogen concentrations below and between the crowns in spruce and pine forests was found with the depth of the soil profile.
The total soil nitrogen below the crowns of spruce and pine forests in the organic soil water and in the eluvial horizon water of spruce forests was higher than between the crowns. Increased concentrations of elements below the crowns indicate the wash-off and leaching of element compounds from the tissues of dominant woody plants. There was a significant decrease in carbon and nitrogen concentrations with the depth of the soil profile, both in spruce and pine.
Interbiogeocoenotic differences below the crowns demonstrate significant differences only in carbon concentrations in the organic soil horizon water: in the lichen-green moss-shrub pine forest, carbon concentrations were significantly higher (up to two times) than in the lichen-shrub-green moss spruce forest and the lichen-shrub pine forest. Between the crowns, carbon concentrations in the organic and mineral horizon water in the pine forest were, in most cases, significantly higher than in the spruce forest. This can be explained by the higher carbon content in the organic soil horizon below and between the crowns in the pine forest compared to spruce forest. However, it should be noted that between the crowns, the concentration of carbon in the organic soil horizon water in the spruce forest was significantly higher than in the pine forest.
No significant interbiogeocoenotic differences in the concentration of nitrogen in the water below the crowns were found. In the water below the crowns in the lichen-shrub pine forest, the lowest nitrogen concentrations were observed, up to three times lower than in the lichen-green moss-shrub pine forest and in the dwarf shrub-green moss spruce forest.
The long-term carbon dynamics in the water of all soil horizons in the pine and spruce forest demonstrated significant variability. One can note a trend of increasing carbon concentrations in the water from the organic soil horizon and decreasing carbon concentrations in the water from the mineral soil horizon below the crowns in the spruce forest in recent years (Figure 5).
The average annual removal of carbon and nitrogen with water from the organic and mineral soil horizons in 1999–2020 below the crowns in the spruce and pine forests is significantly higher than that between the crowns (Figure 6). The average annual carbon removal with water from mineral soil horizons for the period from 1999 to 2020 below the crowns in the spruce is higher than that between crowns; nitrogen removal with water has no pronounced intrabiogeocenotic differences (Figure 7). In pine forests, carbon and nitrogen removal in water of eluvial soil horizons below the crowns is significantly higher than between the crowns; in water from mineral soil horizons, carbon and nitrogen removal does not have pronounced intrabiogeocenotic differences.
Carbon removal in water from organic soil horizons below the crowns is higher in pine forest lichen-green moss-shrub forest than in spruce forest lichen-shrub-green moss and pine forest lichen-shrub forest. In between the crowns, carbon removal in water from organic horizons of soils in pine forests is higher than that in spruce forests. Carbon removal from the eluvial horizon of soils of the lichen-shrubby pine forest below the crowns and carbon removal in water from the illuvial horizon of soils below and between the crowns is higher than that in the spruce forest.
Nitrogen removal in water from organic horizons of spruce forest soils below and between the crowns is higher than that in pine forests. Nitrogen removal from mineral horizons of soils of lichen-shrub pine forest is higher than that in spruce forest, both below and between the crowns of trees.

3.4. Carbon and Nitrogen in the Living Needles and Litter Fall

It is shown that the carbon content in Picea obovata and Pinus sylvestris needles varies between 41% and 57% (Table 5). The value of 57% is rather high according to the literature, and in the future, research should be carried out to examine the possible reasons. As the needles age, the carbon content remains virtually unchanged. The explanation may lie in the redistribution of carbon between various organs in favor of roots and, especially, shoots, where the carbon assimilated during photosynthesis is deposited. No significant interbiogeocoenotic differences in carbon content were found (Table 5).
The nitrogen content in the current year and perennial needles of the lichen-dwarf shrub pine forest was significantly (p < 0.05) higher than in the spruce forest and lichen-green moss dwarf shrub pine forest. The nitrogen content in the current year needles in the lichen-green moss shrub pine forest was up to three times higher than in perennial and brown needles, as well as in litter fall. In the lichen-shrub pine forest and in the shrub-green moss spruce forest, the nitrogen content in the current year needles was also higher than in the perennial and brown needles, probably due to retranslocation processes (withdrawal before needle abscission), corroborating with the literature in the results session [43].
Analysis of the chemical composition of needles of different ages showed that in northern taiga forests, the main carbon and nitrogen stocks are focused in perennial needles of Pinus sylvestris and Picea obovata. There is a decrease in nitrogen and carbon stocks in fallen needles compared to living needles. It was found that in pine forests, nitrogen and carbon stocks in needles are higher than those in spruce forests, which may be related to the larger size and mass of assimilating organs in Pinus sylvestris.

4. Carbon and Nitrogen Contents in Different Components in Northern Taiga Forest Ecosystem

Analysis and generalization of the obtained data indicates that the largest carbon and nitrogen stocks in the northern taiga forests are focused in the soil organic horizon, while the removal of these elements with soil water is insignificant. Carbon and nitrogen reserves in living needles and fallen needles are lower than those in soils. Atmospheric deposition contains the least amount of carbon and nitrogen compared to other components of forest ecosystems, which were considered by us (Figure 8).
Intrabiogeocenotic differences in the content of carbon and nitrogen are expressed in rainwater and soil water. The content of these elements is generally higher below the crowns than between the crowns. Interbiogeocenotic differences in carbon and nitrogen content in different components of forest ecosystems demonstrate differences between spruce and pine forests, as well as in biogeocenoses represented by the same dominant tree species Pinus sylvestris.

5. Conclusions

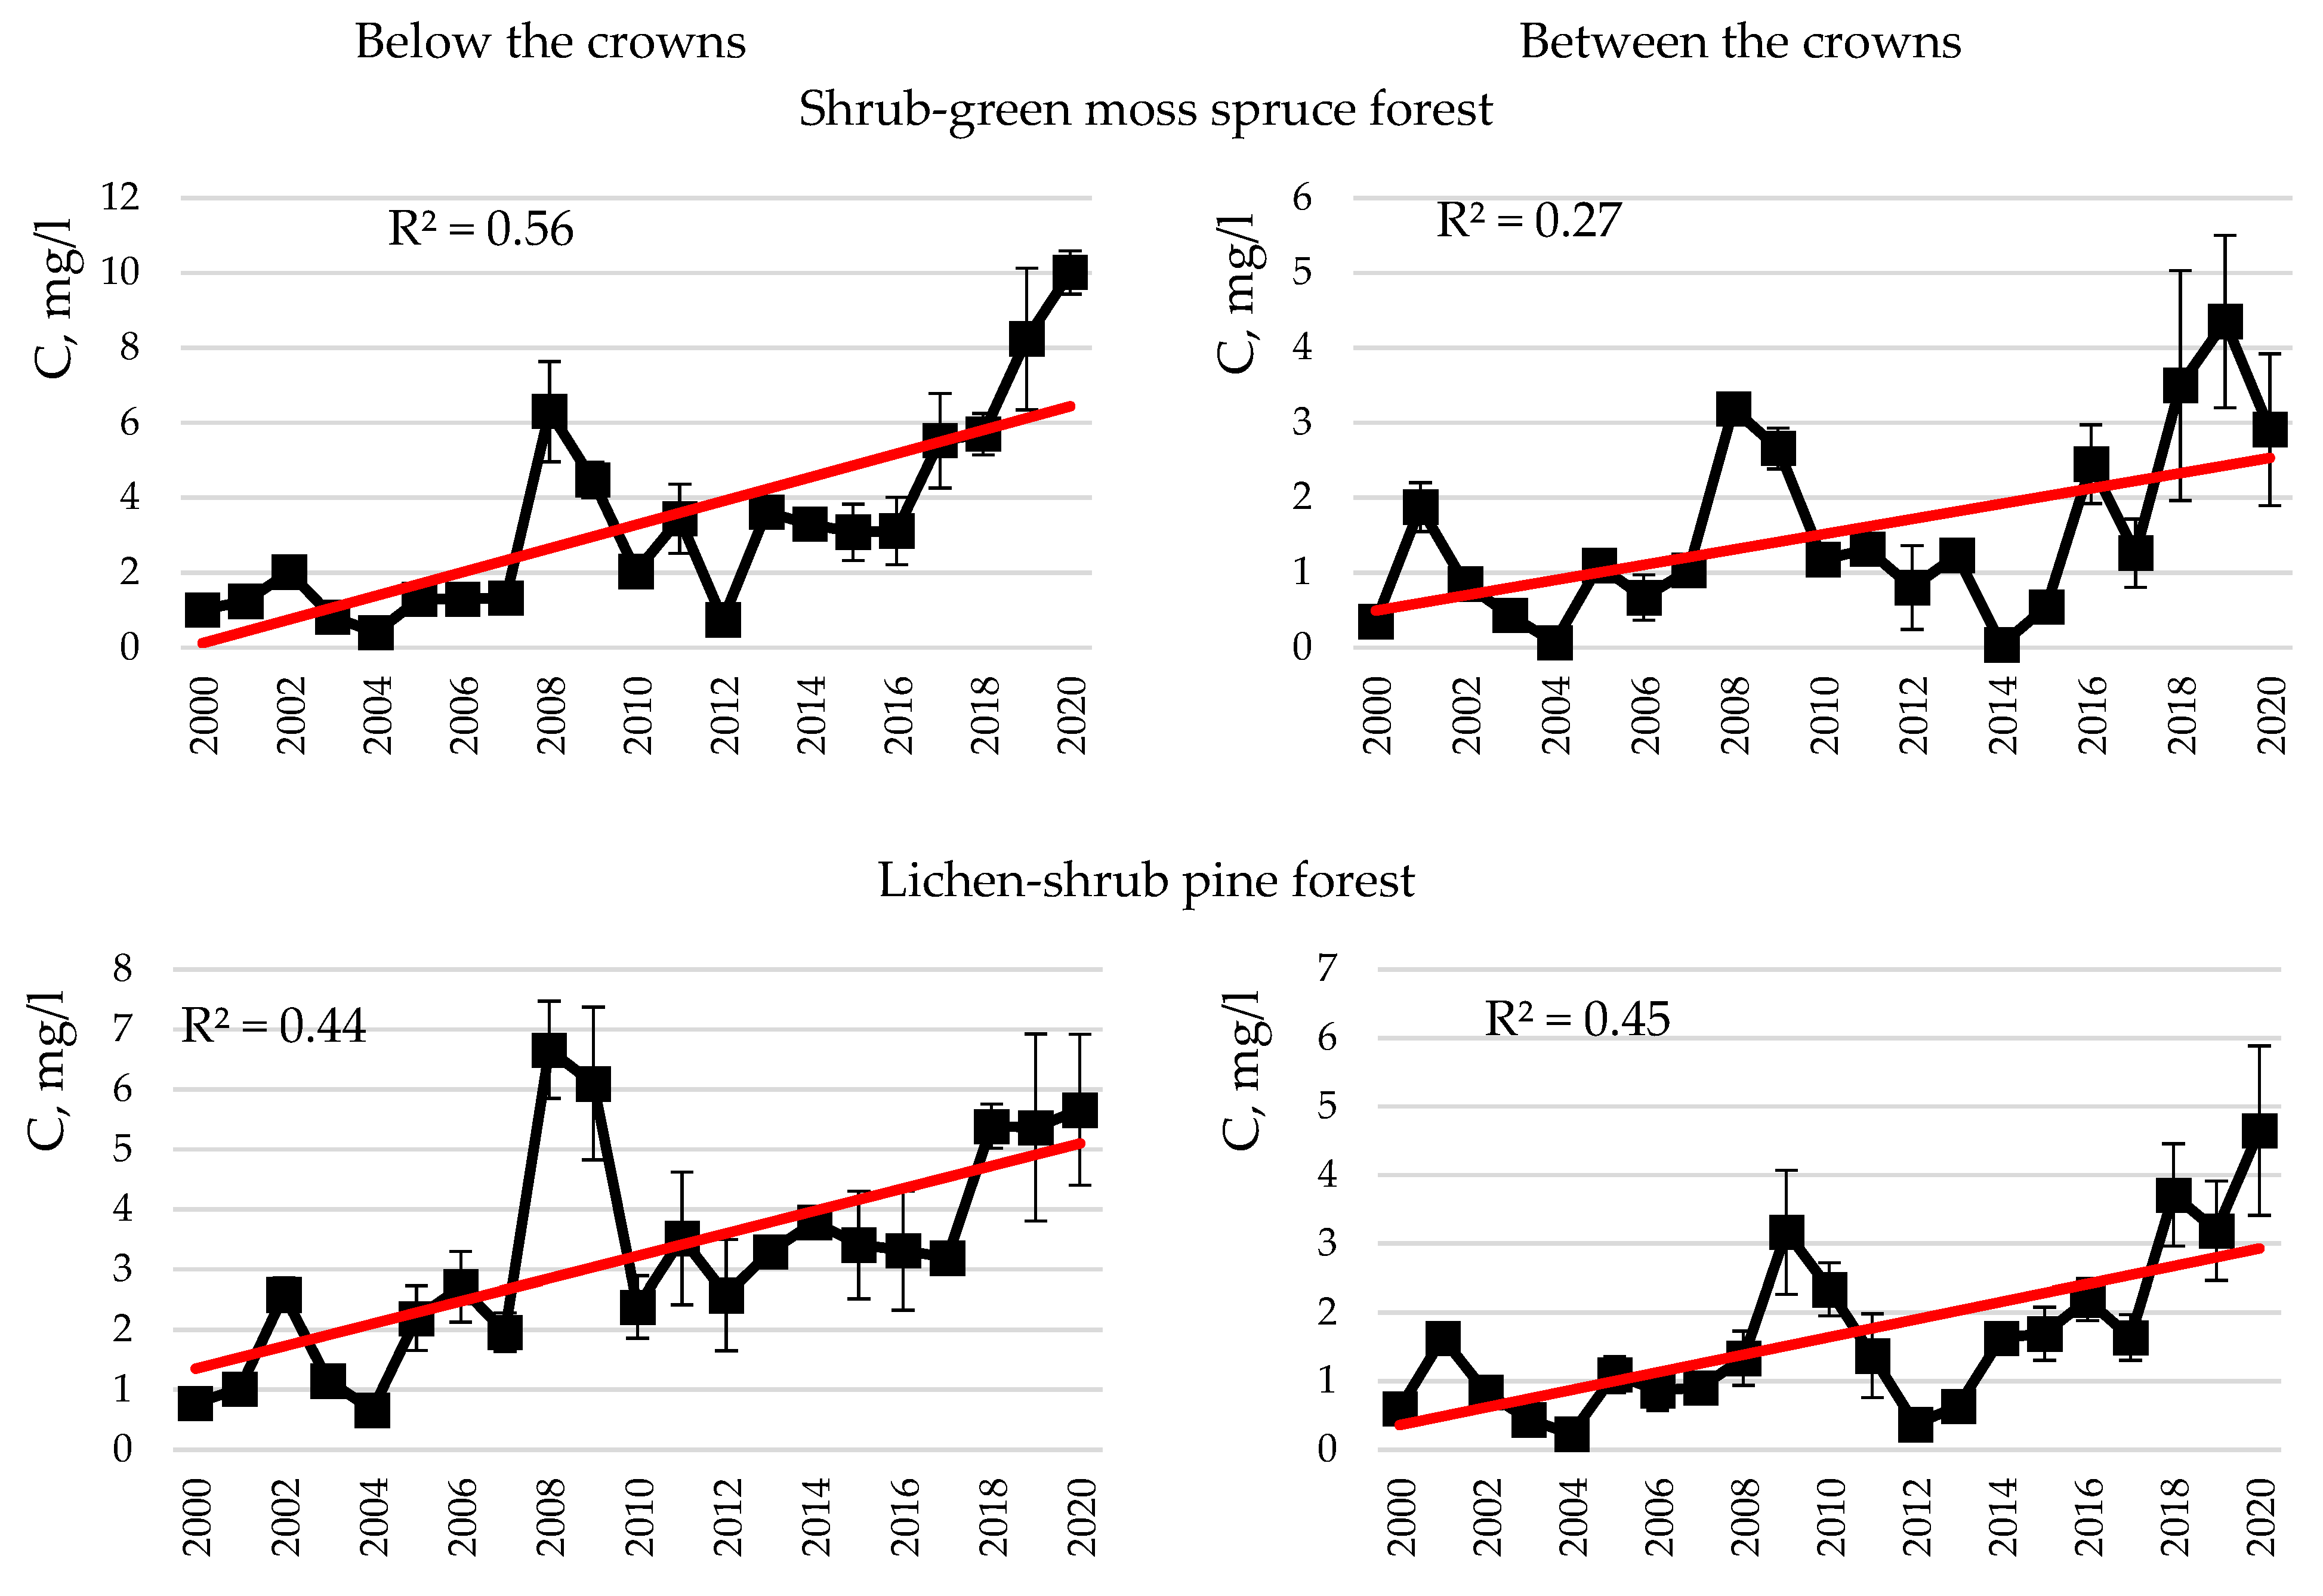
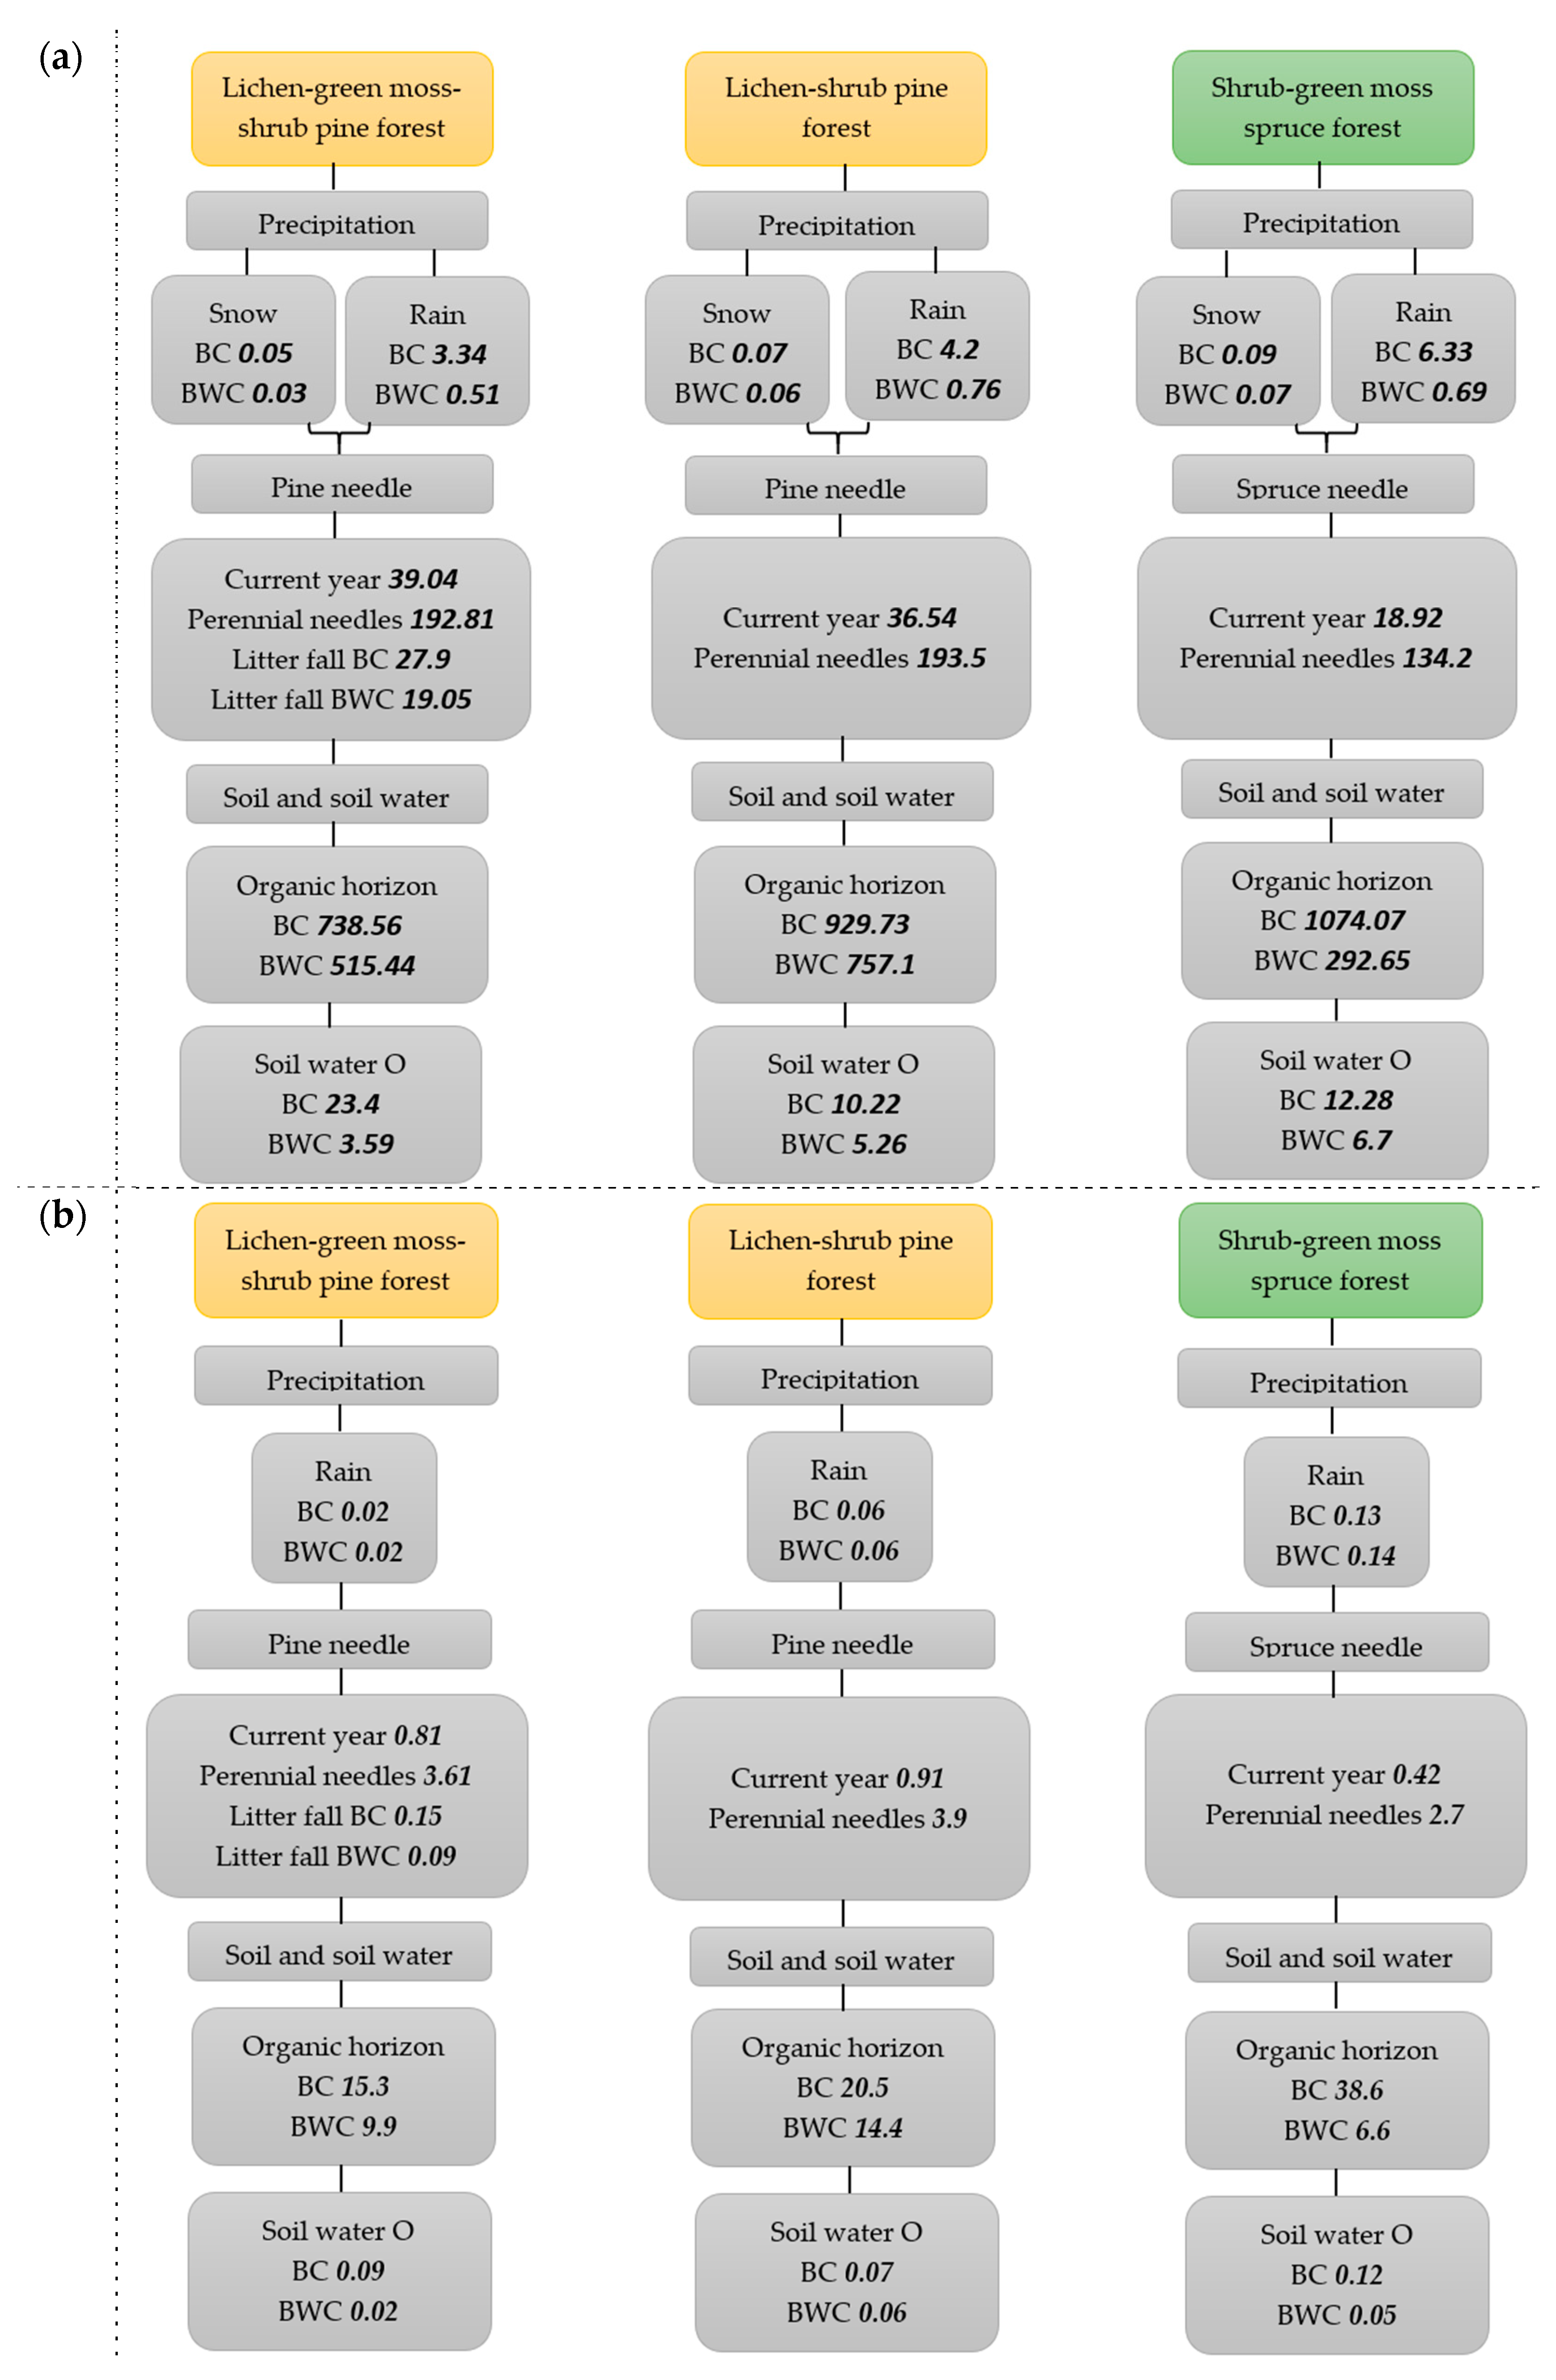
  • Carbon and nitrogen in snow and rainwater, as well as atmospheric precipitation of these, were found to be higher below the crowns in spruce and pine forests than between the crowns, which is associated with the wash-off and leaching of elements from the tree crowns. In rainwater in spruce, carbon concentrations and deposition below the tree crowns were higher than those in pine. Increased carbon concentrations in the rain deposition below the crowns in the spruce forest are attributable to a thicker spruce canopy compared to pine. The long-term dynamics of carbon concentrations in snow demonstrated a trend of increasing carbon concentrations in treeless areas, as well as below the crowns in the dwarf shrub-green moss spruce forest and both below and between the crowns in the lichen-shrub pine forest. An increase in carbon concentrations in snow, clearly expressed below the crowns, may be associated with an increase in the number of thaw days in the Murmansk region.
  • In spruce and pine forests, a significant decrease was observed in the content of carbon and nitrogen in the soil’s mineral horizons compared to the organic horizon. No significant intrabiogeocoenotic differences in carbon content were found in pine and spruce forest soils. The nitrogen content below the crowns in spruce and pine forests was typically higher than between the crowns. Interbiogeocoenotic differences in carbon content were weakly expressed; in the organic soil horizon, the carbon content was higher in pine compared to spruce, while in the mineral soil horizon, on the contrary, there was a higher carbon content in spruce compared to pine. The nitrogen content below the crowns and between the crowns in the organic and mineral soil horizons in the spruce forest was higher than in the pine forest. This can be explained by the higher content of nitrogen compounds in the atmospheric precipitation in spruce forests compared to pine. The main stocks of soil carbon and nitrogen in northern taiga forests are concentrated below the crowns.
  • The concentrations of carbon and nitrogen in the soil water, as well as the removal of these, were typically higher below than between the crowns in the spruce and pine forests. Increased element concentrations in the soil water below the crowns indicate the washout and leaching of element compounds from the tissues of dominant woody plants. In the pine forest, carbon concentrations were usually higher than in the spruce forest, which can be explained by the high carbon content in the organic soil horizon below and between the crowns in the pine forest. The long-term dynamics of carbon concentrations in water from all soil horizons in pine and spruce forests were characterized by significant variability.
  • The carbon content in living Picea obovata and Pinuss ylvestris needles and Pinus Sylvestris needle litter had minor variability; no significant interbiogeocoenotic and age differences were found. The nitrogen content in the current year needles was typically higher than that in the perennial needles and was significantly reduced in brown needles and needle litter.

Author Contributions

Methodology, V.E., T.S. and E.I.; validation, V.E. and T.S.; investigation, V.E., T.S. and E.I.; data curation, N.R.; writing—original draft preparation, V.E.; writing—review and editing T.S., N.R. and E.I.; visualization, N.R. and I.S.; project administration, T.S.; funding acquisition, V.E., T.S. and E.I. All authors have read and agreed to the published version of the manuscript.

Funding

The research was carried out as part of the most important innovative project of national importance “Development of a system for ground-based and remote monitoring of carbon pools and greenhouse gas fluxes in the territory of the Russian Federation, ensuring the creation of recording data systems on the fluxes of climate-active substances and the carbon budget in forests and other terrestrial ecological systems” (Registration number: 123030300031-6).

Data Availability Statement

Data are contained within the article.

Conflicts of Interest

The authors declare no conflict of interest. The funders had no role in the design of the study; in the collection, analyses, or interpretation of data; in the writing of the manuscript, or in the decision to publish the results.

References

  1. Kuznetsov, M.A. Pools and fluxes of organic carbon in the system soil-phytocenosis of bilberry-sphagnum spruce forest in the middle taiga zone of the Komi republic. Vestnic IB Komi SC UrB RAS 2014, 5, 17–19. (In Russian) [Google Scholar]
  2. Bobkova, K.S.; Osipov, A.F. Carbon cycling in system phytocenosis-soil in bilberry-sphagnum pine forests of the middle taiga (republic of Komi). Contemp. Probl. Ecol. 2012, 2, 11–18. [Google Scholar]
  3. Osipov, A.F. Organic carbon stocks and fluxes in the ecosystem of a mature blueberry pine forest of the middle taiga. Sib. For. J. 2017, 2, 70–80. (In Russian) [Google Scholar] [CrossRef]
  4. Bakhmet, O.N. Carbon Deposits in Soils of Pine and Spruce Forests of Karelia. Contemp. Probl. Ecol. 2018, 11, 697–703. [Google Scholar] [CrossRef]
  5. Menyailo, O.V.; Matvienko, A.I.; Makarov, M.I.; Cheng, S.K. Role of nitrogen in the regulation of the carbon cycle in forest ecosystems. Contemp. Probl. Ecol. 2018, 2, 143–159. (In Russian) [Google Scholar] [CrossRef]
  6. Murillo, J.C.R. Temporal Variations in the Carbon Budget of Forest Ecosystems in Spain. Ecol. Appl. 1997, 7, 461–469. [Google Scholar] [CrossRef]
  7. Marty, C.; Houle, D.; Courchesne, F.; Gagnon, C. Soil C:N ratio is the main driver of soil δ15N in cold and N-limited eastern Canadian forests. Catena 2019, 172, 285–294. [Google Scholar] [CrossRef]
  8. Schulte-Uebbing, L.; de Vries, W. Global-scale impacts of nitrogen deposition on tree carbon sequestration in tropical, temperate, and boreal forests: A meta-analysis. Glob. Chang. Biol. 2018, 24, e416–e431. [Google Scholar] [CrossRef]
  9. Lukina, N.V.; Nikonov, V.V. Biogeochemical Cycles in the Northern forests Subjected to Air Pollution; KNC RAN: Apatity, Russia, 1996; Volume 1. (In Russian) [Google Scholar]
  10. Bobkova, K.S.; Galenko, E.P.; Zaboeva, I.V.; Torlopova, N.V.; Ivasishina, N.A.; Kuzin, S.N.; Martynjuk, Z.P.; Zagirova, S.V.; Tuzhilkina, V.V.; Robakidze, E.A.; et al. Process of Bioproduction in Forest Ecosystems of the North; Nauka: Saint Petersburg, Russia, 2001; ISBN 5-02-026154-8. (In Russian)
  11. Manakov, K.N. Productivity and biological cycle in pine forests. In Biological Productivity and Exchange at the Forest Biogeocenosis of Kola Peninsula; Kol. Fil. AN SSSR: Apatity, Russia, 1978. (In Russian) [Google Scholar]
  12. Nikonov, V.V. Formation of Soils on the Northern Tree Line of Pine Biogeocoenoses; Nauka: Leningrad, Russia, 1987. (In Russian)
  13. Nikonov, V.V.; Pereversev, V.N. Formation of Soils in the Kola Subarctic; Nauka: Leningrad, Russia, 1989. (In Russian)
  14. Albrektson, A. Needle litterfall in stands of Pinus sylvestris L. in Sweden, in relation to site quality, stand age, and latitude. Scand. J. For. Res. 1988, 3, 333–342. [Google Scholar] [CrossRef]
  15. Pedersen, L.B.; Bille-Hansen, J. A comparison of litterfall and element fluxes in even aged Norway spruce, sitka spruce and beech stands in Denmark. For. Ecol. Manag. 1999, 114, 55–70. [Google Scholar] [CrossRef]
  16. Berg, B. Litter decomposition and organic matter turnover in northern forest soils. For. Ecol. Manag. 2000, 133, 13–22. [Google Scholar] [CrossRef]
  17. Pan, Y.; Wang, Y.; Xin, J.; Tang, G.; Song, T.; Wang, Y.; Li, X.; Wu, F. Study on dissolved organic carbon in precipitation in Northern China. Atmos. Environ. 2010, 44, 2350–2357. [Google Scholar] [CrossRef]
  18. Lavorivska, L.; Boyer, E.W.; De Walle, D.R. Atmospheric deposition of organic carbon via precipitation. Atmos. Environ. 2016, 146, 153–163. [Google Scholar] [CrossRef]
  19. Derome, J.; Lindroos, A.-J. Effects of heavy metal contamination on macronutrient availability and acidification parameters in forest soil in the vicinity of the Harjavalta Cu-Ni smelter, SW Finland. Environ. Pollut. 1998, 99, 225–232. [Google Scholar] [CrossRef] [PubMed]
  20. Yashin, I.M.; Raskatov, V.A.; Shishov, L.L. Water Migration of Chemical Elements in Soil Cover; MSHA: Moscow, Russia, 2003; ISBN 5-94327-144-9. (In Russian)
  21. Kalbitz, K.; Solinger, S.; Park, J.H.; Michalzik, B.; Matzner, E. Controls on the dynamics of dissolved organic matter in soils: A review. Soil Sci. 2000, 165, 277–304. [Google Scholar] [CrossRef]
  22. Kaiser, K.; Guggenberger, G.; Zech, W. Sorption of DOM and DOM fractions to forest soils. Geoderma 1996, 74, 281–303. [Google Scholar] [CrossRef]
  23. Karavanova, E.I. Dissolved organic matter: Fractional composition and sorbability by the soil solid phase (Review of literature). Eurasian Soil Sci. 2013, 46, 833–844. [Google Scholar] [CrossRef]
  24. Camino-Serrano, M.; Gielen, B.; Luyssaert, S.; Ciais, P.; Vicca, S.; Guenet, B.; Vos, B.D.; Cools, N.; Ahrens, B.; Altaf Arain, M.; et al. Linking variability in soil solution dissolved organic carbon to climate, soil type, and vegetation type. Glob. Biogeochem. Cycles 2014, 28, 497–509. [Google Scholar] [CrossRef]
  25. Camino-Serrano, M.; Graf Pannatier, E.; Vicca, S.; Luyssaert, S.; Jonard, M.; Ciais, P.; Guenet, B.; Gielen, B.; Peñuelas, J.; Sardans, J.; et al. Trends in soil solution dissolved organic carbon (DOC) concentrations across European forests. Biogeosciences 2016, 13, 5567–5585. [Google Scholar] [CrossRef]
  26. Sultanbaeva, R.R.; Koptsik, G.N.; Smirnova, I.E. Input and migration of soluble organic carbon in soils of forest ecosystems of the broad-leaved-coniferous forest subzone. Mosc. Univ. Soil Sci. Bull. 2015, 4, 37–42. (In Russian) [Google Scholar] [CrossRef]
  27. Kuznetsova, A.I.; Lukina, N.V.; Orlova, M.A.; Teben’kova, D.N. Comparative assessment of the size of carbon removal with soil water in taiga and coniferous-broadleaved forests. In Carbon Accumulation in Forest Soils and Successional Status of Forests; Lukina, N.V., Ed.; Tovarishestvonauchnihizdaniy KMK: Moscow, Russia, 2018; pp. 140–146. ISBN 978-5-907099-47-0. (In Russian) [Google Scholar]
  28. Lukina, N.V.; Orlova, M.A.; Teben’kova, D.N.; Ershov, V.V.; Gorbacheva, T.T.; Isaeva, L.G. Assessment of soil water composition in the northern taiga coniferous forests of background territories in the industrially developed region. Eurasian Soil Sci. 2018, 51, 277–289. [Google Scholar] [CrossRef]
  29. Ershov, V.V.; Isaeva, L.G.; Gorbacheva, T.T.; Lukina, N.V.; Orlova, M.A.; Smirnov, V.E. Assessment of Soil-Water Composition Dynamics in the North Taiga Forests upon the Reduction of Industrial Air Pollution by Emissions of a Copper-Nickel Smelter. Contemp. Probl. Ecol. 2019, 12, 97–108. [Google Scholar] [CrossRef]
  30. ICP Forests. Forest Monitoring Methodology under the International Program ICP Forests; ICP Forests: Moscow, Russia, 2008; 46p. [Google Scholar]
  31. Belov, N.P. Soils of the Murmansk Region; Belov, N.P., Baranovskaja, A.V., Eds.; Nauka: Moscow, Russia, 1969. (In Russian)
  32. Chertov, O.G.; Men’shikova, G.P. Changes in forest soils under the influence of acid precipitation. Izv. AN SSSR. Ser. Biol. 1983, 6, 110–115. (In Russian) [Google Scholar]
  33. Fedorets, N.G.; Bakhmet, O.N. Peculiarities of soil and soil cover formation in the Karelia—Kola region. Proc. Kar. RC RAS 2016, 12, 39–51. (In Russian) [Google Scholar] [CrossRef]
  34. Pereverzev, V.N.; Alekseeva, N.S. Organic Matter in Soils of the Kola Peninsula; Nauka: Leningrad, Russia, 1980. (In Russian)
  35. Derome, J.; Niska, K.; Lindroos, A.-J.; Valikangas, P. The Ion Balance Monitoring Plot Network. The Lapland Forest Damage Project; Russian-Finnish Cooperation Report; Rovaniemi Research Station, The Finnish Forest Research Institute: Rovaniemi, Finland, 1993; pp. 49–57. [Google Scholar]
  36. Lukina, N.V.; Nikonov, V.V. Nutritional Regime of Northern Taiga Forests (Natural Regularities and Pollution-Inducted Changes); KNC RAN: Apatity, Russia, 1998. (In Russian) [Google Scholar]
  37. Maher, W.; Krikowa, F.; Wruck, D.; Louie, H.; Nguyen, T.; Huang, W.Y. Determination of total phosphorus and nitrogen in turbid waters by oxidation with alkaline potassium peroxodisulfate and low pressure microwave digestion, autoclave heating or the use of closed vessels in a hot water bath: Comparison with Kjeldahl digestion. Anal. Chim. Acta 2002, 463, 283–293. [Google Scholar] [CrossRef]
  38. Ershov, V.V.; Lukina, N.V.; Orlova, M.A.; Zukert, N.V. Dynamics of snowmelt water composition in conifer forests Exposed to Airborne Industrial Pollution. Russ. J. Ecol. 2016, 47, 46–52. [Google Scholar] [CrossRef]
  39. Fedorets, N.G.; Bakhmet, O.N.; Medvedeva, M.V.; Novikov, S.G.; Tkachenko, U.N.; Solodovnikov, A.N. Heavy Metals in Soils of Karelia; Karelian Research Centre of the RAS: Petrozavodsk, Russia, 2015; ISBN 978-5-9274-0674-6. (In Russian) [Google Scholar]
  40. Scharlemann, J.P.; Tanner, E.V.; Hiederer, R.; Kapos, V. Global soil carbon: Understanding and managing the largest terrestrial carbon pool. Carbon Manag. 2014, 5, 81–91. [Google Scholar] [CrossRef]
  41. Artemkina, N.A.; Orlova, M.A.; Lukina, N.V. Micromosaic structure of vegetation and variability of the chemical composition of l layer of the litter in dwarf shrub–green moss spruce forests of the northern taiga. Contemp. Probl. Ecol. 2018, 11, 754–761. [Google Scholar] [CrossRef]
  42. Kovda, V.A. Soil Cover Biogeochemistry; Zonn, S.V., Ed.; Nauka: Moscow, Russia, 1985. (In Russian)
  43. Sukhareva, T.A.; Lukina, N.V. Mineral composition of assimilative organs of conifers after reduction of atmospheric pollution in the Kola Peninsula. Russ. J. Ecol. 2014, 45, 95–102. [Google Scholar] [CrossRef]
Figure 1. Location map of the study plots: 23-98—lichen-green moss-shrub pine forest, 25-02—lichen-shrub pine forest, 24-98—dwarf shrub-green moss spruce forest.
Forests 15 00029 g001
Figure 2. Carbon concentration in the snow water in the spruce and pine forests. Note: sample size for the standard error—n = 3. Trends are statistically significant (p < 0.05).
Forests 15 00029 g002
Figure 3. Carbon (C) and nitrogen (N) deposition by rain in spruce and pine forests. Note: sample size for the standard error n = 10–22.
Forests 15 00029 g003
Figure 4. Carbon and nitrogen stocks in the organic soil horizon of northern taiga forests, t/ha. Note: sample size for the standard error n = 8–9.
Forests 15 00029 g004
Figure 5. Carbon in the below-crown water in the spruce forest. O—organic horizon (3–5 cm), E+B (15–25 cm)—eluvial horizon, BC—illuvial soil horizon (30–40 cm). Note: sample size for the standard error n = 4–5. Trend is statistically significant (p < 0.05).
Forests 15 00029 g005
Figure 6. Removal of carbon and nitrogen with water from the organic soil horizon of northern taiga forests. Note: sample size for the standard error n = 15–22.
Forests 15 00029 g006
Figure 7. Removal of carbon and nitrogen with water from the mineral soil horizon of northern taiga forests. Note: sample size for the standard error n = 13–19.
Forests 15 00029 g007
Figure 8. Carbon (a) and nitrogen (b) content in different components in northern taiga forest ecosystems, g m−2 (for atmospheric and soil water g m−2 yr−1), averaged over the period from 1999 to 2020. BC—below crowns, BWC—between crowns.
Forests 15 00029 g008
Table 1. Stand characterization at monitoring plots.
PMPCoordinatesASLStand CompositionStand Age, YearsAverage Diameter, cmNumber of Trees, pcs/haAverage Height, mStand Completeness (Relative)Tree Stand, Cover, %
23-98N 66,95245
E 29,60692
22510P160–18015,1200012.20.455–75
25-02N 66,96195
E 29,72147
2979P1B160–18018.9180015.40.455–75
24-98N 66,93890
E 29,85465
3277S3B200–22018.0140014.10.535–85
Notice: ASL—altitude above sea level; P—pine, B—betula, S—spruce. Study plots: 23-98—lichen-green moss-shrub pine forest, 25-02—lichen-shrub pine forest, 24-98—dwarf shrub-green moss spruce forest. PMP—permanent monitoring plots.
Table 2. Concentrations of carbon (C) and nitrogen (N) in the atmospheric precipitation (n = 40–90), mg/L, 1999–2020.
PMPBGC TypeElementSnowRain
BelowBetweenBelowBetween
23-98lichen-green moss-shrub pine forestC2.691.1757.884.66
0.320.152.680.34
NNDND0.510.23
0.180.03
25-02lichen-shrub pine forestC4.392.8545.064.92
0.430.361.790.26
NNDND0.530.43
0.090.11
24-98spruce forest lichen-shrub green mossC3.301.5791.325.37
0.380.195.390.30
NNDND0.470.36
0.040.07
Open areawetland Open area
C2.654.27
0.580.33
NND0.32
0.07
Notes: below—below the crowns, between—between the crowns; numerator is the mean, denominator is the standard error. ND—not determined. PMP—permanent monitoring plots. BGC—biogeocoenoses.
Table 3. Soil carbon (C) and nitrogen (N) in 2005–2020 (n = 8–9), %.
PMPBGC TypeSoil
Horizon
OLOFOHEBHC Horizon
23-98Lichen-green moss-shrub pine forestBelow the Crowns
C50.9249.7442.560.370.72ND
1.421.582.510.070.05
N1.081.170.820.020.05ND
0.030.050.090.0030.003
C/N47.4842.8555.4915.4316.27ND
1.481.635.691.841.44
Between the crowns
C48.9449.8644.530.430.710.32
1.401.601.600.100.100.09
N0.791.010.950.020.050.02
0.070.050.030.0030.010.004
C/N63.3450.1346.9216.0915.8916.72
4.262.761.872.181.426.01
25-02Lichen-shrub pine forestBelow the crowns
C49.1746.7440.710.250.52ND
1.723.003.640.040.08
N1.131.150.960.020.03ND
0.110.070.090.0020.003
C/N47.3740.8043.5814.6320.05ND
5.902.273.552.732.14
Between the crowns
C49.8846.2339.970.460.830.24
1.642.043.040.080.180.04
N0.901.110.890.020.040.01
0.040.100.080.0030.010.001
C/N56.1344.1146.0122.7120.6818.58
3.825.654.424.832.415.06
24-98dwarf shrub-green moss spruce forestBelow the crowns
C47.5743.4834.350.331.15ND
1.431.474.760.060.16
N1.521.691.290.030.07ND
0.070.050.200.0020.01
C/N31.7925.9127.1512.3716.73ND
2.281.040.782.210.95
Between the crowns
C49.8941.4716.410.341.370.39
1.471.553.900.050.430.03
N1.681.120.620.020.070.03
0.060.130.090.0010.020.004
C/N29.8939.7425.9916.2417.5515.92
1.155.033.252.701.312.06
Notes: numerator is the mean, denominator is the standard error. ND—not determined. PMP—permanent monitoring plots. BGC—biogeocoenoses.
Table 4. Carbon (C) and nitrogen (N) in the soil water in 1999–2020 (n = 30–90), mg/L.
PMPBGC TypeElementOE+BBC
23-98lichen-green moss-shrub pine forestBelow
C175.85NDND
10.01
N0.68
0.10
Between
C36.6916.87ND
1.545.38
N0.25ND
0.02
25-02lichen-shrub pine forestBelow
C82.7550.3427.12
4.171.772.66
N0.650.410.41
0.070.060.12
Between
C43.8931.8529.70
2.831.392.01
N0.670.410.31
0.060.050.04
24-98shrub-green moss spruce forestBelow
C84.9252.3423.64
4.635.442.75
N0.870.360.25
0.150.040.04
Between
C47.4723,613.56
2.701.691.3
N0.480.27ND
0.040.05
Notes: O—organic soil horizon (3–5 cm), E+B (15–25 cm)—eluvial soil horizon, BC—illuvial soil horizon (30–40 cm), below—below the crowns, between—between the crowns, numerator is the mean, denominator is the standard error. ND—not determined. PMP—permanent monitoring plots. BGC—biogeocoenoses.
Table 5. Carbon (C) and nitrogen (N) in the living needles and litter in 2005–2020 (n = 10–15), %.
PMPBGC TypeElementCurrent Year1 YearPerennial NeedlesBrown NeedlesLitter
23-98lichen-green moss-shrub pine forestC55.2555.2855.5453.6156.91
0.971.011.561.050.77
N1.161.091.000.450.32
0.040.040.040.020.02
25-02lichen-shrub pine forestC51.7156.2455.0156.28ND
1.571.611.200.80
N1.301.141.090.41ND
0.040.030.030.01
24-98shrub-green moss spruce forestC53.8352.4553.32NDND
1.231.101.16
N1.201.160.96NDND
0.030.040.03
Notes: Numerator is the mean, denominator is the standard error. ND—not determined. PMP—permanent monitoring plots. BGC—biogeocoenoses.
Disclaimer/Publisher’s Note: The statements, opinions and data contained in all publications are solely those of the individual author(s) and contributor(s) and not of MDPI and/or the editor(s). MDPI and/or the editor(s) disclaim responsibility for any injury to people or property resulting from any ideas, methods, instructions or products referred to in the content.

