Article

Greenhouse Gas Fluxes from the Epiphytic Lichens: Incubation Experiments

by
Anastasia I. Matvienko
1,*,
Svetlana Y. Evgrafova
1,2,
Natalia M. Kovaleva
1,
Elizaveta V. Sideleva
2,
Maria V. Sitnikova
2,
Oleg V. Menyailo
3 and
Oxana V. Masyagina
1
1
Sukachev Institute of Forest SB RAS, Federal Research Center “Krasnoyarsk Science Center SB RAS”, 660036 Krasnoyarsk, Russia
2
School of Fundamental Biology and Biotechnology, Siberian Federal University, 660041 Krasnoyarsk, Russia
3
Joint FAO/IAEA Centre of Nuclear Techniques in Food and Agriculture, P.O. Box 100, 1400 Vienna, Austria
*
Author to whom correspondence should be addressed.
Forests 2024, 15(1), 107; https://doi.org/10.3390/f15010107
Submission received: 12 October 2023 / Revised: 22 December 2023 / Accepted: 29 December 2023 / Published: 5 January 2024
(This article belongs to the Special Issue Fixation, Transport and Storage of Carbon by Forest Ecosystems)

Abstract

:
Because they are widespread and evolutionarily old, epiphytic lichens (ELs) play an important role in global forest ecosystems. ELs are abundant in Siberian forest ecosystems, which are highly vulnerable to climate change; thus, ELs can be important contributors to the carbon (C) cycle. This study aims to address the unknown role of tree-inhabiting ELs in the C cycle of forest ecosystems in Central Siberia, where the EL biomass ranges from 492 to 3200 kg per ha. The main finding of this study is that ELs in a hydrated state can generate CH4 for an extended period (at least two weeks), as determined by an incubation method. At the same EL moisture level, EL CO2 fluxes are species-specific. The pattern of the release or uptake of GHGs by ELs may also alter due to climate change, e.g., changes in precipitation regimes (such as more frequent extreme rainfalls and droughts). Therefore, the EL contribution to the C cycle in forest ecosystems should be assessed, e.g., via the modeling of C cycling. Furthermore, specific factors, such as the EL exposure on the phorophyte stem, the EL biodiversity, and the day/night GHG fluxes, should be considered for a more concise assessment of ELs’ contribution to the C cycle of forest ecosystems and their response to ongoing and projected climate change.

1. Introduction

Epiphytic lichens (ELs), or lichenized fungi, play a crucial role in the development of forest communities and are widely distributed in forest ecosystems at middle and high latitudes. They dominate 8% of the world’s land surface, mainly in high-latitude and high-mountain regions [1,2]. Lichens are the first organisms to colonize substrates because they are a symbiotrophic (autoheterotrophic) component of biogeocenoses. Owing to that, they can simultaneously perform photosynthesis, synthesize and accumulate organic materials, and decompose mineral compounds. Numerous studies are currently focusing on the characteristics of the EL distribution in various phytocoenoses [3,4,5,6,7,8,9]. ELs settle on the stems and branches of phorophytes and, in biocenosis, form distinct groups (synusia) that are distinguished by the EL-specific species composition and morphological type. ELs have a high ecological value, and their specific biological characteristics play an important role in environmental improvement, biological diversity, water conservation, and soil formation via nitrogen fixation by the ELs [10]. ELs have valuable ecosystem functions, acting as a food source for mammals and invertebrates and as a habitat for many species [11,12]. They are also highly effective at absorbing pollutants and contributing to nutrient and water cycling by intercepting and holding moisture and nutrients [13]. Furthermore, they can act as environmental indicators for air and water quality and forest continuity [14], as indicators of climate change [15], and have importance to human everyday life and culture (food, clothing, and pharmaceuticals) [16,17]. In addition to its crucial role in ecosystem services, the EL may have a definite but not yet determined impact on the carbon (C) cycle. Considering their distribution and biomass in the Arctic (from 492 to ~3200 kg per ha), ELs may contribute significantly to the C cycle of high-latitude permafrost ecosystems [13,18]. World cryptogamic communities (algae, mosses, and lichens), which also include ELs, take up around 0.05 Pg of N and 3.9 Pg of C per year, which corresponds to 7% of the net ecosystem exchange (NEE) by terrestrial vegetation [19]. In addition to the greenhouse gas (GHG) uptake, cryptogamic communities can emit them, e.g., carbon dioxide (CO2), nitrous oxide (N2O), and methane (CH4) [19,20,21,22,23,24,25]. Emissions of N2O and CH4 by cryptogamous organisms are found to increase at temperatures above 20 °C; therefore, climate change (warming) will provoke higher emissions of GHGs by lichens, Cyanobacteria, and mosses. That is important for temperate latitudes, where cryptogamous organisms are one of the critical sources of N2O [24].
Climate change in high latitudes, including Siberian forest ecosystems, is of great concern, and ELs are essential components of forests. In a recent review, we showed the existing positive trends for soil CO2 and CH4 fluxes in the permafrost ecosystems of Central Siberia [26]. The ability to be highly tolerant to abiotic stresses, such as desiccation, temperature extremes, and UV-light intensities, will be favorable for lichens in the future, since climate models indicate uneven precipitation, temperature increase, and gradually changing levels of UV-B radiation exposure (resulting from depleting ozone) [27,28,29].
ELs associated with boreal tree species are both phototrophs (CO2-assimilating organisms, like green algae and/or Cyanobacteria) and heterotrophs (e.g., bacteria, fungi, Archaea, and fungus yeast) [30,31]. Photobionts participate in C fixation and its transformation into sugar alcohols; later, photosynthetic products are used by the mycobiont [32]. Meanwhile, there have been relatively few studies on how ELs contribute to the C cycle. Numerous studies have demonstrated that components of ELs (fungi, Cyanobacteria, Archaea, bacteria, etc.) actively contribute to the C cycle via GHG emission/uptake. Thus, ELs can fix atmospheric C via photosynthesis and store it in their biomass. Additionally, the components of lichens (such as Cyanobacteria, fungi, Archaea, and bacteria) are known for their ability to emit CH4, which is a more potent greenhouse gas than CO2 in the context of climate change [33,34].
We hypothesize that ELs may have an impact on the C cycle of an ecosystem via their associated Cyanobacteria, fungi, green algae, bacteria, and Archaea, which are known for their capability to emit GHGs (CO2 and CH4). Therefore, to understand the potential impact of ELs on C fluxes in forest ecosystems, we carried out a series of laboratory incubation experiments. To fulfill this aim, we settle the following tasks: (1) to evaluate the projecting cover and the occurrence of ELs in a birch forest (Siberia); (2) to assess the diel dynamics of EL CO2-photoassimilation and respiration; (3) to estimate the capacity to evolve CH4 by the most widespread EL species inhabiting the birch trees in the study sites.

2. Materials and Methods
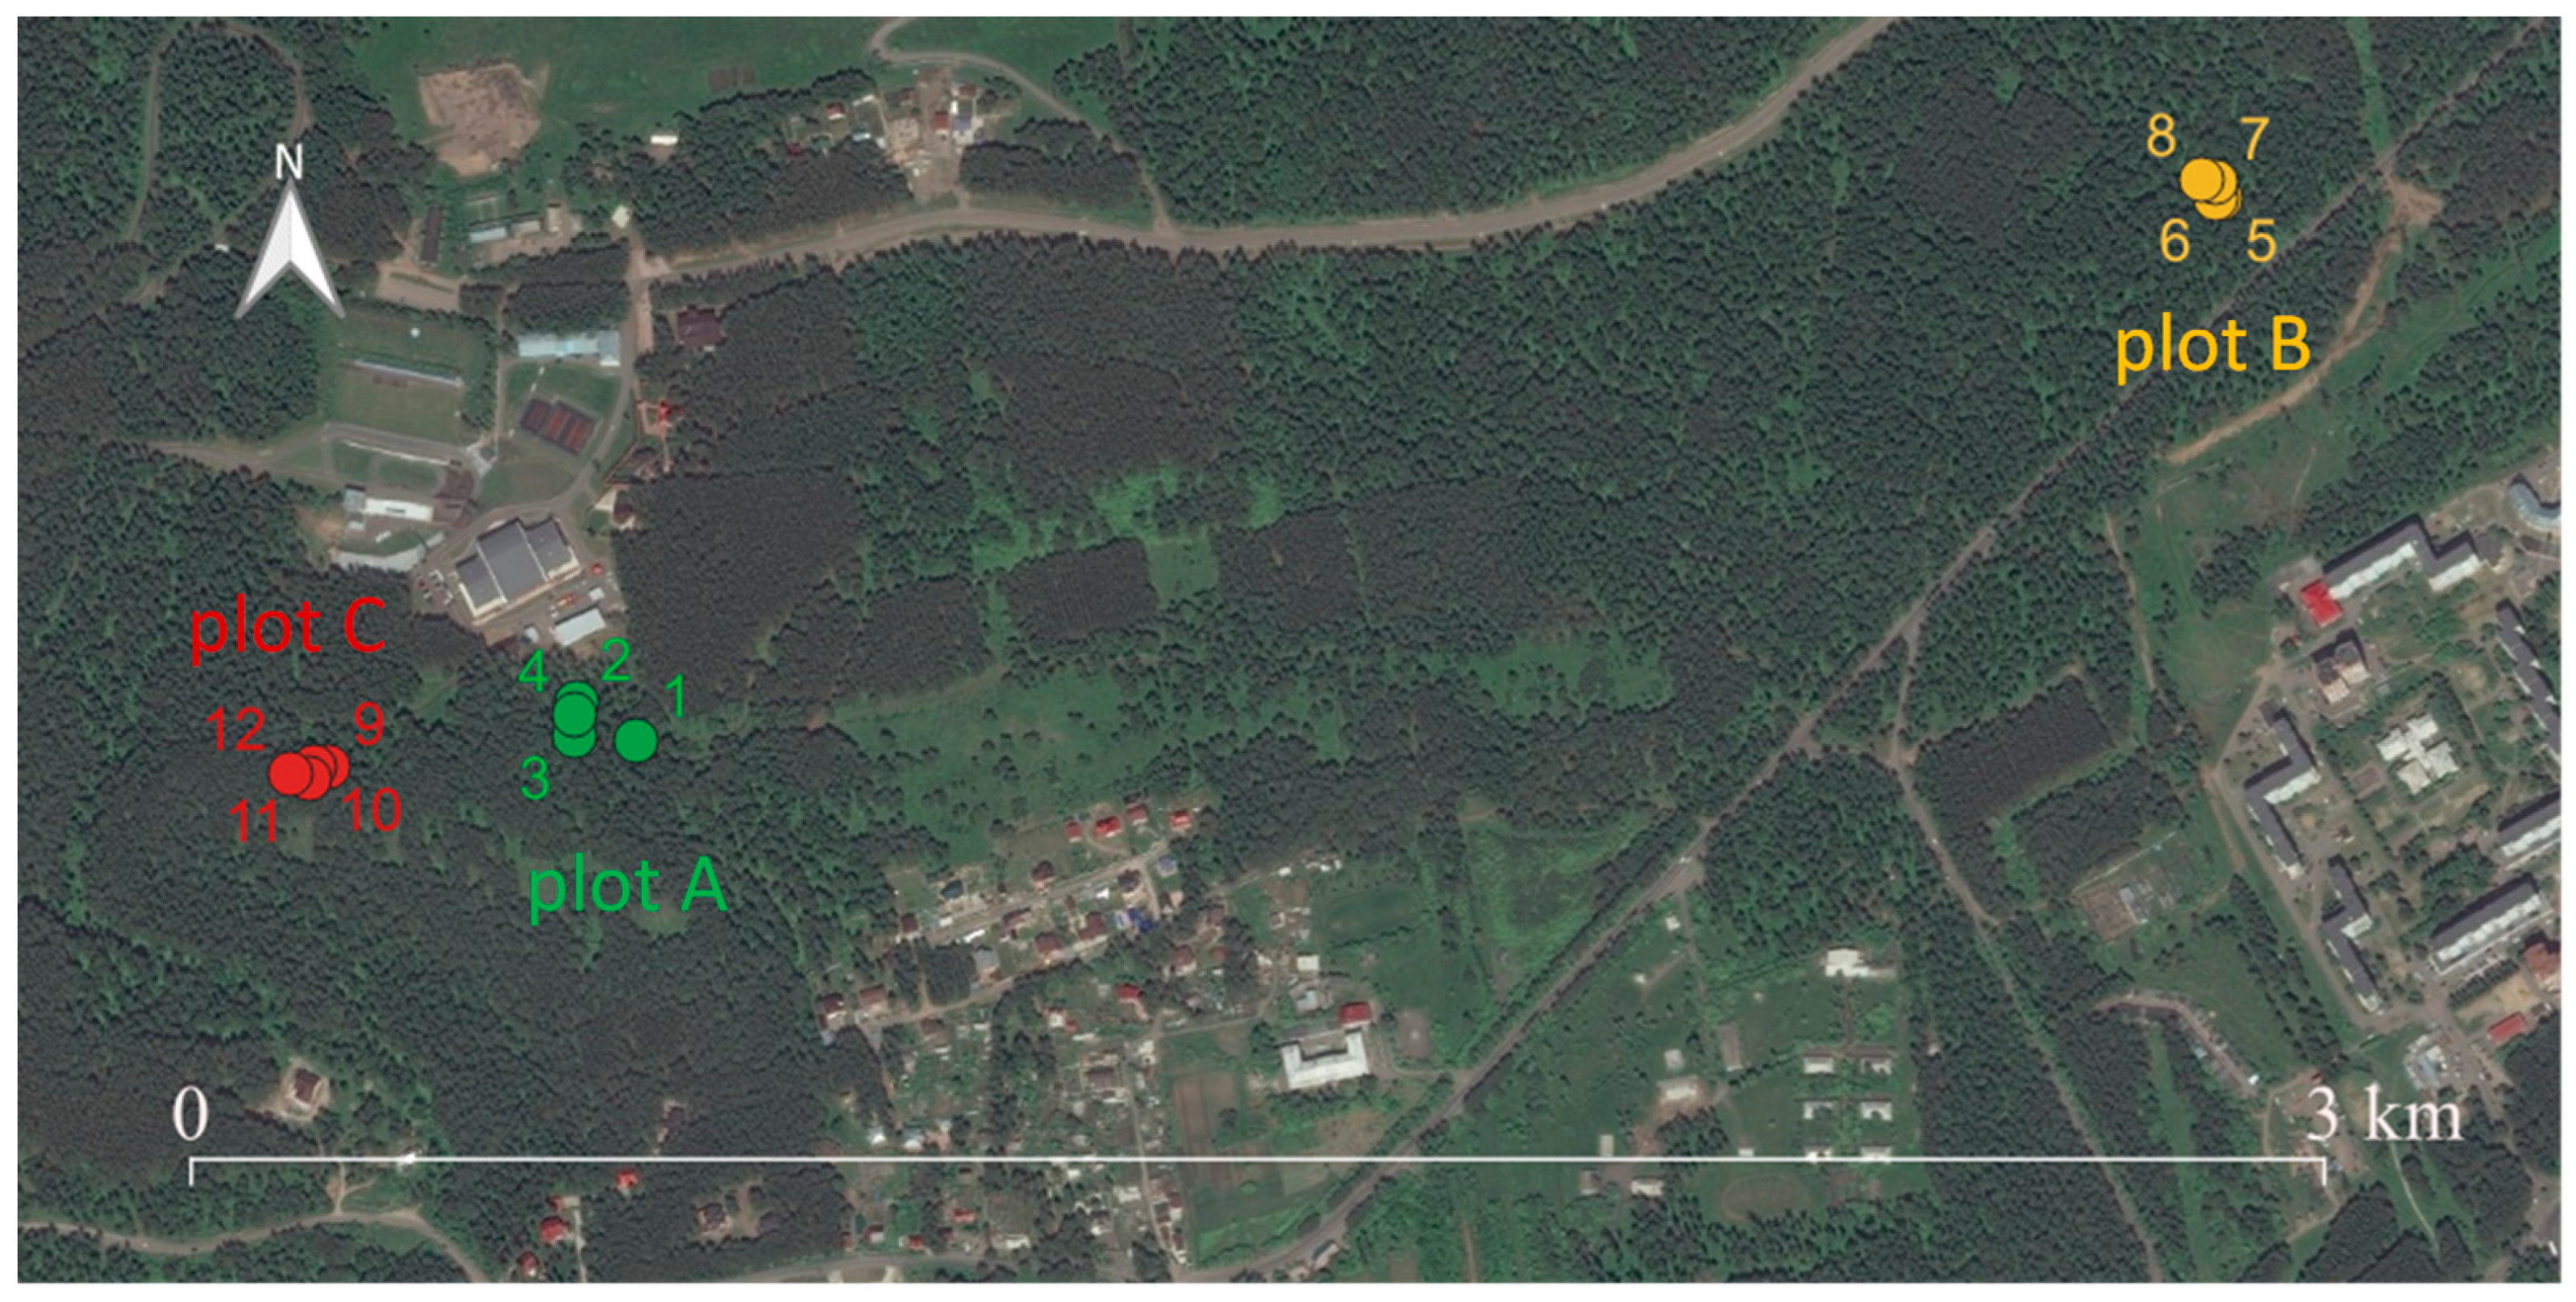
2.1. The Study Site

The study sites are located in the Gremyachaya Griva Eco-Park in Krasnoyarsk (Siberia, Russia) (Figure 1). Krasnoyarsk lies in the zone of the continental climate. The region is characterized by a long winter with little snow, with persistent severe frosts, a short warm summer, a short dry spring with late returns of cold weather (frosts), and a short autumn with early frosts and frequent returns of heat. The mean air temperature in January is −18.3 °C, and in July it is +19.4 °C. Annual air temperature amplitude (based on monthly averaged values) is 38 °C. The sum of active air temperatures (ΣT > 10 °C) during the nonfrost period (ca. 120 days) accounts for 1600–1875 °C [35,36,37]. The annual sum of precipitation is 316 mm, and the maximum amount occurs in the summer. Precipitation in summer is predominantly rainfall. From the end of May to the beginning of June, droughts are frequent. The snow period lasts from November to mid-April. Southwestern winds prevail in the autumn–winter period, and western winds dominate in the summer–autumn period [35,38].

2.2. Study Objects

The study focused on three EL species: Parmelia sulcata Taylor, Hypogymnia physodes (L.) Nyl., and Evernia mesomorpha Nyl., growing in a birch forest mixed with pine in the Gremyachaya Griva Eco-Park in Krasnoyarsk (Figure S1). These species prevail at a height of 1–1.5 m of the birch stem (up to 14% of the total projecting cover of the ELs), and are the most common species (up to 90%) in the study area (Table 1).

Species Characteristics

Hypogymnia physodes is a foliose lichen in the family Parmeliaceae. The upper surface of its thallus is smooth, gray, or gray–green with brownish lobe ends, while the lower, dark part, becoming pale brown towards the margin, is strongly wrinkled. The diameter of the thallus reaches 10 cm. The photobiont is the green algae Trebouxia [39]. Hypogymnia does not have rhizines and attaches to the substrate by wrinkles. Hollow lobes are 2–3 mm wide. The bottom is often coated with white, powdery soredia and the outer edge curves upward. The lower surface of the lobes is black and folded, with a lighter color near the lobe edges. The pycnidia are black and abundant and, if present, create a pepper-like effect across the upper surface. Because of its abundance and its moderate sensitivity to sulfur dioxide and heavy metals, Hypogymnia physodes is often used in bioindicator and biomonitoring studies that enable the assessment of air pollution and other environmental conditions. This species is common in boreal and temperate ecosystems in the Northern Hemisphere.
Parmelia sulcata is a foliose lichen in the taxon Parmeliaceae and one of the most prevalent lichens due to its high pollution tolerance and global distribution. It harbors a unicellular Trebouxia green algal symbiont [39]. It is defined by a thallus that is typically circular and has a black lower surface. An upper cortex can vary in color from glaucous white to gray. The thallus is broadly lobed. Each lobe width is varied from 2 to 5 mm, and the lobes are overlapping. In temperate to cold regions in both the Northern and Southern Hemispheres, Parmelia sulcata is a widespread species.
Evernia mesomorpha is a fruticose lichen in the family Parmeliaceae. The thallus is bushy and upright, in the form of hanging or protruding bushes (2.5–10.0 cm in length), and attached to the substrate using a pseudogomph. The lobes are 1.0–2.5 mm in width, dichotomously branched, more or less flattened, sometimes slightly rounded, radial in structure, and equally colored on both sides. The photobiont is the green alga Trebouxia [40]. Soredia are point-shaped, whitish or grayish, often numerous, and covering the entire surface of the lobes. Isidia are short, occasionally up to 2 mm in length, rod-shaped, simple or branched, and grayish. They can also infrequently arise in an abundance. Apothecia develop quite rarely, up to 3 mm, located at the edges of the thallus lobes, saucer-shaped, with a dark-brown disk surrounded by a thin edge, which is the same color as the thallus. It can be found in the temperate and tropical zones of Asia, Europe, and North America, including Mexico and the Arctic zone; in Russia, it is distributed throughout the entire territory.

2.3. EL Sampling and Probe Preparation

The EL collection sites were chosen following the European standard method outlined by Rocha et al. [41]. Every plot (A, B, and C) represented a centroid with a diameter of 50 m in a homogenous vegetation patch dominated by Betula pubescens Ehrh. in the canopy. At the three replicate plots (A, B, and C) along the 3 км transect, twelve model trees of Betula pubescens with four trees in each of the three plots were selected to assess the EL biodiversity and GHG fluxes from the prevailing EL species to understand the potential contribution of the ELs in the area with the certain EL biodiversity (Figure 1, Table 1). Model trees were selected to be erect, not oppressed, without signs of pathology, and the most uniform in morphology. For each tree, we determined the tree age (from cores taken with an age drill at a height of 130 cm), tree height (using TruePulse 200b Laser Rangefinder, Laser Technology, Inc., Centennial, CO, USA), and stem diameter (DBH; at a height of 130 cm using the Hultafors Talmeter 3 m) (Table 1). In June–August 2023, EL thalli were carefully sampled at a height above 1 m (within the band from 1 to 1.5 m) from the northern, western, or southern sections of the stem of the model trees where they were found in sufficient abundance. The samples were packed in zip packages, transferred to the laboratory, and immediately weighed to obtain the weight of the fresh ELs. After that, they were air-dried and stored until the incubation experiments. On the same trees where the ELs were sampled, the epiphytic cover was described (see Section 2.4, Table 2).

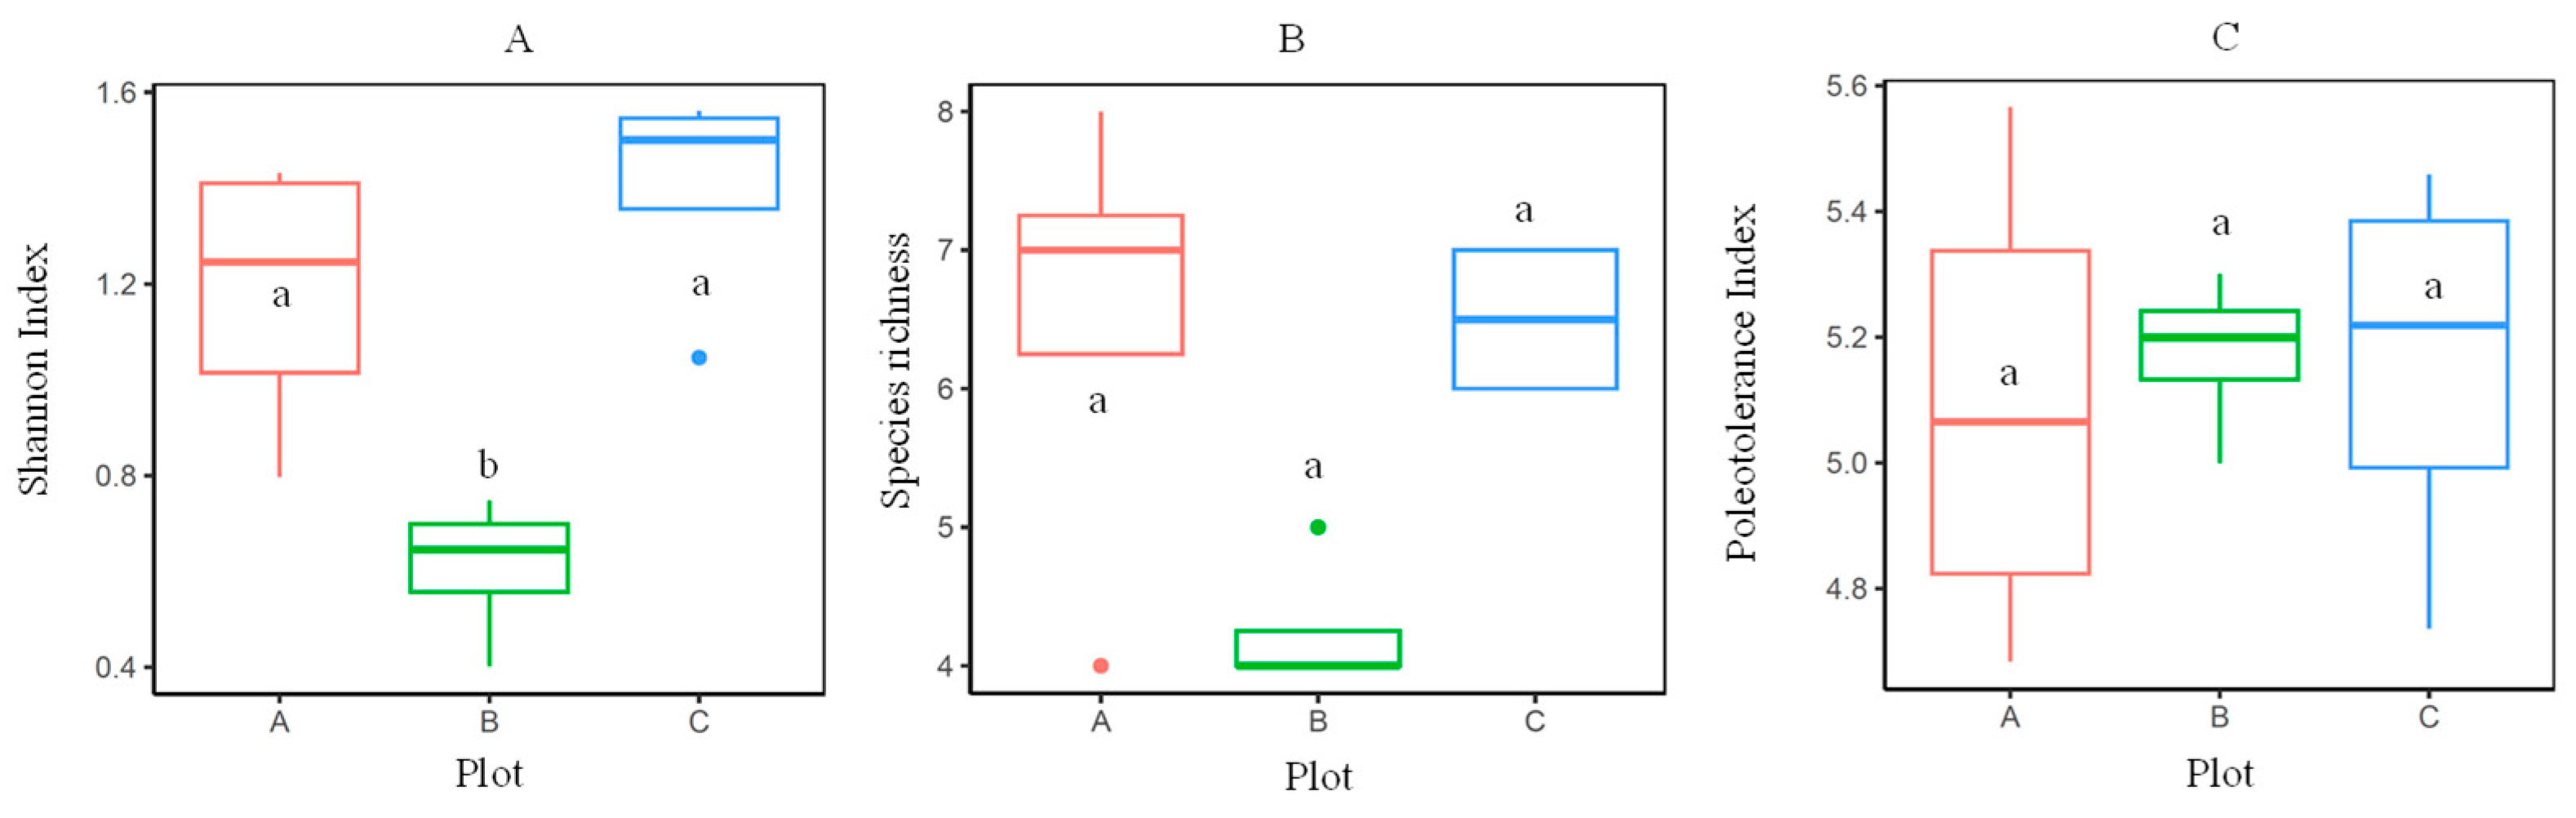
2.4. Methods for the Assessment of EL Diversity

Before taking the EL samples for the subsequent incubation experiments, the epiphytic cover was assessed using the same twelve model trees of Betula pubescens at a stem height of 1–1.5 m (Figure 1). The projecting cover of the ELs was assessed using frames of 10 × 62 cm2 consisting of five 10 × 10 cm2 square slots. For that, the frames were fixed on the stem of the model tree at every exposure (northern, western, eastern, and southern) at a height of 1 m (a total of 20 slots per model tree). The species composition and projecting cover were assessed at each slot (a total of 240 slot descriptions). The occurrence of the studied EL species (%) on the stem height of 1–1.5 m of the birch trees was determined by the ratio of the number of trees on which the lichen was found to the total number of trees.
To assess the potential impact of the EL species diversity on the EL C fluxes, the Shannon index, species richness, and poleotolerance index were calculated. The Shannon index is based on the relative abundance of species and determines the EL species richness. This index refers to heterogeneity indices, since it takes into account both the evenness and species richness. This index adds more detail to biodiversity assessments than species richness indices that rely on a single parameter. The Shannon index usually varies from 1.5 to 3.5, rarely exceeding 4.5 [42]. The higher the Shannon index value, the higher the species diversity in a particular community. A Shannon index = 0 indicates a community consisting of only one species. The poleotolerance index reflected the air pollution level in the area [43,44,45,46] and was assessed according to Truss [43].

2.5. EL Incubations

In the laboratory, air-dried EL samples were separated from the substrate (bark, mosses, etc.) after they were soaked in artificial rainwater [47] for 10–20 min. Then, the hydrated EL samples were air-dried again until the incubation experiments.
Two incubation experiments were carried out to measure the EL gas exchange. This approach enables the determination of key parameters, such as the net CO2 photoassimilation rates and the CO2 losses associated with dark respiration and photorespiration, which are fundamental processes that characterize lichen growth and their ability to adapt to changing environmental conditions, such as humidity, temperature, and anthropogenic pollution [48,49,50]. A one-day aerobic preincubation was conducted at room temperature, during which the incubation jars were covered with lids to maintain a controlled environment. The first experiment was conducted to assess the diel CO2 fluxes by two EL species—foliose Parmelia and fruticose Evernia—of northern and western exposure on the birch stem. The second experiment encountered the CO2 and CH4 fluxes by the ELs during the two-week incubation.
In the first incubation experiment, the air-dried 3 g samples of the ELs (Evernia and Parmelia collected from the northern and western exposures of the birch trees at plot A) were placed in 500 mL incubation jars (a total of 14 jars). The jars with the EL thalli, after they were hydrated to ca. 800% of water content by spraying the ELs with artificial rainwater, were placed in a Peltier-cooled incubator with a programmable temperature-control system (Memmert, Schwabach, Germany) and a built-in illumination system, comprised of four LED lamps (Camelion LED13-A60/830/E27, Moscow, Russia), providing a cumulative photosynthetically active radiation (PAR) range of 160–220 µmol m−2 s−1 (Figure S2B). Throughout the three 24 h long incubation series, the controlled photoperiod with the different light and temperature conditions was applied: 18 h of illumination at a temperature of +18 °C during the period from 6 a.m. to 24 p.m., and then 6 h without illumination at a temperature of +14 °C during the night (0–6 a.m.). The achieved level of EL water content was controlled by a weight method. To monitor the CO2 flux rates, measurements were taken every two hours using an infrared CO2 analyzer (Li-Cor 8100A) and a 16-port Li-Cor 8150 multiplexer (Li-Cor Incorporated, Lincoln, NE, USA) specifically designed for this purpose. The results of three diel series of CO2 flux measurements were averaged for every 2 h. The CO2 flux rates were expressed as μg C-CO2 g−1 of the dry weight of EL h−1. These measurements enabled the evaluation of the CO2 flux rates throughout the entire incubation period, capturing any variations under the specified experimental conditions.
The second experiment was designed as a 14-day aerobic incubation with the ELs, with five variants, each being 3-replicated. The variants were as follows: EvCN is Evernia of a northern exposure from the C plot; HypCN is Hypogimnia of a northern exposure from the C plot; ParAN is Parmelia of a northern exposure from the A plot; ParBW is Parmelia of a western exposure from the B plot; ParCN is Parmelia of a northern exposure from the C plot. For the incubation, 1 g samples of air-dried ELs were placed in 125 mL incubation jars, SIMAX 2070/M/100 mL (Kavalierglass, Sázava, Czech Republic). The ELs were then hydrated using artificial rainwater to achieve a humidity level of 400%. The EL samples were incubated under controlled conditions, with a photoperiod of 18 h of light and an air temperature at +18 °C, followed by 6 h without illumination at an air temperature of +14 °C in a Peltier-cooled incubator with a programmable temperature-control system (Memmert, Germany) and a built-in illumination system (Figure S2C). The illumination facility consisted of two types of lamps to provide an optimal EL PAR level of 160–220 µmol m−2 s−1: three lamps of Camelion LED13-A60/830/E27 with visual spectrum and one lamp of REPTILE UVB200 PT2341 with a UVB spectrum of a high intensity. The achieved level of the EL water content was controlled by a weight method. Gas sampling was performed on days 0, 1, 3, 7, 10, and 14 of the incubation period. During these sampling dates, the ELs were incubated in closed vessels for 2 h under illumination at 18 °C; then, the gasses were collected using 60 mL Luer Lock syringes via the septa in the jar lead for the subsequent analysis of the CO2 and CH4 concentrations using the Cavity Ringdown Spectrometer Picarro G2201-i analyzer. The GHG fluxes were calculated using Formula (1):
F = C 2 C 1 × V × M 24.5 × m × t
where F is the CH4 or CO2 flux (μg CH4 or CO2 g−1 of the dry weight of EL h−1); C1 is the concentration of gas (CH4 or CO2) before the 2 h incubation (ppm); C2 is the concentration of gas (CH4 or CO2) after the 2 h incubation (ppm); V is incubation jar volume (liter); M is molar mass of the CH4 or CO2 (16.043 or 44.01 g mol−1); 24.5 is one mol of air (liter per mol); m is the EL sample dry weight in the incubation jar (g); t is the incubation period of 2 h (h). The flux rates of the gasses were then expressed per C (μg C-CH4 or C-CO2 g−1 of the dry weight of the EL h−1), where the negative fluxes reflected the CO2 photoassimilation, because we analyzed the difference in the CO2 concentration before and after the 2 h incubation of the ELs in the closed vessel; therefore, this was the result of both processes (photosynthesis and photorespiration) [51,52]. The negative fluxes of the CH4 represent the consumption. The positive values reflect the respiration or the CH4 production.

2.6. Data Examination

The differences in the Shannon index, species richness, and poleotolerance index of the ELs in different plots (A, B, and C) were assessed using Kruskal–Wallis comparisons of the means analysis, and pairwise comparisons using the Wilcoxon rank sum test. We applied a bootstrapping technique and produced 50 bootstrap replicates for every variant per sampling date using the ‘boot’ R package to reduce the variability in the GHG fluxes [53]. Differences between variants were assessed by pairwise comparisons using the Wilcoxon rank sum exact test. The EL GHG (CO2 and CH4) fluxes were assessed regarding the effects of the EL species, the photoperiod conditions, the EL exposure on the tree stem, and the incubation time using ANOVA in the STATISTICA 10 package (StatSoft, Tulsa, OK, USA). All statistical analyses and visualizations were performed in R software (ver. 4.2.3, 15 March 2023—“Shortstop Beagle”) using the following R-packages: “ggplot2”, “ggpubr”, etc.

3. Results

3.1. Assessment of the EL Biodiversity

The studies showed that, at a stem height of 1–1.5 m, the EL species richness varied from four to eight species. The northern and western sides of the Betula pubescens stems had the largest projective cover of ELs. The smallest lichen projective cover was found on the stem’s eastern side. On the northern side of the stem, Parmelia sulcata was dominated with a projecting cover ca. 11%. On the western sides of the stems, Parmelia sulcata also prevailed, with a projecting cover ca. 10%. Evernia mesomorpha and Parmelia sulcata were found in all model trees (Table 2). Among the studied ELs, Parmelia sulcata was characterized by the maximum occurrence (30–90%). The occurrence of Evernia mesomorpha and Hypogymnia physodes varied widely from 5% to 85%. Variations in the quantitative indicators (occurrence, projective cover) showed that the ELs were highly sensitive to a variety of environmental factors that contributed to the uniqueness of the habitats on the birch stems.
According to the evaluation using the Shannon index and species richness index, the biodiversity of the ELs on the birch trees was low and rather consistent across the three examined plots (Figure 2). Interesting to note that the Shannon index was significantly lower, and the species richness at plot B was visually lower, possibly due to the high heterogeneity of the studied parameters at this plot (Figure 2A,B). The poleotolerance index (C) showed a similar pollution load among the study plots (Figure 2C).

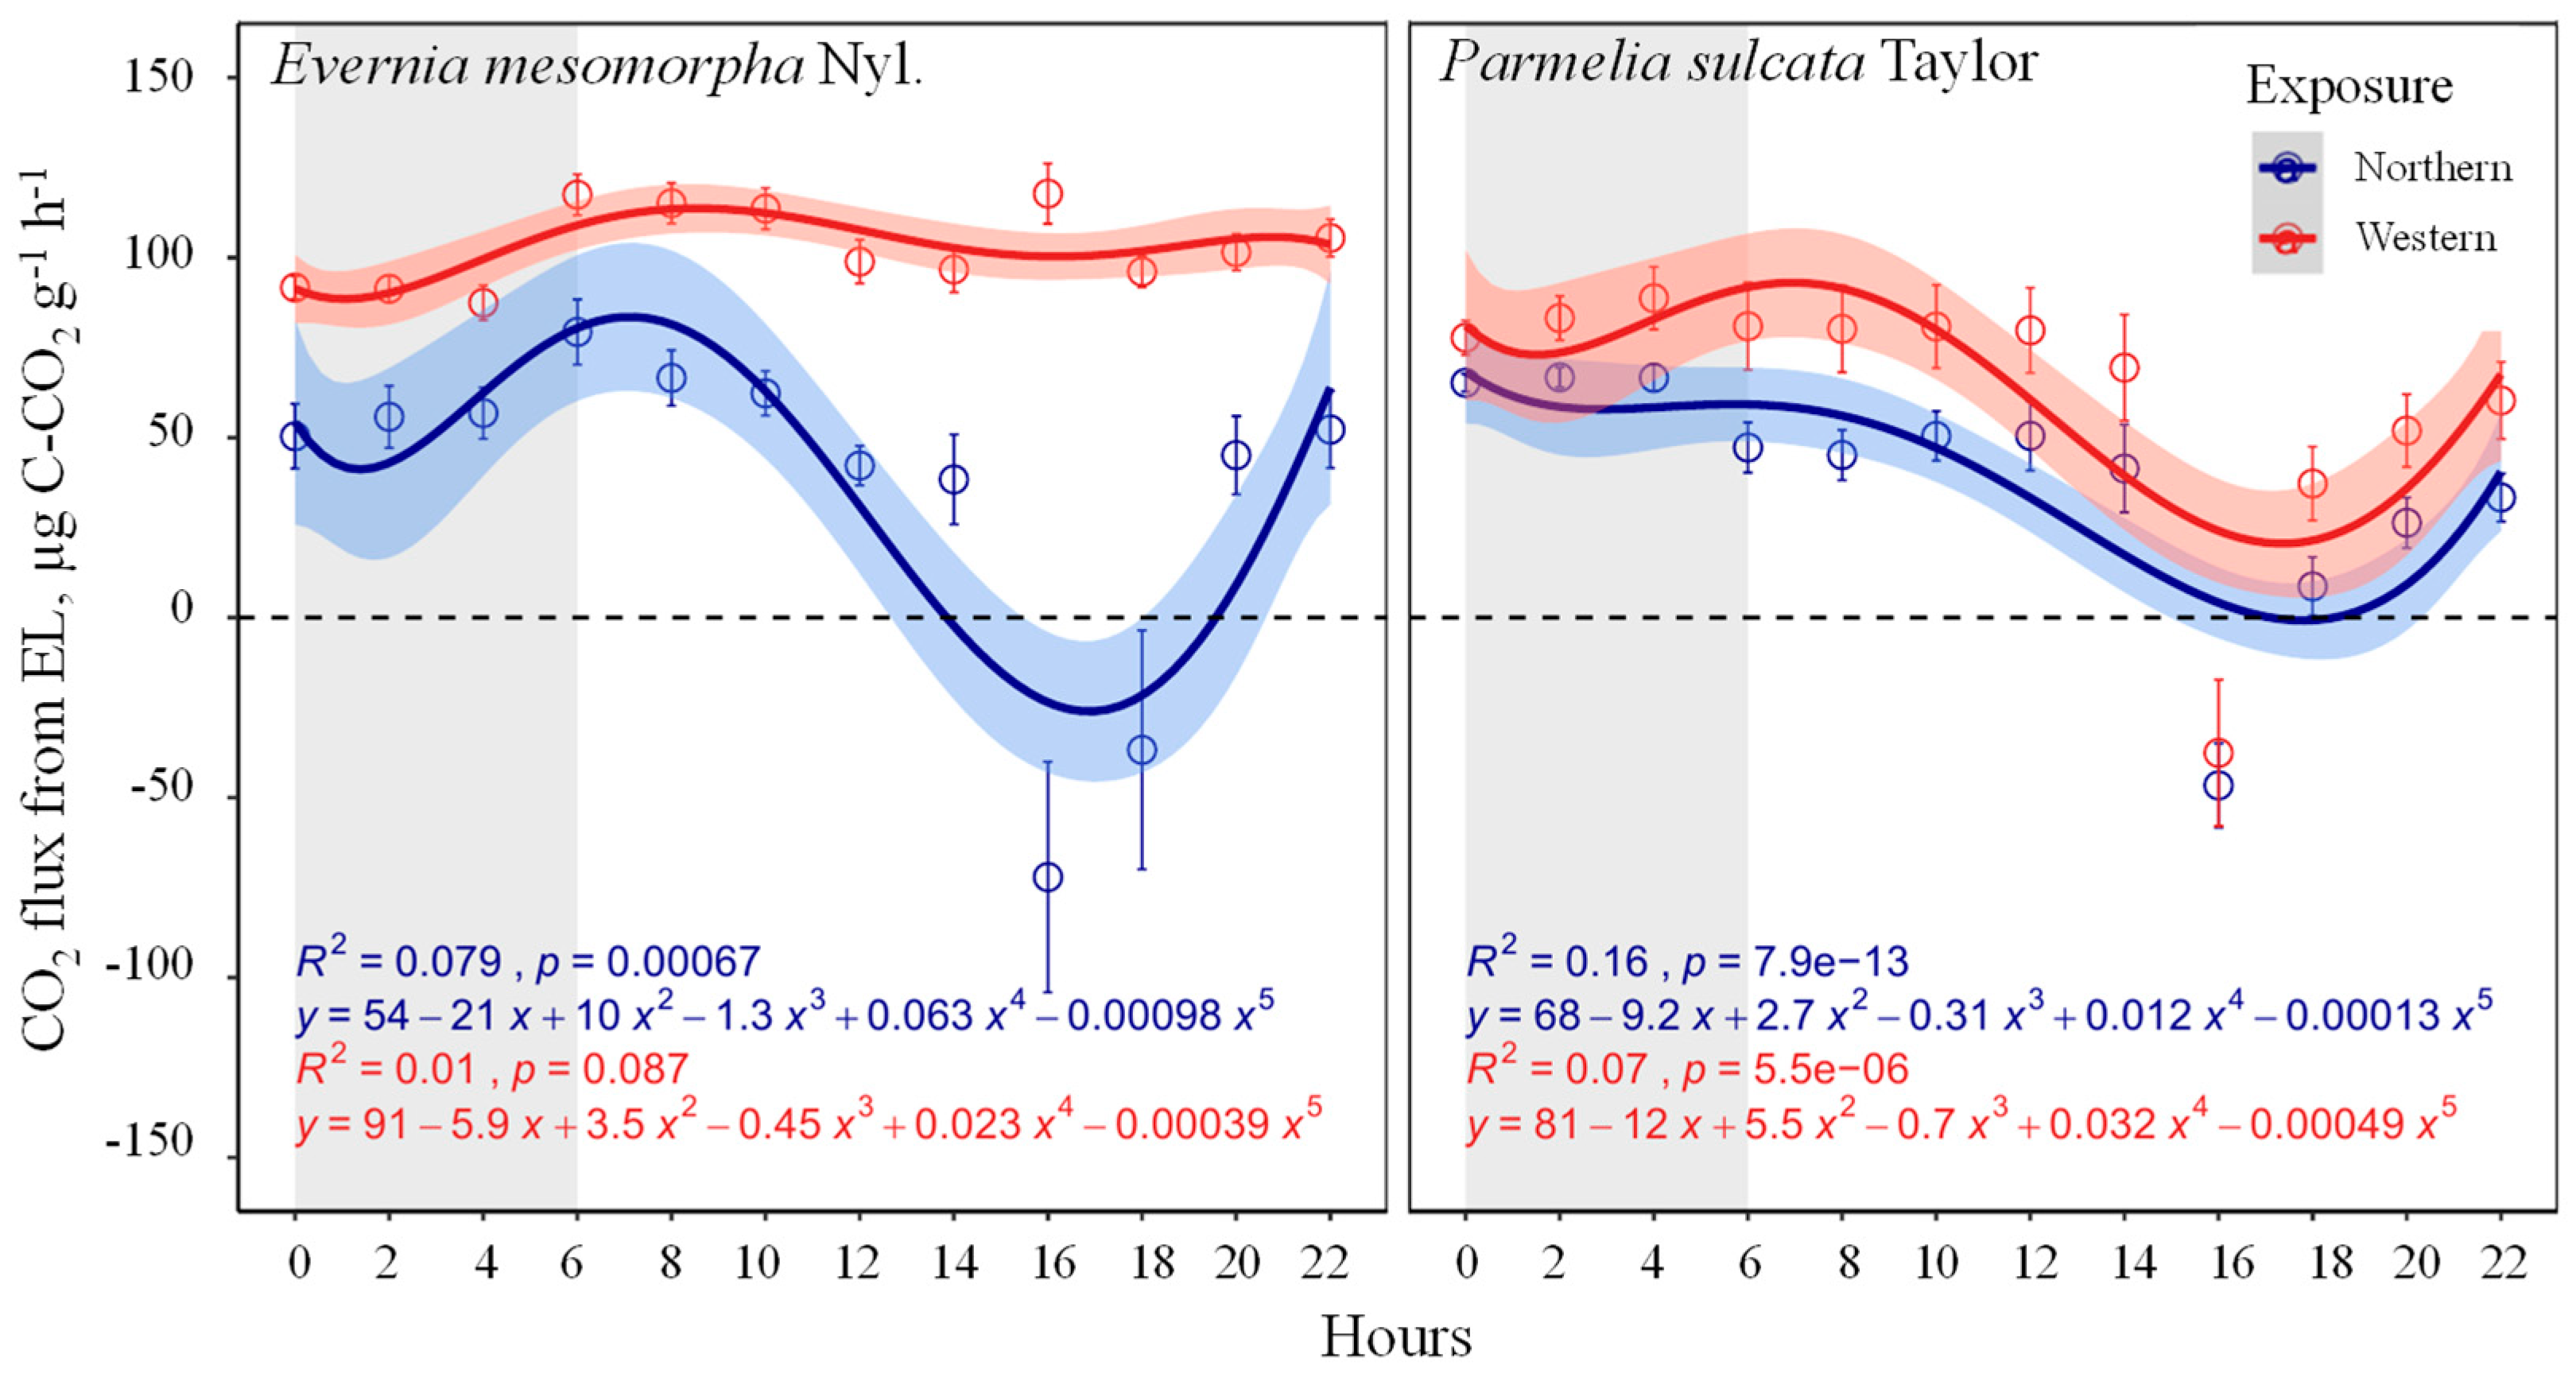
3.2. Diel Dynamics of CO2 Fluxes by the ELs

In the first incubation experiment, the factorial ANOVA showed that all studied parameters (the EL species, photoperiod conditions, and the exposure of the EL on a tree stem) had an effect on the CO2 fluxes as individual factors and in the combination of factors (Table 3). For example, the EL exposure on a tree stem significantly affected the rate of the CO2 flux (Figure 3). Both Evernia and Parmelia of the northern exposure showed significantly lower respiration (p ˂ 0.001) than those of the western exposure both in illuminated and nonilluminated conditions; the CO2-photoassimilation was higher in the north-exposed ELs. Moreover, the west-exposed Evernia did not display photoassimilation at all. North- and west-exposed Parmelia generally repeated the patterns on the CO2 fluxes during the 24 h period, with one exception: both west- and north-exposed Parmelia demonstrated similar rates of CO2-photoassimilation in the daytime. In both species of the northern exposure, an intensive process of photoassimilation was confirmed (up to 121.6 μg C-CO2 g−1 of the dry weight of ELs per hour) during the illuminated period.

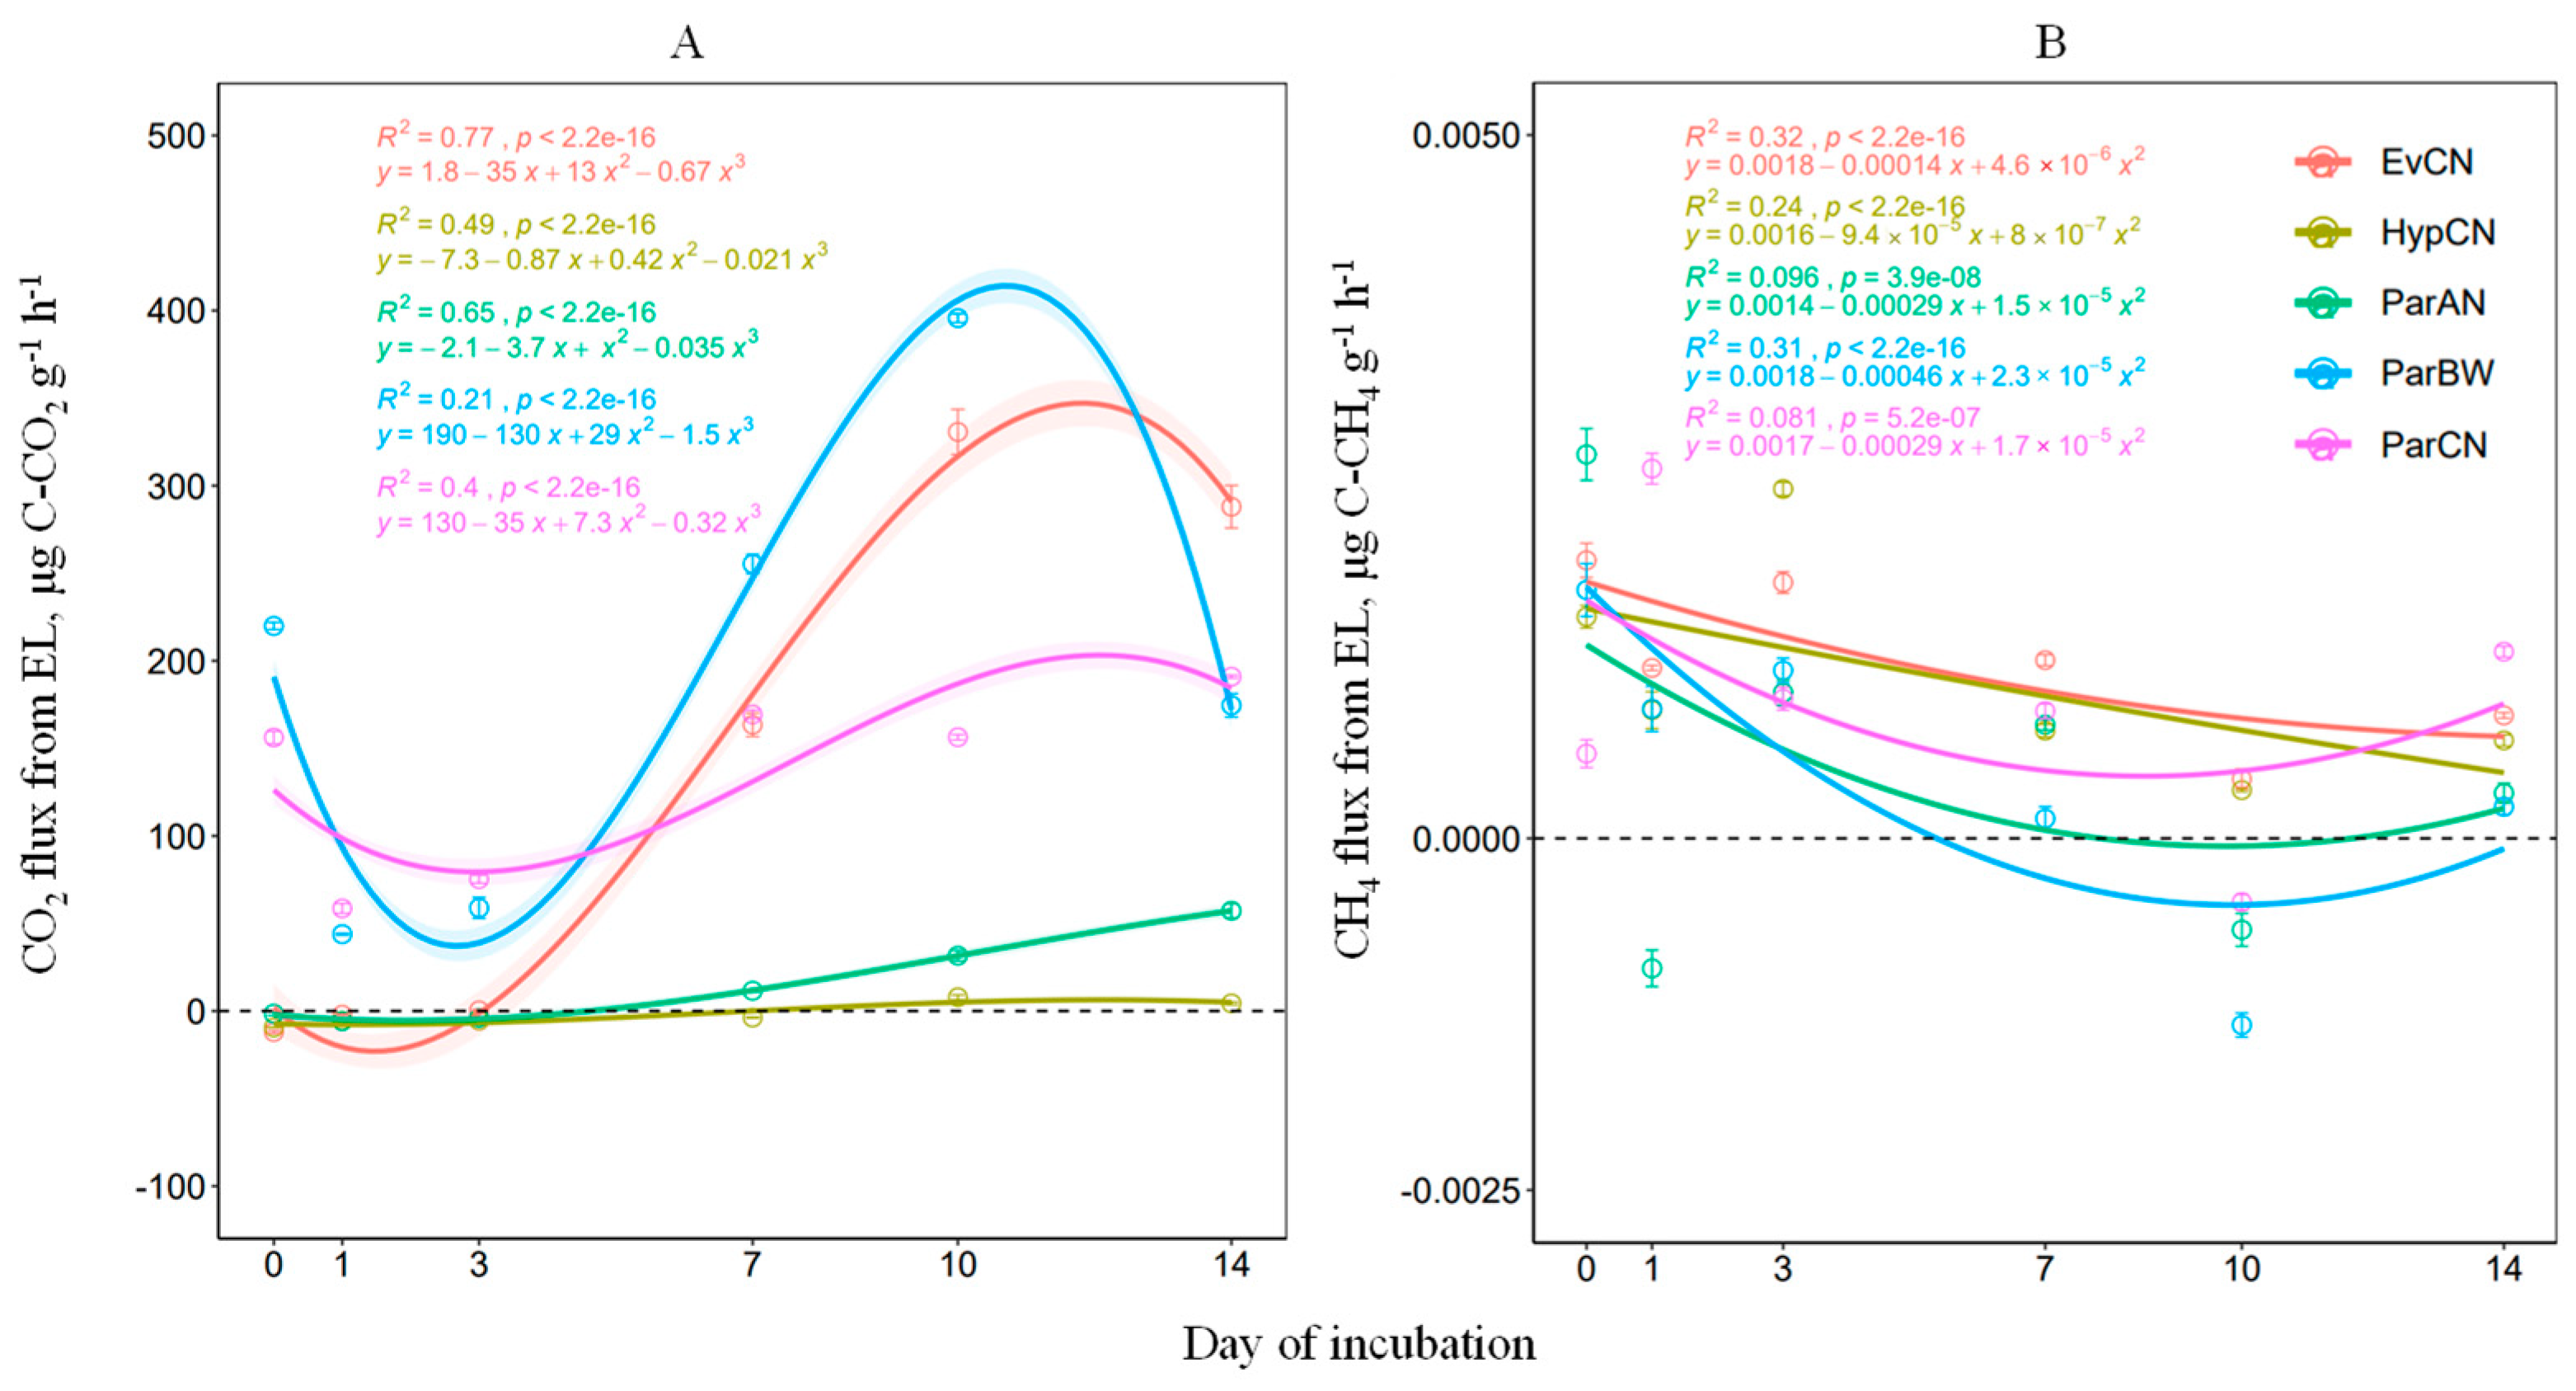
3.3. Assessment of CH4 and CO2 Fluxes by the ELs

In the second incubation experiment, the rANOVA showed that the studied factors (the EL species and the time of incubation) had different effects on the CO2 and CH4 fluxes by the ELs (Table 4). For example, the CH4 fluxes by the ELs were not species-specific (they did not differ significantly among EL species), though the CO2 fluxes (both dark respiration and CO2-photoassimilation) significantly differed among the EL species.
During the second experiment, the CH4 release was recorded in all studied EL species: Evernia (0.06–4.3 ng C-CH4 g−1 of the dry weight of ELs per hour), Hypogymnia (0.2–3.1 ng C-CH4 g−1 of the dry weight of ELs per hour), and Parmelia (0.06–6.1 ng C-CH4 g−1 of the dry weight of ELs per hour) (Figure 4).
During the entire course of the experiment (14 days), the CO2-photoassimilation of the EL in a permanently hydrated condition within the 2 h illuminated period of incubation was found only in Hypogymnia (Figure 4). Its mean values varied from −1 to −11 μg C-CO2 g−1 dry weight of ELs per hour. Evernia (collected from the north-exposed stem side in plot C) and Parmelia (collected from the north-exposed stem side in plot A) in the hydrated condition demonstrated CO2-photoassimilation during the first three days of the experiment; after that, the ELs switched to the CO2 emission up to the end of the incubation. The other two Parmelia variants (collected from the north-exposed stem side in plot C and the west-exposed stem side in plot B) sustained high levels of CO2 emissions during the entire incubation experiment (2 weeks) (Figure 4).

4. Discussion

To this day, little is known about the ELs of Krasnoyarsk and their surroundings. The studies were mainly carried out in the Stolby State Nature Reserve in the southern part of Krasnoyarsk. In his work, Dubrovsky [54] documented 68 EL taxa belonging to 66 species. An inventory of ELs by Perova [55] included 82 species. Otnyukova [56,57,58] provided data on 69 species for the Stolby State Nature Reserve. As revealed by our study, the Shannon index, which, in our case, ranged from 0.4 to 1.56, with an average value for all study sites of 1.1, indicated that the ELs at the study location had a relatively low diversity. According to published sources, this variation range lies at the lower limit of the Shannon index range (from 1.5 to 3.5) [42]. Despite that, in this biogeocenosis, the studied ELs (Parmelia sulcata Taylor, Hypogymnia physodes (L.) Nyl., and Evernia mesomorpha Nyl.) appeared to contribute to the C cycle due to their high occurrence and projective cover (Table 2). Numerous variables, including the physical and chemical characteristics of the substrate (i.e., phorophyte’s bark or cortex), such as the pH, structure, division, rigidity, and frequency of peeling, can affect the distribution of ELs, as well as the CO2 exchange (CO2-photoassimilation and respiration) of the ELs [59,60,61]. For example, crustose lichens with an endophleoid thallus typically grow on young deciduous trees with smooth bark. The bark’s qualities alter as it ages: it becomes rougher, with fissures and roughness. That causes a change in the composition of the ELs living on it. Foliose and fruticose ELs develop on this bark. In addition, the age parameters of phorophytes influence the species composition, abundance, and quantitative properties of the ELs [6,60,62,63,64,65,66,67]. It was found that ELs are dependent on the DBH of the tree [5,66,68,69,70,71,72]. Furthermore, the composition of the EL synusia on the same tree stem varies with height above the ground; in this case, the distribution of the ELs is determined not only by the physical features of the bark, but also by the environmental factors, such as light, humidity, etc. Our findings show that EL exposure on the stem visually affects the projective cover and Shannon index of the ELs (Figure S3). Moreover, it influences the EL CO2 exchange, i.e., the presence or lack of photosynthetic activities and respiration rates. In contrast to the north-exposed Evernia, CO2-photoassimilation did not occur in the daily photoperiod incubations in the west-exposed Evernia (Figure 3). One of the components of ELs is the photobiont, which is represented by autotrophic organisms, such as green algae, that are susceptible to toxicological pressure. We hypothesize that the lack of photosynthetic activity can be related to the aerotechnogenic load that is a characteristic of Krasnoyarsk, which is an industrial center and employs coal burning for central heating, and that the most prevalent westward winds can transfer pollutants via air streams. On the one hand, ELs are known for their potential to accumulate numerous aerogenic pollutants in the phycobiont thallus, including hazardous ones, such as heavy metals. Additionally, they can tolerate extended cycles of hydration and dehydration, during which contaminants accumulate in the phycobiont thallus. Kryuchkova [38] demonstrated that the study sites, according to the poleotolerance index, belong to the zone of initial pollution. According to our data, collected almost 20 years later (based on our data, the poleotolerance index varied from 4.7 to 5.6; Figure 2), the situation with the pollution status of the studied birch forests worsened; now, we identify these forests as areas of light or moderate pollution, with no differences in the aerotechnogenic influence among the study plots (Figure 2). Such a state of biocenosis can affect both the biodiversity and the physiological characteristics of the ELs. Under the primary southern and western wind direction, the ELs located at the western and southern parts of the stem will encounter an elevated aerotechnogenic burden in the form of harmful chemical accumulation (likely heavy metals and coal combustion products) [73,74,75]. This is supported by the pH data measured at the birch bark (Figure S4) [76] where the ELs were collected. The pH and TDS values of the south-exposed bark were higher than those measured at the north-exposed bark. Southern areas of Krasnoyarsk are a cluster of industrial and energy facilities; for example, thermal power plants using coal, and in the western area, there is a private sector where households have been using coal for heating for decades. In contrast to the ELs with a northern exposure, such ELs (Figure 3) lacked CO2-photoassimilation in light and were more vulnerable to long-term hydration. During this time, it is likely that excessively accumulated toxic substances in the thallus impeded the physiological activities in the photobiont, including CO2-photoassimilation. In addition to the suppression of CO2-photoassimilation, the formation of brown patches in the west-exposed ELs in our incubation studies confirmed this. The melanization of the thalli due to UVB exposure can occur as a result of melanin formation in the phycobiont, which is one of the secondary metabolites that provide a variety of survival purposes in the natural environment [77,78]. In our study, brown spots cannot be the consequence of phycobiont thallus melanization during incubation under UVB radiation conditions (as in our second experiment with a UVB lamp, Figure 4), because thallus melanization does not impede photosynthetic processes in the photobiont due to the photoprotective capacity of melanin [79,80,81]. Furthermore, in the first incubation experiment (Figure 3), we solely employed LED lamps, which do not emit UVB light. Accordingly, high aerotechnogenic pressure, which is reflected in the buildup of pollutants in the phycobiont thallus, is the most likely cause of the lack of CO2-photoassimilation in the ELs exposed to the west. This finding is further supported by the visual reduction in the projective cover of the ELs found on the western side of the stem (Figure S3).
We demonstrated the species-specificity of the CO2 release mechanisms in connection to the ELs and the lack of such regarding the ELs’ CH4 fluxes (Figure 3 and Figure 4, Table 3 and Table 4). For example, in illuminated conditions, Hypogimnia photosynthesized in a hydrated state for two weeks, whereas the other species (Evernia, Parmelia) converted under the light to respiration after three days. Consequently, under a phytocoenosis environment, the contribution of different types of ELs may differ, not only in seasonal dynamics, but also in daily dynamics, and the influence of external variables on the components of the C cycle may also be species-specific.
The ELs studied are characterized by relatively low levels of photoassimilation, according to a comparison of CO2 emissions or uptake with the literature data (Table 5). In contrast, the values of CO2 emissions correspond to those found in the taiga zone of the European northeast of Russia [80,82], Canada [83], and Italy [84], while exceeding the CO2 emissions of the ELs in Portugal [85].
Finally, we showed here, for the first time, that ELs are capable of emitting CH4. We found no studies on EL CH4 emissions among the works studying EL GHG fluxes published from 1950 to the present. Using incubation experiments, we showed that ELs in a hydrated state could emit CH4 during prolonged periods (ca. two weeks; Figure 4). This suggests that, with changes in precipitation regimes and a consequent rise in the duration of ELs being in a hydrated condition, they would have quite a large potential contribution to GHG exchange in Siberian forest ecosystems. Unfortunately, there is no clear answer yet which component of the EL is responsible for the release of CH4. Two major components of the EL are the photobiont (autotrophic organisms, such as green algae or Cyanobacteria) and mycobiont (the heterotrophic organism, represented by lichenized fungi) [17]. Both archaea and bacteria can function as minor associates of ELs. All these coexisting species in a single EL organism are known for their ability to emit CH4 [23,33,34,86,87]. Therefore, the next step will be to determine which component is responsible for the emission of CH4. We encourage researchers specializing in the C cycle in natural ecosystems to study GHG fluxes (CO2, CH4, and N2O) to fill the current knowledge gap that currently exists. In addition, the contribution of ELs must be accounted for in the models estimating the response of the C cycle in natural ecosystems to climate change.
Table 5. The EL CO2 and CH4 fluxes according to the literature sources.
EL SpeciesPhorophyteGeographical LocationGHG Fluxes in Author UnitsGHG Fluxes in Our Units, μg C-CO2 or μg C-CH4 per g of EL Dry Weight h−1Source
CO2
Parmelia sulcata Taylor, Hypogymnia physodes (L.) Nyl., Evernia mesomorpha Nyl.Betula pubescens Ehrh.Krasnoyarsk, Russia from +0.1 to +510.8; from −1.0 to −23.4This study
Lobaria pulmonaria Taiga zone of the European northeast of Russiafrom +0.2 to +4.9; from −0.1 to −5.5 mg CO2 g−1 of the dry weight of EL h−1from +54.5 to +1336.4; from −27.3 to −1500 [80,82]
Lobaria pulmonariaAspen forest mixed with spruce and firSyktyvkar, Russia, 61.57 N, 50.55 Efrom −1.7 to −5 µmol CO2 m−2 s−1 [79,88]
Parmelia sulcataCastanea sativa MillerAbbadia San Salvatore, Tuscany, Italy, 42.90 N, 11.65 Efrom +0.36 to +1.91; from −4.5 to −8.7 mg CO2 g−1 h−1 *from +98.2 to +520.9; from −1227.3 to −2372.7[84]
Peltigera canina, Stereocaulon paschaleSpruce–lichen forestSouthern Ontario, Canada, 44 N, 80 Efrom +1.25 to +2.75 mg CO2 g dry wt−1 h−1from +341 to +477[83]
Lobaria pulmonaria, Evernia prunastri, Lobaria scrobiculata, Peltigera caninaDeciduous sub-med. forest; temperate forestPortugal (Continental and Madeira Island)from +0.25 to +0.36; from −4.50 to −4.80 nmol CO2 g dry wt−1 s−1from +39.6 to +57.02; from −712.8 to −760.3[85]
Ramalina maciforrnis Negev desert, Israelfrom −0.2 to +10 mg CO2 g−1 h−1 **from −54.5 to +2727.3[89]
Ramalina menziesii Central California, USA−15 mg CO2 g−1 dry wt d−1 *−170.5[90]
Sticta filix, Pseudocyphellaria faveolataNothofagus menziesii, Ixerba brexioides, Dacrydium cupressinumAniwaniwa river valley, New Zealand, 38.75 S, 177.15 Efrom −12.41 to −14.97 nmol CO2 g−1 s−1from −536.1 to −646.7 [91]
Erioderma pedicellatumPicea abiesRendalen, Norway, 61.87 N, 10.85 Efrom +1.14 to +1.49; from −2.5 to −6.1 µmol CO2 m−2 s−1 [92]
Evernia mesomorpha, Bryoria nadvornikianaPicea marianaNorthern Clay Belt, Canada, 50 N, 77–78 Wfrom −0.628 to −0.704 **,***; from +0.359 to +0.456 *** [50]
Lobaria crenulata, Pseudocyphellaria aurata, P. intricaia, Sticta sublimbata, S. weigeliiPremontane tropical rainforestRepublic of Panama, 8.75 N, 82.25 WFrom −2.90 to −12.96 **; from 2.72 to 7.66 mg C (g C)−1 d−1 [93]
CH4
Parmelia sulcata Taylor, Hypogymnia physodes (L.) Nyl., Evernia mesomorpha Nyl.Betula pubescens Ehrh.Krasnoyarsk, Russia from +0.00006 to +0.0061; from −0.00004 to −0.003This study
positive values (with a plus) reflect the amount of carbon released during respiration (or CH4 emissions); negative values (with a minus) reflect the carbon uptake during CO2-photoassimilation (or CH4 consumption); * gross photoassimilation; ** net photoassimilation; *** no units provided.

5. Conclusions

Our study showed the potential for CH4 emissions by ELs if they are in the hydrated condition, which occurs after precipitation events throughout the year. The exposure of the EL on the host-tree stem is essential, since the GHG fluxes can be significantly different (up to two-fold), e.g., by north- and west-exposed ELs. CO2 fluxes are EL species-specific at the same EL humidity. This shows the significance and the need to consider ELs when evaluating their contribution to the C cycle in forest ecosystems, and how they respond to recent and future climate change. However, when including the EL GHG flux data to the models, the GHG fluxes by the dominant ELs, the EL exposure on the phorophyte stem, and the day/night GHG fluxes should be accounted for in a more concise evaluation of ELs in the C cycle of forest ecosystems and their response to ongoing and projected climate change. The pattern of the release or uptake of GHGs by ELs may also alter due to climate change, e.g., changes in the precipitation regime (such as more frequent extreme rainfalls and droughts). CH4 will escape faster into the atmosphere during wetter periods.

Supplementary Materials

The following supporting information can be downloaded at: https://www.mdpi.com/article/10.3390/f15010107/s1, Figure S1: Examples of the studied ELs—Parmelia sulcata, Hypogymnia physodes, and Evernia mesomorpha; Figure S2: The EL sample prepared for incubation (A) and the setup of the first (B) and the second (C) incubation experiments; Figure S3: Shannon index (A) and projecting cover (B) of ELs depending on the EL exposure on the phorophyte at various study plots (A, B, and C); Figure S4: The pH and TDS in birch bark depending on the exposure in the phorophyte stems at various study plots (A, B, and C).

Author Contributions

Conceptualization, O.V.M. (Oxana V. Masyagina), A.I.M. and S.Y.E.; methodology, O.V.M. (Oxana V. Masyagina), A.I.M., N.M.K. and S.Y.E.; formal analysis, O.V.M. (Oxana V. Masyagina), A.I.M. and N.M.K.; investigation, O.V.M. (Oxana V. Masyagina), A.I.M., N.M.K., E.V.S., M.V.S. and S.Y.E.; resources, O.V.M. (Oxana V. Masyagina), A.I.M., O.V.M. (Oleg V. Menyailo) and S.Y.E.; data curation, O.V.M. (Oxana V. Masyagina) and A.I.M.; writing—original draft preparation, O.V.M. (Oxana V. Masyagina) and A.I.M.; writing—review and editing, O.V.M. (Oxana V. Masyagina), A.I.M., N.M.K., S.Y.E. and O.V.M. (Oleg V. Menyailo); visualization, O.V.M. (Oxana V. Masyagina) and A.I.M.; supervision, O.V.M. (Oxana V. Masyagina); project administration, O.V.M. (Oxana V. Masyagina); funding acquisition, O.V.M. (Oxana V. Masyagina). All authors have read and agreed to the published version of the manuscript.

Funding

This research was funded by the Russian Science Foundation, grant number 23-24-00167.

Data Availability Statement

Data are contained within the article or Supplementary Materials.

Acknowledgments

This work was performed using the equipment of the Center of Research Equipment of the Siberian Branch of the Russian Academy of Sciences.

Conflicts of Interest

The authors declare no conflicts of interest.

References

  1. Ahmajian, V. Lichens are more important than you think. Bioscience 1995, 45, 124. Available online: https://scholar.google.com/scholar?cluster=17933703524925869523&hl=ru&as_sdt=0,5 (accessed on 7 October 2023).
  2. Delgado-Baquerizo, M.; Maestre, F.T.; Reich, P.B.; Jeffries, T.C.; Gaitan, J.J.; Encinar, D.; Berdugo, M.; Campbell, C.D.; Singh, B.K. Microbial diversity drives multifunctionality in terrestrial ecosystems. Nat. Commun. 2016, 7, 10541. [Google Scholar] [CrossRef] [PubMed]
  3. Humphrey, J.W.; Davey, S.; Peace, A.J.; Ferris, R.; Harding, K. Lichens and bryophyte communities of planted and semi-natural forests in Britain: The influence of site type, stand structure and deadwood. Biol. Conserv. 2002, 107, 165–180. [Google Scholar] [CrossRef]
  4. Sedia, E.G.; Ehrenfeld, J.G. Lichens and mosses promote alternate stable plant communities in the New Jersey pinelands. Oikos 2003, 100, 447–458. [Google Scholar] [CrossRef]
  5. Friedel, A.; Oheimb, G.; von Dengler, J.; Härdtle, W. Species diversity and species composition of epiphytic bryophytes and lichens—A comparison of managed and unmanaged beech forests in NE Germany. Feddes Repert. 2006, 177, 172–185. [Google Scholar] [CrossRef]
  6. Cleavitta, N.L.; Dibbleb, A.C.; Werierc, D.A. Influence of tree composition upon epiphytic macrolichens and bryophytes in old forests of Acadia National Park, Maine. Bryologist 2009, 112, 467–487. [Google Scholar] [CrossRef]
  7. Hilmo, O.; Holien, H.; Hytteborn, H.; Ely-Aalstrup, H.R. Of epiphytic lichens in differently aged Picea abies plantations situated in the oceanic region of Central Norway. Lichenologist. 2009, 41, 97–108. [Google Scholar] [CrossRef]
  8. Jüriado, I.; Liira, J.; Paal, J. Diversity of epiphytic lichens in boreo-nemoral forests on the North-Estonian limestone escarpment: The effect of tree level factors and local environmental conditions. Lichenologist 2009, 41, 81–96. [Google Scholar] [CrossRef]
  9. Ellis, C.J. Lichen epiphyte diversity: A species, community and trait-based review. Perspect. Plant Ecol. Evol. Syst. 2012, 14, 131–152. [Google Scholar] [CrossRef]
  10. Ellis, C.J.; Asplund, J.; Benes Peri, R.; Branquinho, C.; Di Nuzzo, L.; Hurtado, P.; Martínez, I.; Matos, P.; Nascimbene, J.; Pinho, P.; et al. Functional traits in lichen ecology: A review of challenge and opportunity. Microorganisms 2021, 9, 766. [Google Scholar] [CrossRef]
  11. Dubay, S.A.; Hayward, G.D.; Martinez del Rio, C. Nutritional value and diet preference of arboreal lichens and hypogeous fungi for small mammals in the Rocky Mountains. Can. J. Zool. 2008, 86, 851–862. [Google Scholar] [CrossRef]
  12. Martinez, J.J.I.; Raz, R.; Mgocheki, N.; Álvarez, R. Epiphytic lichen is associated with species richness of gall-inducing aphids but not with niche differentiation among them. Arthropod-Plant Interact. 2014, 8, 17–24. [Google Scholar] [CrossRef]
  13. Lakatos, M. Lichens and bryophytes: Habitats and species. In Plant Desiccation Tolerance. Ecological Studies (Analysis and Synthesis); Lüttge, U., Beck, E., Bartels, D., Eds.; Springer: Berlin/Heidelberg, Germany, 2011; Volume 215. [Google Scholar] [CrossRef]
  14. Conti, M.E.; Cecchetti, G. Biological monitoring: Lichens as bioindicators of air pollution assessment—A review. Environ. Pollut. 2001, 114, 471–492. [Google Scholar] [CrossRef] [PubMed]
  15. Insarov, G. A method for detecting large-scale environmental change with lichens. In Monitoring with Lichens—Monitoring Lichens; Springer: Dordrecht, The Netherlands, 2002; pp. 399–403. [Google Scholar] [CrossRef]
  16. Elkhateeb, W.A.; Daba, G.M. Lichens—Masters of extraordinary symbiosis with potent pharmaceuticals. Egypt Pharmaceut. J. 2020, 19, 197–201. [Google Scholar] [CrossRef]
  17. Shah, A.A.; Badshah, L.; Muhammad, M.; Basit, A.; Ullah, I.; Mohamed, H.I.; Khan, A. Secondary metabolites of lichens and their application. In Fungal Secondary Metabolites; Elsevier: Amsterdam, The Netherlands, 2024; pp. 91–115. [Google Scholar] [CrossRef]
  18. Kovaleva, N.M. Epiphytic lichen phytomass distribution on the Scotch pine (Pinus sylvestris L.) stems and branches. Vestnik KrasGAU. 2012, 3, 90–95. (In Russian) [Google Scholar]
  19. Elbert, W.; Weber, B.; Burrows, S.; Steinkamp, J.; Büdel, B.; Andreae, M.O.; Pöschl, U. Contribution of cryptogamic covers to the global cycles of carbon and nitrogen. Nat. Geosci. 2012, 5, 459–462. [Google Scholar] [CrossRef]
  20. Keppler, F.; Boros, M.; Frankenberg, C.; Lelieveld, J.; McLeod, A.; Pirttilä, A.M.; Röckmann, T.; Schnitzler, J. Methane formation in aerobic environments. Environ. Chem. 2009, 6, 459–465. [Google Scholar] [CrossRef]
  21. Kip, N.; Winden, J.; Pan, Y.; Bodrossy, L.; Reichart, G.J.; Smolders, A.J.P.; Jetten, S.M.M.; Sinninghe Damsté, J.S.; Op den Camp, H.J.M. Global prevalence of methane oxidation by symbiotic bacteria in peat-moss ecosystems. Nat. Geosci. 2010, 3, 617–621. [Google Scholar] [CrossRef]
  22. Johansson, O.; Palmqvist, K.; Olofsson, J. Nitrogen deposition drives lichen community changes through differential species responses. Glob. Chang. Biol. 2012, 18, 2626–2635. [Google Scholar] [CrossRef]
  23. Lenhart, K.; Bunge, M.; Ratering, S.; Neu, T.R.; Schuttmann, I.; Greule, M.; Kammann, C.; Schnell, S.; Müller, C.; Zorn, H.; et al. Evidence for methane production by saprotrophic fungi. Nat. Commun. 2012, 3, 1046. [Google Scholar] [CrossRef]
  24. Lenhart, K.; Weber, B.; Elbert, W.; Steinkamp, J.; Clough, T.; Crutzen, P.; Pöschl, U.; Keppler, F. Nitrous oxide and methane emissions from cryptogamic covers. Glob. Chang. Biol. 2015, 21, 3889–3900. [Google Scholar] [CrossRef] [PubMed]
  25. Lenhart, K.; Klintzsch, T.; Langer, G.; Nehrke, G.; Bunge, M.; Schnell, S.; Keppler, F. Evidence for methane production by marine algae (Emiliana huxleyi) and its implication for the methane paradox in oxic waters. Biogeosciences 2016, 13, 3163–3174. [Google Scholar] [CrossRef]
  26. Masyagina, O.V.; Menyailo, O.V. The impact of permafrost on carbon dioxide and methane fluxes in Siberia: A meta-analysis. Environ. Res. 2020, 182, 109096. [Google Scholar] [CrossRef] [PubMed]
  27. Beckett, R.P.; Kranner, I.; Minibayeva, F.V. Stress physiology and the symbiosis. In Lichen Biology, 2nd ed.; Nash, T.H., Ed.; Cambridge University Press: Cambridge, UK, 2008; pp. 134–151. [Google Scholar] [CrossRef]
  28. Beckett, R.P.; Minibayeva, F.; Solhaug, K.A.; Roach, T. Photoprotection in lichens: Adaptations of photobionts to highlight. Lichenologist 2021, 53, 21–33. [Google Scholar] [CrossRef]
  29. Zelikova, T.J.; Housman, D.C.; Grote, E.E.; Neher, D.A.; Belnap, J. Warming and increased precipitation frequency on the Colorado Plateau: Implications for biological soil crusts and soil processes. Plant Soil 2012, 355, 265–282. [Google Scholar] [CrossRef]
  30. Goga, M.; Elečko, J.; Marcinčinová, M.; Ručová, D.; Bačkorová, M.; Bačkor, M. Lichen metabolites: An overview of some secondary metabolites and their biological potential. In Co-Evolution of Secondary Metabolites; Merillon, J.-M., Ramawal, K.G., Eds.; Springer: Berlin/Heidelberg, Germany, 2020; pp. 175–209. [Google Scholar] [CrossRef]
  31. Lücking, R.; Leavitt, S.D.; Hawksworth, D.L. Species in lichen-forming fungi: Balancing between conceptual and practical considerations, and between phenotype and phylogenomics. Fungal Divers 2021, 109, 99–154. [Google Scholar] [CrossRef]
  32. Studzińska-Sroka, E.; Zarabska-Bożjewicz, D. Hypogymnia physodes–A lichen with interesting medicinal potential and ecological properties. J. Herb. Med. 2019, 17, 100287. [Google Scholar] [CrossRef]
  33. Bižić, M.; Klintzsch, T.; Ionescu, D.; Hindiyeh, M.Y.; Günthel, M.; Muro-Pastor, A.M.; Eckert, W.; Urich, T.; Keppler, F.; Grossart, H.-P. Aquatic and terrestrial cyanobacteria produce methane. Sci. Adv. 2020, 6, eaax5343. [Google Scholar] [CrossRef]
  34. Samylina, O.S.; Rusanov, I.I.; Tarnovetskii, I.Y.; Yakushev, E.V.; Grinko, A.A.; Zakharova, E.E.; Merkel, A.Y.; Kanapatskiy, T.A.; Semiletov, I.P.; Pimenov, N.V. On the possibility of aerobic methane production by pelagic microbial communities of the Laptev Sea. Microbiology 2021, 90, 145–157. [Google Scholar] [CrossRef]
  35. Shver, T.A.; Gerasimova, A.S. Climate of Krasnoyarsk; Gidrometeoizdat: Krasnoyarsk, Russia, 1982; p. 230. (In Russian) [Google Scholar]
  36. Bezrukih, V.A.; Elin, O.Y.; Dudnik, N.I. The natural and social background of the Yenisei Siberia agricultural areas economic growth. Vestn. Tomsk. Gos. Univ. 2009, 14, 407–411. (In Russian) [Google Scholar]
  37. Torzhkov, I.O.; Kushnir, E.A.; Konstantinov, A.V.; Koroleva, T.S.; Efimov, S.V.; Shkolnik, I.M. Assessment of future climate change impacts on forestry in Russia. Russ. Meteorol. Hydrol. 2019, 44, 180–186. [Google Scholar] [CrossRef]
  38. Kryuchkova, O.E. Epiphytic lichen flora of the city in connection with the acidity of tree bark and air pollution (using the example of Krasnoyarsk). In Abstract of the Dissertation for the Scientific Degree of Candidate of Biological Sciences; GOUVPO “Krasnoyarsk State University”: Krasnoyarsk, Russia, 2006. (In Russian) [Google Scholar]
  39. Hauck, M.; Helms, G.; Friedl, T. Photobiont selectivity in the epiphytic lichens Hypogymnia physodes and Lecanora conizaeoides. Lichenologist 2007, 39, 195–204. [Google Scholar] [CrossRef]
  40. Piercey-Normore, M.D. Vegetatively reproducing fungi in three genera of the Parmeliaceae share divergent algal partners. Bryologist 2009, 112, 773–785. Available online: https://www.jstor.org/stable/25614897 (accessed on 25 September 2023). [CrossRef]
  41. Rocha, B.; Matos, P.; Giordani, P.; Piret, L.; Branquinho, C.; Casanelles-Abella, J.; Aleixo, C.; Deguines, N.; Hallikma, T.; Laanisto, L.; et al. Modelling the response of urban lichens to broad-scale changes in air pollution and climate. Environ. Pollut. 2022, 315, 120330. [Google Scholar] [CrossRef] [PubMed]
  42. Lebedeva, N.V.; Krivolutsky, D.A.; Puzachenko, Y.G.; Dyakonov, K.N.; Aleshchenko, G.M.; Smurov, A.V.; Maksimov, V.N.; Tikunov, V.S.; Ogureeva, G.N.; Kotova, T.V. Geography and Monitoring of Biodiversity; Publishing House of the Scientific and Educational Methodological Center: Moscow, Russia, 2002; 432p. (In Russian) [Google Scholar]
  43. Trass, H. Lichen sensitivity to the air pollution and index of poleotolerance (IP). Folia Cryptog. Estonica. 1973, 3, 19–22. Available online: https://ojs.utlib.ee/index.php/FCE/issue/view/959/48 (accessed on 19 December 2023).
  44. Fadel, D.; Sid, A.S.; Zga, N.; Latrèche, F.; Ali, A.O. Cartography of Air Pollution in an Industrial City in North-Eastern Algeria by Using Two Indexes: Poleotolerance Index and Atmospheric Purity Index. J. Life Sci. 2014, 8, 95–100. [Google Scholar]
  45. Rocha, B.; Pinho, P.; Vieira, J.; Branquinho, C.; Matos, P. Testing the poleotolerance lichen response trait as an indicator of anthropic disturbance in an urban environment. Diversity 2019, 11, 55. [Google Scholar] [CrossRef]
  46. Fazan, L.; Gwiazdowicz, D.J.; Fragnière, Y.; Fałtynowicz, W.; Ghosn, D.; Remoundou, I.; Rusińska, A.; Urbański, P.; Pasta, S.; Garfì, G.; et al. Factors influencing the diversity and distribution of epiphytic lichens and bryophytes on the relict tree Zelkova abelicea (Lam.) Boiss. (Ulmaceae). Lichenologist 2022, 54, 195–212. [Google Scholar] [CrossRef]
  47. Letardi, P.; Ramirez Barat, B.; Cano, E. Analysis of the influence of the electrochemical cell setup for corrosion measurements on metallic cultural heritage. In Proceedings of the European Corrosion Congress-EUROCORR, Prague, Czech Republic, 3–7 September 2017; Available online: https://www.researchgate.net/profile/Paola-Letardi/publication/319979704_Analysis_of_the_influence_of_the_electrochemical_cell_setup_for_corrosion_measurements_on_metallic_cultural_heritage/links/59c4c3a1a6fdccc719137b89/Analysis-of-the-influence-of-the-electrochemical-cell-setup-for-corrosion-measurements-on-metallic-cultural-heritage.pdf (accessed on 19 December 2023).
  48. Palmqvist, K. Carbon economy in lichens. New Phytol. 2000, 148, 11–36. [Google Scholar] [CrossRef]
  49. Lange, O.L.; Green, T.A.; Heber, U. Hydration-dependent photosynthetic production of lichens: What do laboratory studies tell us about field performance? J. Exp. Bot. 2001, 52, 2033–2042. [Google Scholar] [CrossRef]
  50. Boudreault, C.; Coxson, D.; Bergeron, Y.; Stevenson, S.; Bouchard, M. Do forests treated by partial cutting provide growth conditions similar to old-growth forests for epiphytic lichens? Biol. Conserv. 2013, 159, 458–467. [Google Scholar] [CrossRef]
  51. Wiessner, W. Photoassimilation of Organic Compounds. In Photosynthesis II. En-Cyclopedia of Plant Physiology; Gibbs, M., Latzko, E., Eds.; Springer: Berlin/Heidelberg, Germany, 1979; Volume 6. [Google Scholar] [CrossRef]
  52. Duan, Z.; Homma, A.; Kobayashi, M.; Nagata, N.; Kaneko, Y.; Fujiki, Y.; Nishida, I. Photoassimilation, assimilate translocation and plasmodesmal biogenesis in the source leaves of Arabidopsis thaliana grown under an increased atmospheric CO2 concentration. Plant Cell Physiol. 2014, 55, 358–369. [Google Scholar] [CrossRef] [PubMed]
  53. Chen, L.P. Practical Statistics for Data Scientists: 50+ Essential Concepts Using R and Python; Bruce, P., Bruce, A., Gedeck, P., Eds.; O’Reilly Media Inc.: Boston, MA, USA, 2021; pp. xiii+368. ISBN 9781492072942. [Google Scholar] [CrossRef]
  54. Dubrovsky, G.I. Materials on the lichen flora of the state reserve “Stolby” of the Krasnoyarsk Territory. Botanical materials of the department of spore plants. Mosc. Leningrad. 1953, 9, 31–39. (In Russian) [Google Scholar]
  55. Perova, S.V. Lichens in the vicinity of Krasnoyarsk. In Collection of Scientific Student Works; Krasnoyarsk Pedagogical Institute: Krasnoyarsk, Russia, 1961; Volume 1, pp. 45–52. (In Russian) [Google Scholar]
  56. Otnyukova, T.N. The find of Ramalina sinensis (Ramalinaceae, Lichenes) in Altai province. Bot. Zhurnal. 1998, 83, 132–136. (In Russian) [Google Scholar]
  57. Otnyukova, T.N. Some interesting and rare species of mosses and lichens of the Yenisei Siberia. Conservation of biological diversity of the Yenisei Siberia. In Proceedings of the First Interregional Scientific and Practical Conference on the Conservation of Biodiversity of the Yenisei Siberia. Part 2, Krasnoyarsk, Russia, 28–30 November 2000; pp. 43–44. (In Russian). [Google Scholar]
  58. Otnyukova, T. Epiphytic lichen growth abnormalities and element concentrations as early indicators of forest decline. Environ. Pollut. 2007, 146, 359–365. [Google Scholar] [CrossRef] [PubMed]
  59. Ellis, C.J.; Coppins, B.J. Reproductive strategy and the compositional dynamics of crustose lichen communities on aspen (Populus tremula L.) in Scotland. Lichenologist 2007, 39, 377–391. [Google Scholar] [CrossRef]
  60. Mežaka, A.; Brumelis, G.; Piterans, A. Tree and stand-scale factors affecting richness and composition of epiphytic bryophytes and lichens in deciduous woodland key habitats. Biodiv. Conserv. 2012, 21, 3221–3241. [Google Scholar] [CrossRef]
  61. Shriver, R.K.; Cutler, K.; Doak, D.F. Comparative demography of an epiphytic lichen: Support for general life history patterns and solutions to common problems in demographic parameter estimation. Oecologia 2012, 170, 137–146. [Google Scholar] [CrossRef]
  62. Kuusinen, M. Epiphytic lichen flora and diversity on Populus tremula in old-growth and managed forests of southern and middle boreal Finland. Ann. Bot. Fenn. 1994, 31, 245–260. Available online: https://www.jstor.org/stable/43922219 (accessed on 19 December 2023).
  63. Kuusinen, M.; Siitonen, J. Epiphytic lichen diversity in old-growth and managed Picea abies stands in southern Finland. J. Veg. Sci. 1998, 9, 283–292. [Google Scholar] [CrossRef]
  64. Cameron, R.P. Habitat associations of epiphytic lichens in managed and unmanaged forest stands in Nova Scotia. Northeast Natur. 2002, 9, 27–46. [Google Scholar] [CrossRef]
  65. Ranius, T.; Johansson, P.; Berg, N.; Niklasson, M. The influence of tree age and microhabitat quality on the occurrence of rhytidomeose lichens associated with old oaks. J. Veg. Sci. 2008, 19, 653–662. [Google Scholar] [CrossRef]
  66. Lie, M.H.; Arup, U.; Grytnes, J.-A.; Ohlson, M. The importance of host tree age, size and growth rate as determinants of epiphytic lichen diversity in boreal spruce forests. Biodiv. Conserv. 2009, 18, 3579–3596. [Google Scholar] [CrossRef]
  67. Calviño-Cancela, M.; López de Silanes, M.E.; Rubido-Bará, M.; Uribarri, J. The potential role of tree plantations in providing habitat for lichen epiphytes. For. Ecol. Manag. 2013, 291, 386–395. [Google Scholar] [CrossRef]
  68. Flores-Palacios, A.; García-Franco, J. The relationship between tree size and epiphyte species richness: Testing four different hypotheses. J. Biogeogr. 2006, 33, 323–333. [Google Scholar] [CrossRef]
  69. Mežaka, A.; Brūmelis, G.; Piterāns, A. The distribution of epiphytic bryophyte and lichen species in relation to phorophyte characters in Latvian natural old-growth broad-leaved forests. Folia Cryptog. Estonica 2008, 44, 89–99. [Google Scholar]
  70. Fritz, Ö. Vertical distribution of epiphytic bryophytes and lichens emphasizes the importance of old beeches in conservation. Biodiv. Conserv. 2009, 18, 289–304. [Google Scholar] [CrossRef]
  71. Istomina, N.B.; Likhacheva, O.V. Lichen biota of manor parks with federal protection status in the Pskov region. Bull. Russ. State Univ. Named I Kant 2010, 7, 122–129. (In Russian) [Google Scholar]
  72. Király, I.; Nascimbene, J.; Tinya, F.; Ódor, P. Factors influencing epiphytic bryophyte and lichen species richness at different spatial scales in managed temperate forests. Biodivers Conserv. 2013, 22, 209–223. [Google Scholar] [CrossRef]
  73. Kim, K.H.; Lee, S.B.; Woo, D.; Bae, G.N. Influence of wind direction and speed on the transport of particle-bound PAHs in a roadway environment. Atm. Pollut. Res. 2015, 6, 1024–1034. [Google Scholar] [CrossRef]
  74. Cortes, D.R.; Basu, I.; Sweet, C.W.; Hites, R.A. Temporal trends in and influence of wind on PAH concentrations measured near the Great Lakes. Environ. Sci. Technol. 2000, 34, 356–360. [Google Scholar] [CrossRef]
  75. Huang, Y.D.; Hou, R.W.; Liu, Z.Y.; Song, Y.; Cui, P.Y.; Kim, C.N. Effects of wind direction on the airflow and pollutant dispersion inside a long street canyon. Aerosol Air Qual. Res. 2019, 19, 1152–1171. [Google Scholar] [CrossRef]
  76. Tsurykau, A.H.; Khramchankova, V.M. Influence of the bark acidity on frequency of lichens (on an example of Gomel Town). Nov. Sist. Nizs. Rast. 2009, 43, 261–275. Available online: https://www.researchgate.net/publication/346499881_Influence_of_the_bark_acidity_on_frequency_of_lichens_on_an_example_of_Gomel_Town (accessed on 19 December 2023). [CrossRef]
  77. Lattanzio, V. Phenolic compounds: Introduction. In Natural Products; Ramawat, K., Merillon, J.M., Eds.; Springer: Berlin/Heidelberg, Germany, 2013. [Google Scholar] [CrossRef]
  78. Rankovic, B.; Kosanic, M. Lichens as a potential source of bioactive secondary metabolites. In Lichen Secondary Metabolites; Rankovic, B., Ed.; Springer: Cham, Switzerland, 2019. [Google Scholar] [CrossRef]
  79. Shelyakin, M.A.; Zakhozhiy, I.G.; Golovko, T.K. Changes of total respiration and respiratory pathways ratio in lichens adaptation to UV-b radiation. Proc. RAS Ufa Sci. Cent. 2018, 3, 100–104. (In Russian) [Google Scholar] [CrossRef]
  80. Golovko, T.K.; Shelyakin, M.A.; Pystina, T.N. Ecological and biological, and functional traits of lichens in Taiga zone of European Northeast of Russia. Theor. Appl. Ecol. 2020, 1, 6. Available online: http://envjournal.ru/archives/2020_1.pdf (accessed on 19 December 2023). [CrossRef]
  81. Khabibrakhmanova, V.R.; Rassabina, A.Y.; Khayrullina, A.F.; Minibayeva, F.V. Physico-chemical characteristics and antioxidant properties of melanins extracted from Leptogonium furfuraceum (Harm.). Khimiya Rastit. Syr’ya 2022, 4, 117–127. (In Russian) [Google Scholar] [CrossRef]
  82. Golovko, T.K.; Dalke, I.V.; Dymova, O.V.; Zakhozhiy, I.G.; Malyshev, R.V.; Silina, E.V.; Tabalenkova, G.N.; Shelyakin, M.A. First results of the ecological and physiological study of lichen biota of the boreal zone of the European north-east of Russia. In Current State and Prospects for the Development of a Network of Specially Protected Natural Territories of the European North and the Urals; IB Komi Scientific Center Ural Branch RAS: Syktyvkar, Russia, 2015; pp. 279–286. (In Russian) [Google Scholar]
  83. Crittenden, P.D.; Kershaw, K.A. A procedure for the simultaneous measurement of net CO2-exchange and nitrogenase activity in lichens. New Phytol. 1978, 80, 393–401. [Google Scholar] [CrossRef]
  84. Tretiach, M.; Bertuzzi, S.; Candotto Carniel, F.; Virgilio, D. Seasonal acclimation in the epiphytic lichen Parmelia sulcata is influenced by change in photobiont population density. Oecologia 2013, 173, 649–663. [Google Scholar] [CrossRef]
  85. Máguas, C.; Griffiths, H.; Broadmeadow, M.S.J. Gas exchange and carbon isotope discrimination in lichens: Evidence for interactions between CO2-concentrating mechanisms and diffusion limitation. Planta 1995, 196, 95–102. [Google Scholar] [CrossRef]
  86. Segers, R. Methane production and methane consumption: A review of processes underlying wetland methane fluxes. Biogeochemistry 1998, 41, 23–51. [Google Scholar] [CrossRef]
  87. Liu, D.Y.; Ding, W.X.; Jia, Z.J.; Cai, Z.C. Relation between methanogenic archaea and methane production potential in selected natural wetland ecosystems across China. Biogeosciences 2011, 8, 329–338. [Google Scholar] [CrossRef]
  88. Shelyakin, M.A.; Zakhozhiy, I.G.; Dalke, I.V.; Dymova, O.V.; Malyshev, R.V.; Golovko, T.K. Photosynthetic and respiratory capacity of foliose lichen Lobaria pulmonaria throughout the annual cycle. Russ. J. Plant Physiol. 2021, 68, 1048–1058. [Google Scholar] [CrossRef]
  89. Lange, O.L.; Tenhunen, J.D. Moisture content and CO2 exchange of lichens. II. Depression of net photosynthesis in Ramalina maciformis at high water content is caused by increased thallus carbon dioxide diffusion resistance. Oecologia 1981, 51, 426–429. [Google Scholar] [CrossRef] [PubMed]
  90. Matthes-Sears, U.; Nash III, T.H.; Larson, D.W. The ecology of Ramalina menziesii. III. In situ diurnal field measurements at two sites on a coast–inland gradient. Can. J. Bot. 1986, 64, 988–996. [Google Scholar] [CrossRef]
  91. Green, T.A.; Meyer, A.; Buedel, B.; Zellner, H.; Lange, O.L. Diel patterns of CO2-exchange for six lichens from a temperate rain forest in New Zealand. Symbiosis 1995, 18, 251–273. Available online: https://dalspace.library.dal.ca/bitstream/handle/10222/77482/VOLUME%2018-NUMBER%203-1995-PAGE%20251.pdf?sequence=1 (accessed on 19 December 2023).
  92. Nilsson, A.R.; Solhaug, K.A.; Gauslaa, Y. The globally threatened epiphytic cyanolichen Erioderma pedicellatum depends on a rare combination of habitat factors. Lichenologist 2022, 54, 123–136. [Google Scholar] [CrossRef]
  93. Lange, O.L.; Büdel, B.; Meyer, A.; Zellner, H.; Zotz, G. Lichen carbon gain under tropical conditions: Water relations and CO2 exchange of Lobariaceae species of a lower montane rainforest in Panama. Lichenologist 2004, 36, 329–342. [Google Scholar] [CrossRef]
Figure 1. Map of the sampling plot (A, B, and C) locations near Krasnoyarsk (55.9 N, 92.7 E; https://maps.google.com/, accessed on 11 October 2023). The numbers indicate the number of the trees (from the first to the twelfth tree).
Forests 15 00107 g001
Figure 2. Shannon index (A), species richness (B), and poleotolerance index (C) of the ELs in study plots. Letters represent a significant difference among the plots (A, B, and C) at p < 0.05 according to the Kruskal–Wallis comparisons of the means analysis and the pairwise comparisons using the Wilcoxon rank sum test.
Forests 15 00107 g002
Figure 3. Diel CO2 fluxes (the average of three biological replicates during three diel series of measurements ± SE) by the ELs of two species (Evernia mesomorpha Nyl. and Parmelia sulcata Taylor) of various exposures on the tree stems incubated at a controlled photoperiod and thermal regime. The negative values reflect CO2-photoassimilation; the positive values reflect dark respiration. The gray-shaded rectangular area shows the night period without illumination. Shaded areas represent the 95% confidence interval associated with each polynomial curve.
Forests 15 00107 g003
Figure 4. Daytime CO2 (A) and CH4 (B) fluxes (mean ± SE) by the EL species (Evernia mesomorpha Nyl., Parmelia sulcata Taylor, and Hypogimnia physodes (L.) Nyl.) of various exposures on the tree stems incubated at a controlled photoperiod and thermal regime. The negative values reflect photoassimilation and the positive values reflect respiration. EvCN is Evernia of a northern exposure from the C plot; HypCN is Hypogimnia of a northern exposure from the C plot; ParAN is Parmelia of a northern exposure from the A plot; ParBW is Parmelia of a western exposure from the B plot; ParCN is Parmelia of a northern exposure from the C plot. Shaded areas represent the 95% confidence interval associated with each polynomial curve.
Forests 15 00107 g004
Table 1. Description of the model trees.
PlotTreeTree Height, mDBH, cmCanopy Cover, %Age, Years
AA125.367.754111
A228.047.858106
A325.542.97594
A428.542.568100
BB525.937.364118
B626.047.770117
B732.947.186115
B827.958.672101
CC929.335.46595
C1033.838.270102
C1132.036.84998
C1224.241.960115
Table 2. Characteristics of the ELs at a height of 1–1.5 m, where the thalli were collected.
PlotProjecting Cover (Mean ± SE), %Occurrence, %Total EL Projecting Cover
(as an Average Value of 20 Slots ± SE)
at a Height of 1–1.5 m, %
PHEvPHEv
A113.5 ± 3.82.5 ± 1.20.5 ± 0.350251033.5 ± 4.1
A25.2 ± 1.63.0 ± 1.63.0 ± 1.145204028.9 ± 3.8
A36.5 ± 1.30.5 ± 0.51.0 ± 0.56552048.3 ± 3.5
A411.8 ± 3.01.5 ± 0.68.5 ± 2.360257540.1 ± 5.5
B56.2 ± 1.81.5 ± 0.61.3 ± 1.050251038.5 ± 5.7
B65.5 ± 1.50 ± 01.4 ± 0.54503036.2 ± 5.5
B72.9 ± 1.24.0 ± 1.71.0 ± 0.430252524.1 ± 5.3
B88.2 ± 1.91.5 ± 1.10.3 ± 0.36510529.4 ± 4.7
C95.8 ± 1.82.7 ± 0.83.9 ± 1.045455522.4 ± 5.2
C101.9 ± 0.43.0 ± 0.61.4 ± 0.465806027.8 ± 6.1
C116.5 ± 1.71.4 ± 0.52.7 ± 0.690558515.8 ± 2.3
C127.3 ± 1.93.3 ± 0.62.7 ± 0.960704526.6 ± 3.2
Note: P—Parmelia sulcata; H—Hypogymnia physodes; Ev—Evernia mesomorpha.
Table 3. The results of a factorial ANOVA analysis of the effects of EL species, photoperiod conditions, and the exposure of the EL on a tree stem on the CO2 fluxes by the ELs in the first experiment.
Factors and Their InteractionsCO2 Fluxes
Fp
EL species10.1<0.001
Photoperiod20.3<0.0001
Exposure on the tree stem100.9<0.0001
EL species × Photoperiod13.4<0.0001
EL species × Exposure on the tree stem20.0<0.0001
Photoperiod × Exposure on the tree stem10.5<0.001
EL species × Photoperiod × Exposure on the tree stem3.10.76
Table 4. The results of a repeated-measures analysis of variance (rANOVA) of the effect of EL species and the time of incubation on the mean rate of CO2 and CH4 fluxes by the ELs in the second incubation experiment.
Factors and Their InteractionsCH4CO2
FpFp
EL species0.6980.61013.77<0.0001
Time5.158<0.0121.06<0.0001
EL species × Time0.9030.5852.25<0.0001
Disclaimer/Publisher’s Note: The statements, opinions and data contained in all publications are solely those of the individual author(s) and contributor(s) and not of MDPI and/or the editor(s). MDPI and/or the editor(s) disclaim responsibility for any injury to people or property resulting from any ideas, methods, instructions or products referred to in the content.

