Article

Seasonal Variation in the Thermal Environment and Health-Related Factors in Two Clustered Recreational Bamboo Forests

College of Landscape Architecture, Sichuan Agricultural University, Chengdu 611130, China
*
Author to whom correspondence should be addressed.
These authors contributed equally to this work.
Forests 2023, 14(9), 1894; https://doi.org/10.3390/f14091894
Submission received: 22 August 2023 / Revised: 8 September 2023 / Accepted: 14 September 2023 / Published: 18 September 2023
(This article belongs to the Special Issue Forest, Trees, Human Health and Wellbeing)

Abstract

:
Forest thermal environments and health-related factors have a significant impact on user experience and physical benefits. Therefore, it is important to study changes in the thermal environment and health-related factors in recreational forests. Clustered bamboo forests have unique structures featuring high canopy density and extensive understory spaces suitable for recreational activities. However, there is no relevant report on the recreational use of these forests. This study investigated seasonal characteristics in the thermal comfort and health-related factors in two clustered bamboo forests in Southwest China. Microenvironmental parameters and health-related factors (negative air oxygen ions (NAI), airborne particulate matter, airborne microorganisms, and biogenic volatile organic compounds (BVOCs)) were measured in four seasons. The microenvironmental parameters were converted into a physiological equivalent temperature (PET) for each period. The results showed that (1) most of the time, the thermal comfort, air particle, NAI, and bacteria concentrations in the two bamboo forests were superior to the controls and met the standard for recreational activities; (2) thermal comfort environments and health-related factors levels varied between two bamboo forests; and (3) the most abundant compounds in the two bamboo forests in each season were leaf alcohol and 2-hexenal. The two clustered bamboo forests provided a comfortable thermal environment and had clean air and bactericidal abilities in all seasons. The forests emitted BVOCs with fresh grass and leaf fragrances, helping to alleviate the sense of depression among visitors. The results confirm that clustered bamboo forests can provide suitable recreational conditions. The results can be used to guide the management of recreational forests and provide support for the development of bamboo forests.

1. Introduction

Numerous studies have shown that exposure to nature can promote physical and mental health [1,2,3]. In Asia, forest recreation activities such as forest bathing are a common choice for people seeking to get closer to nature. Forests provide comfortable temperatures, clean air, and natural scents. A good forest environment and the right time of year can enhance the benefits of forest activities and the well-being of users [4,5]. The thermal environment of a forest has a significant impact on the user experience. Forests influence microclimate due to their spatial coverage and effect on enclosure [6], which creates a unique thermal environment inside the forest. Physiological equivalent temperature (PET) was proposed by Höppe to evaluate human thermal perception based on the Munich energy balance model for individuals [7]. The advantage of PET is that the calculation integrates several elements, including climate parameters, body parameters, clothing, activity, and environmental factors, and therefore, it is widely used in the study of thermal comfort in green spaces. Studies have shown that forests play an important role in cooling and improving thermal comfort, with higher tree cover usually being cooler [8], and that PET under trees is approximately 10 °C lower than that of lawns [9].
A beneficial forest environment has excellent health benefits for the human body. Forests can provide clean air and space for recreational activities [10]. Some trees can also improve human immunity and prevent and treat diseases by releasing and volatilizing beneficial substances [11,12,13]. Therefore, many scholars have conducted numerous studies on forest health-related factors, including air cleanliness and biogenic volatile organic compounds (BVOCs), which were also called phytoncides in some studies [14]. Negative air oxygen ions (NAI) inhibit the growth of viruses and bacteria and are palliative in the adjunctive treatment of diseases [15,16] and help in the treatment of respiratory, circulatory, and digestive disorders [17]. NAI concentrations in forests are almost twice as high as those in other types of environments [18]. Atmospheric particulate matter (PM) is a major air pollutant that poses a significant risk to human health. Particulate pollutants are classified into three types according to their aerodynamic equivalent particle size: total suspended particulate (TSP), coarse PM10 (2.5–10 μm), and fine PM2.5 (0.1–2.5 μm) [19]. An increase in tree cover can lead to a 10% reduction in PM concentrations [20], and a further study by Nowak [21] found a significant reduction in airborne PM concentrations with decreasing mixed layer height. BVOCs are low-boiling-point and volatile small-molecule compounds produced by plants through secondary metabolism, and BVOCs released by plants in forests can cause pleasant and comfortable feelings in humans and animals [22,23]. There are also aromatic BVOCs that can lower blood pressure and improve mood [24,25]. A number of studies have shown that trees can reduce or kill airborne microorganisms by releasing BVOCs to resist the invasion, growth, and reproduction of pathogenic microorganisms [26,27]. However, some BVOCs, such as isoprene, can also cause potential air pollution [28,29].
Clustered bamboo forests are a class of forests with a unique standing structure caused by the gathering of bamboo culms into clumps. They are characterized by high canopy density and height under branches, so there is ample free space under the forest canopy, making it suitable for recreational activities. The health benefits of a variety of forests [30,31] and several types of scattered bamboo forests [32,33] have been studied by many researchers. Meanwhile, the thermal environment of the forest has a significant impact on the visitor’s experience, and the microenvironment of the forest varies by site. Differences in tree species or structure in a forest can alter the microclimate and, thus, the level of thermal comfort [34,35,36]. However, there are no reports on thermal comfort and health-related factors in the same forest. Southwest China is a typical mixed bamboo area [37,38] with a favorable climate. Bamboo forests are widely distributed as a valuable resource for timber and food. At the same time, a large number of local residents and foreign tourists visit the area every year for recreation, healthcare, and tourism activities.
The aim of this study was to investigate the thermal environments and health-related factors related to the special stand structure of clustered bamboo forests. The research was conducted in two locally distributed clustered bamboo forests in four seasons. This study aims to determine the levels of thermal perception and health-related factors in all seasons, as well as seasonal patterns of these factors in clustered bamboo forests, to evaluate the thermal comfort and health benefits of bamboo forests.
This study aims to answer the following questions:
(1)
Are the health-related factors and thermal environment of clustered bamboo forests positive?
(2)
Are there differences in the thermal environment and health-related factors in two clustered bamboo forests?

2. Materials and Methods

2.1. Study Area and Materials

The study area is located in the Chengdu Plain region in southwestern China, which belongs to the subtropical monsoonal humid climate zone, with four distinct warm and humid seasons, an average annual temperature of 16.1 °C, an average annual rainfall of 1200–1600 mm, and an average annual sunshine duration of 825.7–1202.9 h [39]. Therefore, the region has suitable climatic conditions for forest recreation activities. The Chengdu Plain has a developed socio-economy and a long history of bamboo tourism, with two types of typical clustered bamboo forests: Neosinocalamus affinis (Rendle) Keng f. and Dendrocalamus latiflorus Munro.
N. affinis (NA) forms a medium-sized clump of bamboo with a pole height of 5–10 m and a diameter at breast height (DBH) of 5–8 cm and is distributed at an elevation of less than 1000 m.
D. latiflorus (DL) forms a large clump with a pole height of 18–25 m and a DBH of 15–24 cm and is distributed at an elevation of less than 500 m.
The NA bamboo forest selected for the study is located in Guihua town, Pengzhou city (103°48′03″–103°48′12″ E, 31°04′44″–31°05′29″ N, elevation 704 m). The area of the NA forest is 83.4 ha, the plantation density is 625 clumps/ha with 25 plants/clump, the pole height is 8.12 ± 0.64 m, the DBH is 6.02 ± 0.51 cm, the height under the branches is 3.19± 0.25 m, and the canopy density (the ratio of the vertical projection of the canopy to the area of the forest) is 0.94.
The DL bamboo forest selected for the study is located in Dahua town, Meishan city (104°10′60″–104°11′17″ E, 30°06′24″–30°06′39″ N, elevation 430 m). The area of the DL forest is 25.8 ha, the plantation density is 750 clumps/ha with 15 plants/clump, the pole height is 20.93 ± 1.12 m, the DBH is 16.24 ± 0.92 cm, the height under the branches is 6.51 ± 0.37 m, and the canopy density is 0.87.
The two bamboo forests are suburban forests with more than 15 years of afforestation, close to towns, and covered by convenient transportation. Residents of nearby towns and cities are their main visitors. Both bamboo forests are pure forests with a simple and uniform plant community structure. The trees in the middle and upper parts are mostly bamboo, and the ground is covered with a large amount of litterfall, while the lower layer is sparsely planted (Figure 1).
We selected a control near each of the two bamboo forests. The controls were located in the township near the bamboo forests, which had similar weather conditions to the bamboo forests and offered catering and lodging services for foreign tourists. We established the control in an open square in the township, which was a popular spot for local residents to engage in outdoor activities, providing a reference to the recreational environment outside the bamboo forest for the experiment. After comparing the two control sites, we chose the control in Dahua town (104°9′15″ E, 30°05′06″ N, elevation 413 m) as the final experimental control, as control sites should be chosen close to the bamboo forest and have similar transport conditions. The final control point details were as follows: it was located in an open square in the township, unobstructed by buildings, close to a main road, and 3 km away from the bamboo forest.
Our hypotheses are as follows: both clustered bamboo forests have a comfortable thermal environment and good health-related factors but have varied thermal environments and health-related factors in different seasons.

2.2. Measurement

The study area has four distinct seasons. Therefore, microenvironmental parameters were measured in the two bamboo forests and the control during each of the four seasons in this study. Measurements were conducted in both 2019 and 2021, with January, April, August, and November selected as representative months for winter, spring, summer, and autumn, respectively [40]. Measurements were taken on 2 days in each representative month with clear, stable weather. Considering the large variation in daylight hours in the study area during the four seasons, the measurement time of the four seasons was set uniformly from 7:00 to 19:00 to ensure that the measurement time was generally after sunrise and before sunset. During these two days, staff conducted measurements every 2 h for each microenvironmental parameter (including solar radiation, wind velocity, temperature, and relative humidity) and air cleanliness (including negative air oxygen ions, air microbial, and particulate matter concentration). Each measurement lasted 10 min, and the average value was taken as the result of that period.
Since the study forests were pure forests, four sample plots were established in each bamboo forest, and the mean values of each parameter from the four sample plots were used to reflect the microenvironment and air quality within the forest. These four plots represented static and dynamic recreational spaces in the bamboo forest, as visitors mainly moved around in these two types of spaces. All the sample plots were located more than 50 m from the edge of the bamboo forest and more than 30 m from the river. The two static recreation sample plots were established more than 15 m away from the forest trail, and the dynamic two were established next to the forest trail. Three stations were set up in each sample plot, and each station was separated by 15 m. The mean values obtained from the three stations were used as the results for the sample plot at that time, and each measurement was repeated three times. Three stations spaced 15 m apart were also established in the control plot; the measurement method used was the same as that applied in the bamboo forest. All the measurements were taken at a height of 1.5 m.
The bamboo forest BVOCs were measured at the same time as described below. Healthy undamaged leaves of two bamboo species (10 g each) were collected at 9:00 a.m. on the day of measurement, transported immediately to the laboratory for testing, and preserved at 4 °C to keep them fresh. Both bamboo forests were about 70 km away from the laboratory, with a 2 h drive. The collected leaves included a homogeneous mixture of upper, middle, and lower leaves from three 2-year-old bamboo plants on the sunny leeward side of the sample sites.

2.3. Instrumentation and Calculation

The KESTREL weather meter NK5500 (USA) was used to detect temperature and humidity, the Huayi anemometer PM6252B (Beijing, China) was used to measure wind velocity, and the solar power meter TES-1333R (Taiwan, China) was used to measure solar radiation.
Based on the measured temperature, relative humidity, wind speed, and solar radiation intensity, the PET values were calculated for each period at each site using RayMan software by the Meteorological Institute at Freiburg University, and the corresponding thermal comfort perceptions were derived from the model intervals of PET thermal sensation and physiological stress levels. The overall physiological indexes were set as follows: male; 35 years old; height, 175 cm; weight, 75 kg; average metabolic rate, 80 W. According to the local climate and dress, the thermal resistance of clothing was 0.8 clo in spring and autumn, 0.5 clo in summer, and 2.0 clo in winter.
PM suspended in the air was detected by a portable laser dust detector JCF-5C (Qingdao, China), which monitored TSP, PM10, and PM2.5 with a sampling flow rate of 2 L/min. Before the measurement, the instrument correction coefficient was calibrated using the classical weighing method. Negative air ions were detected by a DCXX M&C Technology 22 Air Negative Ion Detector IMH12 (Beijing, China) with a sampling rate of one value per second.
Airborne microorganisms were collected by the JWL-IIE (Qingdao, China), an impact air microbial sampler with a sampling flow rate setting of 20 L/min. After 24 h of incubation in the laboratory, airborne bacteria and fungi were detected separately using a colony counter [41]. The airborne microbial content (cfu/m3) was calculated using Equation (1):
M i c r o b i a l   c o n t e n t = n u m b e r   o f   p l a t e   c o l o n i e s × 1000 f l o w   r a t e × s a m p l i n g   t i m e
The BVOC tests were conducted in the laboratory. Bamboo leaves collected from the above sample sites were cut and mixed well, weighed to 2 g each, and placed in a 20 mL headspace extraction vial, which was sealed and allowed to stand for 30 min. Detection was performed by headspace solid-phase microextraction–gas chromatography (SPME) [42]. Then, the SPME syringe was inserted into the vial, and the fiber tip (model 50/30 μm DVB/CAR/PDMS (Supelco, Bellefonte, PA, USA)) was pushed out of the syringe. Headspace extraction was performed in a water bath at 60 °C for 45 min. Then, the fiber tip was inserted into the GC injector of the QP2010 PLUS gas chromatograph–mass spectrometer (Shimadzu, Japan) and desorbed for 10 min, while the gas in the empty extraction bottle was adsorbed as a blank control. Two test replicates were performed for each bamboo leaf.
Calculation of volatile organic compounds was performed as follows: 1 μL each of n-alkane mixed standard samples C5–C8 and C8–C20 were obtained and analyzed according to the same procedure used for the bamboo leaves. The retention time of each component was recorded, and the linear retention index (LRI) of each component was calculated as follows:
L R I x = 100 n + 100 ( T x T n ) ( T n + 1 T n ) ]
where tx, tn, and tn+1 are the peak retention times of the components to be analyzed and the components with carbon atom numbers between n and n+1 (tn < tx < tn+1), respectively. The NIST08.LIB library was used to perform tandem searches of the obtained mass spectra, and the retention index characterization method was used to assist the mass spectral searches. The relative content of each component of BVOCs in each sample was calculated based on the peak area normalization method of the total ion flow chromatographic peaks:
R e l a t i v e   c o n t e n t = p e a k   a r e a   o f   c o m p o n e n t s   t o   b e   m e a s u r e d s u m   o f   a l l   p e a k   a r e a s × 100 %

2.4. Data Analysis

Based on the measured microenvironmental data, PET values were calculated using RayMan 1.2 for each site to visualize the thermal comfort results. Subsequently, we performed statistical analysis using SPSS 20.0. After determining that the data conform to a normal distribution, an analysis of variance (ANOVA) was used to compare the differences in health-related factors between different forests and seasons. Graphs were organized and plotted using Origin 18.0 and Photoshop.

3. Results

3.1. Dynamic Change Characteristics of Thermal Comfort

The thermal comfort of the two bamboo forests and the town open space was plotted for all seasons based on the calculated physiological equivalent temperature (PET) values (Figure 2). Except in winter, the PET of the control was much higher than that of the two bamboo forests, indicating that the two bamboo forests both had a cooler thermal environment. Moreover, the PET of the N. affinis (NA) forest was mostly lower than those of the D. latiflorus (DL) forest during the same period, indicating that the cooling ability of the NA forest was higher than that of the DL bamboo forest. In spring, summer, and autumn, the thermal comfort of the two bamboo forests was mostly in the range of “slightly cool”, “comfortable”, and “slightly hot” during the day, indicating that the area was suitable for recreational activities. As shown in Figure 2, the heat stress in the two bamboo forests was weaker than that in the control in spring and summer. However, in autumn and winter, the cold stress was stronger in the NA forest than in the control and the DL bamboo forest. This suggests that the effect of the two bamboo forests on thermal comfort was not consistent throughout different seasons.

3.2. Dynamic Change Characteristics of Air Cleanliness

3.2.1. Seasonal Dynamic Change

The total suspended particulate (TSP) concentrations were significantly lower (p < 0.05) in all four seasons in the NA bamboo forest and DL forest than in the control in all four seasons (Figure 3A). The TSP concentrations in both bamboo forests were significantly lower in spring and summer than in autumn and winter (p < 0.05). It is noteworthy that the TSP concentrations in the NA forest were significantly lower than those in the DL forest in all seasons (p < 0.05). The seasonal differences and seasonal variation in coarse particulate matter (PM10) and fine particulate matter (PM2.5) between the two bamboo forests were consistent with those of the TSP (Figure 3B,C).
The negative air oxygen ion (NAI) concentrations in both bamboo forests were higher than 1000 ions/cm³ in all four seasons, which met the World Health Organization (WHO) fresh air standard and indicated good recreational opportunities and health effects (Figure 3D). Except in summer, the NAI concentrations were significantly higher in both bamboo forests than in the control (p < 0.05). The NAI concentrations were significantly higher in the DL forest than in the control and NA forest in spring and summer (p < 0.05), while in autumn and winter, it was the NAI concentrations in the NA forest that were significantly higher than the DL forest and the control (p < 0.05).
Airborne bacterial levels were significantly lower (p < 0.05) in both bamboo forests than in town open spaces in all seasons, indicating that bamboo forests have a significant bactericidal effect (Figure 3E). The airborne bacterial content was significantly lower in summer and autumn (p < 0.05) than in spring and winter in the NA forest, while that in autumn was significantly lower (p < 0.05) than that in the other three seasons in the DL forest. The airborne bacterial content of the NA forest was significantly lower than that of the DL forest in summer (p < 0.05), but the opposite was true in winter. There was no significant difference between the other two seasons. The airborne fungal content in the bamboo forest was very different from the airborne bacterial content (Figure 3F), with only the summer airborne fungal content of both bamboo forests being significantly lower (p < 0.05) than that of the town open space. In spring and winter, the airborne fungal content in the bamboo forests was significantly higher (p < 0.05) than that in the control. However, the airborne fungal content of the NA forest was significantly lower than that of the DL forest in spring, summer, and autumn (p < 0.05).

3.2.2. Daily Dynamic Change in PM2.5 and NAI

PM2.5 and NAI are the most relevant of the studied parameters to human recreation and health effects. Therefore, the daily dynamics of PM2.5 and NAI were analyzed. Combined with the current Environmental Air Quality Standards (GB3095-2012) issued by China, the daily dynamic changes in PM2.5 were plotted (Figure 4). The daily dynamics of PM2.5 were flat in spring and summer in both bamboo forests, fluctuated in autumn and winter, with an overall decreasing trend during the day in autumn, and followed a “V” shape in winter. The lowest value of PM2.5 in the daytime was mostly observed between 11:00 and 13:00. The PM2.5 concentrations in the NA forest were lower than those in the town open space during the recreation time in each season and below the primary concentration limits (35 μg/m³) of GB3095-2012. The PM2.5 concentrations in the DL forest were below the primary concentration limits during all time periods except for 9:00 in winter and below the control most of the time. It is important to note that PM2.5 concentrations of the control were also below the primary concentration limit most of the time, except during the winter.
The daily dynamic changes in NAI are shown in Figure 5. The daily dynamics of the NAI concentration in the two bamboo forests were consistent in spring and summer, showing a trend of first decreasing and then increasing. In contrast, the trends in winter were the same in both bamboo forests, showing an increase followed by a decrease. The NAI concentrations in both bamboo forests were higher than 1000 ions/cm³ in all the periods in the NA forest. The NAI concentrations in the DL forest were also higher than 1000 ions/cm³ in all the time periods except for 7:00–11:00 in winter, meeting the WHO fresh air standard. It is worth mentioning that summer and autumn NAI concentrations in the control were higher than the WHO fresh air standard, reflecting favorable recreational conditions in the study area.

3.3. Dynamic Characteristics of Volatile Organic Compounds

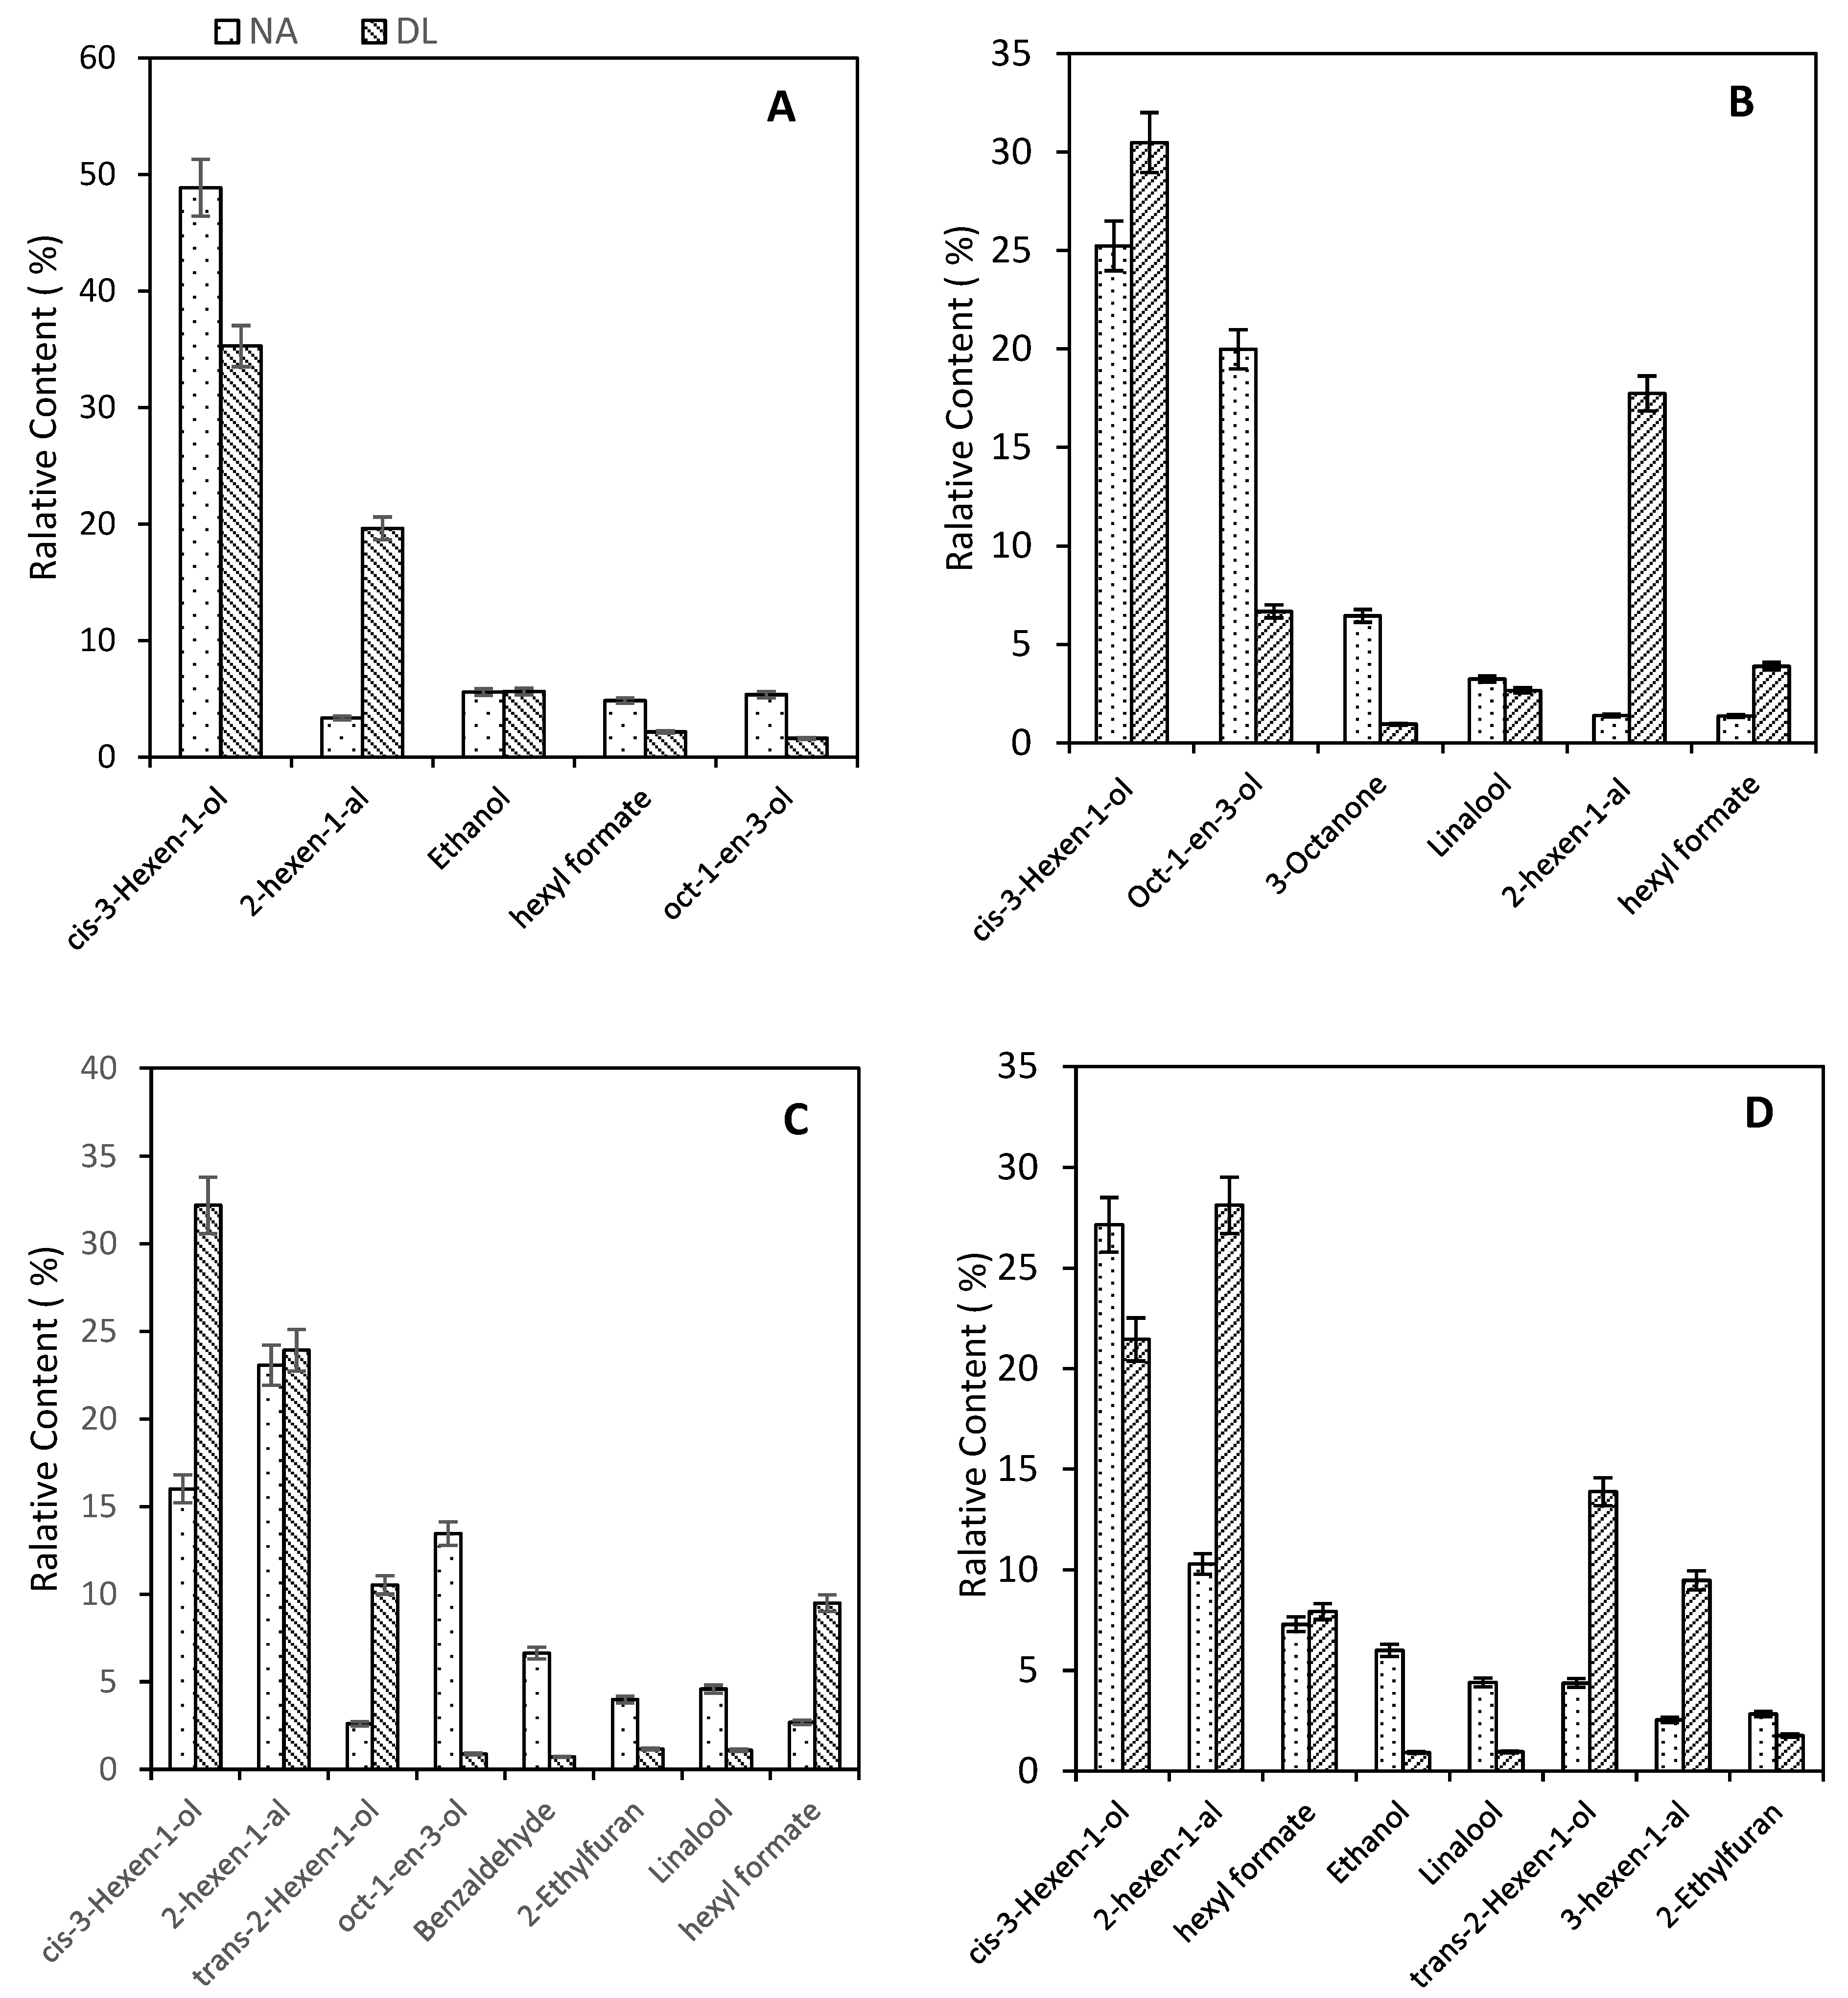
3.3.1. Composition and Contents of Volatile Organic Compounds across Four Seasons in Two Types of Clustered Bamboo Forests

The analysis of the composition and relative contents of biogenic volatile organic compounds (BVOCs) showed that eight types of BVOCs were emitted from the two bamboo forests (Figure 6). The main volatile compounds were alcohols, aldehydes, esters, and ketones. The highest relative contents of alcohols were found in all four seasons in the two clustered bamboo forests. The relative contents of alcohols in the four seasons were 66.85% (spring), 61.70% (summer), 40.58% (autumn), and 53.90% (winter) in the NA forest and 64.61% (spring), 43.04% (summer), 66.22% (autumn), and 48.5% (winter) in the DL forest. The next most abundant compounds in the DL forest across the four seasons were aldehydes, with relative contents of 26.51% (spring), 42.04% (summer), 25.86% (autumn), and 19.72% (winter). The next most abundant compounds in the NA forest were alkanes (9.07%) and terpenes (10.37%) in the spring and summer and aldehydes in the autumn (31.17%) and winter (13.75%).

3.3.2. Seasonal Variation Patterns of Major Volatiles of Two Species of Clustered Bamboo

The main compounds (relative content >1%) common to the two bamboo species in the four seasons are shown in Figure 7. The compound with the highest relative contents in spring, summer, and winter in the NA forest was leaf alcohol (cis-3-Hexen-1-ol), while in autumn, it was 2-hexenal (23.07%). In contrast, in the DL forest, leaf alcohol had the highest relative content in all four seasons. The main compounds in the NA forest were leaf alcohol, 2-hexenal, and oct-1-en-3-ol. However, the main compounds in the DL forest were leaf alcohol, 2-hexenal, and trans-2-Hexen-1-ol. It was worth mentioning that we did not detect isoprene in the two bamboo forests.
The mean relative contents of the major compounds were calculated for both bamboo forests for all four seasons. The compound with the highest mean relative content for all four seasons in both bamboo forests was leaf alcohol, with contents of 29.31% in the NA forest and 29.85% in the DL forest. The compound with the next highest mean relative content was oct-1-en-3-ol for the NA forest (11.49%) and 2-hexenal for the DL forest (20.69%). It is noteworthy that 2-hexenal was also present in the emissions of NA forest, accounting for 9.53% of the contents sampled.

4. Discussion

4.1. Thermal Environment of Two Bamboo Forests and Their Effect on Thermal Comfort

According to the physiological equivalent temperature (PET) values corresponding to the thermal comfort perception [43], the periods of “slightly cool”, “comfortable”, and “slightly warm” conditions are suitable for recreational activities. We found that the two clustered bamboo forests have a good thermal environment in spring and summer because they exhibit significant cooling and humidifying effects [44] and can weaken solar radiation and wind speed [45], so the thermal conditions of both forests are in a comfortable range. Studies have shown that urban forests with an area greater than 3000 m2 and a canopy density greater than 0.4 can exert significant cooling and humidifying effects [46], and the area and canopy density of the two bamboo forests used in our experiment were much larger than assumed based on the results of previous studies; therefore, these forests could exert good cooling effect.
However, in autumn and winter, the two bamboo forests had different effects on thermal comfort. The PET values of the N. affinis (NA) forest showed that conditions were much less “comfortable” in autumn and winter than in the control most of the time. This is undoubtedly related to the high canopy density of the NA forest. In terms of thermal comfort, denser and better-covered forest green spaces are not always preferred because of the negative effects of shading in winter [47]. In contrast, the D. latiflorus (DL) bamboo forest had a more comfortable thermal environment in autumn and winter, showing mitigation and stabilization of cold stress. Under the same conditions, these differences are necessarily related to the structure of the two bamboo stands. On the one hand, the canopy density of the NA forest is higher than that of the DL forest, causing the forest canopy to block a large amount of solar radiation, so the temperature inside the forest is lower. On the other hand, the more spacious understory allows for easier air movement and heat exchange between the inside and outside of the forest [48]. This reminds us that, in addition to the canopy density, the understory structure of the forest may also be an important factor affecting the thermal comfort within the forest, which provides a direction for creating a more comfortable forest thermal environment or renewing overly depressed forests.
Although few scholars have used PET to study the bamboo forest environment, a comparison with the comfort indexes calculated for other forests [44,49] revealed consistent findings in terms of daily and seasonal dynamics of temperature and humidity, solar radiation, and wind speed. Therefore, we believe that our findings are reasonable.

4.2. Differences in Health-Related Factors between the Two Bamboo Forests

The airborne particulate matter content was influenced by the status of pollution in the regional environment, and the pattern of seasonal variation in both bamboo forests showed high particulate matter levels in winter and low particulate matter levels in summer, followed by spring and autumn, which was consistent with most cities in China [50]. Additionally, the airborne suspended particulate matter concentrations in both bamboo forests were significantly lower than those in the control, and the airborne particulate matter concentrations in the NA forest were significantly lower than those in the DL forest in all seasons, except for PM2.5 concentration in autumn. Tree dust retention is influenced by canopy type, branch density, and foliage [51]. Due to the similarities in leaf size and external morphology between the two bamboo species, we speculated that the higher degree of canopy density, planting density, and lower under-branching height of NA bamboo forests were the main reasons for their effectiveness in dust retention [52,53].
Negative ions are generated by forest trees through the ionization of the air by the photoelectric effect formed by the discharge of the tips of the leaves and branches and the photosynthesis of green plants. In this study, the negative oxygen ion contents of the two bamboo forests were higher than that of the control plot, showing high in spring, summer, and autumn and low in winter, which is consistent with studies in other forests [54,55]. The negative oxygen ion concentration in the DL forest was significantly higher than that in the NA forest in spring and summer, while the opposite was in autumn and winter. Compared to previous studies, the NAI levels in our two bamboo forests were not as high as the concentrations in other studies [54,56]. This may be due to the high canopy density of the two bamboo forests, which prevented photosynthesis to some extent, resulting in fewer negative oxygen ions [57]. Previous studies have also shown that the negative oxygen ions in the forest decrease within a certain range when the canopy density is greater than 0.8 [58].
Previous studies have shown that forest greenery has a good inhibitory effect on bacterial growth [59,60], which is consistent with the results of the present study. However, in the present study, the airborne fungal levels in the winter and spring in the two bamboo forests were higher than those in the control. Similar results have been found in other related studies [61,62]. We speculate that this may be due to the fact that most airborne fungi originate from plants [63] and soil [64] and the higher humidity [65] of the bamboo forests in spring and winter. However, some relevant studies have shown that green areas can significantly reduce the number of potentially pathogenic bacterial and fungal species [66]. Previous studies have also reported that forests or meadows can provide some protection against allergies and asthma [67]. However, given that fungal spores are an important cause of allergies and asthma [68,69]. Hence, the impact of specific forest environments on respiratory diseases remains a topic for further research. In conjunction with our study, we suggest that people with a history of related diseases should consider avoiding visiting areas with abundant greenery, such as forests, during the high-humidity season.
Combining the current ambient air quality standards issued by China and WHO, we found that the air quality in the forest met the appropriate recreational standards in all seasons except winter when the air particle concentration and microbial content were high. The suitable time periods for recreational activities in both bamboo forests are concentrated in spring, summer, and autumn, while winter is not suitable for recreational activities. The results from recreational forest studies in other regions echoed this. For example, people were less willing to visit winter forests than in other seasons [70,71] or rated forest benefits lower [72]. In the future, different recreational activities can be suggested within the bamboo forests according to the suitable times and different needs of recreationists. For example, outdoor sports with strong metabolic requirements are recommended for spring and autumn because these periods are cooler; in summer, static recreational activities such as meditation and yoga are recommended [73] to best take advantage of the healing conditions of the bamboo forest at this time.
Previous studies of biogenic volatile organic compounds (BVOCs) have focused on pine and cypress [74,75] and flowers [76,77], which emit BVOCs, including isoprene, terpenoids, alkanes, ketones, acids, and aldehydes. In this study, the BVOCs from two clustered bamboo forests were dynamically monitored and analyzed, and it was found that the BVOCs from the clustered bamboo forests were mainly alcohols and aldehydes, with leaf alcohol and 2-hexenal having high relative contents. Previous studies have shown that there are differences between the BVOCs emitted by different plant species and vegetation types [78]. The results of this paper also differed somewhat from those obtained for other bamboo plants [29,79]. However, the lack of high levels of isoprene detected in the two clustered bamboo forests may also be due to the different research methods used, as previous results of solid-phase microextraction for BVOCs generally showed lower levels of isoprene [76,80]. Although isoprene has little reported health benefits, it has previously been reported as a volatile found in large quantities in bamboo plants [29]. The dependence of isoprene emission on light and temperature has previously been reported [81]. In fact, most BVOC emissions were temperature dependent [82], so BVOCs dissolved or stored in plant cells can be collected by heating and microextraction of the headspace. However, isoprene was formed through the methylerythritol 4-phosphate pathway in the leaf chloroplasts by photosynthesis intermediates and was released immediately after production [81]. The bamboo leaves in this study were kept at low temperatures and protected from light during collection to laboratory analysis, which explains the non-detection of isoprene in this study. Other researchers have also detected significant amounts of alcohol in moso bamboo stands [83,84], which is similar to the results of the present study. There was little difference in the types of BVOCs between the two clustered bamboo forests, probably because both are clustered bamboo forests with similar distribution areas and are less influenced by environmental factors [85]. The main components of BVOCs in the two bamboo forests were leaf alcohol, 2-hexenal, oct-1-en-3-ol, and trans-2-Hexen-1-ol, which are volatile essential oils with aromas of grass, lavender, or fruit. Among them, leaf alcohol, 3-hexenal, and 2-hexenal all have a grassy odor [86,87], and studies have shown that when mixed together, these three can reduce the amplitude value of alpha waves in the human brain, thus reducing the feeling of depression [88]; linalool was also detected in the two bamboo groves, and this substance slows the heart rate and relieves tension [89]. This suggests that the two clustered bamboo forests have good healing effects.

4.3. Limitations

Firstly, the thermal comfort of two bamboo forests was evaluated in this paper. Both forests studied have a high degree of coverage, which blocks most of the solar radiation. Therefore, in this instance, the back radiation from the ground was not taken into account. However, for further study of forest thermal environments in the future, more environmental and radiation parameters need to be considered, as well as more powerful indicators, such as UTCI, to evaluate and compare the thermal environments of different forests.
Furthermore, while the recreational conditions of two recreational bamboo forests were evaluated based on thermal comfort and multiple health-related factors, this paper primarily focuses on their level and seasonal change patterns. In the future, individual indicators can be further quantified, such as using headspace dynamic sampling to calculate the emissions of beneficial BVOCs from different forests. On the other hand, it is important to consider subjective surveys of a large number of visitor samples, which can be combined with the measured data to synthesize the comprehensive recreational conditions of the forests.

5. Conclusions

In this paper, the temporal variation characteristics of thermal comfort and health-related factors in two clustered bamboo forests, N. affinis forest and D. latiflorus forest, were explored. The results of the study showed that the integrated heat index of the two bamboo forests was within the comfort zone for most of the spring, summer, and autumn seasons, with a comfortable thermal environment. The negative air oxygen ions and airborne particulate matter concentrations in both bamboo forests met the clean air standard for all four seasons, and airborne bacteria concentrations were lower than the control in all seasons. The biogenic volatile organic compounds emitted from the two bamboo forests contained a variety of health benefits. This supports the first part of the hypothesis that clustered bamboo forests have a good thermal environment and health-related factors, except for winter. The N. affinis forest showed positive thermal effect only in spring and summer but negative thermal effect in autumn and winter, while the D. latiflorus forest showed positive thermal effect in all seasons. The overall pattern of change in health-related factors in the two bamboo forests was similar, but there were several differences in the health-related factors of the two bamboo forests by one-way ANOVA. These support the second part of the hypothesis that clustered bamboo forests have varied thermal environment and health-related factors in different seasons.
Finally, this study complements the ecosystem service of bamboo forests, especially forest thermal environment and forest health ecological services, and the results can provide a reference for forest thermal environment management and recreational bamboo forest development.

Author Contributions

Conceptualization, M.J.; methodology, T.W.; formal analysis, Q.Y. and H.T.; investigation, B.L.; resources, Z.L.; data curation, H.T.; writing—original draft preparation, Q.Y.; writing—review and editing, H.T.; visualization, H.T. and Q.Y.; supervision, M.J.; project administration, X.L. and Q.C. All authors have read and agreed to the published version of the manuscript.

Funding

This work was jointly funded by the Sichuan Science and Technology Program (grant number 2021YFN0006); and the National Key R&D Program of China (2018YFD0600105).

Data Availability Statement

The data presented in this study are available on request from the corresponding author.

Conflicts of Interest

The authors declare that they have no known competing financial interest or personal relationship that could have appeared to influence the work reported in this paper.

Nomenclature

PETphysiological equivalent temperature (°C)
BVOCsbiogenic volatile organic compounds
NAInegative air oxygen ions (ions/cm3)
TSPtotal suspended particulate (μg/cm3)
PM10coarse particulate matter (μg/cm3)
PM2.5fine particulate matter (μg/cm3)
NANeosinocalamus affivis (Rendle) Keng f
DLDendrocalanaes latiflorus Munro
DBHdiameter at breast height (cm)

References

  1. Nowak, D.J.; Hirabayashi, S.; Doyle, M.; McGovern, M.; Pasher, J. Air pollution removal by urban forests in Canada and its effect on air quality and human health. Urban For. Urban Green. 2018, 29, 40–48. [Google Scholar] [CrossRef]
  2. Triguero-Mas, M.; Dadvand, P.; Cirach, M.; Martinez, D.; Medina, A.; Mompart, A.; Basagana, X.; Grazuleviciene, R.; Nieuwenhuijsen, M.J. Natural outdoor environments and mental and physical health: Relationships and mechanisms. Environ. Int. 2015, 77, 35–41. [Google Scholar] [CrossRef] [PubMed]
  3. de Bloom, J.; Kinnunen, U.; Korpela, K. Exposure to nature versus relaxation during lunch breaks and recovery from work: Development and design of an intervention study to improve workers’ health, well-being, work performance and creativity. BMC Public Health 2014, 14, 488. [Google Scholar] [CrossRef]
  4. Lafortezza, R.; Carrus, G.; Sanesi, G.; Davies, C. Benefits and well-being perceived by people visiting green spaces in periods of heat stress. Urban For. Urban Green. 2009, 8, 97–108. [Google Scholar] [CrossRef]
  5. Schirpke, U.; Meisch, C.; Marsoner, T.; Tappeiner, U. Revealing spatial and temporal patterns of outdoor recreation in the European Alps and their surroundings. Ecosyst. Serv. 2018, 31, 336–350. [Google Scholar] [CrossRef]
  6. Lin, W.; Zeng, C.C.; Lam, N.S.N.; Liu, Z.F.; Tao, J.Y.; Zhang, X.X.; Lyu, B.Y.; Li, N.A.; Li, D.; Chen, Q.B. Study of the relationship between the spatial structure and thermal comfort of a pure forest with four distinct seasons at the microscale level. Urban For. Urban Green. 2021, 62, 127168. [Google Scholar] [CrossRef]
  7. Höppe, P. The physiological equivalent temperature—A universal index for the biometeorological assessment of the thermal environment. Int. J. Biometeorol. 1999, 43, 71–75. [Google Scholar] [CrossRef]
  8. Teshnehdel, S.; Akbari, H.; Giuseppe, E.D.; Brown, R.D. Effect of tree cover and tree species on microclimate and pedestrian comfort in a residential district in Iran. Build. Environ. 2020, 178, 106899. [Google Scholar] [CrossRef]
  9. Kántor, N.; Chen, L.; Gál, C.V. Human-biometeorological significance of shading in urban public spaces—Summertime measurements in Pécs, Hungary. Landsc. Urban Plan. 2018, 170, 241–255. [Google Scholar] [CrossRef]
  10. Miklós, L.; Špinerová, A.; Belčáková, I.; Offertálerová, M.; Miklósová, V. Ecosystem Services: The Landscape-Ecological Base and Examples. Sustainability 2020, 12, 10167. [Google Scholar] [CrossRef]
  11. Larenas-Linnemann, D.; Rodriguez-Perez, N.; Arias-Cruz, A.; Blandon-Vijil, M.V.; Del Rio-Navarro, B.E.; Estrada-Cardona, A.; Gereda, J.E.; Luna-Pech, J.A.; Navarrete-Rodriguez, E.M.; Onuma-Takane, E.; et al. Enhancing innate immunity against virus in times of COVID-19: Trying to untangle facts from fictions. World Allergy Organ. 2020, 13, 100476. [Google Scholar] [CrossRef]
  12. Hansen, M.M.; Jones, R.; Tocchini, K. Shinrin-Yoku (Forest Bathing) and Nature Therapy: A State-of-the-Art Review. Int. J. Env. Res. Public Health 2017, 14, 851. [Google Scholar] [CrossRef]
  13. Lee, I.; Choi, H.; Bang, K.-S.; Kim, S.; Song, M.; Lee, B. Effects of Forest Therapy on Depressive Symptoms among Adults: A Systematic Review. Int. J. Environ. Res. Public Health 2017, 14, 321. [Google Scholar] [CrossRef]
  14. Abe, T.M.; Hisama, S.; Tanimoto, H.; Shibayama, Y.; Nomura, M. Antioxidant effects and antimicrobial activities of phytoncide. Biocontrol Sci. 2008, 13, 23–27. [Google Scholar] [CrossRef]
  15. Krueger, A.P.; Reed, E.J. Biological impact of small air ions. Science 1976, 25, 1209–1213. [Google Scholar] [CrossRef] [PubMed]
  16. Winsor, T.J.; Beckett, C. Biologic effects of ionized air in man. Am. J. Phys. Med. Rehab. 1958, 13, 83–88. [Google Scholar]
  17. Pino, O.; Ragione, F.L. There’s Something in the Air: Empirical Evidence for the Effects of Negative Air Ions (NAI) on Psychophysiological State and Performance. Sci. Educ. 2013, 14, 48–53. [Google Scholar]
  18. Yan, X.J. Spatial Distribution of Anion Level in Forests and Wetland in Qingdao. Sci. Sylvae Sinecae 2010, 46, 301–312. [Google Scholar]
  19. Song, Y.; Zhang, Y.; Xie, S.; Zeng, L.; Zheng, M.; Salmon, L.G.; Shao, M.; Slanina, S. Source apportionment of PM2.5 in Beijing by positive matrix factorization. Atmos. Environ. 2006, 40, 1526–1537. [Google Scholar] [CrossRef]
  20. Leonard, R.J.; Mcarthur, C.; Hochuli, D.F. Particulate matter deposition on roadside plants and the importance of leaf trait combinations. Urban For. Urban Green. 2016, 20, 249–253. [Google Scholar] [CrossRef]
  21. Nowak, D.J.; Crane, D.E.; Stevens, J.C. Air pollution removal by urban trees and shrubs in the United States. Urban For. Urban Green. 2006, 4, 115–123. [Google Scholar] [CrossRef]
  22. Lee, J.; Park, B.J.; Tsunetsugu, Y.; Ohira, T.; Kagawa, T.; Miyazaki, Y. Effect of forest bathing on physiological and psychological responses in young Japanese male subjects. Public Health 2011, 125, 93–100. [Google Scholar] [CrossRef]
  23. Renner, E.; Annette, M. Impact of biogenic terpene emissions from Brassica napus on tropospheric ozone over Saxony (Germany): Numerical investigation. Environ. Sci. Pollut. R 2003, 10, 147–153. [Google Scholar] [CrossRef]
  24. Edge, J. A pilot study addressing the effect of aromatherapy massage on mood, anxiety and relaxation in adult mental health. Complement. Ther. Nurs. Midwifery 2003, 9, 90–97. [Google Scholar] [CrossRef]
  25. Gao, X.; Yao, L. Preliminary Study on the Combinations of Specific Aromatic Plants for Hypotensive Healthcare. Chin. Landsc. Archit. 2011, 27, 37–38. [Google Scholar]
  26. Hammerbacher, A.; Coutinho, T.A.; Gershenzon, J. Roles of plant volatiles in defence against microbial pathogens and microbial exploitation of volatiles. Plant Cell Environ. 2019, 42, 2827–2843. [Google Scholar] [CrossRef]
  27. Ma, Q.; Xu, Y.; Xiao, H.; Mariga, A.M.; Chen, Y.; Zhang, X.; Wang, L.; Li, D.; Li, L.; Luo, Z. Rethinking of botanical volatile organic compounds applied in food preservation: Challenges in acquisition, application, microbial inhibition and stimulation. Trends Food Sci. Technol. 2022, 125, 166–184. [Google Scholar] [CrossRef]
  28. Khedive, E.; Shirvany, A.; Assareh, M.H.; Sharkey, T.D. In situ emission of BVOCs by three urban woody species. Urban For. Urban Green. 2017, 21, 153–157. [Google Scholar] [CrossRef]
  29. Bai, J.H.; Guenther, A.; Turnipseed, A.; Duhl, T.; Yu, S.Q.; Wang, B. Seasonal variations in whole-ecosystem BVOC emissions from a subtropical bamboo plantation in China. Atmos. Environ. 2016, 124, 12–21. [Google Scholar] [CrossRef]
  30. Toru, M.; Jie, G. Forest Therapy of Fragrance Toke Trail. Landsc. Archit. 2011, 4, 92–96. [Google Scholar]
  31. Stigsdotter, U.K.; Corazon, S.S.; Sidenius, U.; Refshauge, A.D.; Grahn, P. Forest design for mental health promotion Using perceived sensory dimensions to elicit restorative responses. Landsc. Urban Plan. 2017, 160, 1–15. [Google Scholar] [CrossRef]
  32. Lyu, B.; Zeng, C.; Deng, S.; Liu, S.; Jiang, M.; Li, N.; Wei, L.; Yu, Y.; Chen, Q. Bamboo forest therapy contributes to the regulation of psychological responses. J. Forest Res. Jpn. 2018, 24, 61–70. [Google Scholar] [CrossRef]
  33. Motonori, O.; Yoshiko, K.; Akira, T. Biogenic volatile organic compound emissions from bamboo species in Japan. J. Agric. Meteorol. 2018, 74, 40–44. [Google Scholar]
  34. Sanusi, R.; Johnstone, D.; May, P.; Livesley, S.J. Microclimate benefits that different street tree species provide to sidewalk pedestrians relate to differences in plant area index. Landsc. Urban Plan. 2017, 157, 502–511. [Google Scholar] [CrossRef]
  35. Zhao, T.F.; Fong, K.F. Characterization of different heat mitigation strategies in landscape to fight against heat island and improve thermal comfort in hot-humid climate (Part II): Evaluation and characterization. Sustainability 2017, 35, 841–850. [Google Scholar] [CrossRef]
  36. Zheng, S.L.; Guldmann, J.M.; Liu, Z.X.; Zhao, L.H. Influence of trees on the outdoor thermal environment in subtropical areas: An experimental study in Guangzhou, China. Sustainability 2018, 42, 482–497. [Google Scholar] [CrossRef]
  37. Chaomao, H. Studies on the bamboo diversity and its conservation in Yunnan, China. Sci. Silvae Sin. 2003, 39, 145–152. [Google Scholar]
  38. Zhou, B.-Z.; Fu, M.-Y.; Xie, J.-Z.; Yang, X.-S.; Li, Z.-C. Ecological functions of bamboo forest: Research and Application. J. Forest Res. Jpn. 2005, 16, 143–147. [Google Scholar] [CrossRef]
  39. Yu, Y.; Xiao, T. Study on Climatic Characteristics of Chengdu Plain Economic Zone. Plateau Mt. Meteorol. Res. 2021, 41, 143–149. [Google Scholar]
  40. Xu, X.; Xiao, T.G.; Ma, S.H. The Features Analysis on divisions of season in Southwest China. Plateau Mt. Meteorol. Res. 2010, 30, 35–40. [Google Scholar]
  41. Wright, T.J.; Greene, V.W.; Paulus, H.J. Viable microorganisms in an urban atmosphere. J. Air Pollut. Control Assoc. 1969, 19, 337. [Google Scholar] [CrossRef] [PubMed]
  42. Linus, S.; Åsa, E. Chemical Diversity between Three Graminoid Plants Found in Western Kenya Analyzed by Headspace Solid-Phase Microextraction Gas Chromatography–Mass Spectrometry (HS-SPME-GC-MS). Plants 2021, 10, 2423. [Google Scholar]
  43. Ketterer, C.; Matzarakis, A. Human-biometeorological assessment of heat stress reduction by replanning measures in Stuttgart, Germany. Landsc. Urban Plan. 2014, 122, 78–88. [Google Scholar] [CrossRef]
  44. Zhang, Z.; Lv, Y.; Pan, H. Cooling and humidifying effect of plant communities in subtropical urban parks. Urban For. Urban Green. 2013, 12, 323–329. [Google Scholar] [CrossRef]
  45. Hsieh, C.M.; Jan, F.C.; Zhang, L. A simplified assessment of how tree allocation, wind environment, and shading affect human comfort. Urban For. Urban Green. 2016, 18, 126–137. [Google Scholar] [CrossRef]
  46. Liu, H.; Jin, G.; Wu, J.; Sun, P.; Liu, C.; Xu, C. Effects of scale and structure of urban forest in lowering air temperature and increasing humidity in summer. J. Beijing For. Univ. 2015, 37, 31–40. [Google Scholar]
  47. Wang, Y.F.; Ni, Z.B.; Peng, Y.Z.; Xia, B.C. Local variation of outdoor thermal comfort in different urban green spaces in Guangzhou, a subtropical city in South China. Urban For. Urban Green. 2018, 32, 99–112. [Google Scholar] [CrossRef]
  48. Dong, Y.; Cai, Y.; Li, C.; Wang, H.; Zhou, L.; Sun, J.; Li, C.; Song, B.; Zhou, G. Vertical thermal environment of subtropical broad-leaved urban forests and the influence of canopy structure. Build. Environ. 2022, 224, 109521. [Google Scholar] [CrossRef]
  49. Linden, F.E. Temporal variations in microclimate cooling induced by urban trees in Mainz, Germany. Urban For. Urban Green. 2016, 20, 198–209. [Google Scholar] [CrossRef]
  50. Yang, F.; Tan, J.; Zhao, Q.; Du, Z.; He, K.; Ma, Y.; Duan, F.; Zhao, Q.; Chen, G.J.A.C. Characteristics of PM2.5 speciation in representative megacities and across China. Atmos. Chem. Phys. 2011, 11, 5207–5219. [Google Scholar] [CrossRef]
  51. Chen, L.X.; Liu, C.M.; Zhang, L.; Zou, R.; Zhang, Z.Q. Variation in Tree Species Ability to Capture and Retain Airborne Fine Particulate Matter (PM2.5). Sci. Rep. 2017, 7, 3206. [Google Scholar] [CrossRef] [PubMed]
  52. Liu, J.K.; Zhai, J.X.; Zhu, L.J.; Yang, Y.L.; Liu, J.T.; Zhang, Z.M. Particle removal by vegetation: Comparison in a forest and a wetland. Environ. Sci. Pollut. R 2017, 24, 1597–1607. [Google Scholar] [CrossRef] [PubMed]
  53. Yin, S.; Chen, D.L.; Zhang, X.Y.; Yan, J.L. Review on the multi-scale interactions of urban forests and atmospheric particles: Affecting factors are scale-dependent among tree, stand and region. Urban For. Urban Green. 2022, 78, 127789. [Google Scholar] [CrossRef]
  54. Yan, X.J.; Wang, H.R.; Hou, Z.Y.; Wang, S.Y.; Zhang, D.Y.; Xu, Q.; Tokola, T. Spatial analysis of the ecological effects of negative air ions in urban vegetated areas: A case study in Maiji, China. Urban For. Urban Green. 2015, 14, 636–645. [Google Scholar] [CrossRef]
  55. Li, A.B.; Li, Q.L.; Zhou, B.Z.; Ge, X.G.; Cao, Y.H. Temporal dynamics of negative air ion concentration and its relationship with environmental factors: Results from long-term on-site monitoring. Sci. Total Environ. 2022, 832, 155057. [Google Scholar] [CrossRef]
  56. Wang, Y.F.; Ni, Z.B.; Wu, D.; Fan, C.; Lu, J.Q.; Xia, B.C. Factors influencing the concentration of negative air ions during the year in forests and urban green spaces of the Dapeng Peninsula in Shenzhen, China. J. For. Res. 2020, 31, 2537–2547. [Google Scholar] [CrossRef]
  57. Wang, H.; Wang, B.; Niu, X.; Song, Q.; Li, M.; Luo, Y.; Liang, L.; Du, P.; Peng, W. Study on the change of negative air ion concentration and its influencing factors at different spatio-temporal scales. Glob. Ecol. Conserv. 2020, 23, 1008. [Google Scholar] [CrossRef]
  58. Zhe, L. The Study on the Variation of Air Negative Oxygen Ion Content in Different Forest Parts. Master’s Thesis, Central South University of Forestry and Technology, Changsha, China, 2017. [Google Scholar]
  59. Shaffer, B.T.; Lighthart, B. Survey of Culturable Airborne Bacteria at Four Diverse Locations in Oregon: Urban, Rural, Forest, and Coastal. Microb. Ecol. 1997, 34, 167–177. [Google Scholar] [CrossRef] [PubMed]
  60. Liao, Z.N.; Xu, H.J.; Ma, J.; Li, M.; He, C.; Zhang, Q.; Xu, S. Seasonal and vegetational variations of culturable bacteria concentrations in air from urban forest parks: A case study in Hunan, China. Environ. Sci. Pollut. Res. Int. 2022, 29, 28933–28945. [Google Scholar] [CrossRef]
  61. Fang, Z.; Ouyang, Z.; Hu, L.; Wang, X.; Zheng, H.; Lin, X. Culturable airborne fungi in outdoor environments in Beijing, China. Sci. Total Environ. 2005, 350, 47–58. [Google Scholar] [CrossRef]
  62. Fang, Z.G.; Zhang, J.W.; Guo, W.J.; Lou, X.Q. Assemblages of Culturable Airborne Fungi in a Typical Urban, Tourism-driven Center of Southeast China. Aerosol Air Qual. Res. 2019, 19, 820–831. [Google Scholar] [CrossRef]
  63. Zhou, S.Y.D.; Li, H.; Giles, M.; Neilson, R.; Yang, X.R.; Su, J.Q. Microbial Flow Within an Air-Phyllosphere-Soil Continuum. Front. Microbiol. 2021, 11, 615481. [Google Scholar] [CrossRef] [PubMed]
  64. Zarraonaindia, I.; Owens, S.M.; Weisenhorn, P.; West, K.; Hampton-Marcell, J.; Lax, S.; Bokulich, N.A.; Mills, D.A.; Martin, G.; Taghavi, S.; et al. The Soil Microbiome Influences Grapevine-Associated Microbiota. MBio 2015, 6, e02527-14. [Google Scholar] [CrossRef]
  65. Jones, A.M.; Harrison, R.M. The effects of meteorological factors on atmospheric bioaerosol concentrations—A review. Sci. Total Environ. 2004, 326, 151–180. [Google Scholar] [CrossRef] [PubMed]
  66. Wu, Z.-F.; Yang, X.-R.; An, X.-L.; Ren, Y.; Su, J.-Q. Urban greenness and plant species are key factors in shaping air microbiomes and reducing airborne pathogens. Environ. Int. 2021, 153, 106539. [Google Scholar]
  67. Pali-Schöll, K.Z.I. One Health: Areas in the living environment of people and animals and their effects on allergy and asthma. Allergo J. Int. 2022, 31, 103–113. [Google Scholar] [CrossRef]
  68. Hughes, K.M.; Price, D.; Torriero, A.A.J.; Symonds, M.R.E.; Suphioglu, C. Impact of Fungal Spores on Asthma Prevalence and Hospitalization. Int. J. Mol. Sci. 2022, 23, 4313. [Google Scholar] [CrossRef]
  69. Nageen, Y.; Asemoloye, M.D.; Polme, S.; Wang, X.; Xu, S.A.; Ramteke, P.W.; Pecoraro, L. Analysis of culturable airborne fungi in outdoor environments in Tianjin, China. BMC Microbiol. 2021, 21, 134. [Google Scholar] [CrossRef] [PubMed]
  70. Bartczak, A.; Englin, J.; Pang, A. When are Forest Visits Valued the Most? An Analysis of the Seasonal Demand for Forest Recreation in Poland. Environ. Resour. Econ. 2011, 52, 249–264. [Google Scholar] [CrossRef]
  71. Meyer, M.A.; Rathmann, J.; Schulz, C. Spatially-explicit mapping of forest benefits and analysis of motivations for everyday-life’s visitors on forest pathways in urban and rural contexts. Landsc. Urban Plan. 2019, 185, 83–95. [Google Scholar] [CrossRef]
  72. Hegetschweiler, K.T.; Stride, C.B.; Fischer, C.; Ginzler, C.; Hunziker, M. Integrating recreation into National Forest Inventories-Results from a forest visitor survey in winter and summer. J. Outdoor Rec. Tour. 2022, 39, 100489. [Google Scholar] [CrossRef]
  73. Irie, Y.; Hohashi, N.; Suto, S.; Fujimoto, Y. Culturally Congruent Health Activities for the Prevention of Functional Disabilities Among Older Adults in Japan’s Forest Communities. J. Transcult. Nurs. 2021, 33, 16–25. [Google Scholar] [CrossRef] [PubMed]
  74. Kim, L.; Galbally, I.E.; Porter, N.; Weeks, I.A.; Lawson, S.J. BVOC emissions from mechanical wounding of leaves and branches of Eucalyptus sideroxylon (red ironbark). J. Atmos. Chem. 2011, 68, 265–279. [Google Scholar] [CrossRef]
  75. Zhao, F.-J.; Shu, L.-F.; Wang, Q.-H.; Wang, M.Y.; Tian, X.R. Emissions of volatile organic compounds from heated needles and twigs of Pinus pumila. J. Forest Res. Jpn. 2011, 22, 243–248. [Google Scholar] [CrossRef]
  76. Qin, X.W.; Hao, C.Y.; He, S.Z.; Wu, G.; Tan, L.H.; Xu, F.; Hu, R.S. Volatile Organic Compound Emissions from Different Stages of Cananga odorata Flower Development. Molecules 2014, 19, 8965–8980. [Google Scholar] [CrossRef] [PubMed]
  77. Li, Y.; Wan, Y.; Sun, Z.; Li, T.; Liu, X.; Ma, H.; Liu, X.; He, R.; Ma, Y.; Li, Z. Floral Scent Chemistry of Luculia yunnanensis (Rubiaceae), a Species Endemic to China with Sweetly Fragrant Flowers. Molecules 2017, 22, 879. [Google Scholar] [CrossRef]
  78. Kesselmeier, J.; Staudt, M. Biogenic Volatile Organic Compounds (VOC): An Overview on Emission, Physiology and Ecology. J. Atmos Chem. 1999, 33, 23–88. [Google Scholar] [CrossRef]
  79. Crespo, E.; Graus, M.; Gilman, J.B.; Lerner, B.M.; Fall, R.; Harren, F.J.M.; Warneke, C. Volatile organic compound emissions from elephant grass and bamboo cultivars used as potential bioethanol crop. Atmos. Environ. 2013, 65, 61–68. [Google Scholar] [CrossRef]
  80. Song, X.H.; Li, H.; Li, C.R.; Xu, J.W.; Hu, D.M. Effects of VOCs from leaves of Acer truncatum Bunge and Cedrus deodara on human physiology and psychology. Urban For. Urban Green. 2016, 19, 29–34. [Google Scholar] [CrossRef]
  81. Loreto, F.; Schnitzler, J.P. Abiotic stresses and induced BVOCs. Trends Plant Sci. 2010, 15, 154–166. [Google Scholar] [CrossRef]
  82. Feng, Z.Z.; Yuan, X.Y.; Fares, S.; Loreto, F.; Li, P.; Hoshika, Y.; Paoletti, E. Isoprene is more affected by climate drivers than monoterpenes: A meta-analytic review on plant isoprenoid emissions. Plant Cell Environ. 2019, 42, 1939–1949. [Google Scholar] [CrossRef]
  83. Guo, M.; Hu, Z.Q.; Strong, P.J.; Smit, A.M.; Xu, J.W.; Fan, J.; Wang, H.L. Evaluating the Environmental Health Effect of Bamboo-Derived Volatile Organic Compounds through Analysis the Metabolic Indices of the Disorder Animal Model. Biomed. Environ. Sci. 2015, 28, 595–605. [Google Scholar] [CrossRef]
  84. Huang, Y.X.; Zhang, Y.M.; Qi, Y.; Yu, Y.L.; Yu, W.J. Identification of odorous constituents of bamboo during thermal treatment. Constr. Build. Mater. 2019, 203, 104–110. [Google Scholar] [CrossRef]
  85. Wang, Q.; Wang, C.; Zhang, Z.; Duan, M.; Ren, B.; Dai, Z. Diurnal Variation of Volatile Organic Compounds in Recreational Forests and Its Relationship with Microclimate Factors. Landsc. Res. 2019, 11, 4. [Google Scholar]
  86. Tokumo, K.; Tamura, N.; Hirai, T.; Nishio, H. Effects of (Z)-3-hexenol, a major component of green odor, on anxiety-related behavior of the mouse in an elevated plus-maze test and biogenic amines and their metabolites in the brain. Behav. Brain Res. 2006, 166, 247–252. [Google Scholar] [CrossRef] [PubMed]
  87. Mcrae, J.F.; Mainland, J.D.; Jaeger, S.R.; Adipietro, K.A.; Matsunami, H.; Newcomb, R.D. Genetic Variation in the Odorant Receptor OR2J3 Is Associated with the Ability to Detect the “Grassy” Smelling Odor, cis-3-hexen-1-ol. Chem. Senses 2012, 37, 585–593. [Google Scholar] [CrossRef]
  88. Sano, K.; Tsuda, Y.; Sugano, H.; Aou, S.; Hatanaka, A. Concentration Effects of Green Odor on Event-related Potential (P300) and Pleasantness. Chem. Senses 2002, 27, 225–230. [Google Scholar] [CrossRef] [PubMed]
  89. Roviello, V.; Roviello, G.N. Less COVID-19 deaths in southern and insular Italy explained by forest bathing, Mediterranean environment, and antiviral plant volatile organic compounds. Environ. Chem. Lett. 2022, 20, 7–17. [Google Scholar] [CrossRef] [PubMed]
Figure 1. The location and the bamboo forests: (A) Neosinocalamus affinis forest; (B) Dendrocalamus latiflorus forest.
Forests 14 01894 g001
Figure 2. Diurnal variation in thermal comfort in four seasons in two bamboo forests: (NA) Neosinocalamus affinis forest; (DL) Dendrocalamus latiflorus forest.
Forests 14 01894 g002
Figure 3. Seasonal variation in air cleanliness in two kinds of clustered bamboo forests: (A) concentration of total suspended particulate; (B) concentration of coarse particulate matter; (C) concentration of fine particulate matter; (D) concentration of negative air oxygen ion; (E) concentration of airborne bacteria; (F) concentration of airborne fungi. (NA) Neosinocalamus affinis forest; (DL) Dendrocalamus latiflorus forest. Different letters indicate that there are significant differences in different seasons of the same kind of bamboo, and different numbers indicate that there are significant differences in different places in the same season.
Forests 14 01894 g003aForests 14 01894 g003b
Figure 4. Diurnal variation in PM2.5 in four seasons in two kinds of clustered bamboo forests: (A) spring; (B) summer; (C) autumn; (D) winter; (PM2.5) fine particulate matter concentration; (NA) Neosinocalamus affinis forest; (DL) Dendrocalamus latiflorus forest. The red line is the primary concentration limits of PM2.5 concentration in the recreation area.
Forests 14 01894 g004
Figure 5. Diurnal changes in the NAI concentrations in four seasons in two kinds of clustered bamboo forests: (A) spring; (B) summer; (C) autumn; (D) winter; (NAI) negative air oxygen ion concentration; (NA) Neosinocalamus affinis forest; (DL) Dendrocalamus latiflorus forest. The red line shows the minimum standard required by the WHO for the concentration of negative oxygen ions in fresh air.
Forests 14 01894 g005
Figure 6. Composition of volatiles of the two bamboo species in four seasons: (NA) Neosinocalamus affinis forest; (DL) Dendrocalamus latiflorus forest.
Forests 14 01894 g006
Figure 7. Comparison of the main volatiles of the two species of bamboo in different seasons: (A) spring; (B) summer; (C) autumn; (D) winter; (NA) Neosinocalamus affinis forest; (DL) Dendrocalamus latiflorus forest.
Forests 14 01894 g007
Disclaimer/Publisher’s Note: The statements, opinions and data contained in all publications are solely those of the individual author(s) and contributor(s) and not of MDPI and/or the editor(s). MDPI and/or the editor(s) disclaim responsibility for any injury to people or property resulting from any ideas, methods, instructions or products referred to in the content.

