Article

Detection of Tree Species in Beijing Plain Afforestation Project Using Satellite Sensors and Machine Learning Algorithms

Beijing Key Laboratory for Forest Pest Control, Beijing Forestry University, Beijing 100083, China
*
Authors to whom correspondence should be addressed.
Forests 2023, 14(9), 1889; https://doi.org/10.3390/f14091889
Submission received: 10 August 2023 / Revised: 7 September 2023 / Accepted: 15 September 2023 / Published: 17 September 2023
(This article belongs to the Special Issue Mapping Forest Vegetation via Remote Sensing Tools)

Abstract

:
Mapping tree species distributions in urban areas is significant for managing afforestation plans and pest infestations but can be challenging over large areas. This research compared the classification accuracy of three data sources and three machine learning algorithm combinations. It evaluated the cost benefit of various combinations by mapping the species distribution of the Beijing Plain Afforestation Project with a three-level hierarchical approach. First, vegetation and non-vegetation were mapped. Then, tree crowns were extracted from the vegetation mask. Finally, Decision Tree (DT), Support Vector Machines (SVM), and Random Forest (RF) were applied to the three data sources: Pléiades-1B, WorldView-2, and Sentinel-2. The tree species classification was based on the original bands and spectral and texture indices. Sentinel-2 performed well at the stand level, with an overall accuracy of 89.29%. WorldView-2 was significantly better than Pléiades-1 at the single-tree identification level. The combination of WorldView-2 and SVM achieved the best classification result, with an overall accuracy of 90.91%. This research concludes that the low-resolution Sentinel-2 sensor can accurately map tree areas while performing satisfactorily in classifying pure forests. For mixed forests, on the other hand, WorldView-2 and Pléiades-1, which have higher resolutions, are needed for single-tree scale classification. Compared to Pléiades-1, WorldView-2 produced higher classification accuracy. In addition, this study combines algorithm comparison to provide further reference and guidance for plantation forest classification.

1. Introduction

Forests are one of the most important components of terrestrial ecosystems, accounting for one third of the global land area and playing an indispensable role in regulating the world’s climate. Urban forests play an important role in increasing urban biodiversity [1], reducing carbon emissions [2], beautifying landscapes, and regulating the local climate [3]. The rapid growth of Beijing’s population and economy in the past 30 years has resulted in an unprecedented threat to the safety and health of its environment. Built-up areas have led to the reduction in vegetation and the decline of ecosystem functions, further reducing the biodiversity of Beijing. The growth of industry and winter heating has led to a more significant urban heat island effect, resulting in a further increase in carbon emissions. The Beijing municipal government has carried out the “One Million-Mu Plain Afforestation Project” to meet the public’s demand for forests since 2012 [3]. By 2021, 70,711 hectares of artificial forests have been planted in two rounds of afforestation plans [4]. These forests can control pollution, reduce wind speed, control dust, and decline the urban heat island effect positively [5].
However, insufficient maintenance, unsuitable tree species [6], diseases and pests [7], and other events during the project implementation have resulted in the death of some originally planted trees. Some of the original trees were replaced by new plantings of other species under this management mode; tree species composition has gradually grown in complexity and the planted forest has changed from blocks of homogenous trees to a highly complex mixed forest. Therefore, the original tree species distribution map has become outdated, complicating management, maintenance, and planning. However, a detailed ground survey would be too onerous in terms of cost, workload, and efficiency due to the large area of forest land involved. Therefore, it is urgent to obtain an effective method to compile an updated “Beijing Plain Afforestation Project” tree map.
Over the past 40 years, remote sensing has become an efficient, accurate, and repeatable monitoring method for large-scale plantations and has been widely used in forest monitoring. Although unmanned aerial vehicles (UAV) can carry a variety of sensors with high spatial and spectral resolutions and provide high accuracy in the tree species classification [8], they are too expensive to be used for large areas. Beijing’s newly planted forest land requires the most cost-effective tree species classification method [3]. Low- and medium-resolution satellite data sources play an important role in large-scale forestry remote sensing with low cost and more bands. Sentinel-2, Landsat 8, and Indian Remote Sensing (IRS) satellite images were used to classify tree species in forests in Iran [9]. Sentinel-2 data have also been used for mapping leaf chlorophyll content [10], mapping forest canopy cover [11], mapping a national-scale vegetation map [12], and forest growth inventory predictions [13,14]. Grabska et al. have suggested using Sentinel-2 images to map tree species in Poland’s complex mixed forests of the Carpathian mountains. The results showed that the addition shortwave infrared (SWIR) band of Sentinel-2 played an important role in the classification [15]. However, the resolution of Sentinel-2 is 10–60 m, which is larger than the size of a single tree crown, making it difficult to classify tree species at the individual tree level. Wang et al. used Pléiades-1 to map mangrove ranges and their species [15,16]. Adelabu and Dube used QuickBird data and Random Forest (RF) to distinguish five tree species in the southern African woodlands [17]. Hobi and Ginzler used Pléiades-1 and RF to draw the distribution map of mangroves’ main species, with an accuracy of about 80% [18]. R. Lottering and O. Mutanga identified an appropriate spatial resolution for discriminating forest vegetation at the subspecies level using a WorldView-2 image [19].
The algorithm is also important to classify and identify the tree species. In recent years, many machine learning algorithms have been used for classification. Zhou et al. used RF to classify emerald ash borer infestations and achieved good results [7]. Support Vector Machines (SVM) were used to distinguish urban forest types [20] and map burned forest areas [21,22]. Decision Tree (DT) algorithms have been widely applied in mangrove classification [23] and in mapping other tree species distributions [24].
This paper compared the performance of SVM, RF, and DT machine learning algorithms for tree species recognition. When comparing the potential of remote sensing data in mapping and evaluating forests, most studies focus on specific scales, such as the scope, geographic distribution, or species of artificial forests. However, the distribution range and species distribution of artificial forests are important for forest monitoring and management [24]. According to the overall distribution of pure forest patches and the high mixing degree of some woodlands, this study classified the same artificial forest at different levels. Two high-resolution satellite images (Pléiades-1 and WorldView-2) were selected to classify tree species at the single-tree level and one medium-resolution satellite image (Sentinel-2) was selected to classify tree species at the stand level. We hypothesized that (1) compared to Pléiades-1, the additional bands of WorldView-2 significantly improve the classification performance and that (2) open-source Sentinel-2 data sources are suitable for classifying forests with a low degree of mixing.

2. Materials and Methods
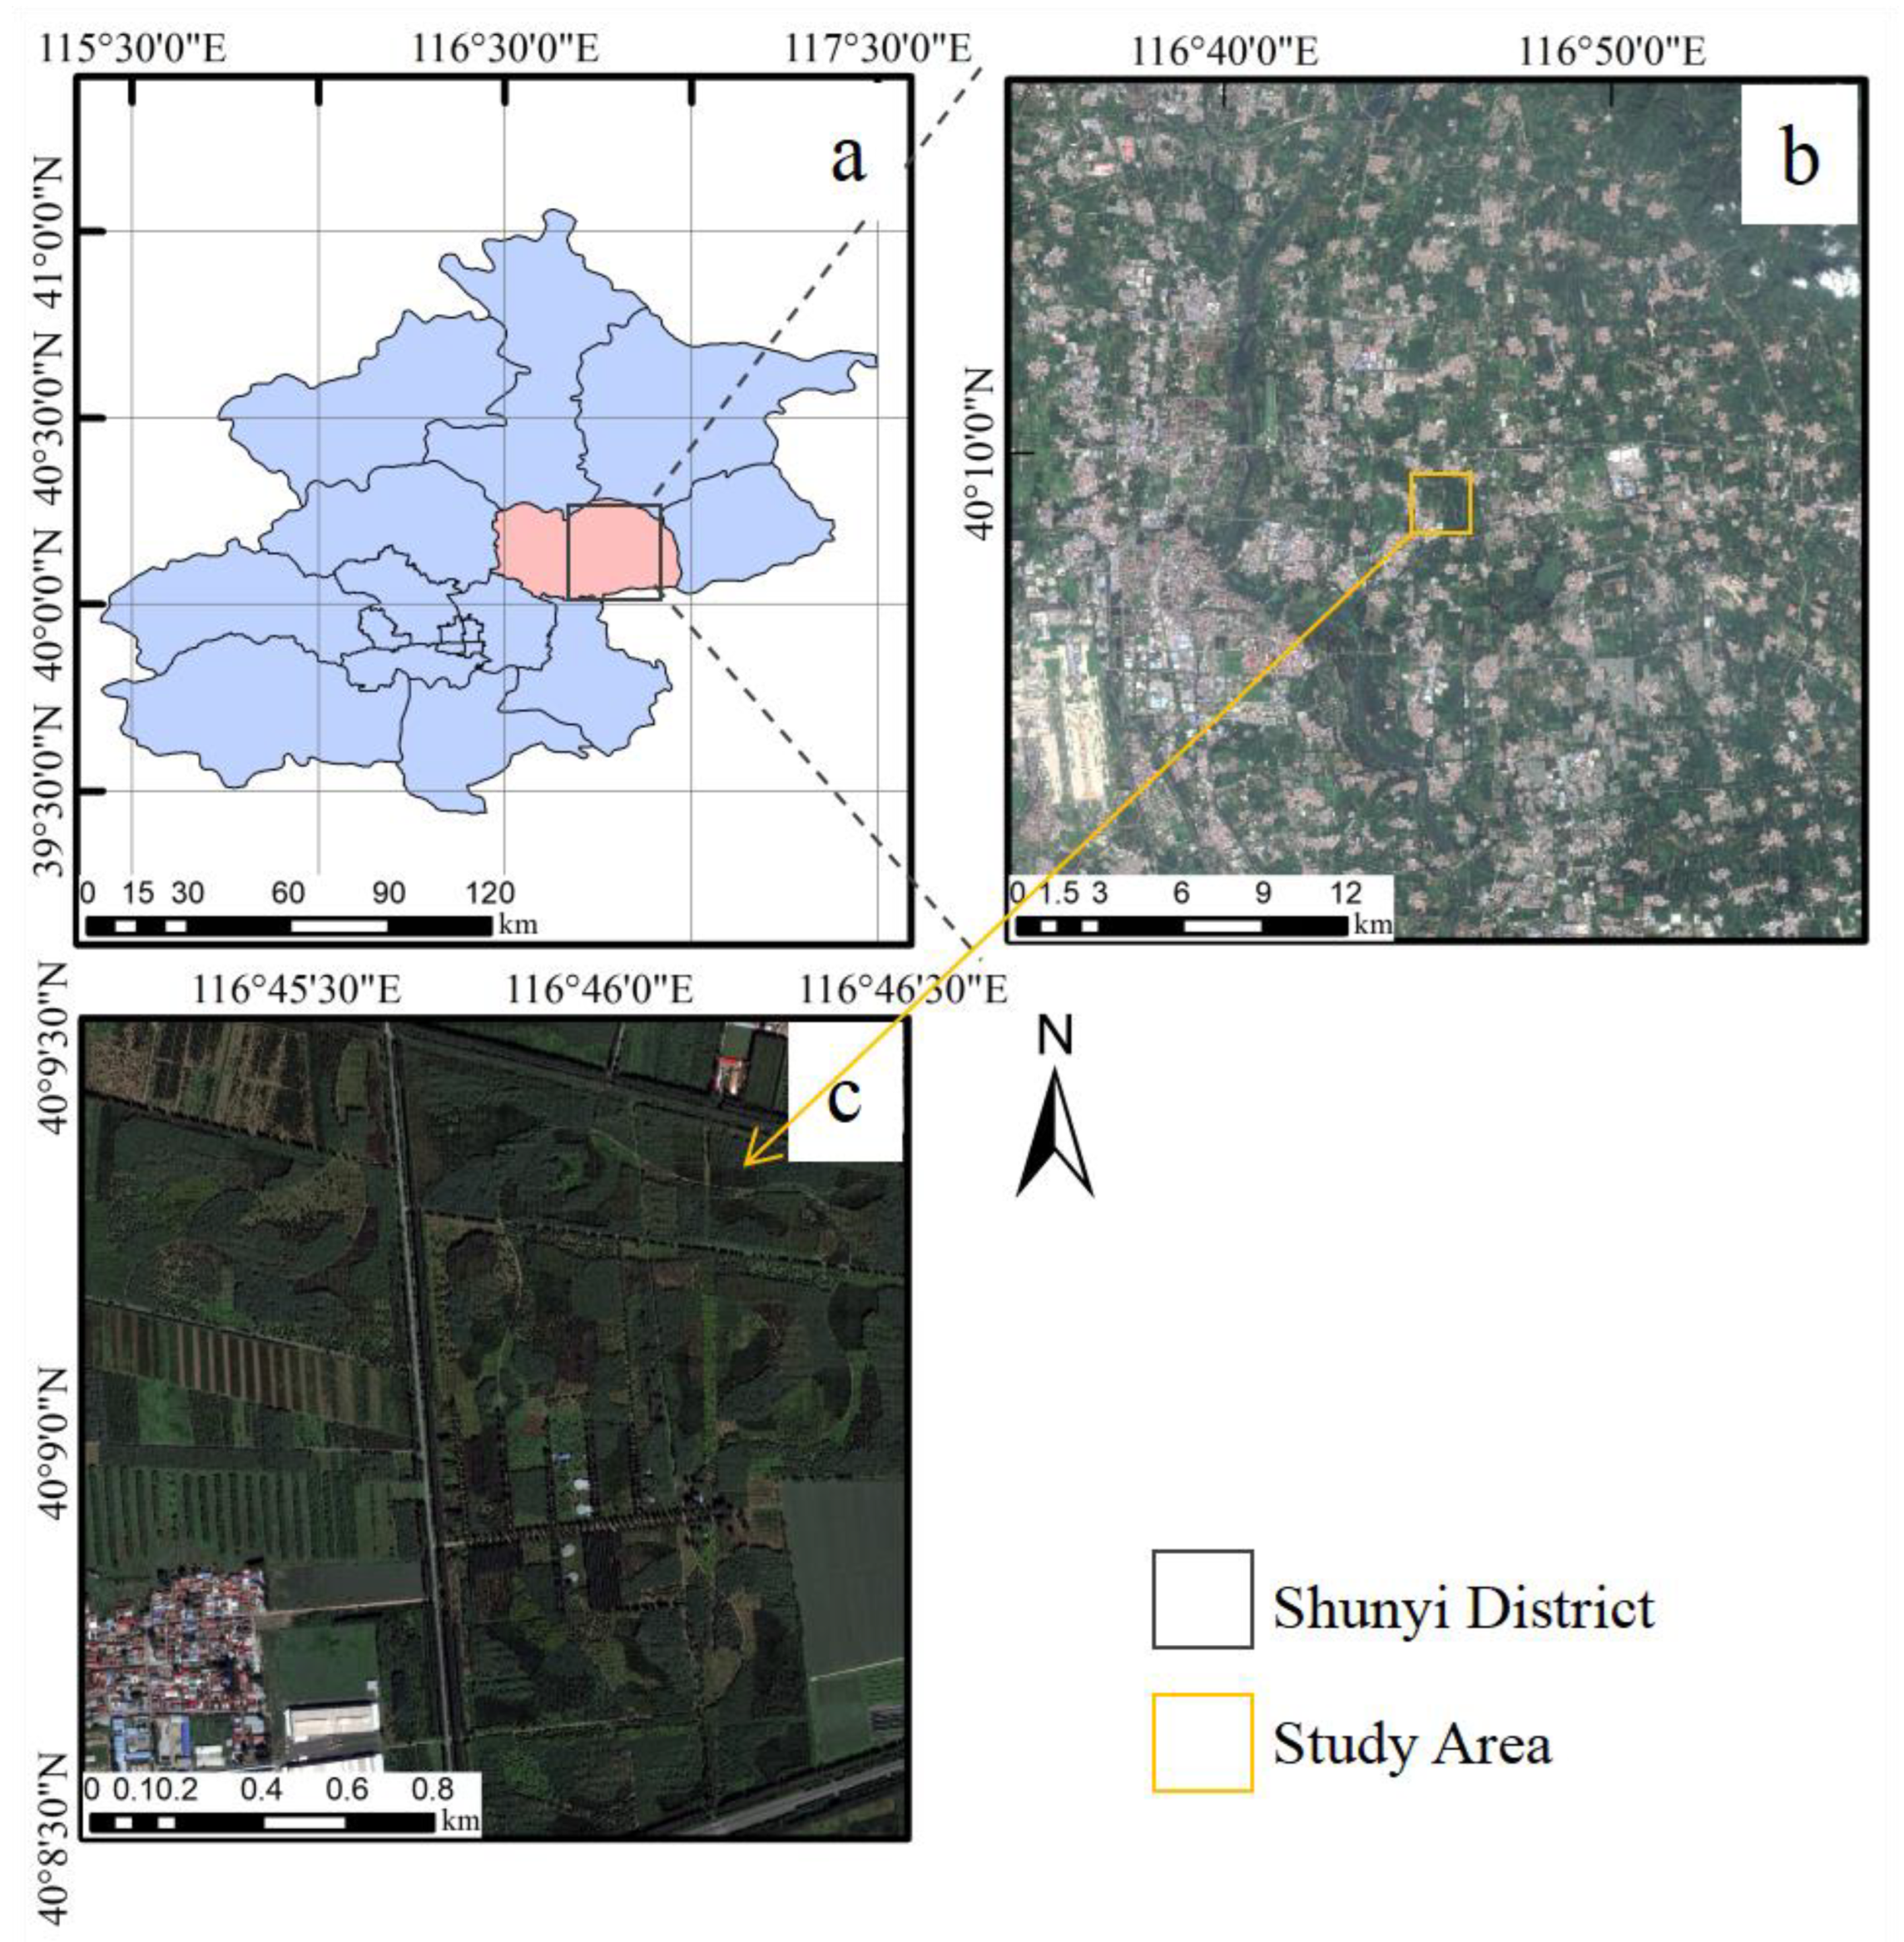
2.1. Study Area

The study area (Figure 1) is located to the east of Beijing (116°45′ N, 40°9′ E) and covers an area of approximately 200 hectares. The region has a semi-humid continental monsoon climate in the north temperate zone, with an annual average temperature of 12 °C and an annual average precipitation of 626 mm. Precipitation is mostly concentrated from June to August, accounting for more than 70% of the annual total. The study area was farmland with flat terrain before afforestation began. Most of the trees planted were able to adapt to the climate of Beijing. However, for example, pests and diseases caused some species in plantations to be replaced to varying degrees by new species. This has led to a more complex species composition in some stands, creating unknown mixed stands whose species composition needs to be understood.

2.2. Field Survey

An extensive field survey was conducted in the study area from August to October 2021. The composition and distribution of tree species were recorded by real-time kinematic GPS. The distribution of tree species in the study area was further investigated in June 2022 to verify that no extensive tree mortality had occurred since the first survey. A total of 222 stands, including 18 species, were investigated in the two surveys. The study focused on ten dominant tree species encountered in most sampling sites. Due to the small proportion of some other species, they were not classified in this study. This study classified eleven tree species (Table A1), including Styphnolobium japonicum, Platanus acerifolia, Koelreuteria paniculata, Pinus tabuliformis, Salix matsudana, Prunus davidiana, Populus tomentosa, Ginkgo biloba, Fraxinus americana, Prunus cerasifera ‘Atropurpurea’, and Eucommia ulmoide.

2.3. Remote Sensing Data and Pre-Processing

2.3.1. High-Resolution Satellite Image Pre-Processing

The Pléiades-1 satellite can simultaneously acquire 0.5-m panchromatic and 2-m multispectral images with four multispectral bands (red, green, blue, and near infrared) (Table 1). WorldView-2, launched on 6th October 2009, by DigitalGlobe Inc. (Longmont, CO, USA), is the first high-resolution satellite with eight multispectral bands (Table 1). In addition to the four traditional multispectral bands (red, green, blue, and near infrared), it also has newly added coastline, yellow, red edge, and near-infrared bands. We used a digital elevation model (DEM) to correct the WorldView-2 image orthophoto and projected it to the WGS 84 coordinate system. The images were atmospherically corrected to the top of atmosphere reflectance using the FLAASH (Fast Line-of-Sight Atmospheric Analysis of the Spectral Hypercube) model in ENVI 5.3 (Figure 2).

2.3.2. Sentinel-2 Image Pre-Processing

Sentinel-2 images have 13 multispectral bands, including three red edge bands, four traditional bands (red, green, blue and near infrared) have a spatial resolution of 10 m (Table 1). Sentinel-2 satellite image (Level-1C), which is orthophoto corrected and top of the atmospheric reflectance, was downloaded from the Sentinel Scientific Data Hub (https://scihub.copernicus.eu/dhus/#/home, accessed on 11 May 2022) of the European Space Agency’s (ESA). We processed the acquired Level-1C image and obtained bottom-of-atmosphere Level-2A products by using the sen2cor atmospheric correction processor within the SNAP software (2.4.0) [25]. All the coarser resolution bands of Sentinel-2 were resampled to a 10-m spatial resolution image stack using the nearest neighbor method.

2.4. Data Processing

The tree species composition of an artificial forest can be divided into three classification levels: landscape, vegetation cover types, and tree species community [16]. The former level contains the content of the sub-level, while objects at the same level have a neighborhood relationship. An object-based analysis method is used to identify the hierarchical structure. The entire classification process includes image segmentation and object classification.
The images were segmented before classification. Pléiades-1 and WorldView-2 were segmented using the multiresolution segmentation in eCognition Developer 9.0. Based on the size of the forest canopy, the multiresolution segmentation scale was set to 20 (shape: 0.4, compactness: 0.5). Images were divided into several spectrally homogeneous groups of objects and pixels, reducing intersubjective spectral differences and increasing the difference in classification between species. The Sentinel-2 image with lower spatial resolution was segmented into one-pixel objects. The multi-resolution segmentation was replaced by the chessboard segmentation.

2.4.1. Level 1 Classification: Vegetation Extraction

The first-level classification was used to make a vegetation mask. Following the segmentation, a classification was performed using the Normalized Difference Vegetation Index (NDVI), calculated as [26]:
NDVI = (NIR − R)/(NIR + R)
Different data sources have different spectral characteristics due to the influence of collection time and collection weather, so different NDVI values were chosen for the three data sources as the boundary to distinguish vegetation from non-vegetation and we used histograms to find the optimal threshold for vegetation extraction. The values of Sentinel-2, WorldView-2, and Pléiades-1 were 0.25, 0.39, and 0.35, respectively. Objects with NDVI values greater than this threshold were determined to be vegetated and those outside were determined to be non-vegetated. After establishing vegetation and non-vegetation classification in the first level of classification, the next level of classification ensues.

2.4.2. Level 2 Classification: Forest Extraction

The vegetation mask derived from level 1 was divided into forest and non-forest in the level 2 classification. In this study, 5 samples were selected for each tree species, with a total of 50 training samples from 10 tree species. There are a total of 30 training samples in non-forest, including three types: shrubs, grasslands, and crops, each with 10 samples. Then, we used SVM to distinguish between forests and non-forests based on 80 training samples. After forest extraction, the accuracy of vegetation classification was verified by using 400 random verification samples in ArcMap.

2.4.3. Level 3 Classification: Species Identification

In the level 3 classification, we used three machine learning algorithms: DT, SVM, and RF to classify the tree species.
The Decision Tree (DT) algorithm is a typical classification method to approximate discrete function values. First, the data are processed and the readable rules and DT are generated by the algorithm. Then, the new data are analyzed by the DT [27].
Support Vector Machines (SVM) [28] are based on the Vapnik–Chervonenkis theory and the structural risk minimization principle. The SVM algorithm makes a trade-off between minimizing the training set error and maximizing the margin to obtain the best generalization ability and avoid overfitting [29]. Due to its advantages, SVM has been applied to a wide range of classification tasks.
Random Forest (RF) classification is an integrated machine learning algorithm that combines multiple DT for supervised classification and averages the class assignment probabilities of all spanning trees to obtain the final results [30]. The RF can process data of very high dimensions (the data of many features). In addition, RF could provide the importance of each feature and reduce the overfitting phenomenon to a certain extent [31].
Table 2 shows different classification features selected for different images, including three satellite images’ raw spectral bands and several different types of spectral indices, such as NDVI and enhanced vegetation index (EVI). Due to the different crown shapes and planting densities of trees in different species, the gray level co-occurrence matrix (GLCM) [32] of different bands was extracted for further screening as features. This study selected eight texture features: mean, variance, homogeneity, contrast, dissimilarity, entropy, second moment, and correlation for tree species classification.
The assessment of variable importance is useful when using high-dimensional datasets, as an excess of eigenfactors can lead to overfitting of models. Therefore, selecting the most important eigenfactors for classification results in higher classification accuracy than using all of them [33]. Factors that simultaneously remove superfluous features, creating a sparse subset of classifications, are beneficial for reducing the operational volume [34]. Therefore, an RF model was used to rank the importance of features using all the parameters; the top 20 classified features in terms of importance were selected for the construction of tree seed classifiers. Finally, the parameters of the three machine learning models are adjusted and the classification results are evaluated.
Combined with the ground data, 700 tree canopies from 10 different types of planted forests were selected in the Pléiades-1 and WorldView-2 images and 700 pure forest pixels were selected from the Sentinel-2 image to serve as the training and validation sets. Seventy objects were selected for each of the ten classes, of which 60% were used in the training set and 40% were used for accuracy validation. The confusion or error matrix, kappa coefficient, and overall precision were calculated to compare the accuracies of the different approaches. Kappa precision assesses the performance of the classification compared with randomly assigned values. Overall accuracy is the ratio of correctly classified subjects expressed as a percentage of all validated subjects. The DT, SVM, and RF classification models were built in the DecisionTreeClassifier, SVM, and RandomForestClassifier function in Python v3.9.12 with the package ‘sklearn’, while the parameters were kept at their default values.

3. Results

3.1. Vegetation Extraction and Forest Extraction

The mapped vegetation extents generated from Pléiades-1, WorldView-2, and Sentinel-2 images were all satisfactory (Figure 3). The high-resolution Pléiades-1 and WorldView-2 images distinguished the vegetation edges well, such as narrow roads and bare patches of land within the forests; however, those of the Sentinel-2 data remained a little fuzzy.
The overall accuracies of the level 2 classification from Pléiades-1, WorldView-2, and Sentinel-2 (Figure 3) were 95.25%, 97.75%, and 98.00%, respectively (Table 3). The user’s accuracies of Sentinel-2 and WorldView-2 data were better, both above 93%, and the user’s accuracy of non-forest vegetation using Pléiades-1 was the lowest (86.07%). In the Pléiades-1 image, 5.80% of forests were classified as non-forest.

3.2. Spectral Curves of Tree Species

The spectral reflectance of stand-level pixels were extracted from Sentinel-2 data and are shown in Figure 4c, where the different tree species show large variations at 833 nm, 1610.4 nm, and smaller differences at 1376.9 nm.
The spectral reflectance of individual trees extracted from Pléiades-1 and WorldView-2 data is shown in Figure 4a,b. The spectral curves of P. cerasifera ‘Atropurpurea’, E. ulmoide, and P. tabuliformis in both data sources exhibit large differences from other tree species. In Pléiades-1, the spectral differences of the four trees, S. matsudana, K. paniculata, and F. pennsylvanica, are relatively small, while in the WorldView-2 image, the spectral differences of the four trees, S. matsudana, K. paniculata, and F. pennsylvanica, have large differences in the 607.8 nm, 723.7 nm, and 908 nm bands.

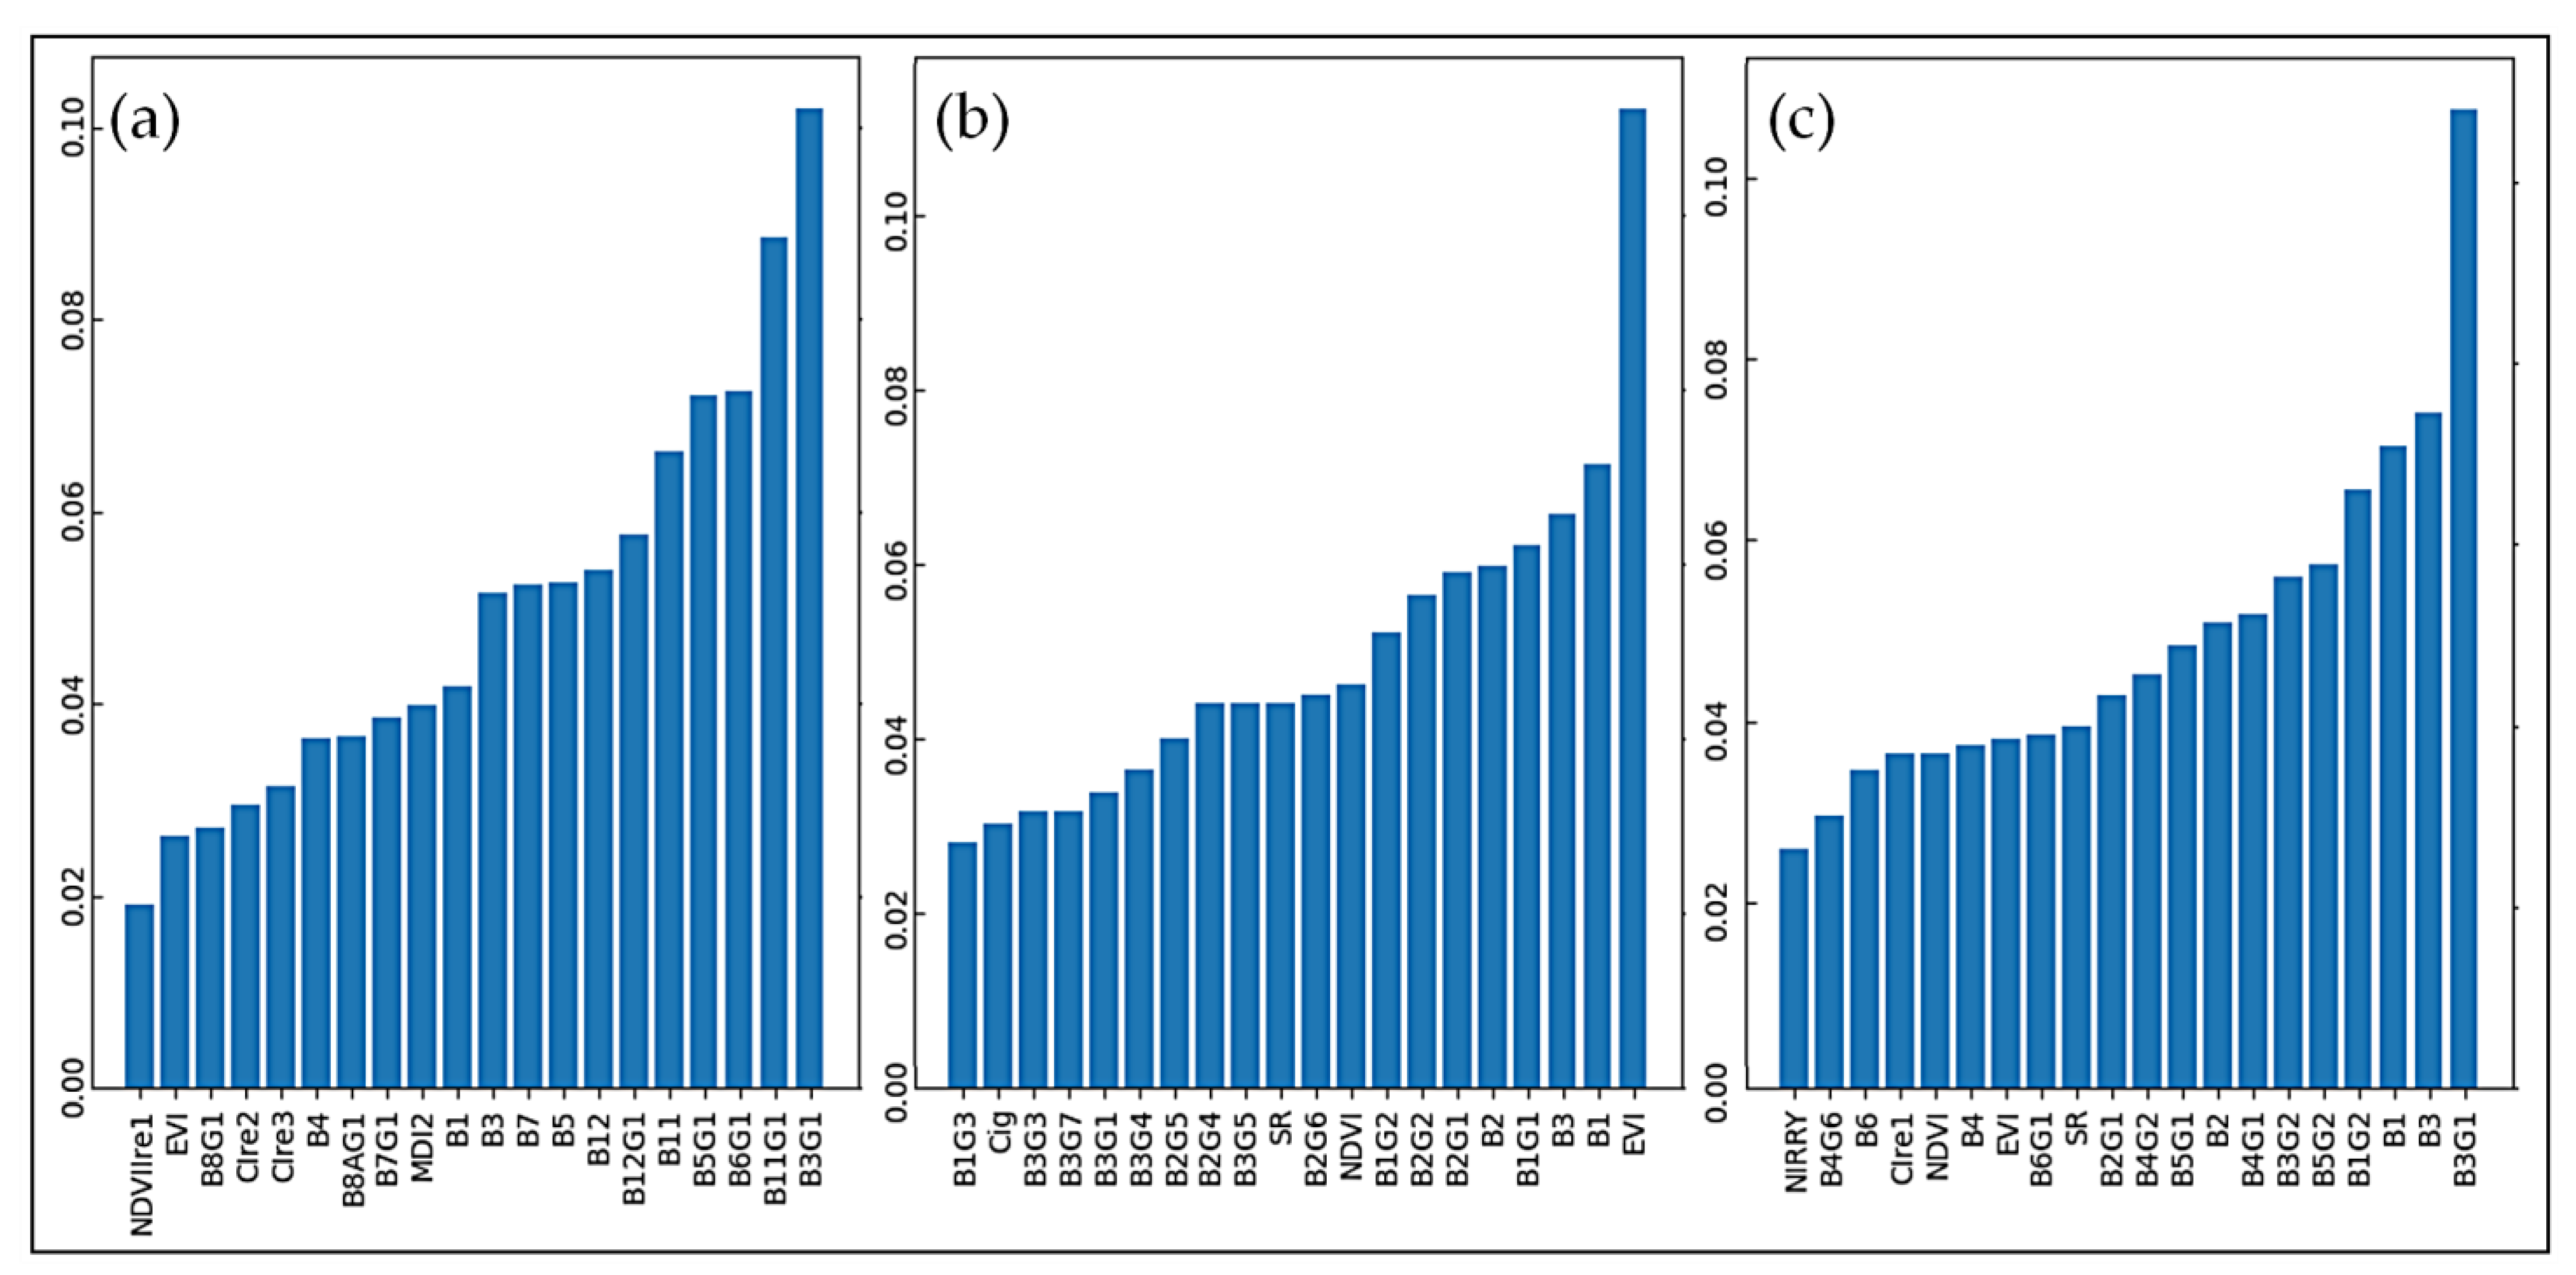
3.3. Feature Importance

After classifying the combination of three different data sources with RF, 20 features with the highest importance were selected for feature analysis (Figure 5). At the stand level, using 770 samples from the Sentinel-2 data source, the top 20 feature parameters were selected using the RF algorithm for sensitive feature screening (Figure 5). Among them, the GLCM mean, which is derived extremely from the green, shortwave infrared, and red edge primitive bands, has a high contribution value to the classification.
On a single-tree level, among the classifiers based on Pléiades-1 images, the EVI was the most important feature; original bands and the blue GLCM mean were relatively important. Among the 13 GLCM features, the GLCM mean was the most important feature. In the classification of WorldView-2 and RF, the top five features were the green GLCM mean; green, coastal, and coastal GLCM Variance; and red GLCM Variance.

3.4. Results of Tree Species Classification

3.4.1. Accuracy Analysis

In this study, the above 20 features were used to participate in the construction of tree classifiers based on three algorithms: DT, SVM, and RF to obtain the validated classification results of Sentinel-2 (Table 4). RF achieved the best classification results (OA = 89.29% and Kappa = 0.88) followed by SVM (OA = 85.39% and Kappa = 0.84), while DT had the lowest classification accuracy (OA = 83.44% and Kappa = 0.82). At the same time, this study mapped the distribution of tree species based on the classification results of RF. In terms of user accuracy, P. tabuliformis, S. matsudana, P. tomentosa, and E. ulmoide obtained better classification results in all three algorithms (UA > 96%). RF and SVM classified F. pennsylvanica better (UA > 96%) while DT failed to discriminate it well (PA = 75.00% and UA = 87.50%).
In the single-tree level validation results, the highest overall classification accuracy was achieved by the WorldView-2 in combination with SVM (Figure 6). In the comparison of data sources, the WorldView-2 data source has higher accuracy than Pléiades-1. In the comparison of classification algorithms, SVM achieved the highest overall classification accuracy (OA = 82.79%, 90.91%), RF had a slightly lower accuracy (OA = 78.90%, 90.26%), and DT had the lowest accuracy (OA = 72.08%, 85.39%). Also, using user accuracy as a criterion, in the classification results based on the Pléiades-1 data source, P. tabuliformis, P. davidiana, P. cerasifera ‘Atropurpurea’, and E. ulmoide were better classified; in the classification results based on the WorldView-2 data source, P. tabuliformis, P. tomentosa, G. biloba, P. cerasifera ‘Atropurpurea’, and E. ulmoide were better classified.

3.4.2. Mapping of Tree Species

Based on the model established above, the classification combination of a Sentinel-e2 data source and RF was used to map the distribution of tree species at the stand level (Figure 7a). It can be observed that the pure forest stands with large areas can be roughly delineated. However, the boundaries of narrowly shaped stands cannot be clearly mapped and stands with a high degree of mixing cannot be accurately differentiated. Therefore, this study further divided the tree species distribution map on the single-tree level. In this study, we selected three forest plots with a high degree of intermixing, containing seven major tree species; drew species distribution maps based on WorldView-2 images combined with SVM; and then, drew species distribution maps at the single-tree level for the three mixed forests (Figure 7b–d).

4. Discussion

4.1. Comparison of Machine Learning Algorithms

Among the three machine learning algorithms selected for this experiment, RF achieved the best classification results in the Sentinel-2 data source (OA = 89.29% and Kappa = 0.88), similar to the findings of Lim et al. [40]. The overall accuracy was slightly better than that of SVM, which can be partly attributed to the larger number of spectral features available for RF to perform feature filtering in Sentinel-2. Compared with other advanced machine learning algorithms, such as SVM, RF was more stable in the change in segmentation ratio, the selection of object features and parameter configuration [41]. RF has a strong generalization ability and can quantitatively measure the importance of the input features, which can be used to optimize the feature space. The correlation between individual trees would become higher, resulting in the weak generalization ability of the RF model. Not all characteristics were related to tree species classification [42].
Whereas SVM achieved higher classification results in WorldView-2 (OA = 90.91%, Kappa = 0.90), Pléiades-1 (OA = 82.79%, Kappa = 0.81) data sources achieved high classification accuracy. The final decision function of SVM is determined by a small number of support vectors. In SVM, the computational complexity depends on the number of support vectors rather than the dimension of the sample space. Therefore, the “dimensionality catastrophe” can be avoided to a certain extent [43]. In this study, by the enhancement effect of different algorithms on the classification results, the classification accuracies enhanced by RF over SVM are 3.90%, −0.65%, and −3.89% in Sentinel-2, WorldView-2, and Pléiades-1, respectively, which has the same decreasing trend with the number of bands contained in the three data sources. This coincides with the feature that supports vector function and can achieve better classification accuracy using fewer features; whereas, the RF algorithm is good at dealing with larger datasets [40,42].

4.2. Potential of Sentinel-2 for Tree Extraction and Classification in Artificial Forests

This study showed that Sentinel-2 performs well in image analysis of all three levels. Based on Sentinel 2, it is possible to perform better extraction of vegetation and trees with high accuracy. It can be obviously seen from the visual interpretation of the classification results that Sentinel-2 does not distinguish the edge of the artificial forest and the forest road well (Figure 3). According to the field survey data, the road width is within 15 m and is covered by tree crowns. Bjerreskov et al. also used Sentinel-2 to classify Danish forests but incurred the same problem [44]. There was a small gap between the estimated and the actual forest roads.
The three-level classification of tree species showed that the classifier combined with RF produced the best classification accuracy compared to the combination with SVM or DT. In the Beijing Plain Afforestation Project, each forest patch is much larger than the footprint of a single pixel of Sentinel-2. Therefore, the Sentinel-2 pixels extracted in the image have high homogeneity and more spectral bands, which were very conducive to their classification, resulting in better performance in terms of tree species classification. Generating a spectral index and texture features produces more available features, which may be an important reason for its good classification performance. This is consistent with the results of Grabska et al. [45]. Among the top 10 most important features, 7 features are unique to the Sentinel-2 images. The additional band 11 (SWIR) and the GLCM mean feature generated by its corresponding band ranked second and fifth in importance. This is clearly reflected in the spectral signature in Figure 5. These additional bands increased the usefulness of Sentinel-2 for classification and obtained good results. Of the tree classifiers combined with the three algorithms separately, SWIR and its derived GLCM mean were the key classification features, which was an important factor contributing to the overall high accuracy of the Sentinel-2 images.
The composition and structure of tree species in the forest, as well as the types of surrounding ground cover, need to be investigated. Understanding the spectral, physical, and spatial distribution laws of different tree species and surrounding ground features is essential for establishing an effective classification framework for planted forests. A classification framework should be developed in the different forest lands to compound the actual situation. In addition, because different artificial forests were photographed with different images, the ecological characteristics, solar altitude angle, and climate are different; the same framework may not be directly transferable to other sites. The results of this study may provide a reference for similar studies using a modified or a new framework. We concluded that Sentinel-2 can be used to delineate the vegetation range and distinguish forest land from farmland [45]. However, the tree species classification still needs to be applied carefully, especially in artificial forests with a high degree of mixing.

4.3. Evaluation of Classification Accuracy at the Single-Tree Level

In terms of practical application, WorldView-2 can indeed achieve high classification accuracy [46], instead, Pléiades-1 can still obtain a tree species distribution map with certain accuracy at a lower cost.
This study evaluated the importance of different characteristics for tree species classification. At the single-tree level, WorldView-2 performed better than Pléiades-1 with all three classification algorithms due to its higher number of bands. Among the classifiers, SVM was the most accurate and the green band and its derived GLCM mean ranked highest in importance among the features used [47]. Of the first 20 features of classified based on WorldView-2, 10 were not in Pléiades-1. Fewer spectral bands of the Pléiades-1 image may limit the information extraction and affect the accuracy of the classification.
The classification accuracy of tree species in the classifier also differed [45]. At the single-tree level, leaves of P. cerasifera ‘Atropurpurea’s are purple–red and G. biloba and P. tabuliformis were gymnosperms, which were greatly different from other broad-leaved trees. The distinctive spectral and texture characteristics of these three trees made them easier to be recognized by the classifier. The S. japonicum and F. pennsylvanica leaves are both odd-pinnate and more similar in terms of crown size, color, etc., so both species were classified with lower precision in both data sources.

5. Conclusions

Based on the current research results, this paper draws the following conclusions:
(1)
In the artificial forest of the Beijing Plain Afforestation Project, the constructed three-level image classification system could meet the requirements to develop a tree species map. At the single-tree level, WorldView-2 images with higher costs could achieve better classification results, distinguishing accuracy on the ground object type and tree species, with an overall accuracy of more than 90%. Although Pléiades-1 has a lower classification accuracy, its lesser cost can also meet some of the lower accuracy requirements. The resolution of Sentinel-2 was not sufficient to classify individual trees but its good stand classification still had important application potential in terms of tree species classification;
(2)
The classification accuracies achieved by RF and SVM were similar and both were better than DT. RF applied to Sentinel-2 data was more accurate than SVM and DT in the classification of the Beijing Plain Afforestation Project at the stand level and SVM performed better in WorldView-2 and Pléiades-1 data sources at the single-tree level.
This study has provided a classification scheme of plain afforestation tree species at different levels and costs.

Author Contributions

Conceptualization, X.Z. and L.Y.; data curation, X.Z.; investigation, X.Z. and Q.Z.; methodology, X.Z. and L.Y.; resources, L.R. and Y.L.; formal analysis, X.Z. and D.W.; supervision, L.R. and Y.L.; validation, L.Y.; writing–original draft, X.Z.; writing–review and editing, L.Y., L.R. and Y.L.; project administration, Y.L. All authors have read and agreed to the published version of the manuscript.

Funding

National Key R and D Program of China (2022YFD1400400); Beijing’s Science and Technology Planning Project (Z201100008020001).

Data Availability Statement

The data presented in this study are available on request from the corresponding author. The data are not publicly available currently due to the Fundings’ requirement.

Acknowledgments

The authors would like to thank Bingtao Gao, Run Yu, Yuchen Yang, and Zhongyi Zhan for their help and advice in the study.

Conflicts of Interest

The authors declare no conflict of interest.

Appendix A

Table A1. Sample Diagram of 10 Tree Species.
Tree SpeciesEcological PhotosExamples of Satellite Imagery
Pléiades-1BWorldView-2Sentinel-2A
Styphnolobium
japonicum
Forests 14 01889 i001Forests 14 01889 i002Forests 14 01889 i003Forests 14 01889 i004
Platanus
acerifolia
Forests 14 01889 i005Forests 14 01889 i006Forests 14 01889 i007Forests 14 01889 i008
Koelreuteria
paniculata
Forests 14 01889 i009Forests 14 01889 i010Forests 14 01889 i011Forests 14 01889 i012
Pinus tabuliformisForests 14 01889 i013Forests 14 01889 i014Forests 14 01889 i015Forests 14 01889 i016
Salix
matsudana
Forests 14 01889 i017Forests 14 01889 i018Forests 14 01889 i019Forests 14 01889 i020
Prunus
davidiana
Forests 14 01889 i021Forests 14 01889 i022Forests 14 01889 i023Forests 14 01889 i024
Populus
tomentosa
Forests 14 01889 i025Forests 14 01889 i026Forests 14 01889 i027Forests 14 01889 i028
Ginkgo
biloba
Forests 14 01889 i029Forests 14 01889 i030Forests 14 01889 i031Forests 14 01889 i032
Fraxinus
americana
Forests 14 01889 i033Forests 14 01889 i034Forests 14 01889 i035Forests 14 01889 i036
Prunus
cerasifera
‘Atropurpurea’
Forests 14 01889 i037Forests 14 01889 i038Forests 14 01889 i039Forests 14 01889 i040
Eucommia ulmoideForests 14 01889 i041Forests 14 01889 i042Forests 14 01889 i043Forests 14 01889 i044

References

  1. Cao, X.; Onishi, A.; Chen, J.; Imura, H. Quantifying the Cool Island Intensity of Urban Parks Using ASTER and IKONOS Data. Landsc. Urban Plan. 2010, 96, 224–231. [Google Scholar] [CrossRef]
  2. Xiao, D.; Deng, L.; Kim, D.-G.; Huang, C.; Tian, K. Carbon Budgets of Wetland Ecosystems in China. Glob. Change Biol. 2019, 25, 2061–2076. [Google Scholar] [CrossRef] [PubMed]
  3. Hu, T.; Li, X.; Gong, P.; Yu, W.; Huang, X. Evaluating the Effect of Plain Afforestation Project and Future Spatial Suitability in Beijing. Sci. China Earth Sci. 2020, 63, 1587–1598. [Google Scholar] [CrossRef]
  4. Konijnendijk, C.C.; Ricard, R.M.; Kenney, A.; Randrup, T.B. Defining Urban Forestry—A Comparative Perspective of North America and Europe. Urban For. Urban Green. 2006, 4, 93–103. [Google Scholar] [CrossRef]
  5. Chen, W.Y.; Jim, C.Y. Assessment and Valuation of the Ecosystem Services Provided by Urban Forests. In Ecology, Planning, and Management of Urban Forests; Carreiro, M.M., Song, Y.-C., Wu, J., Eds.; Springer: New York, NY, USA, 2008; pp. 53–83. ISBN 978-0-387-71424-0. [Google Scholar]
  6. Yao, N.; Konijnendijk van den Bosch, C.C.; Yang, J.; Devisscher, T.; Wirtz, Z.; Jia, L.; Duan, J.; Ma, L. Beijing’s 50 Million New Urban Trees: Strategic Governance for Large-Scale Urban Afforestation. Urban For. Urban Green. 2019, 44, 126392. [Google Scholar] [CrossRef]
  7. Zhou, Q.; Yu, L.; Zhang, X.; Liu, Y.; Zhan, Z.; Ren, L.; Luo, Y. Fusion of UAV Hyperspectral Imaging and LiDAR for the Early Detection of EAB Stress in Ash and a New EAB Detection Index—NDVI(776,678). Remote Sens. 2022, 14, 2428. [Google Scholar] [CrossRef]
  8. Nevalainen, O.; Honkavaara, E.; Tuominen, S.; Viljanen, N.; Hakala, T.; Yu, X.; Hyyppä, J.; Saari, H.; Pölönen, I.; Imai, N.; et al. Individual Tree Detection and Classification with UAV-Based Photogrammetric Point Clouds and Hyperspectral Imaging. Remote Sens. 2017, 9, 185. [Google Scholar] [CrossRef]
  9. Soleimannejad, L.; Ullah, S.; Abedi, R.; Dees, M.; Koch, B. Evaluating the Potential of Sentinel-2, Landsat-8, and Irs Satellite Images in Tree Species Classification of Hyrcanian Forest of Iran Using Random Forest. J. Sustain. For. 2019, 38, 615–628. [Google Scholar] [CrossRef]
  10. Darvishzadeh, R.; Skidmore, A.; Abdullah, H.; Cherenet, E.; Ali, A.; Wang, T.; Nieuwenhuis, W.; Heurich, M.; Vrieling, A.; O’Connor, B.; et al. Mapping Leaf Chlorophyll Content from Sentinel-2 and RapidEye Data in Spruce Stands Using the Invertible Forest Reflectance Model. Int. J. Appl. Earth Obs. Geoinf. 2019, 79, 58–70. [Google Scholar] [CrossRef]
  11. Nasiri, V.; Darvishsefat, A.A.; Arefi, H.; Griess, V.C.; Sadeghi, S.M.M.; Borz, S.A. Modeling Forest Canopy Cover: A Synergistic Use of Sentinel-2, Aerial Photogrammetry Data, and Machine Learning. Remote Sens. 2022, 14, 1453. [Google Scholar] [CrossRef]
  12. Jin, Z.; Azzari, G.; You, C.; Di Tommaso, S.; Aston, S.; Burke, M.; Lobell, D.B. Smallholder Maize Area and Yield Mapping at National Scales with Google Earth Engine. Remote Sens. Environ. 2019, 228, 115–128. [Google Scholar] [CrossRef]
  13. Mura, M.; Bottalico, F.; Giannetti, F.; Bertani, R.; Giannini, R.; Mancini, M.; Orlandini, S.; Travaglini, D.; Chirici, G. Exploiting the Capabilities of the Sentinel-2 Multi Spectral Instrument for Predicting Growing Stock Volume in Forest Ecosystems. Int. J. Appl. Earth Obs. Geoinf. 2018, 66, 126–134. [Google Scholar] [CrossRef]
  14. Puliti, S.; Saarela, S.; Gobakken, T.; Stahl, G.; Naesset, E. Combining UAV and Sentinel-2 Auxiliary Data for Forest Growing Stock Volume Estimation through Hierarchical Model-Based Inference. Remote Sens. Environ. 2018, 204, 485–497. [Google Scholar] [CrossRef]
  15. Grabska, E.; Hostert, P.; Pflugmacher, D.; Ostapowicz, K. Forest Stand Species Mapping Using the Sentinel-2 Time Series. Remote Sens. 2019, 11, 1197. [Google Scholar] [CrossRef]
  16. Wang, D.; Wan, B.; Qiu, P.; Su, Y.; Guo, Q.; Wang, R.; Sun, F.; Wu, X. Evaluating the Performance of Sentinel-2, Landsat 8 and Pléiades-1 in Mapping Mangrove Extent and Species. Remote Sens. 2018, 10, 1468. [Google Scholar] [CrossRef]
  17. Adelabu, S.; Dube, T. Employing Ground and Satellite-Based QuickBird Data and Random Forest to Discriminate Five Tree Species in a Southern African Woodland. Geocarto Int. 2015, 30, 457–471. [Google Scholar] [CrossRef]
  18. Hobi, M.L.; Ginzler, C. Accuracy Assessment of Digital Surface Models Based on WorldView-2 and ADS80 Stereo Remote Sensing Data. Sensors 2012, 12, 6347–6368. [Google Scholar] [CrossRef]
  19. Lottering, R.; Mutanga, O. Optimizing the Spatial Resolution of WorldView-2 Imagery for Discriminating Forest Vegetation at Subspecies Level in KwaZulu-Natal, South Africa. Geocarto Int. 2016, 31, 870–880. [Google Scholar] [CrossRef]
  20. Guo, Q.; Zhang, J.; Guo, S.; Ye, Z.; Deng, H.; Hou, X.; Zhang, H. Urban Tree Classification Based on Object-Oriented Approach and Random Forest Algorithm Using Unmanned Aerial Vehicle (UAV) Multispectral Imagery. Remote Sens. 2022, 14, 3885. [Google Scholar] [CrossRef]
  21. The Potential of Göktürk 2 Satellite Images for Mapping Burnt Forest Areas. Turk. J. Agric. For. 2021, 45, 91–101. [CrossRef]
  22. Tiwari, L.K.; Sinha, S.K.; Saran, S.; Tolpekin, V.A.; Raju, P.L.N. Forest Encroachment Mapping in Baratang Island, India, Using Maximum Likelihood and Support Vector Machine Classifiers. J. Appl. Remote Sens. 2016, 10, 016016. [Google Scholar] [CrossRef]
  23. Quang, N.H.; Quinn, C.H.; Stringer, L.C.; Carrie, R.; Hackney, C.R.; Van Hue, L.T.; Van Tan, D.; Nga, P.T.T. Multi-Decadal Changes in Mangrove Extent, Age and Species in the Red River Estuaries of Viet Nam. Remote Sens. 2020, 12, 2289. [Google Scholar] [CrossRef]
  24. Xie, Z.; Chen, Y.; Lu, D.; Li, G.; Chen, E. Classification of Land Cover, Forest, and Tree Species Classes with ZiYuan-3 Multispectral and Stereo Data. Remote Sens. 2019, 11, 164. [Google Scholar] [CrossRef]
  25. Sola, I.; García-Martín, A.; Sandonís-Pozo, L.; Álvarez-Mozos, J.; Pérez-Cabello, F.; González-Audícana, M.; Montorio Llovería, R. Assessment of Atmospheric Correction Methods for Sentinel-2 Images in Mediterranean Landscapes. Int. J. Appl. Earth Obs. Geoinf. 2018, 73, 63–76. [Google Scholar] [CrossRef]
  26. Zhang, X.; Yan, G.; Li, Q.; Li, Z.-L.; Wan, H.; Guo, Z. Evaluating the Fraction of Vegetation Cover Based on NDVI Spatial Scale Correction Model. Int. J. Remote Sens. 2006, 27, 5359–5372. [Google Scholar] [CrossRef]
  27. Juneja, D.; Sharma, S.; Jain, A.; Sharma, S. A Novel Approach to Construct Decision Tree Using Quick C4.5 Algorithm. Orient. J. Comput. Sci. Technol. 2010, 3, 305–310. [Google Scholar]
  28. Boser, B.E.; Guyon, I.M.; Vapnik, V.N. A Training Algorithm for Optimal Margin Classifiers. In Proceedings of the Fifth Annual Workshop on Computational Learning Theory, Pittsburgh, PA, USA, 27–29 July 1992; ACM: Pittsburgh, PA, USA, 1992; pp. 144–152. [Google Scholar]
  29. Shen, L.; Chen, H.; Yu, Z.; Kang, W.; Zhang, B.; Li, H.; Yang, B.; Liu, D. Evolving Support Vector Machines Using Fruit Fly Optimization for Medical Data Classification. Knowl. Based Syst. 2016, 96, 61–75. [Google Scholar] [CrossRef]
  30. Speiser, J.L.; Miller, M.E.; Tooze, J.; Ip, E. A Comparison of Random Forest Variable Selection Methods for Classification Prediction Modeling. Expert. Syst. Appl. 2019, 134, 93–101. [Google Scholar] [CrossRef]
  31. Biau, G. Analysis of a Random Forests Model. J. Mach. Learn. Res. 2012, 13, 1063–1095. [Google Scholar]
  32. Haralick, R.; Shanmugam, K.; Dinstein, I. Texture Features for Image Classification. Syst. Man. Cybern. IEEE Trans. 1975, 3. [Google Scholar]
  33. Zhu, Y.; Liu, K.; Liu, L.; Wang, S.; Liu, H. Retrieval of Mangrove Aboveground Biomass at the Individual Species Level with WorldView-2 Images. Remote Sens. 2015, 7, 12192–12214. [Google Scholar] [CrossRef]
  34. Gitelson, A.A.; Gritz, Y.; Merzlyak, M.N. Relationships between Leaf Chlorophyll Content and Spectral Reflectance and Algorithms for Non-Destructive Chlorophyll Assessment in Higher Plant Leaves. J. Plant Physiol. 2003, 160, 271–282. [Google Scholar] [CrossRef] [PubMed]
  35. Zhou, Q.; Zhang, X.; Yu, L.; Ren, L.; Luo, Y. Combining WV-2 Images and Tree Physiological Factors to Detect Damage Stages of Populus gansuensis by Asian Longhorned Beetle (Anoplophora glabripennis) at the Tree Level. For. Ecosyst. 2021, 8, 35. [Google Scholar] [CrossRef]
  36. Le Maire, G.; François, C.; Dufrêne, E. Towards Universal Broad Leaf Chlorophyll Indices Using PROSPECT Simulated Database and Hyperspectral Reflectance Measurements. Remote Sens. Environ. 2004, 89, 1–28. [Google Scholar] [CrossRef]
  37. Korhonen, L.; Packalen, P.; Rautiainen, M. Comparison of Sentinel-2 and Landsat 8 in the Estimation of Boreal Forest Canopy Cover and Leaf Area Index. Remote Sens. Environ. 2017, 195, 259–274. [Google Scholar] [CrossRef]
  38. Fernández-Manso, A.; Fernández-Manso, O.; Quintano, C. SENTINEL-2A Red-Edge Spectral Indices Suitability for Discriminating Burn Severity. Int. J. Appl. Earth Obs. Geoinf. 2016, 50, 170–175. [Google Scholar] [CrossRef]
  39. Shoko, C.; Mutanga, O. Examining the Strength of the Newly-Launched Sentinel 2 MSI Sensor in Detecting and Discriminating Subtle Differences between C3 and C4 Grass Species. ISPRS J. Photogramm. Remote Sens. 2017, 129, 32–40. [Google Scholar] [CrossRef]
  40. Lim, J.; Kim, K.-M.; Jin, R. Tree Species Classification Using Hyperion and Sentinel-2 Data with Machine Learning in South Korea and China. IJGI 2019, 8, 150. [Google Scholar] [CrossRef]
  41. Burkholder, A. Seasonal Trends in Separability of Leaf Reflectance Spectra for Ailanthus Altissima and Four Other Tree Species; West Virginia University: Morgantown, WV, USA, 2010. [Google Scholar]
  42. Ng, W.-T.; Rima, P.; Einzmann, K.; Immitzer, M.; Atzberger, C.; Eckert, S. Assessing the Potential of Sentinel-2 and Pléiades Data for the Detection of Prosopis and Vachellia Spp. in Kenya. Remote Sens. 2017, 9, 74. [Google Scholar] [CrossRef]
  43. Cervantes, J.; Garcia-Lamont, F.; Rodríguez-Mazahua, L.; Lopez, A. A Comprehensive Survey on Support Vector Machine Classification: Applications, Challenges and Trends. Neurocomputing 2020, 408, 189–215. [Google Scholar] [CrossRef]
  44. Bjerreskov, K.S.; Nord-Larsen, T.; Fensholt, R. Classification of Nemoral Forests with Fusion of Multi-Temporal Sentinel-1 and 2 Data. Remote Sens. 2021, 13, 950. [Google Scholar] [CrossRef]
  45. Grabska, E.; Frantz, D.; Ostapowicz, K. Evaluation of Machine Learning Algorithms for Forest Stand Species Mapping Using Sentinel-2 Imagery and Environmental Data in the Polish Carpathians. Remote Sens. Environ. 2020, 251, 112103. [Google Scholar] [CrossRef]
  46. Immitzer, M.; Atzberger, C.; Koukal, T. Tree Species Classification with Random Forest Using Very High Spatial Resolution 8-Band WorldView-2 Satellite Data. Remote Sens. 2012, 4, 2661–2693. [Google Scholar] [CrossRef]
  47. Mohammadpour, P.; Viegas, D.X.; Viegas, C. Vegetation Mapping with Random Forest Using Sentinel 2 and GLCM Texture Feature-A Case Study for Lousa Region, Portugal. Remote Sens. 2022, 14, 4585. [Google Scholar] [CrossRef]
Figure 1. Study area: (a) Beijing administrative division, (b) 10-m Sentinel-2 data in Shunyi District, and (c) 0.5-m WorldView-2 image (red, green, and blue composite).
Forests 14 01889 g001
Figure 2. Workflow of tree species classification at two spatial resolutions.
Forests 14 01889 g002
Figure 3. Result of vegetation and forest extraction from the level-2 classification: (a,b) Sentinel-2 and (c,d) WorldView-2.
Forests 14 01889 g003
Figure 4. Spectral curves of different tree species extracted: (a) Pléiades-1; (b) WorldView-2; and (c) Sentinel-2.
Forests 14 01889 g004
Figure 5. Feature importance from different image sources ranking in RF: (a) Sentinel-2; (b) Pléiades-1; and (c) WorldView-2. (B = Band, G = GLCM, and Ex: B1G1 = Band1 GLCM Mean).
Forests 14 01889 g005
Figure 6. Confusion matrix in tree species classification produced by RF with different data sources: (a) Sentinel-2 and RF; (b) Pléiades-1 and SVM; (c) WorldView-2 and SVM; (d) Sentinel-2 and SVM; (e) Sentinel-2 and DT; (f) Pléiades-1 and DT; (g) Pléiades-1 and RF; (h) WorldView-2 and DT; and (i). WorldView-2 and RF.
Forests 14 01889 g006
Figure 7. (a) Tree species distribution at the stand level based on Sentinel-2 combined with RF and (bd) tree species classification results of mixed forests based on WorldView-2 combined with SVM.
Forests 14 01889 g007
Table 1. Characteristics of Pléiades-1B, WorldView-2, and Sentinel-2 imagery.
SpectrumPléiades-1BWorldView-2Sentinel-2A
2021/8/22020/8/142020/9/1
BandBand WidthResolutionBandBand WidthResolutionBandBand WidthResolution
(nm)(m)(nm)(m)(nm)(m)
Coastal---B1427.3 ± 502B1442.3 ± 4560
BlueB1495 ± 76.52B2477.9 ± 602B2492.1 ± 9810
GreenB2558.5 ± 83.72B3546.2 ± 702B3559 ± 4610
Yellow---B4607.8 ± 402---
RedB3656 ± 78.82B5658.8 ± 602B4665 ± 3910
Vegetation Red Edge------B5703.8 ± 2020
Vegetation Red Edge---B6723.7 ± 402B6739.1 ± 1820
Vegetation Red Edge------B7779.7 ± 2820
NIRB4842.5 ± 130.32B7832.5 ± 1252B8833 ± 13310
Vegetation Red Edge------B8A864 ± 3220
Water vapor---B8908 ± 1802B9943.2 ± 2760
SWIR-Cirrus------B101376.9 ± 7660
SWIR------B111610.4 ± 14120
SWIR------B122185.7 ± 23820
PanB5-0.5B9-0.5---
Table 2. List of object features for tree species classifications.
Object FeaturesFormula for
Pléiades-1
Formula for
WorldView-2
Formula
for Sentinel-2
Reference
Spectral Bands Individual BandsB1, B2, B3, B4B1, B2, B3, B4,
B5, B6, B7, B8,
B1, B2, B3, B4, B5, B6, B7, B8, B8A, B9, B11, B12,
Conventional NIR indicesDVIB4 − B3B7 − B5B8 − B4[33]
Cig(B4/B2) − 1(B7/B3) − 1(B8/B3) − 1[34]
SRB4/B3 B7/B5 B8/B4[33]
NDVI(B4 − B3)/(B4 + B3)(B7 − B5)/(B7 + B5)(B8 − B4)/(B8 + B4) [26]
NIRRYNAB7/(B4 + B5)NA[35]
DD(2 × B4 − B3) − (B2 − B1) (2 × B7 − B5) − (B3-B2)(2 × B8 − B4) − (B3 − B2)[36]
EVI 2.5   ×   B 4     B 3 B 4   +   6   ×   B 3     7.5   ×   B 1   +   1 2.4   ×   B 7     B 5 B 7   +   B 5   +   1 2.5   ×   B 8     B 4 B 8   +   6   ×   B 4     7.5   ×   B 2   +   1 [37]
Red edge indicesCIre1NAB6/B3 − 1B5/B3 − 1[38]
CIre2NANAB6/B3 − 1[38]
CIre3NAB7/B3 − 1B7/B3 − 1[38]
NDVIIre1NANA(B8 − B5)/(B8 + B5)[39]
NDVIIre2NA(B7 − B6)/(B7 + B6)(B8 − B6)/(B8 + B6)[39]
NDVIIre3NANA(B8 − B7)/(B8 + B7)[39]
Shortwave infrared indicesMDI1NANA(B8 − B11)/B11[16]
MDI2NANA(B8 − B12)/B12[16]
Texture informationMean (G1) i j = 1 Ng GLCM Same as leftSame as left[32]
Variance (G2) i j = 1 Ng ( i mean ) 2 GLCM Same as leftSame as left[32]
Homogeneity (G3) i j = 1 Ng GLCM 1 + i j Same as leftSame as left[32]
Contrast (G4) i j = 1 Ng ( i j ) 2 GLCM i , j Same as leftSame as left[32]
Dissimilarity (G5) i j = 1 Ng GLCM i j Same as leftSame as left[32]
Entropy (G6) i j = 1 Ng ( GLCM i , j ) 2 Same as leftSame as left[32]
Second Moment (G7) i j = 1 Ng GLCM 2 Same as leftSame as left[32]
Correlation (G8) i j = 1 Ng i × j × GLCM i , j μ x μ y σ x × σ y Same as leftSame as left[32]
Table 3. Accuracy assessment of the level-2 classification.
LandscapeClassPléiades-1, 0.5 mWorldView-2, 0.5 mSentinel-2, 10 m
PaUaOaKappaPaUaOaKappaPaUaOaKappa
VegetationForest94.20%99.28%95.25%0.8897.64%99.31%97.75%0.9498.98%98.32%98.00%0.95%
Non-forest98.13%86.07%98.08%93.58%95.24%97.09%
Table 4. Accuracy assessments of 10 classification combinations.
ScaleSingle-Tree Stand
Classification ModelsPléiades-1WorldView-2Sentinel-2
OAKappaOAKappaOAKappa
Decision Tree72.08%0.6985.39%0.8483.44%0.82
Support Vector Machine82.79%0.8190.91%0.9085.39%0.84
Random Forest78.90%0.77 90.26%0.8989.29%0.88
Disclaimer/Publisher’s Note: The statements, opinions and data contained in all publications are solely those of the individual author(s) and contributor(s) and not of MDPI and/or the editor(s). MDPI and/or the editor(s) disclaim responsibility for any injury to people or property resulting from any ideas, methods, instructions or products referred to in the content.

