Article

Evaluating the Impact of Long-Term Land Use Change and Age since Disturbance on Soil Faunal Diversity

by
Felicity Victoria Crotty
1,*,
Umran Akkan Demirer
2,3,
Stuart Lee Norris
2,4,
Wei Liu
5,6 and
Philip James Murray
1,2,*
1
School of Agriculture, Food and Environment, Royal Agricultural University, Cirencester GL7 6JS, UK
2
Department of Sustainable Soils and Grassland Systems, Rothamsted Research, North Wyke, Okehampton, Devon EX20 2SB, UK
3
Directorate of Plant Protection Research Institute Bornova-İzmir, Genclik Cad. No. 6, Bornova, Izmir 35040, Türkiye
4
The Donkey Sanctuary, Sidmouth, Devon EX10 0NU, UK
5
Jiangxi Provincial Key Laboratory of Silviculture, Jiangxi Agricultural University, Nanchang 330045, China
6
College of Forestry, Jiangxi Agricultural University, Nanchang 330045, China
*
Authors to whom correspondence should be addressed.
Forests 2023, 14(9), 1882; https://doi.org/10.3390/f14091882
Submission received: 3 August 2023 / Revised: 11 September 2023 / Accepted: 14 September 2023 / Published: 16 September 2023
(This article belongs to the Special Issue Soil Faunal Diversity and Ecological Functions in Forest Ecosystems)

Abstract

:
Soil organisms are the biological drivers of processes and functions that maintain soil properties and ecosystem services. Soil fauna contribute to nutrient turnover, decomposition and other important biogeochemical processes. This investigation assessed the diversity and abundance of soil arthropods (0.1–4 mm) along a chronosequence of land use types covering a relatively small geographical distance but with the same underlying soil type and climatic conditions. The compared habitats and the approximate ages since anthropogenic disturbance were ancient woodland (>200 y), old woodland (<200 y), unimproved semi-natural grassland (>50 y), willow/poplar coppice (>30 y), unimproved permanent pasture (<20 y), improved permanent pasture (<10 y), and recently grazed and reseeded grassland (>2 y), and the soil types of all habitats were the same within a 5 km radius. Land use type and age since anthropogenic disturbance significantly (p < 0.05) influenced the community composition of soil fauna, with richer arthropod communities found in woodlands compared with recently managed grassland. This study has confirmed a significant effect of land use type and age since disturbance on soil faunal diversity and community structure.

1. Introduction

Soil organisms are the biological engines that drive soil processes and functions vital for provisioning, regulating and supporting ecosystem service delivery [1]. Historically, soil microbial ecologists have been led by the view developed by Baas Becking in 1934 that “everything is everywhere, but the environment selects” [2]. There is evidence, however, that challenges this long-standing view [3]. Studies using molecular techniques, for example, show that organisms in soil have restricted global distributions due to variations in climatic, soil and plant conditions [4].
Soil physical and chemical properties define the soil environment and significantly affect the diversity and community composition of soil arthropods [5]. Soil habitats with greater organic matter and greater water-holding capacity support more abundant soil communities [6]. Conversely, intensive fertilization and the use of lime for soil reformation have been shown to significantly decrease the abundance of soil organisms [7]. In addition, the quality and quantity of litter carbon and nitrogen are also known to affect soil arthropod community composition and diversity [8]. Land use change and agricultural intensification have been identified as important factors in the loss of biodiversity [5]. The conversion of natural ecosystems into agriculture land and the associated application of agricultural practices have negative effects on the soil habitat [9], such as increasing soil bulk density, reducing pore space and destroying pore geometry [10]. Conversion of land for agricultural use and other associated changes in environmental conditions not only change the soil physical and chemical properties but also affect ecosystem processes and the stability of soil biodiversity [11,12,13,14].
The stability of soil faunal communities has been shown to decline when soil cultivation increases [15]. For example, different suborders of soil mites have different sensitivity to changes in land management practice, with reductions in both Oribatida and Mesostigmata with intensity [15]. Mites (Acari) have been identified as major bioindicators due to their distribution, abundance, and important role in soil nutrient cycling [16,17], as well as their response to disturbance [17]. This makes them suitable bioindicators for soil ecosystem status [18]. Moreover, Acari have been found to be sensitive to the effects of human activities over spatiotemporal gradients, making mites important bio-indicators of soil health globally [19,20,21]. It is important to also consider Collembola, an equally abundant group within the mesofauna, as they are also impacted by management intensity and land use change and are also used as bioindicators as part of national-level monitoring programmes [22].
Although there is a growing tendency to explore interactions over large global distances and habitats (e.g., [23]), results may be confounded by differences in climate, underlying geology and soil type. In this paper, we focus on historical changes in land use over small geographical distances to better understand how the composition of soil communities has changed with anthropogenic disturbance intensity on the same soil type under the same climatic conditions. This allows us to decouple the impacts of climate and other environmental factors from managed, vegetation-imposed effects, enabling us to study the effect of long-term changes on land use. Here, we compare the diversity and community composition of seven contrasting habitats along a chronosequence of anthropogenic disturbance. We hypothesise that diversity will increase with age since last disturbance, independent of habitat type.

2. Materials and Methods

2.1. Site Description

A study was carried out on an estate comprised of 250 ha of grassland and woodland at Rothamsted Research, North Wyke in the South West of England (50°80′04″ N, 03°79′34″ W). Soil core samples were collected from seven different habitats over the chronosequence since last anthropogenic disturbance. All habitats were on the same Hallsworth soil series, which is a clayey pelo-stagnogley soil in head from clay shale (Harrod and Hogan, 2008). Seven habitats of different ages were selected to investigate the composition and diversity of soil communities. The study sites represented two types of habitat, namely grassland and woodland, over a chronosequence of <2 years to >200 years since the last anthropogenic disturbance; the locations of the sites are denoted in Figure 1. Details of the soil characteristics and conditions in the general grassland and woodland sites can be found in Crotty et al. [24]. The habitats were:
  • Ancient woodland (AW), undisturbed and uncultivated soil for more than 200 years, dominated by oak (Quercus robur L.).
  • Old woodland (OW), undisturbed and uncultivated soil for less than 200 years old, dominated by ash (Fraxinus spp.).
  • Semi-natural grassland (SNG), with no anthropogenic disturbance for more than 50 years, dominated by purple moor grass (Molinia caerulea L.), meadow sweet (Filipendula ulmaria L.) and tussock grass (Deschampsia cespitosa L.), and classified as old culm grassland.
  • Coppice woodland (CW) with no disturbance for more than 30 years, dominated by willow (Salix spp.) and poplar (Populus spp.).
  • Unimproved permanent pasture (UPP), which received no fertiliser inputs for more than 30 years but was annually grazed by cattle and sheep. The habitat is dominated by creeping bent (Agrostis stolonifera L.), Yorkshire fog (Holcus lanatus L.) and soft rush (Juncus effusus L.).
  • Improved permanent grassland (IPP), less than 10 years old, on average 200 kg N ha−1 applied annually and grazed, dominated by perennial ryegrass (Lolium perenne L.) and creeping bent (A. stolonifera).
  • Grazed and reseeded grassland (GR), had 40 kg N ha−1 fertilizer per annum and was grazed for 2 years. It was reseeded with high yielding perennial ryegrass (L. perenne cv AberMagic), and white clover (Trifolium repens L. cv AberHerald).

2.2. Arthropod Sampling and Extraction

Intact soil cores (8 cm diameter, 10 cm deep, n = 3 per habitat) were taken from 3 previously delineated areas within each habitat, each 50 m apart and 20 metres from the habitat edge. Cores were taken using a steel ‘Root Auger’ (van Walt Ltd., Surrey, UK) so that the entire faunal assemblage remained within the core with minimal disturbance of the soil profile. Each soil core was stored in a refrigerator at 4 °C within individual Sun-bags (Sigma-Aldrich, St Louis, MO, USA) for 24 h before extraction of arthropods.
Soil mesofauna were extracted from each core on a Berlese-Tullgren funnel system (mesh 5 mm) (Burkard Manufacturing Co., Ltd., Rickmansworth, UK) over 10 days [25,26]. Extracted invertebrate specimens were stored in 70% ethanol. The arthropod groups were identified and separated into the four main Collembola orders (Entomobryomorpha, Poduromorpha, Neelipleona and Symphypleona), the Acari were separated into Oribatida, Mesostigmata, Prostigmata and Astigmata, and other invertebrates were identified at different taxonomic levels [24,27,28,29,30,31].

2.3. Analysis of Chemical Properties of Soil and Plants

A second set of soil cores was taken for analysis of chemical properties of soil, plant and litter. Litter and plant materials were removed from the surface of the soil cores. The plant and litter samples were ground after oven-drying for 24 h at 80 °C in order to measure concentration of lignin and cellulose, carbon (TC) and nitrogen (TN). The C- and N-concentrations of the litter were determined by dry combustion on a Carlo Erba NA2000 analyser (CE Instruments, Wigan, UK). The soil cores were sieved (2 mm mesh) and air-dried for 4 days at 30 °C. To determine the pH of the soil, homogenized sub-samples of air-dried ground soil were transferred to plastic bags. Then, 25 ± 0.1 mL of deionized water was added to the bags, they were shaken for 15 ± 1 min, and the solution was filtered. Soil pH was measured using a pH probe (Mettler Toledo F20 Benchtop pH meter). Neutral detergent fibre (lignin, hemicellulose, and cellulose), acid detergent fibre (lignin and cellulose) and acid detergent lignin values were determined using the Goering and Van Soest method [32], using the FibreCap method for neutral and acid detergent fibre analysis [33].

2.4. Statistical Analysis

In ecological studies of this sort, it is almost impossible to apply full statistical principles to the design of experiments. In particular, since each representation of the seven habitats is unique to its location, it is impossible to have true biological replication of the seven habitats. The hierarchical design approach that has been taken provides a number of opportunities for the analysis of treatment differences relative to different estimates of the inherent variability. Within each of the habitats, the three sampling locations were as widely spaced as possible, effectively providing separate realisations of the same habitat, thereby capturing the variability within each of the habitats and providing an estimate of background variability against which differences in response between habitats was assessed.
All statistical analysis was conducted using R (version 4.2.1, [34]) in RStudio [35]. Analysis of variance [36] was used to test for significant differences between habitats and age since last anthropogenic disturbance. Habitat and age were fixed factors, and soil core replicates from each habitat were used as blocking strata to improve the evaluation of habitat effects on soil fauna communities by accounting for the variability associated with collecting multiple soil cores per habitat. Following ANOVA, for each diversity index, Tukey’s honest significance test (HST) was used to understand the difference between habitats [37]. Overall abundance m2, as well as diversity indices including richness, Shannon and beta-diversity, were used to test for differences in below-ground biodiversity between habitats. Data were presented as mean (±s.e.); rarer groups have high standard errors since they were not found in every replicate within a treatment. All diversity indices were Box–Cox-transformed to ensure that the residual values conformed to normality assumptions. Taxonomic richness was calculated using the ‘specnumber’ function in the R package ‘vegan’ [38], which finds the number of taxa. Abundance was calculated by the number of observations multiplied by 198 to give an abundance m2. Shannon diversity indices were calculated as:
H = i = 1 S P i l o g b P i
where Pi is the proportional abundance of species i and b is the base of the logarithm, which in this case was the natural logarithm.
Once the diversity of the whole community was assessed, taxa with the greatest mean abundance were identified. These were then analysed in greater detail to understand how they were influenced by the different habitats and their age since disturbance. The β-diversity, often termed differentiation diversity, is synonymous with a measurement of the extent of change in community composition [39]. The ‘betadiver’ function of the R package ‘vegan’ was used to compute β-diversity based on the counts of below-ground invertebrates recovered from the different habitats. Correlations between β-diversity and soil chemical properties were computed using the ‘envfit’ function of the R package ‘vegan’. The ‘indval’ function from the R package ‘labdsv’ was then used to determine indicator taxa of communities in each habitat [40]. Graphical visualisations were created using the R package ‘ggplot’ [41].

3. Results

3.1. Soil and Litter Properties

Table 1 details the soil and litter characteristics of the habitats. The soil pH showed significant variation between habitat and age of sites (p < 0.001). Generally, soil pH was higher in the agriculturally managed grasslands compared to woodlands or the semi-natural grassland. The highest pH was recorded in UPP, while OW had the lowest pH. Woodland soils had significantly higher lignin content than grassland soils (p < 0.001). However, there was little significant variation in cellulose content, with only CW and SNG being significantly different from each other (p = 0.03). Total litter nitrogen was the highest in the UPP site, and total litter carbon was significantly lower in CW than in the rest of the sampling plots (p < 0.001). Litter C:N was significantly different between habitats, with the lowest being SNG and the greatest CW (p = 0.003). Total soil nitrogen (p < 0.001) and total soil carbon (p < 0.001) were both significantly greater in the older woodland sites than in the grasslands. The soil of the CW site was not significantly different from that of the grasslands. GR also had the lowest soil TN and soil TC. Significant differences in soil C:N were found between sites (p < 0.001); the highest ratio was recorded in OW, while the lowest ratio was in AW.

3.2. Abundance of Invertebrates

In total, 42 different taxonomic groups were recovered from the 21 soil cores (Table 2). The most abundant taxa were the Acari, Collembola and Staphylinidae larvae. These taxa were analysed separately to identify trends in the effect of habitat age and soil characteristics. In all habitats, the most abundant arthropods were the Acari; overall, Oribatida (O) and Mesostigmata (Ms) were more abundant than Prostigmata (Pr) and Astigmata (As), except in the GR plot, where Pr was most abundant. The second most abundant group was Collembola. Overall, Entomobryomorpha (Ent) and Poduromorpha (Pd) were more abundant than Neelipleona (N) and Symphypleona (Sym) (Table 2).

3.3. Diversity of Invertebrate Communities

The Shannon diversity (p = 0.296), evenness (p = 0.762), and abundance (p = 0.376) were not significantly different between age and habitat (Table 3). Richness was significantly greater in OW than GR (p = 0.007). β-diversity was significantly lower in OW than in AW, CW, SNG, IPP and GR (p = 0.021, Table 3).

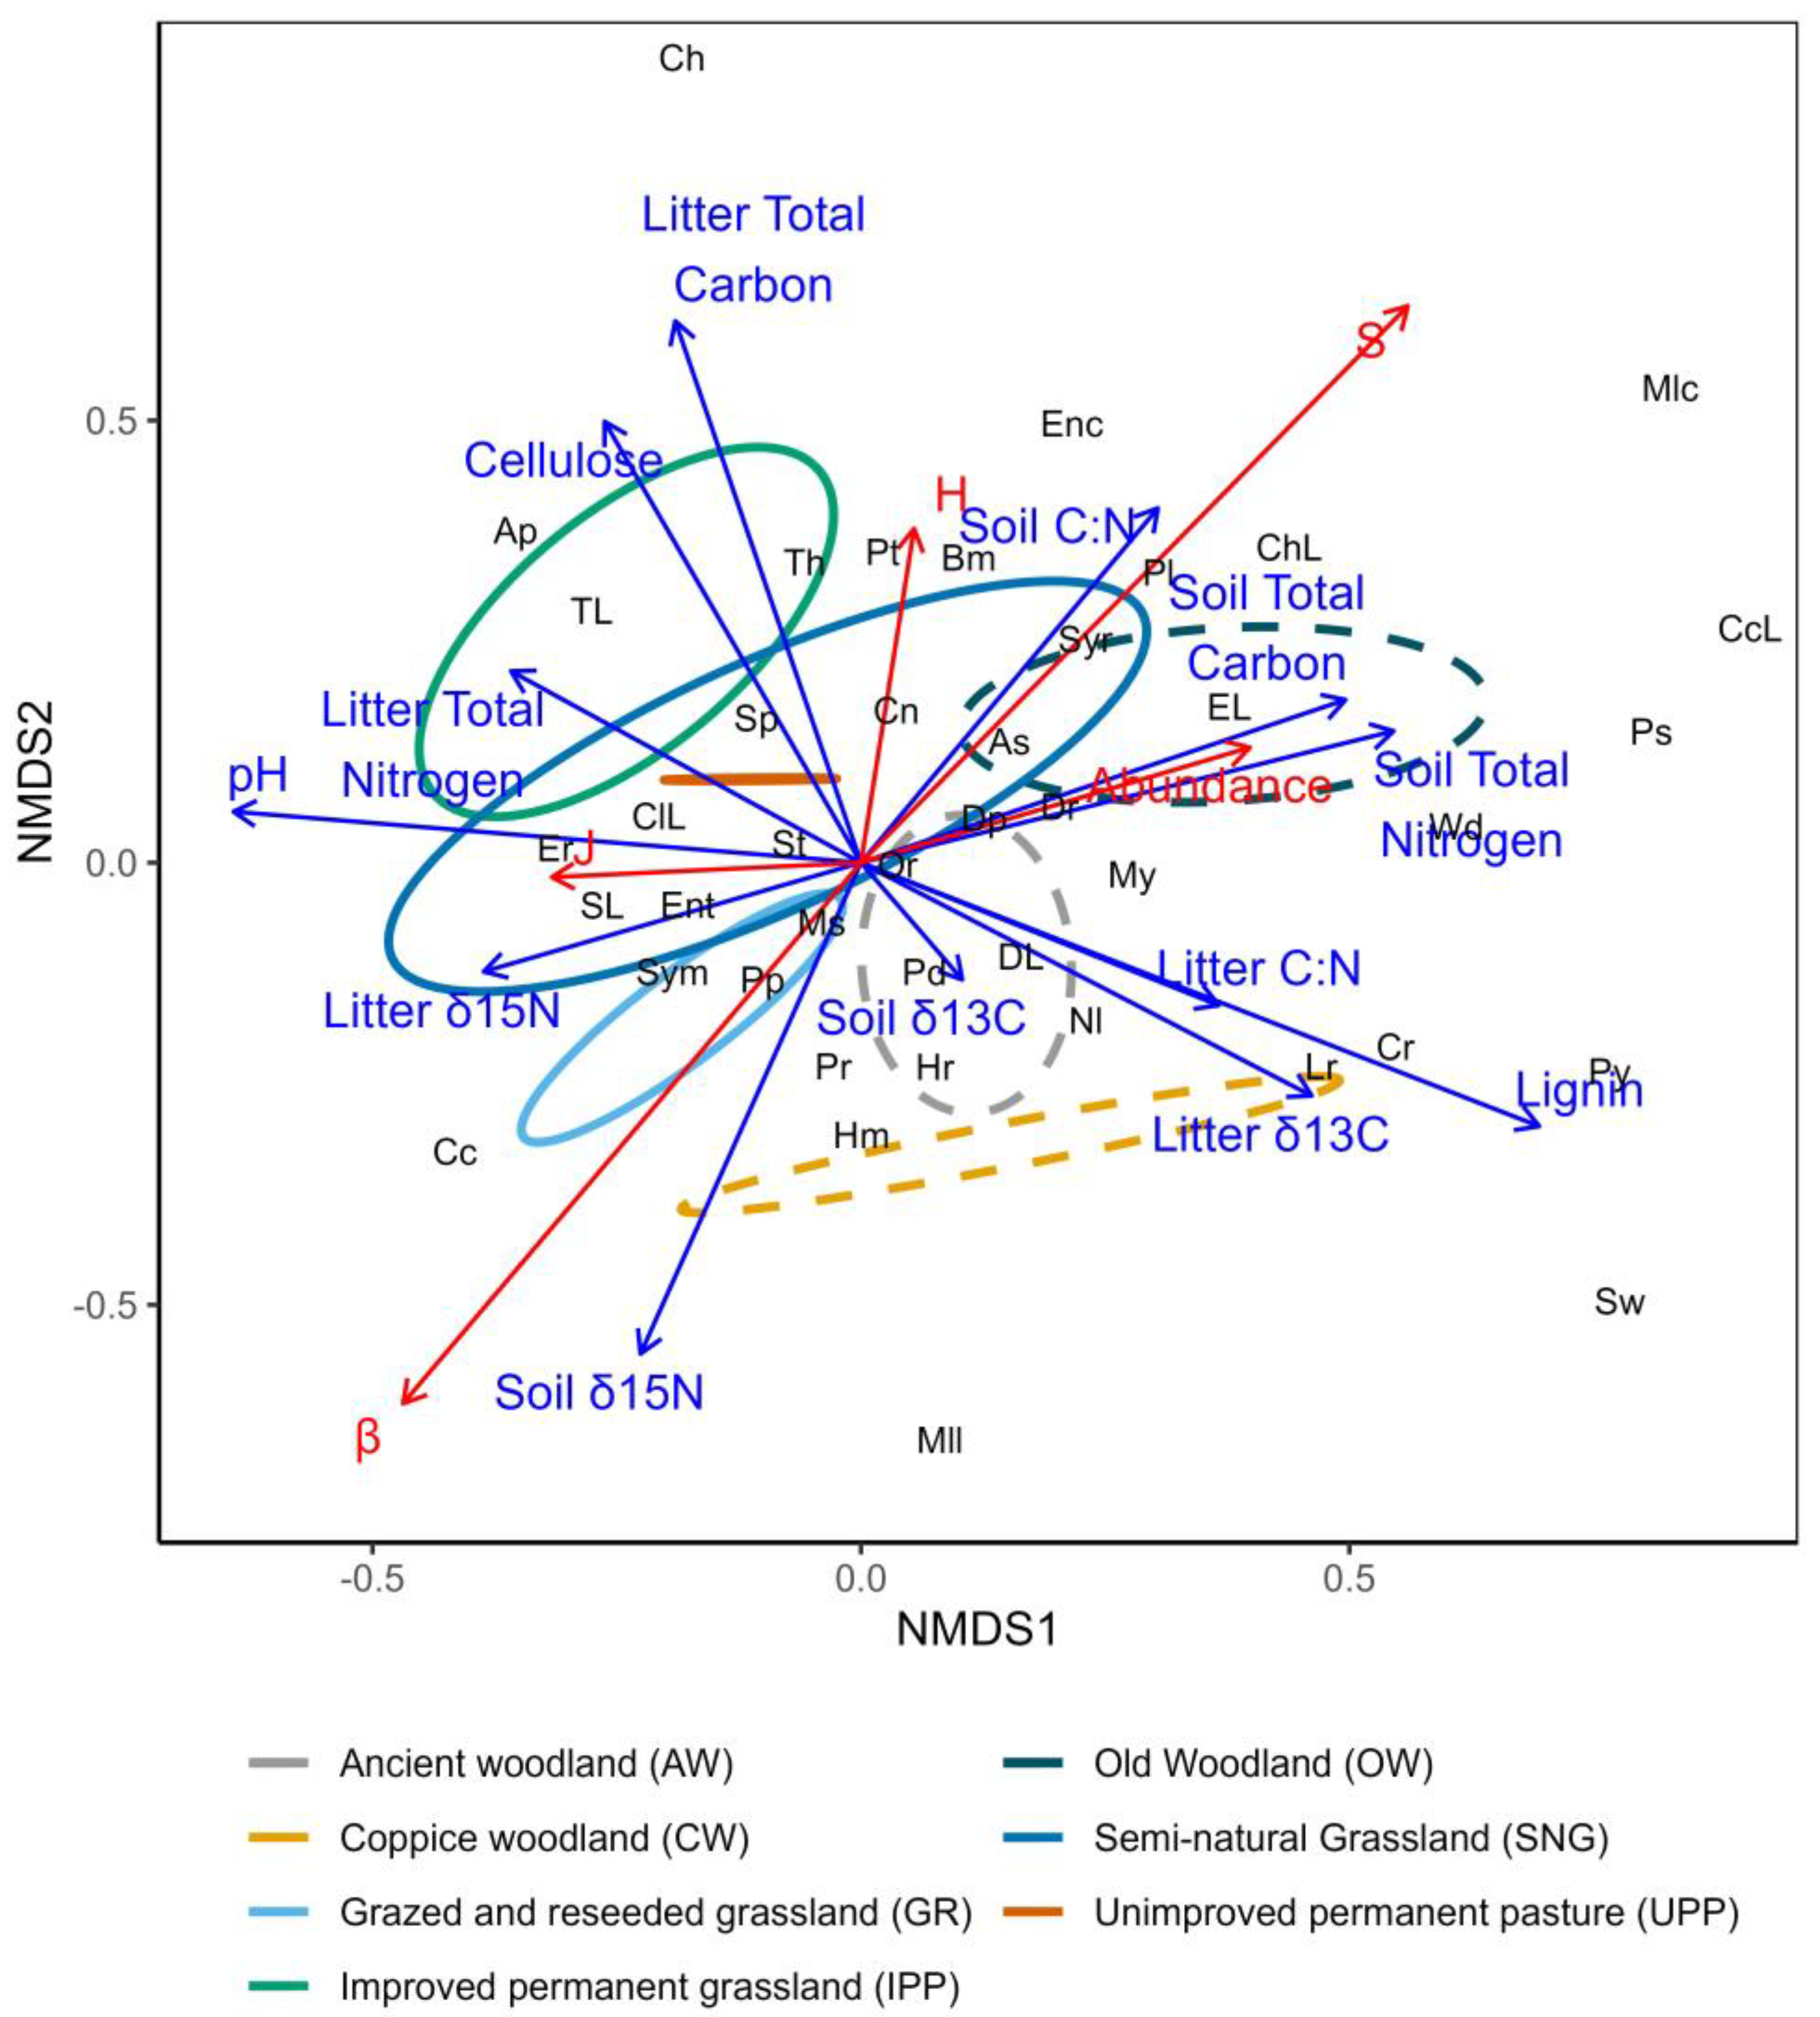
3.4. Multivariate Community Analysis

Soil chemical and physical measures were correlated with arthropod β-diversity. Cellulose was positively correlated with the grasslands, while lignin was positively correlated with the woodlands. Woodlands were also positively correlated with soil N, despite being negatively correlated with pH and total litter carbon. However, total litter carbon and pH were positively correlated with the grasslands (Figure 2). The most influential invertebrate taxa contributing to the differences seen in community composition varied among habitats (p < 0.001). OW was associated with Astigmata (As), AW and CW were associated with Poduromorpha (Pd), and AW was also associated with Neelipleona (N). GR was associated with Prostigmata (Pr), Symphypleona (Sym), Mesostigmata (Ms) and Entomobryomorpha (Ent). UPP and SNG were associated with Mesostigmata (Ms), Entomobryomorpha (Ent), Astigmata (As) and Poduromorpha (Pd). IPP was associated primarily with Entomobryomorpha (Ent), and also with Mesostigmata (Ms) and Symphypleona (Sym) (Figure 2). IndVal analysis showed that an abundance of Symphypleona (p = 0.016) was also found to be a significant indicator of improved permanent pasture, whereas Mesostigmata were found to be an indicator of unimproved permanent pasture (p = 0.029).

4. Discussion

The abundance of certain groups of soil arthropods was reduced with increasing management intensity and more recent anthropogenic influence (Table 3). This confirms our hypothesis that soil diversity increases with habitat age. However, Acari density in natural systems was not always greater than in the managed grasslands (recently grazed and reseeded grassland) (Table 3), which were linked to significantly higher numbers of Prostigmata in GR. For that reason, part of our hypothesis has been rejected. A similar trend has been observed in other studies, and may suggest that Oribatida and Mesostigmata density responds in a hump-backed relationship with management intensity [15]. Increasing the intensity of agricultural management tends to reduce mite density, particularly for Oribatida, which are relatively long lived and slow to develop, leading to an increased impact of perturbations, particularly tillage [42]. The Shannon diversity index treats all species as equal entities without considering the hierarchical relationships between them. This can lead to issues when comparing communities or taxa at different taxonomic levels. For example, communities may have similar Shannon diversity values even if they differ significantly in terms of functional roles or ecological interactions. In order to mitigate this, Shannon diversity results are also used in conjunction with β-diversity (Table 3), making it possible to consider changes in taxonomic composition between communities. The Shannon index is also sensitive to rare species, which can lead to an overemphasis on certain species in Shannon diversity. The present study avoids this problem by combining Shannon diversity measure with other diversity measures to understand the differences in communities between the different habitats and time since last anthropogenic disturbance. Overall, it has been shown that different suborders, and presumably different species, respond in different ways to intensification. We therefore conclude that the greater Acari densities under high-input management are mainly explained by the perturbations produced by agricultural practices and soil conditions being unfavourable to other arthropod taxa, allowing mite populations to increase in response to greater inputs and in the absence of top-down control.
Organic matter, litter and below-ground diversity are well known to be adversely affected by soil cultivation and the intensity of management [42]. Our findings support this general hypothesis, since the old woodland was significantly richer in arthropods than the most recently reseeded grassland (Table 2; Figure 2). These results are consistent with Ramezani [43], who found lower abundance and diversity of soil organisms in soils that had not been intensively managed for more than 50 years. These results add to the growing body of evidence suggesting that there are intrinsic links between management intensity and soil organic matter dynamics supporting richer populations of soil organisms [5]. Although conversion of forest to agricultural land has been shown to reduce organic matter in the soil [15,31], there is some conflicting evidence surrounding this area of research, with other studies finding no correlation between the decreasing organic matter content of the soil and decreases in the diversity of arthropods [44]. This suggests there may be a threshold in low-organic-matter systems below which other mechanisms are involved that are yet to be revealed.
In addition to differences in organic matter, another key difference among the woodland and grassland habitats was in the amount and composition of litter (Table 1). The woodland litter was found to have significantly greater lignin content, whereas the grassland was found to have significantly greater cellulose content (Table 1, Figure 2). Differences in litter quality are known to be drivers of below-ground community dynamics, with composition being strongly influenced by the organisms that are adapted to utilise these contrasting resources [45]. Soil pH is critical for examining the impacts of disturbance on decomposition of lignin and cellulose [46]. There was significant variation in the pH between the habitats of different ages (Table 1, Figure 2). Differences in pH could be linked to the history of habitat management and to the contrasting vegetation structure adding different substrates of contrasting pH to the soil organic matter pool [25,47,48]. In this study, low pH was correlated with high litter content, favouring greater taxonomic richness and abundance, which is strongly linked to slow decomposition in acidic soils, in which enhanced soil organic matter serves as a food source for soil organisms [49].
Despite the large amount of heterogeneity between sites, consistent patterns of declining richness and diversity emerged with increasing intensification. These results show consistent patterns with other studies that have measured ecosystem function at the landscape scale [41], but offer conflicting evidence with regards to the responses of Acari communities to disturbances. This may suggest that these generally r-selected taxa are either able to avoid disturbances such as ploughing due to their small size, or due to rapid population turn-over are better able to exploit fresh nutrient resources [17]. In light of this evidence, further work should attempt to disentangle the response of Acari at higher taxonomic resolution.

5. Conclusions

This study adds to the understanding that land use drives differences in the soil invertebrate community. Changes in land use and the erosion of soil diversity lead to a reduction in ecosystem services [50]. These results confirm that the soil communities under different land use types also change with time since anthropogenic disturbance. Underlying abiotic factors related to the different land use types were found to drive the abundance, richness and diversity of soil arthropod communities. Forest habitats, which had no anthropogenic inputs or disturbances, had greater soil arthropod abundance, promoted through greater soil organic matter and litter quality. Conversion of natural ecosystems to agricultural ecosystems to feed a rapidly growing population should be balanced with support of soil arthropods to enhance ecosystem services.

Author Contributions

Conceptualization, P.J.M.; investigation, U.A.D.; methodology, F.V.C., U.A.D., S.L.N., W.L. and P.J.M.; writing—original draft, U.A.D., S.L.N. and P.J.M.; writing—review & editing, F.V.C., U.A.D., S.L.N., W.L. and P.J.M. All authors have read and agreed to the published version of the manuscript.

Funding

This research was funded by the General Directorate of Agricultural Research and Policies of Turkey and the UK Biotechnology and Biological Sciences Research Council via Rothamsted Research.

Data Availability Statement

Data available on request.

Conflicts of Interest

The authors declare no conflict of interest.

References

  1. Bardgett, R.; Bowman, W.; Kaufmann, R.; Schmidt, S. A Temporal Approach to Linking Aboveground and Belowground Ecology. Trends Ecol. Evol. 2005, 20, 634–641. [Google Scholar] [CrossRef] [PubMed]
  2. de Wit, R.; Bouvier, T. “Everything Is Everywhere, but, the Environment Selects”; What Did Baas Becking and Beijerinck Really Say? Environ. Microbiol. 2006, 8, 755–758. [Google Scholar] [CrossRef] [PubMed]
  3. Maraun, M. The Structure of Oribatid Mite Communities (Acari, Oribatida): Patterns, Mechanisms and Implications for Future Research. Ecography 2000, 23, 374–383. [Google Scholar] [CrossRef]
  4. Bardgett, R.D.; van der Putten, W.H. Belowground Biodiversity and Ecosystem Functioning. Nature 2014, 515, 505–511. [Google Scholar] [CrossRef] [PubMed]
  5. Certini, G. Effects of Fire on Properties of Forest Soils: A Review. Oecologia 2005, 143, 1–10. [Google Scholar] [CrossRef]
  6. Scheu, S.; Schulz, E. Secondary Succession, Soil Formation and Development of a Diverse Community of Oribatids and Saprophagous Soil Macro-Invertebrates. Biodivers. Conserv. 1996, 5, 235–250. [Google Scholar] [CrossRef]
  7. Kopittke, P.M.; Menzies, N.W.; Wang, P.; McKenna, B.A.; Lombi, E. Soil and the intensification of agriculture for global food security. Environ. Int. 2019, 132, 105078. [Google Scholar] [CrossRef]
  8. Ashford, O.S.; Foster, W.A.; Turner, B.L.; Sayer, E.J.; Sutcliffe, L.; Tanner, E.V. Litter Manipulation and the Soil Arthropod Community in a Lowland Tropical Rainforest. Soil Biol. Biochem. 2013, 62, 5–12. [Google Scholar] [CrossRef]
  9. Werling, B.P.; Dickson, T.L.; Isaacs, R.; Gaines, H.; Gratton, C.; Gross, K.L.; Liere, H.; Malmstrom, C.M.; Meehan, T.D.; Ruan, L.; et al. Perennial Grasslands Enhance Biodiversity and Multiple Ecosystem Services in Bioenergy Landscapes. Proc. Natl. Acad. Sci. USA 2014, 111, 1652–1657. [Google Scholar] [CrossRef]
  10. Rhrig, R.; Langmaack, M.; Schrader, S.; Larink, O. Tillage Systems and Soil Compaction Their Impact on Abundance and Vertical Distribution of Enchytraeidae. Soil Tillage Res. 1998, 46, 117–127. [Google Scholar] [CrossRef]
  11. Moore, J.C.; Berlow, E.L.; Coleman, D.C.; Ruiter, P.C.; Dong, Q.; Hastings, A.; Johnson, N.C.; McCann, K.S.; Melville, K.; Morin, P.J.; et al. Detritus, Trophic Dynamics and Biodiversity: Detritus, Trophic Dynamics and Biodiversity. Ecol. Lett. 2004, 7, 584–600. [Google Scholar] [CrossRef]
  12. Hairiah, K.; Sitompul, S.M.; Van Noordwijk, M.; Palm, C. Methods for Sampling Carbon Stocks above and below Ground; ICRAF: Bogor, Indonesia, 2001. [Google Scholar]
  13. Rantalainen, M.-L.; Haimi, J.; Fritze, H.; Setälä, H. Effects of Small-Scale Habitat Fragmentation, Habitat Corridors and Mainland Dispersal on Soil Decomposer Organisms. Appl. Soil Ecol. 2006, 34, 152–159. [Google Scholar] [CrossRef]
  14. Barrios, E. Soil Biota, Ecosystem Services and Land Productivity. Ecol. Econ. 2007, 64, 269–285. [Google Scholar] [CrossRef]
  15. Bedano, J.C.; Cantú, M.P.; Doucet, M.E. Influence of Three Different Land Management Practices on Soil Mite (Arachnida: Acari) Densities in Relation to a Natural Soil. Appl. Soil Ecol. 2006, 32, 293–304. [Google Scholar] [CrossRef]
  16. Culliney, T.W. Role of Arthropods in Maintaining Soil Fertility. Agriculture 2013, 3, 629–659. [Google Scholar] [CrossRef]
  17. Caruso, T.; Taormina, M.; Migliorini, M. Relative Role of Deterministic and Stochastic Determinants of Soil Animal Community: A Spatially Explicit Analysis of Oribatid Mites: Deterministic and Stochastic Determinants of Soil Animal Community. J. Anim. Ecol. 2012, 81, 214–221. [Google Scholar] [CrossRef]
  18. Gulvik, M.E. Mites [Acari] as Indicators of Soil Biodiversity and Land Use Monitoring: A Review. Pol. J. Ecol. 2007, 3, 415–440. [Google Scholar]
  19. Buchs, W.; Raubuch, M.; Prescher, S.; Behr, K.; Muller, A.; Roose, K. Impact of Ostrinia-Resistant Bt-Maize on Microbial and Invertebrate Decomposer Communities in Field Soils. Mitteilungen-Biol. Bundesanst. Fur Land Und Forstwirtsch. 2007, 410, 26. [Google Scholar]
  20. Breure, A.M.; Mulder, C.; Römbke, J.; Ruf, A. Ecological Classification and Assessment Concepts in Soil Protection. Ecotoxicol. Environ. Saf. 2005, 62, 211–229. [Google Scholar] [CrossRef]
  21. Buckland, S.T.; Magurran, A.E.; Green, R.E.; Fewster, R.M. Monitoring Change in Biodiversity through Composite Indices. Philos. Trans. R. Soc. B Biol. Sci. 2005, 360, 243–254. [Google Scholar] [CrossRef]
  22. George, P.B.L.; Keith, A.M.; Creer, S.; Barrett, G.L.; Lebron, I.; Emmett, B.A.; Robinson, D.A.; Jones, D.L. Evaluation of mesofauna communities as soil quality indicators in a national-level monitoring programme. Soil Biol. Biochem. 2017, 115, 537–546. [Google Scholar] [CrossRef]
  23. Tsiafouli, M.A.; Thébault, E.; Sgardelis, S.P.; de Ruiter, P.C.; van der Putten, W.H.; Birkhofer, K.; Hemerik, L.; de Vries, F.T.; Bardgett, R.D.; Brady, M.V.; et al. Intensive Agriculture Reduces Soil Biodiversity across Europe. Glob. Chang. Biol. 2015, 21, 973–985. [Google Scholar] [CrossRef] [PubMed]
  24. Crotty, F.V.; Adl, S.M.; Blackshaw, R.P.; Murray, P.J. Protozoan Pulses Unveil Their Pivotal Position within the Soil Food Web. Microb. Ecol. 2012, 63, 905–918. [Google Scholar] [CrossRef] [PubMed]
  25. Crotty, F.V.; Blackshaw, R.P.; Adl, S.M.; Inger, R.; Murray, P.J. Divergence of Feeding Channels within the Soil Food Web Determined by Ecosystem Type. Ecol. Evol. 2014, 4, 1–13. [Google Scholar] [CrossRef] [PubMed]
  26. Norris, S.L.; Blackshaw, R.P.; Dunn, R.M.; Critchley, N.R.; Smith, K.E.; Williams, J.R.; Randall, N.P.; Murray, P.J. Improving above and Below-Ground Arthropod Biodiversity in Maize Cultivation Systems. Appl. Soil Ecol. 2016, 108, 25–46. [Google Scholar] [CrossRef]
  27. Norris, S.L. The Effect of Maize Cultivation on Invertebrate Biodiversity. Ph.D. Thesis, Harper Adams University, Newport, UK, 2015. [Google Scholar]
  28. Werner, M.R.; Dindal, D.L. Effects of Conversion to Organic Agricultural Practices on Soil Biota. Am. J. Altern. Agric. 1990, 5, 24–32. [Google Scholar] [CrossRef]
  29. Hopkin, S.P. A Key to the Collembola (Springtails) of Britain and Ireland, 1st ed.; Occasional Publication/Field Studies Council; Field Studies Council: Preston Montford, UK, 2007; ISBN 978-1-85153-220-9. [Google Scholar]
  30. Krantz, G.W.; Walter, D.E. (Eds.) A Manual of Acarology, 3rd ed.; Texas Tech University Press: Lubbock, TX, USA, 2009; ISBN 978-0-89672-620-8. [Google Scholar]
  31. Tilling, S.M. A Key to the Major Groups of British Terrestrial Invertebrates; Field Studies Council: Shrewsbury, UK, 1987; ISBN 978-1-85153-187-5. [Google Scholar]
  32. Van Soest, P.J.; Robertson, J.B.; Lewis, B.A. Methods for Dietary Fiber, Neutral Detergent Fiber, and Nonstarch Polysaccharides in Relation to Animal Nutrition. J. Dairy Sci. 1991, 74, 3583–3597. [Google Scholar] [CrossRef]
  33. Kitcherside, M.A.; Glen, E.F.; Webster, A.J.F. FibreCap: An Improved Method for the Rapid Analysis of Fibre in Feeding Stuffs. Anim. Feed. Sci. Technol. 2000, 86, 125–132. [Google Scholar] [CrossRef]
  34. R Core Team. R: A Language and Environment for Statistical Computing; R Foundation for Statistical Computing: Vienna, Austria, 2018. [Google Scholar]
  35. Racine, J.S. RStudio: A Platform-Independent IDE for R and Sweave: Software Review. J. Appl. Econ. 2012, 27, 167–172. [Google Scholar] [CrossRef]
  36. Gu, C. Smoothing Spline ANOVA Models: R Package Gss. J. Stat. Softw. 2014, 58, 1–25. [Google Scholar] [CrossRef]
  37. De Mendiburu, F.; Simon, R. Agricolae—Ten Years of an Open Source Statistical Tool for Experiments in Breeding, Agriculture and Biology. PeerJ PrePrints 2015, 3, e1404v1. [Google Scholar]
  38. Oksanen, J.; Blanchet, F.G.; Friendly, M.; Kindt, R.; Legendre, P.; McGlinn, D.; Minchin, P.R.; O’Hara, R.B.; Simpson, G.L.; Solymos, P.; et al. Vegan: Community Ecology Package; R Package Version 2018, 1. 15-1; R Foundation for Statistical Computing: Vienna, Austria, 2018. [Google Scholar]
  39. Koleff, P.; Gaston, K.J.; Lennon, J.J. Measuring Beta Diversity for Presence-Absence Data. J. Anim. Ecol. 2003, 72, 367–382. [Google Scholar] [CrossRef]
  40. Roberts, D.W. Labdsv: Ordination and Multivariate Analysis for Ecology. R Package Version 2.0-1; R Foundation for Statistical Computing: Vienna, Austria, 2016. [Google Scholar]
  41. Wickham, H.; Averick, M.; Bryan, J.; Chang, W.; McGowan, L.; François, R.; Grolemund, G.; Hayes, A.; Henry, L.; Hester, J.; et al. Welcome to the Tidyverse. JOSS 2019, 4, 1686. [Google Scholar] [CrossRef]
  42. Culman, S.W.; Young-Mathews, A.; Hollander, A.D.; Ferris, H.; Sánchez-Moreno, S.; O’Geen, A.T.; Jackson, L.E. Biodiversity Is Associated with Indicators of Soil Ecosystem Functions over a Landscape Gradient of Agricultural Intensification. Landsc. Ecol. 2010, 25, 1333–1348. [Google Scholar] [CrossRef]
  43. Ramezani, L.; Mossadegh, M. Biodiversity of Oribatid Mites in Two Different Microhabitats of Khuzestan Province (Southwestern Iran). J. Crop Prot. 2014, 3, 443–448. [Google Scholar]
  44. Osler, G.H.R.; Sommerkorn, M. Toward a Complete Soil C and N Cycle: Incorporating the Soil Fauna. Ecology 2007, 88, 1611–1621. [Google Scholar] [CrossRef]
  45. Halaj, J.; Peck, R.W.; Niwa, C.G. Trophic Structure of a Macroarthropod Litter Food Web in Managed Coniferous Forest Stands: A Stable Isotope Analysis with Δ15N and Δ13C. Pedobiologia 2005, 49, 109–118. [Google Scholar] [CrossRef]
  46. Neher, D.A.; Barbercheck, M.E.; El-Allaf, S.M.; Anas, O. Effects of Disturbance and Ecosystem on Decomposition. Appl. Soil Ecol. 2003, 23, 165–179. [Google Scholar] [CrossRef]
  47. Balesdent, J.; Mariotti, A.; Boisgontier, D. Effect of Tillage on Soil Organic Carbon Mineralization Estimated from 13C Abundance in Maize Fields. J. Soil Sci. 1990, 41, 587–596. [Google Scholar] [CrossRef]
  48. Blagodatskaya, E.; Yuyukina, T.; Blagodatsky, S.; Kuzyakov, Y. Turnover of Soil Organic Matter and of Microbial Biomass under C3–C4 Vegetation Change: Consideration of 13C Fractionation and Preferential Substrate Utilization. Soil Biol. Biochem. 2011, 43, 159–166. [Google Scholar] [CrossRef]
  49. Loranger, G.; Bandyopadhyaya, I.; Razaka, B.; Ponge, J.-F. Does Soil Acidity Explain Altitudinal Sequences in Collembolan Communities? Soil Biol. Biochem. 2001, 33, 381–393. [Google Scholar] [CrossRef]
  50. Hines, J.; van der Putten, W.H.; De Deyn, G.B.; Wagg, C.; Voigt, W.; Mulder, C.; Weisser, W.W.; Engel, J.; Melian, C.; Scheu, S.; et al. Towards an Integration of Biodiversity–Ecosystem Functioning and Food Web Theory to Evaluate Relationships between Multiple Ecosystem Services. In Advances in Ecological Research; Elsevier: Amsterdam, The Netherlands, 2015; Volume 53, pp. 161–199. ISBN 978-0-12-803885-7. [Google Scholar]
Figure 1. Overall site locations indicating location of habitats within the area, Google Satellite base map accessed 10 May 2023.
Forests 14 01882 g001
Figure 2. Relationship between two-dimensional NMDS of the Wisconsin squared root transformed below-ground beta-diversity as a measure of differences in community composition. Soil and litter chemical parameters, levels of land use types and the abundance of invertebrates have been correlated with changes in community composition using the R function ‘envfit’. Ancient woodland (AW), old woodland (OW), coppice woodland (CW), semi-natural grassland (SNG), unimproved permanent grassland (UPP), improved permanent grassland (IPP) and reseeded grassland (GR) are represented by ellipses; dashed ellipsis are woodlands and solid ellipses are grasslands. Arthopod abbreviations; Oribatida (O), Mesostigmata (Ms), Prostigmata (Pr), Astigmata (As), Entomobryomorpha (Ent), Symphypleona (Sym), Poduromorpha (Pd), Neelipleona (N), Staphylinidae (St), Diptera (Dp), Hemiptera (Hm), Curculionidae (Cr), Thysanoptera (Th), Harpacticoida (Hr), Deroceras (Dr), Mycetophagidae (My), Syrphidae (Syr), Bembidion (B), Polyxenidae (Pl), Ptiliidae (Pt), Malachiidae (Mlc), Pyrrhocoridae (Py), Coccinellidae (Cc), Sawfly (Sw), Aphididae (Ap), Chalcidoidea (Ch), Pseudoscorpionida (Ps), Spider (Sp), Woodlice (W), Centipedes (Cn), Millipedes (Mll), Earthworm (Er), Enchytraeidae (Enc), Staphylinidae larvae (s), Diptera larvae (D.), Elateridae larvae (E.), Coleoptera larvae (Cl.), Tipulidae larvae (T.), Coccinella larvae (Cc.), Chironomidae larvae (Ch.), Larvae (L), Pupa (Pu).
Forests 14 01882 g002
Table 1. Soil physical, chemical and physicochemical properties in ancient woodland (AW), old woodland (OW), coppice woodland (CW), semi-natural grassland (SNG), unimproved permanent grassland (UPP), improved permanent grassland (IPP) and reseeded grassland (GR). (Mean ± s.e.; further analysis with Tukey-HSD allowed for comparison between habitats, with different lower-case letters in each row indicate significant differences, p < 0.05).
AWOWCWSNGUPPIPPGR
pH4.18 (±0.08) bc3.82 (±0.16) c4.71 (±0.14) b4.64 (±0.12) b5.66 (±0.11) a5.36 (±0.09) a5.46 (±0.07) a
Lignin (%)28.31 (±2.41) a32.8 (±2.74) a26.1 (±2.84) a3.85 (±0.47) b1.2 (±0.65) bc1.03 (±0.13) bc0.64 (±0.27) c
Cellulose (%)19.3 (±1.97) ab17 (±3.45) ab13.73 (±1.07) b26.1 (±4.5) a21.96 (±0.52) ab21.68 (±0.67) ab21.49 (±1.08) ab
Litter TN (%)1.42 (±0.05) ab1.75 (±0.03) bc1.09 (±0.1) a1.76 (±0.18) bc2.62 (±0.12) c1.44 (±0.09) ab2.36 (±0.34) c
Litter TC (%)40.89 (±1.62) a43.07 (±0.73) a33.87 (±2.02) b40.05 (±0.74) a43.28 (±0.2) a41.91 (±0.23) a42.78 (±0.17) a
Litter C:N28.84 (±1.04) a24.56 (±0.37) ab31.53 (±2.02) a23.23 (±2.51) ab16.57 (±0.74) b29.4 (±2.08) a18.79 (±2.34) b
Litter δ13C−29.2 (±0.33) a−29.68 (±0.03) ab−29.24 (±0.1) a−29.61 (±0.31) ab−31.14 (±0.36) c−30.65 (±0.05) bc−31.11 (±0.1) c
Litter δ15N−2.03 (±0.26) c−0.73 (±0.13) bc1.26 (±0.09) ab1.44 (±0.37) ab4.96 (±0.14) a0.15 (±0.82) bc2.97 (±1.91) ab
Soil TN (%)0.91 (±0.15) de0.95 (±0.01) e0.68 (±0) cd0.48 (±0) b0.69 (±0.01) cd0.61 (±0) c0.38 (±0) a
Soil TC (%)14.24 (±3.59) d13.73 (±0.09) d6.62 (±0.08) bc5.8 (±0.04) b7.56 (±0.06) c6.48 (±0.11) bc3.49 (±0.05) a
Soil C:N0.91 (±0.15) c24.42 (±4.46) a9.72 (±0.06) b12.08 (±0.04) b10.98 (±0.03) b10.67 (±0.08) b9.1 (±0.06) b
Soil δ13C−28.09 (±0.08) e−28.68 (±0.02) c−29.33 (±0.03) b−28.2 (±0.03) e−28.73 (±0.03) c−29.53 (±0.04) a−28.46 (±0) d
Soil δ15N1.48 (±0.11) f2.1 (±0.06) e5.97 (±0.17) a4.54 (±0.2) b3.63 (±0.07) c2.83 (±0.15) d5.46 (±0.09) a
Table 2. Taxonomic abundance (m−2) (±s.e.) of arthropods recovered from ancient woodland (AW), old woodland (OW), coppice woodland (CW), semi-natural grassland (SNG), unimproved permanent grassland (UPP), improved permanent grassland (IPP) and reseeded grassland (GR).
SpeciesAWOWCWSNGUPPIPPGR
Oribatida17,200 (±6042)15,281 (±6762)25,204 (±15,283)18,324 (±7296)7608 (±6426)25,072 (±13,790)265 (±132)
Mesostigmata3771 (±1801)2382 (±1301)3969 (±917)3175 (±1291)5292 (±1622)9328 (±2529)1588 (±992)
Prostigmata3175 (±992)2051 (±350)2646 (±1605)992 (±525)794 (±794)3374 (±865)8203 (±4532)
Astigmata265 (±175)6748 (±6157)198 (±198)2117 (±1720)66 (±66)926 (±288)198 (±115)
Entomobryomorpha2911 (±2327)3043 (±1236)7740 (±1988)1985 (±716)8269 (±1670)14,223 (±9964)3175 (±2091)
Symphypleona662 (±175)132 (±66)1588 (±525)926 (±652)5028 (±434)595 (±303)3175 (±1260)
Poduromorpha24,411 (±14,853)7145 (±2560)5094 (±529)2514 (±691)2382 (±1093)2183 (±115)1058 (±565)
Neelipleona1323 (±763)1786 (±751)2249 (±1278)265 (±175)-926 (±926)-
Staphylinidae132 (±66)66 (±66)-265 (±175)397 (±229)397 (±115)132 (±66)
Diptera66 (±66)66 (±66)---66 (±66)-
Hemiptera463 (±463)66 (±66)66 (±66)----
Curculionidae66 (±66)132 (±66)66 (±66)----
Thysanoptera66 (±66)265 (±66)-1588 (±1050)1323 (±288)1389 (±303)-
Harpacticoida66 (±66)------
Deroceras (Mollusca) 66 (±66)------
Mycetophagidae66 (±66)------
Syrphidae-66 (±66)-----
Bembidion-66 (±66)-265 (±175)---
Polyxenidae-66 (±66)-----
Ptiliidae-198 (±115)-66 (±66)66 (±66)198 (±115)-
Malachiidae-66 (±66)-----
Coccinellidae--66 (±66)66 (±66)---
Symphyta--66 (±66)----
Aphididae----728 (±288)992 (±895)-
Chalcidoidea----66 (±66)--
Pseudoscorpionida-265 (±265)66 (±66)----
Araneae-198 (±198)66 (±66)-529 (±434)397 (±229)-
Armadillidium-463 (±66)198 (±198)----
Myriapoda-132 (±132)-66 (±66)--66 (±66)
Diplopoda--132 (±66)----
Lumbricus66 (±66)--132 (±66)-198 (±115)66 (±66)
Enchytraeidae-728 (±288)--463 (±463)--
Staphylinidae larvae198 (±115)198 (±115)198 (±198)198 (±115)662 (±565)1125 (±175)331 (±132)
Diptera larvae397 (±229)331 (±239)331 (±175)-132 (±66)-66 (±66)
Elateridae larvae66 (±66)132 (±66)---66 (±66)-
Coleoptera larvae--265 (±175)265 (±175)132 (±66)198 (±115)-
Tipulidae larvae-198 (±198)-132 (±66)132 (±66)--
Coccinella larvae-66 (±66)-----
Chironomidae larvae-198 (±198)-132 (±132)---
Larvae-265 (±265)66 (±66)----
Pupa--132 (±132)-66 (±66)--
Table 3. Summary of the mean (±standard error) abundance and diversity indices in ancient woodland (AW), old woodland (OW), coppice woodland (CW), semi-natural grassland (SNG), unimproved permanent grassland (UPP), improved permanent grassland (IPP) and reseeded grassland (GR). (Further analysis with Tukey-HSD allowed for comparison between habitats, with different lower-case letters (a, b) in each row indicate significant differences, p < 0.05).
AWOWCWSNGUPPIPPGR
Richness12.67 (±1.86) ab18.67 (±0.33) a12.67 (±0.88) ab13.00 (±2.00) ab13.00 (±1.00) ab14.33 (±0.33) ab9.00 (±1.00) b
Total Abundance m−2 × 1045.53 (±2.57) a4.27 (±1.45) a5.03 (±1.89) a3.34 (±0.96) a3.41 (±1.08) a6.15 (±1.59) a1.83 (±0.77) a
Shannon Diversity1.54 (±0.08) a2.00 (±0.14) a1.68 (±0.16) a1.62 (±0.19) a1.87 (±0.14) a1.71 (±0.23) a1.55 (±0.10) a
Evenness (J) 0.62 (±0.06) a0.69 (±0.05) a0.66 (±0.07) a0.64 (±0.07) a0.73 (±0.03) a0.64 (±0.09) a0.71 (±0.05) a
β-diversity2.49 (±0.59) ab1.25 (±0.04) b2.35 (±0.24) ab2.37 (±0.45) ab2.27 (±0.27) ab1.93 (±0.07) ab3.80 (±0.60) a
Disclaimer/Publisher’s Note: The statements, opinions and data contained in all publications are solely those of the individual author(s) and contributor(s) and not of MDPI and/or the editor(s). MDPI and/or the editor(s) disclaim responsibility for any injury to people or property resulting from any ideas, methods, instructions or products referred to in the content.

