Article

How Forest Management with Clear-Cutting Affects the Regeneration, Diversity and Structure of a Seasonally Dry Tropical Forest in Brazil

by
José Frédson Bezerra Lopes
1,2,*,
Fernando Bezerra Lopes
1,*,
Isabel Cristina da Silva Araújo
1,
Erich Celestino Braga Pereira
3,
Maria Letícia Stefany Monteiro Brandão
4,
Erialdo de Oliveira Feitosa
5,
Nayara Rochelli de Sousa Luna
6,
Geocleber Gomes de Sousa
7,
Aiala Vieira Amorim
8,
Bruna de Freitas Iwata
9 and
Eunice Maia de Andrade
1
1
Department of Agricultural Engineering, Federal University of Ceará, Campus Pici, Fortaleza 60455-760, Brazil
2
National Institute of Colonization and Agrarian Reform, Fortaleza 60441-750, Brazil
3
Technical Assistance and Rural Extension Company of Ceará, Baturité 61860-000, Brazil
4
Graduate Program in Ecology and Natural Resources, Federal University of Ceará, Campus Pici, Fortaleza 60440-900, Brazil
5
Department Agronomy, Federal Institute of Education Science and Technology of Amapá, Campus Porto Grande, Porto Grande 68997-000, Brazil
6
Municipal Secretary of Education of Fortaleza, Fortaleza 60170-173, Brazil
7
Institute of Rural Development, University of International Integration of Afro-Brazilian Lusofonia, Redenção 62790-000, Brazil
8
Department of Interdisciplinary Studies, Federal University of Ceará, Campus Pici, Fortaleza 60455-554, Brazil
9
Environmental Management, Federal Institute of Education Science and Technology of Piauí, Campus Teresina Central, Teresina 64000-040, Brazil
*
Authors to whom correspondence should be addressed.
Forests 2023, 14(9), 1870; https://doi.org/10.3390/f14091870
Submission received: 29 July 2023 / Revised: 6 September 2023 / Accepted: 11 September 2023 / Published: 13 September 2023
(This article belongs to the Special Issue Climate-Smart Forestry: Problems, Priorities and Prospects)

Abstract

:
In Brazil, logging in the Seasonally Dry Tropical Forest (SDTF) under management plans that include clear-cutting has increased in recent decades, and the structure, composition, diversity and functioning of the forest likely must have been affected. The aim of this study was to understand the growth dynamics of shrub–tree biomass (STB), species richness and vegetation structure as a function of regeneration time after clear-cutting (treatments), taking the Legal Reserve (40 years of regeneration) as reference. The study was carried out in 2018 at the Ramalhete Settlement, General Sampaio, in the state of Ceará. All plants with a circumference at breast height (CBH) ≥ 6 cm were identified and the CBH was measured across 42 sample plots (20.0 m × 20.0 m), using seven plots per treatment (3, 5, 8, 11 and 15 years after clear-cutting, and the Legal Reserve, 40 years of regeneration). The following were determined: STB (total and by species), density and basal area (by ecological group and diameter class), basal area (species of higher added value), diversity (Hill numbers), and the importance value index (IVI). It was found that during the early years (up to at least 11 years), many important forest characteristics related to the composition of the ecological groups and vegetation structure were strongly affected, and major impacts can be seen, the effects of which, however, decreased over time of regeneration, having almost no effect after 15 years. After 15 years following clear-cutting, the SDTF presented accumulated STB, species richness and structure similar to the area undergoing regeneration for 40 years. However, the small number of indicator species of more-preserved areas (even at T15 and T40) points out that management needs to be improved. However, promoting species of greater added value and determining whether the forest recovers its structure and diversity after successive cutting cycles also still need to be addressed.

1. Introduction

The dry ecosystems of the globe cover approximately 41.5% of its land surface, where around 2 billion people reside [1]. Seasonally Dry Tropical Forests (SDTFs) are part of these ecosystems and are present on every continent. The SDTF in Brazil, known as the Caatinga Phytogeographic Domain (CPD), is one of the largest in the world [2], with an area of approximately 844,453 km2 and a population of 27 million people. This domain, located in the northeast of Brazil, is the most populous semi-arid region in the world [3].
Over time, land use in this semi-arid region has resulted in a change in the vegetation of the SDTF, either by replacing it with conventional agriculture or planted pasture, through the use of itinerant agriculture, or even through the disorderly exploitation of forest resources. As a result, the current vegetation in this region comprises crop mosaics, regenerating forest stands of varying ages, and primary forests [4,5]. In these forested environments (both primary and secondary forests), chronic disturbances continue, as they are sources of various subsistence products, such as forage, firewood, wood and medicinal plants [6], resources that often undergo predatory exploitation.
The exploitation of timber resources through the use of management plans has been on the increase in the SDTF, especially since the year 2000, when the number of management plans in the forest jumped from less than 100 to around 900, with the occupied area showing a similar trend, going from less than 100,000 ha to approximately 580,000 ha [7]. It should be noted that the state of Ceará (where this study was conducted) alone accounts for more than 40% of these forest management plans (considering both active and inactive), rising to more than 60% when only active plans are considered [7,8].
For these management plans, the principal objective is to offer legalised timber products (mainly for energy purposes) to replace a significant part of what is currently consumed, whose origin is unknown, and exploitation is often predatory. In plans legalised by government environmental agencies, areas of forest (primary or secondary) with the potential to provide timber products (firewood, charcoal, and wood for fencing and sawmills) are divided into 15 sub-areas, with one sub-area exploited each year. The idea is to return to the first sub-area after 15 years (which is the usual cutting cycle), by which time it should already have regenerated and can again be submitted to fresh clear-cutting (the method of cutting employed). It should be noted that although the 15-year cycle is the most commonly used in current management plans, there is still no single criterion or consensus on the correct time to re-exploit a plot, the estimates being considerably different, varying from 8 up to 20 years [9].
In general, the forest management developed in the SDTF does not aim at specific forest products of greater added value, such as wood for fencing or for sawmills, having mainly sought to obtain the maximum possible amount of woody biomass. This type of management, therefore, is different from that of other forests, i.e., selective cutting in the Amazon rainforest in Brazil, where only specific trees were harvested [10], or rotation in the Ocotones forest in southern Mexico, which involves clear-cutting and thinning in cycles of 50 to 60 years [11]. Adapting the management currently adopted in the SDTF to promote products of greater added value may be one alternative, where a higher income from an activity depends on including more of the most-valued species [12]. The long-term effects of this type of management (especially by the invasive method—clear-cutting) on the overall biodiversity and on the diversity of trees and other organisms also need to be determined through research in this tropical dry forest.
The scarcity of such research in the SDTF also reflects what can be seen on a global level, where more attention is given (promotion and research) to tropical moist forests. In a comparison based on the ‘ISI Web of Science’ and ‘Google Scholar’ of reviewed scientific articles on tropical dry forests versus tropical moist forests, it was found that the number of publications focusing on the dry biome is 3.6 times smaller [13]. Even so, for some time now, more effort has been put into the search for knowledge, improvement and adaptation to a more balanced coexistence with the conditions inherent to the SDTF [14,15,16,17,18,19,20,21,22]. Some studies, however, only highlight aspects of certain forest physiognomies [23,24], while others address regeneration and/or succession [4,5,25,26,27,28,29]. Studying this environment continues to be urgent since, among other aspects, it will be adversely affected by ongoing climate change [30] while at the same time undergoing greater pressure on its natural resources.
Disordered land use has been associated with advances in the processes that reduce the forested areas of the SDTF [31], adversely affecting the quality of surface water resources in artificial reservoirs [32,33,34], the main source of water in the region. On a global scale, areas of tropical forest are now smaller with reduced structural complexity and species richness and occupy steeper terrain than they did half a century ago [35]. These primary tropical forests show increasing levels of deforestation and degradation, which are associated with conversion to agropastoral use, unregulated logging, forest fires and mining, requiring effective governance to change this situation [35,36]. However, some areas that were previously devastated have regenerated over the last 20 years. Examples include areas of the Atlantic Forest in Brazil and the boreal forests in northern Mongolia [37]. Other regions, such as Central America and Oaxaca, Mexico, have also tried forest regeneration [38]. During the same period, Russia, Canada and the United States recorded more than half of the world gains in vegetation cover despite losing more trees than they gained, while in some European and Asian countries, the balance was positive [39]. It should be noted that the expansion of secondary forests cannot conceal the continuous destruction of primary forests [40].
In regenerating stands under chronic disturbance, changes have been seen in the composition of the plant community, leading to a reduction in species diversity in the SDTF [41,42] and in areas of the Miombo dry tropical forest in Africa [43] and the neotropical dry forest in Argentina [44]. The intensity of the disturbance, caused by the different land use histories, most likely results in a varying capacity for soil response, considered a key factor in forest regeneration [45,46]. However, in a study on succession and resilience in sandy soils in the SDTF, it was found that regenerating forests were taxonomically, functionally and phylogenetically similar to primary forests [5]. The authors added that this pattern, therefore, showed high forest resilience, at least in some locations, while others apparently experienced interrupted succession, although it should be noted that studies in the SDTF [5] did not consider areas under forest management.
Despite research indicating that areas of the SDTF under regeneration may present similar values to primary forests [5], greater resilience is probably restricted to places with a high abundance of stump and/or root regrowth [46]. Any type of forest management implies changes in species richness and biodiversity, which may have consequences on a regional scale [11]. The occurrence and magnitude of these consequences in areas of the SDTF under clear-cutting management are still unknown. On the other hand, there is consensus on the current interest in ensuring that the exploitation of forests does not permanently affect ecosystem processes [10]; it is necessary to fully understand the effects of logging on the composition, structure and diversity of the forests [47].
Therefore, considering what little is known about the effects of logging on areas of the SDTF under forest management, where exploitation is extremely invasive (normally, only a few preserved species are protected from cutting), the question is, to what extent extracting wood under clear-cutting affects the regeneration, diversity and structure of tree-like vegetation in the SDTF. Based on the above, the following hypothesis was proposed: within 15 years of clear-cutting, regenerating vegetation lacks the same tree–shrub biomass, species richness and phytosociological parameters as the vegetation of a legal reserve that has been under regeneration for 40 years. Based on the above, the aim was to understand the growth dynamics of the shrub–tree biomass, species richness and vegetation structure as a function of regeneration time in an area under SDTF management planning subjected to clear-cutting.

2. Materials and Methods
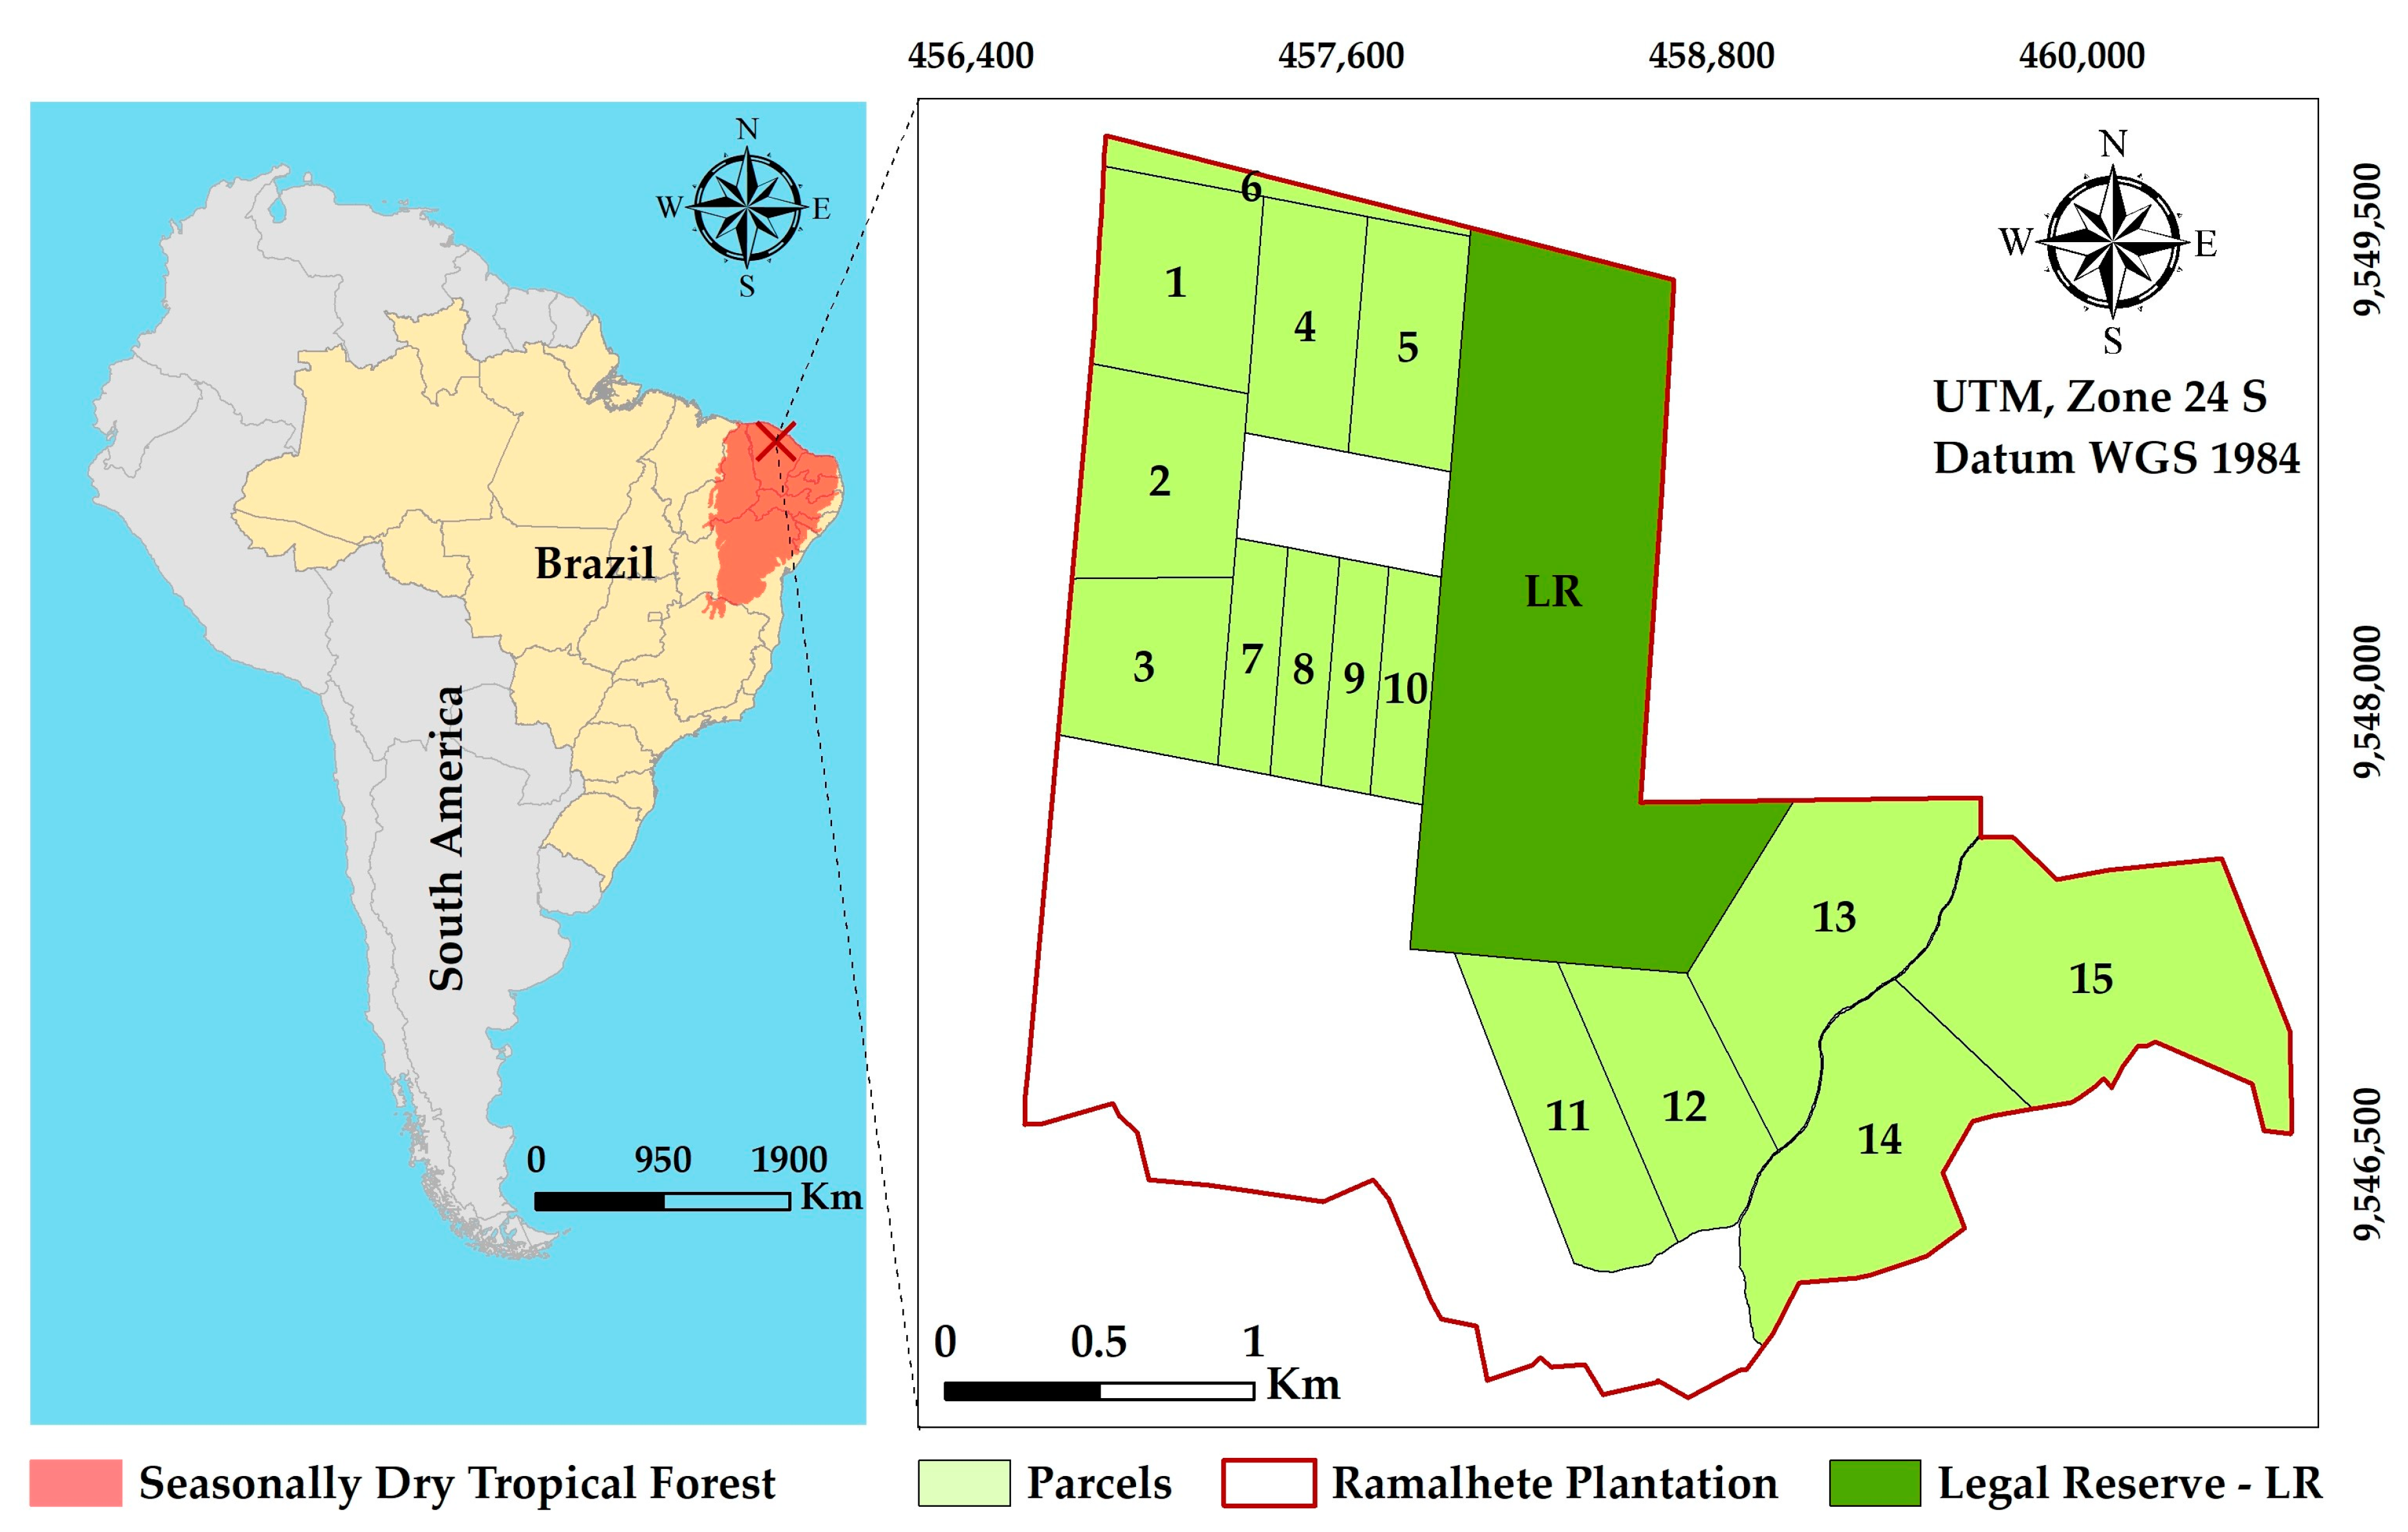
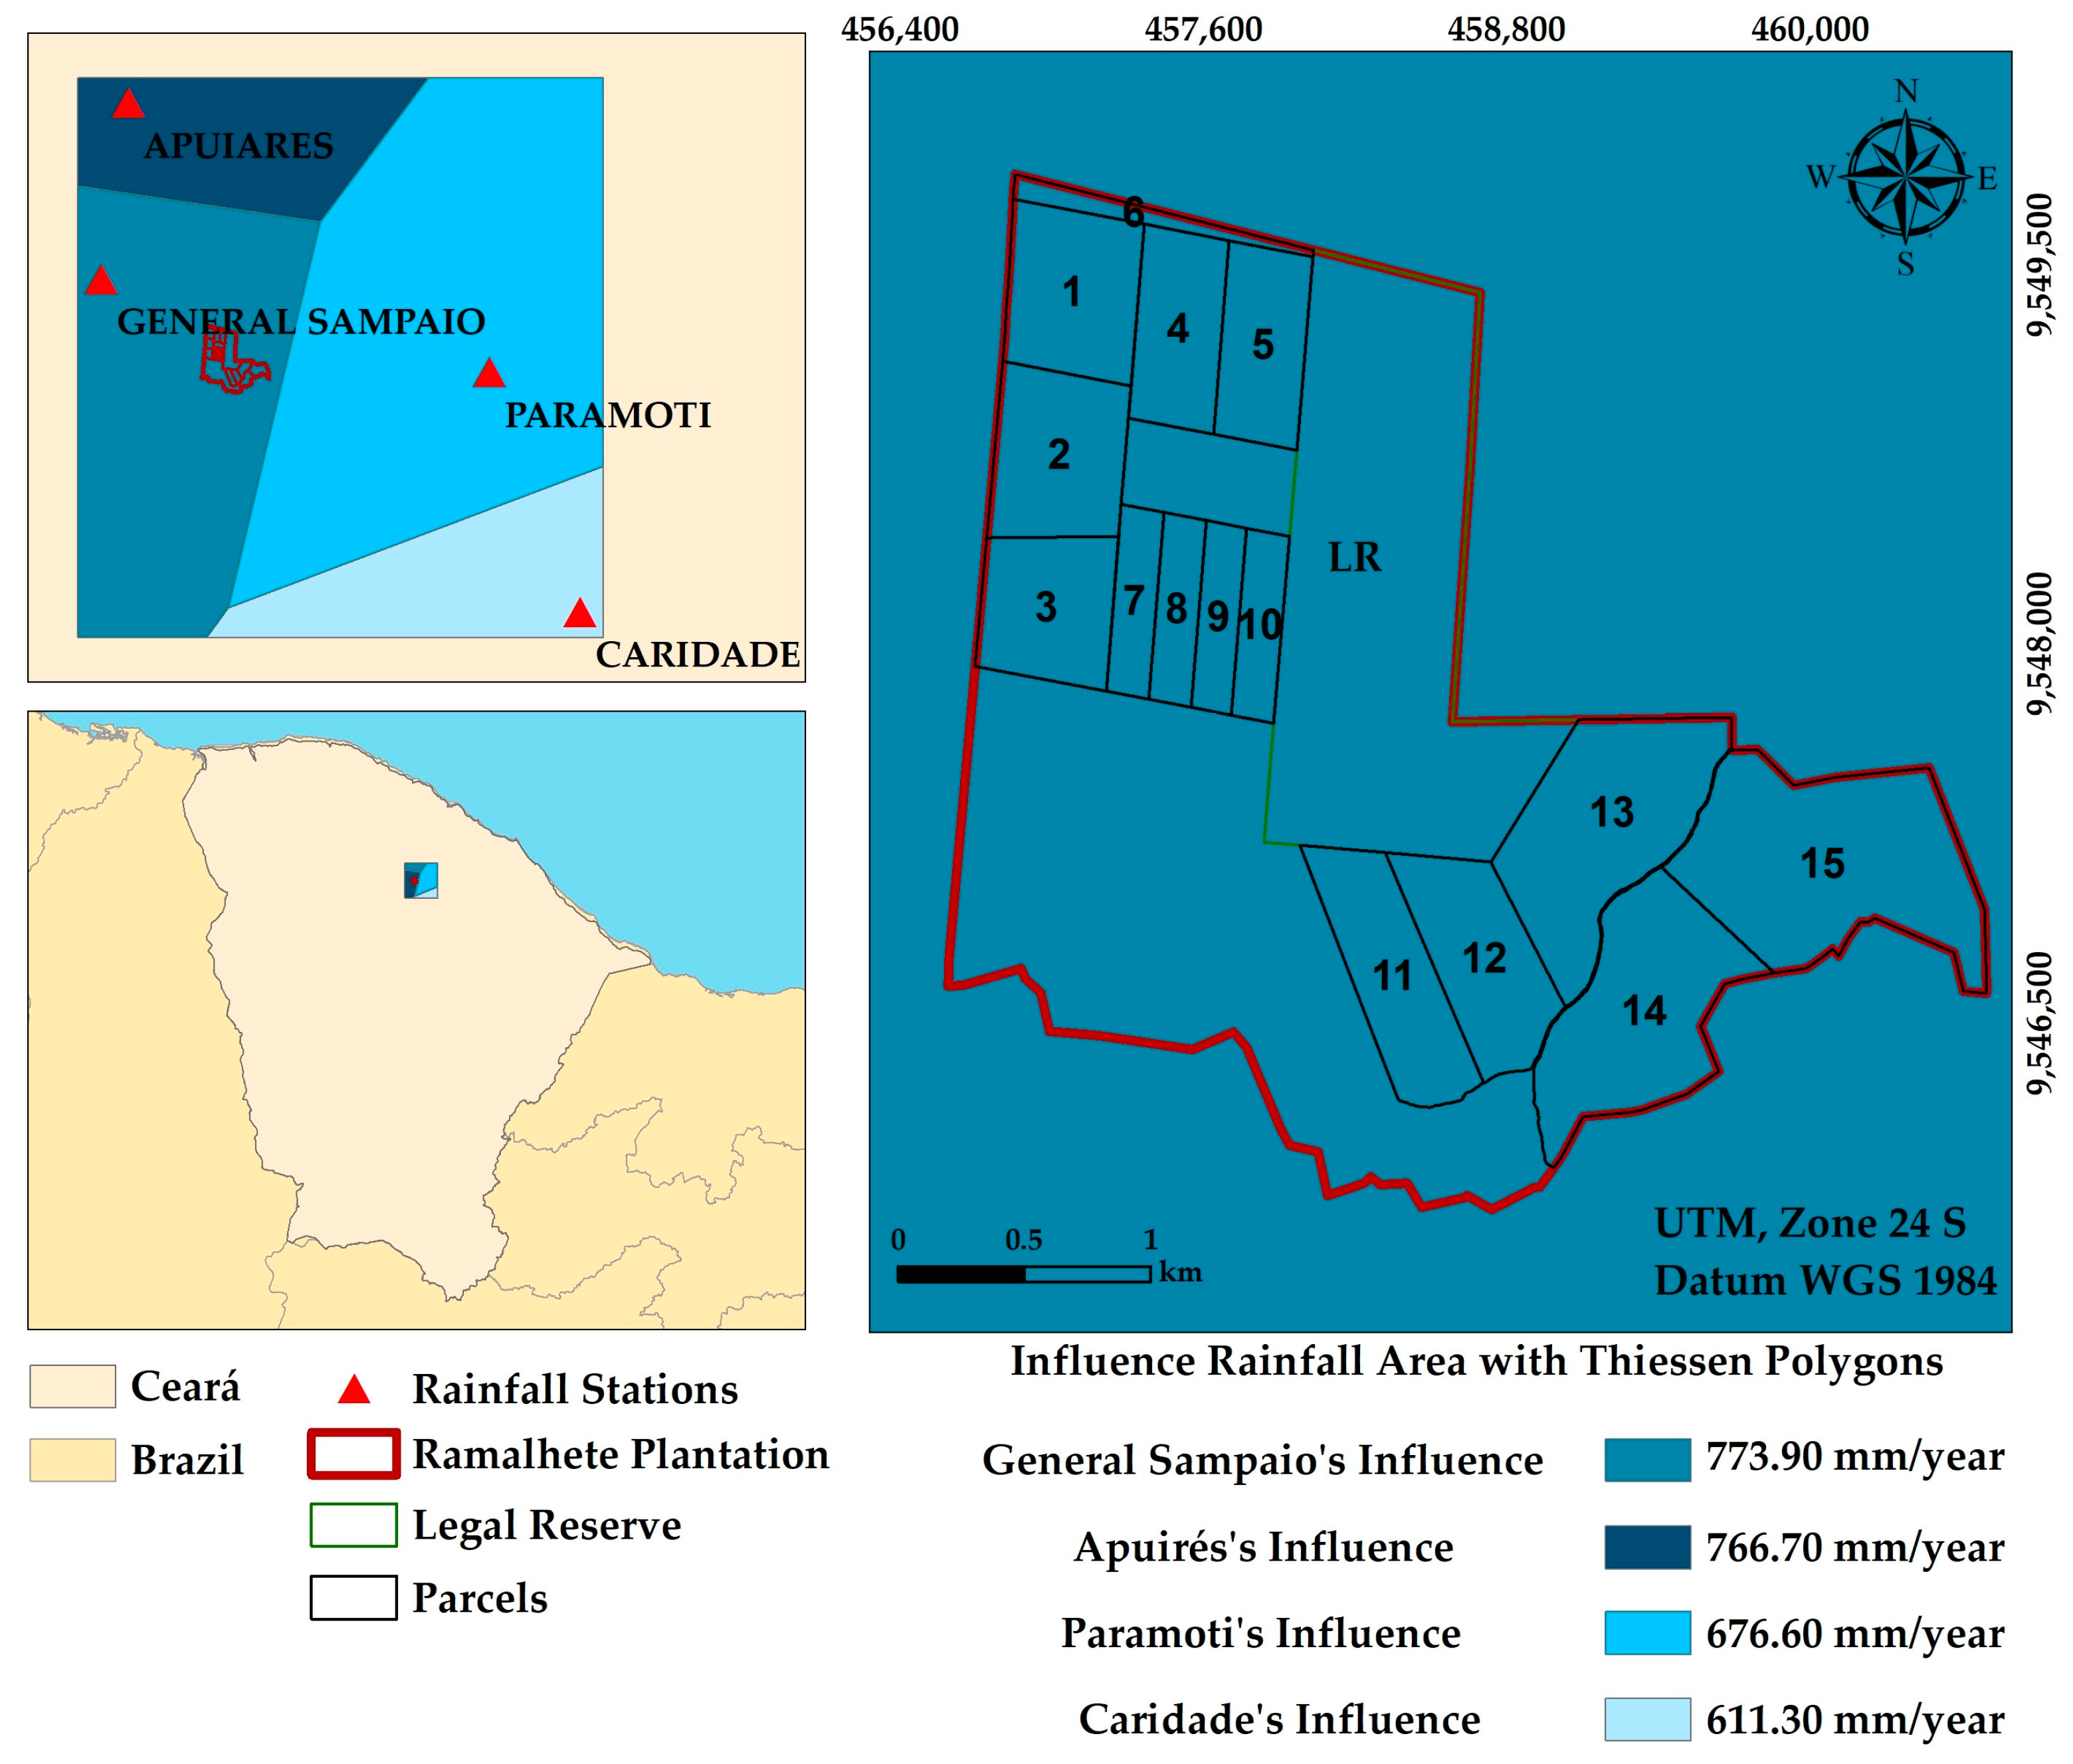
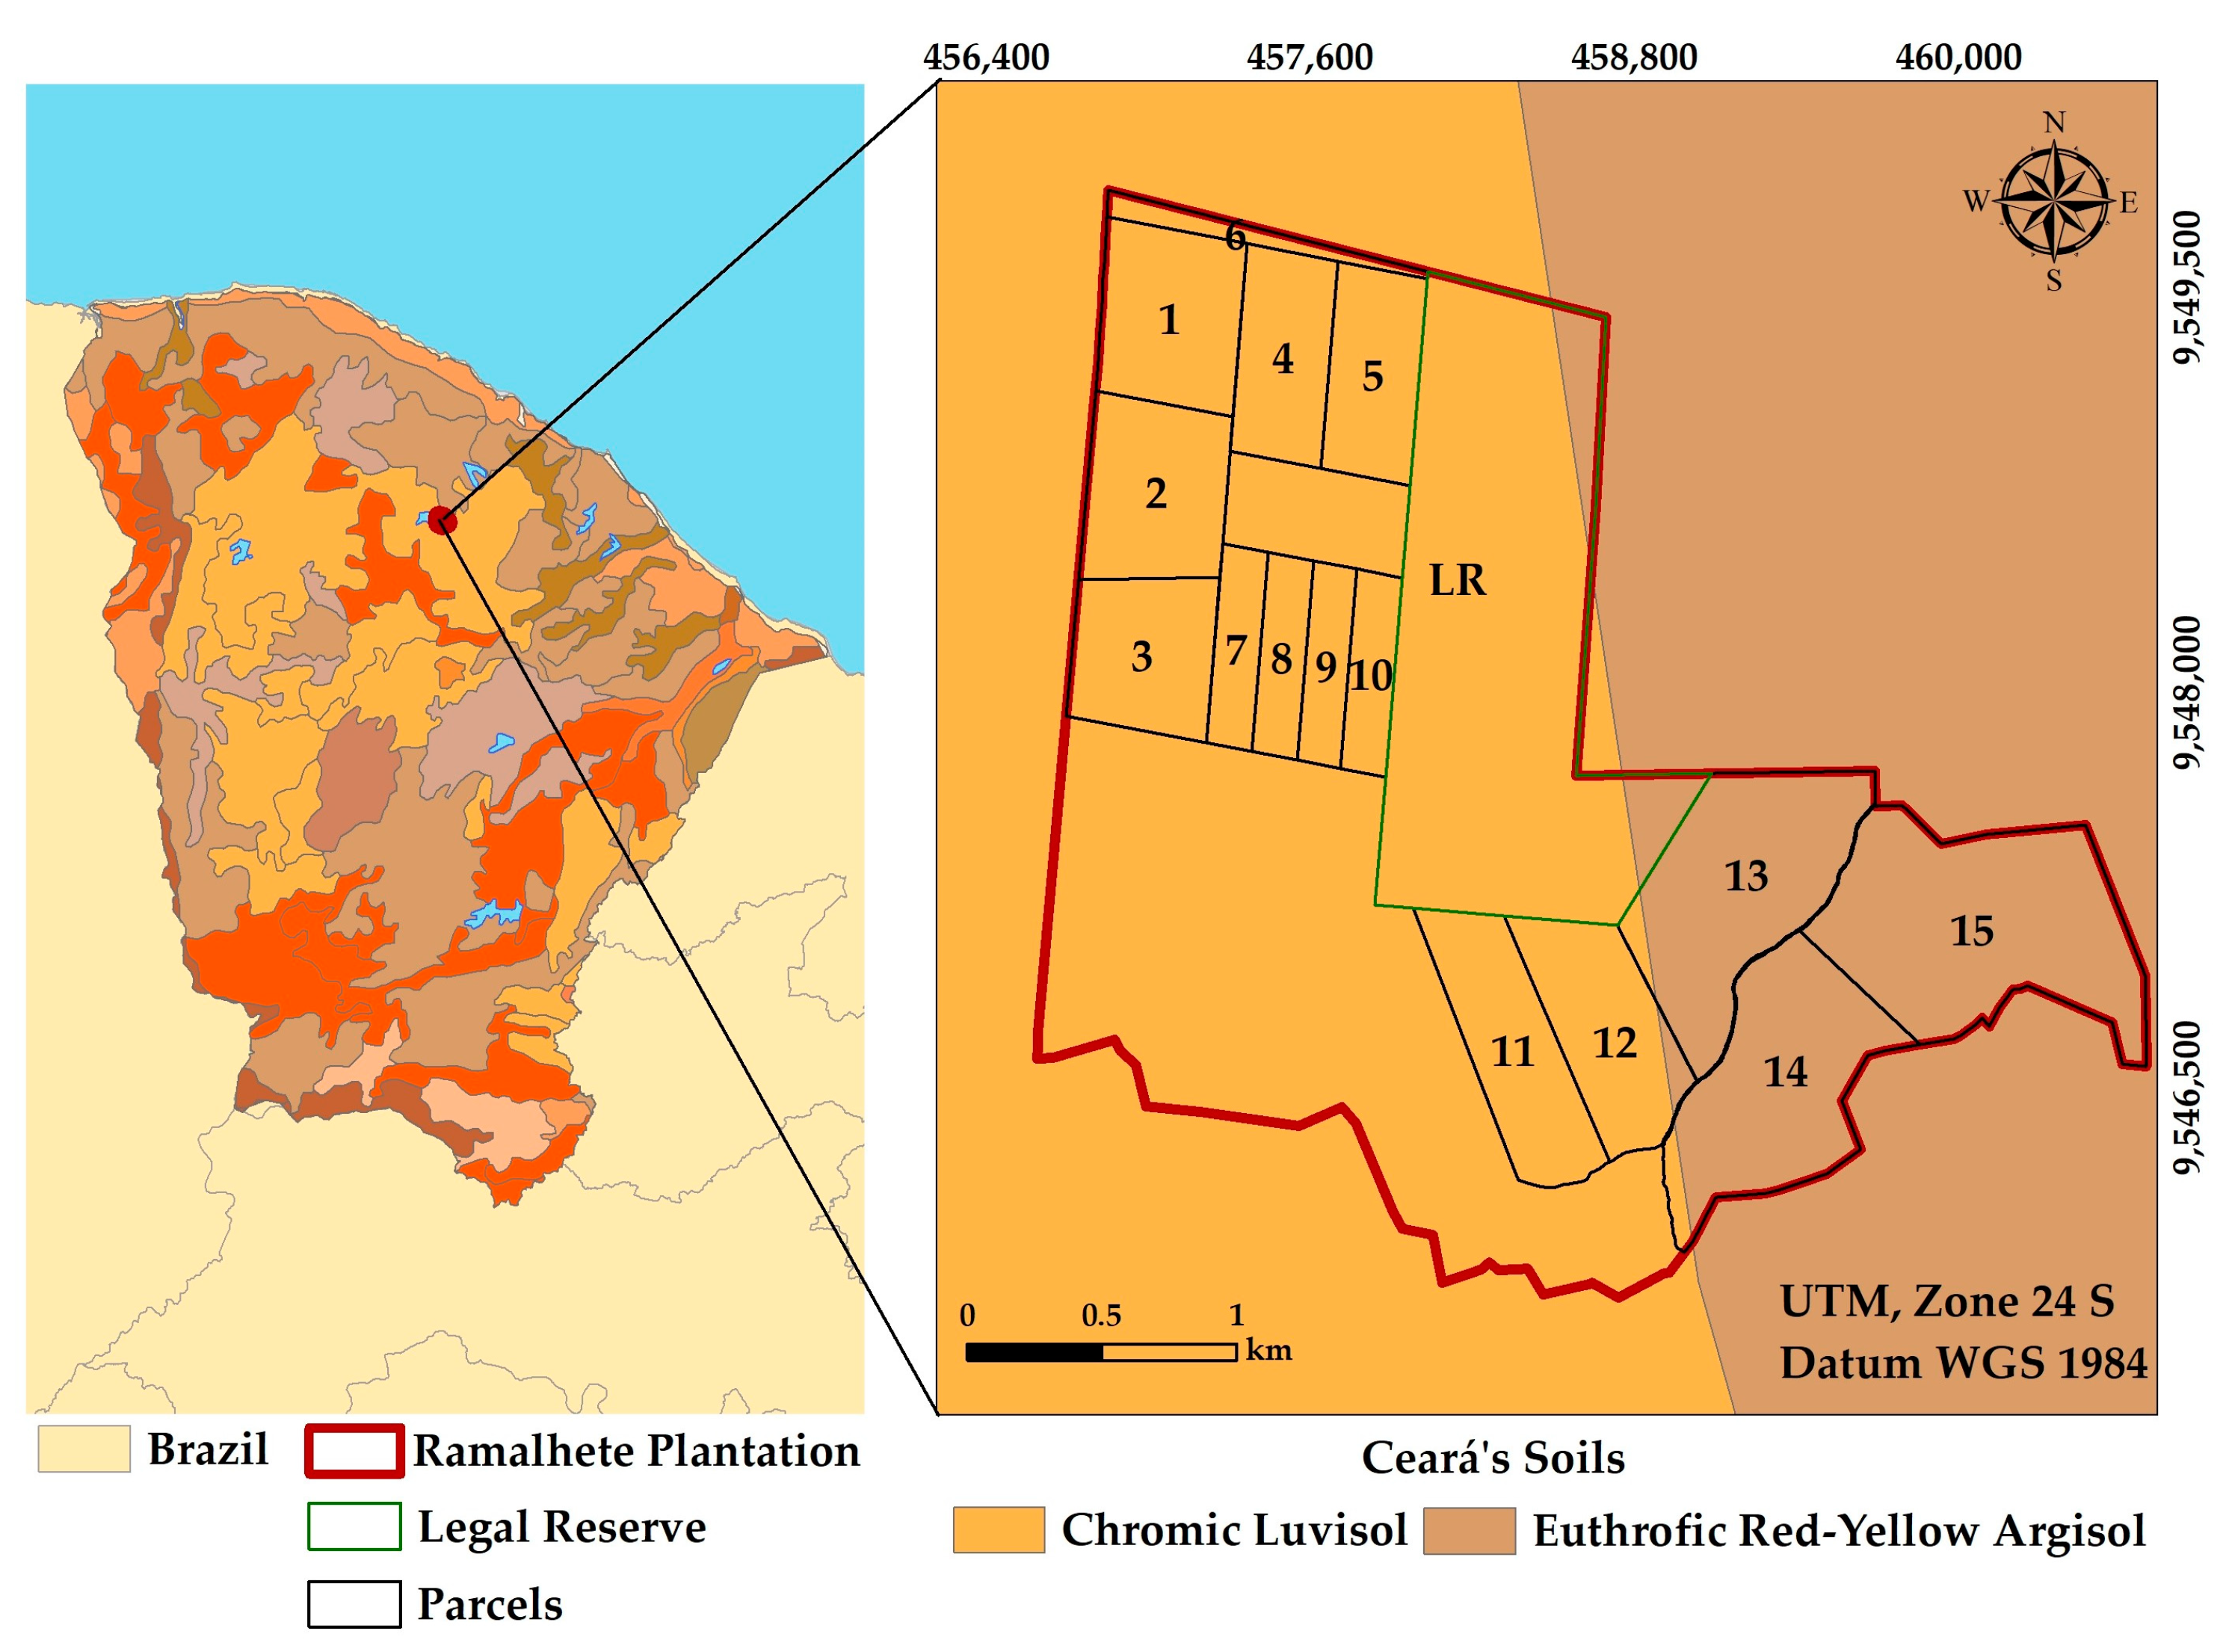
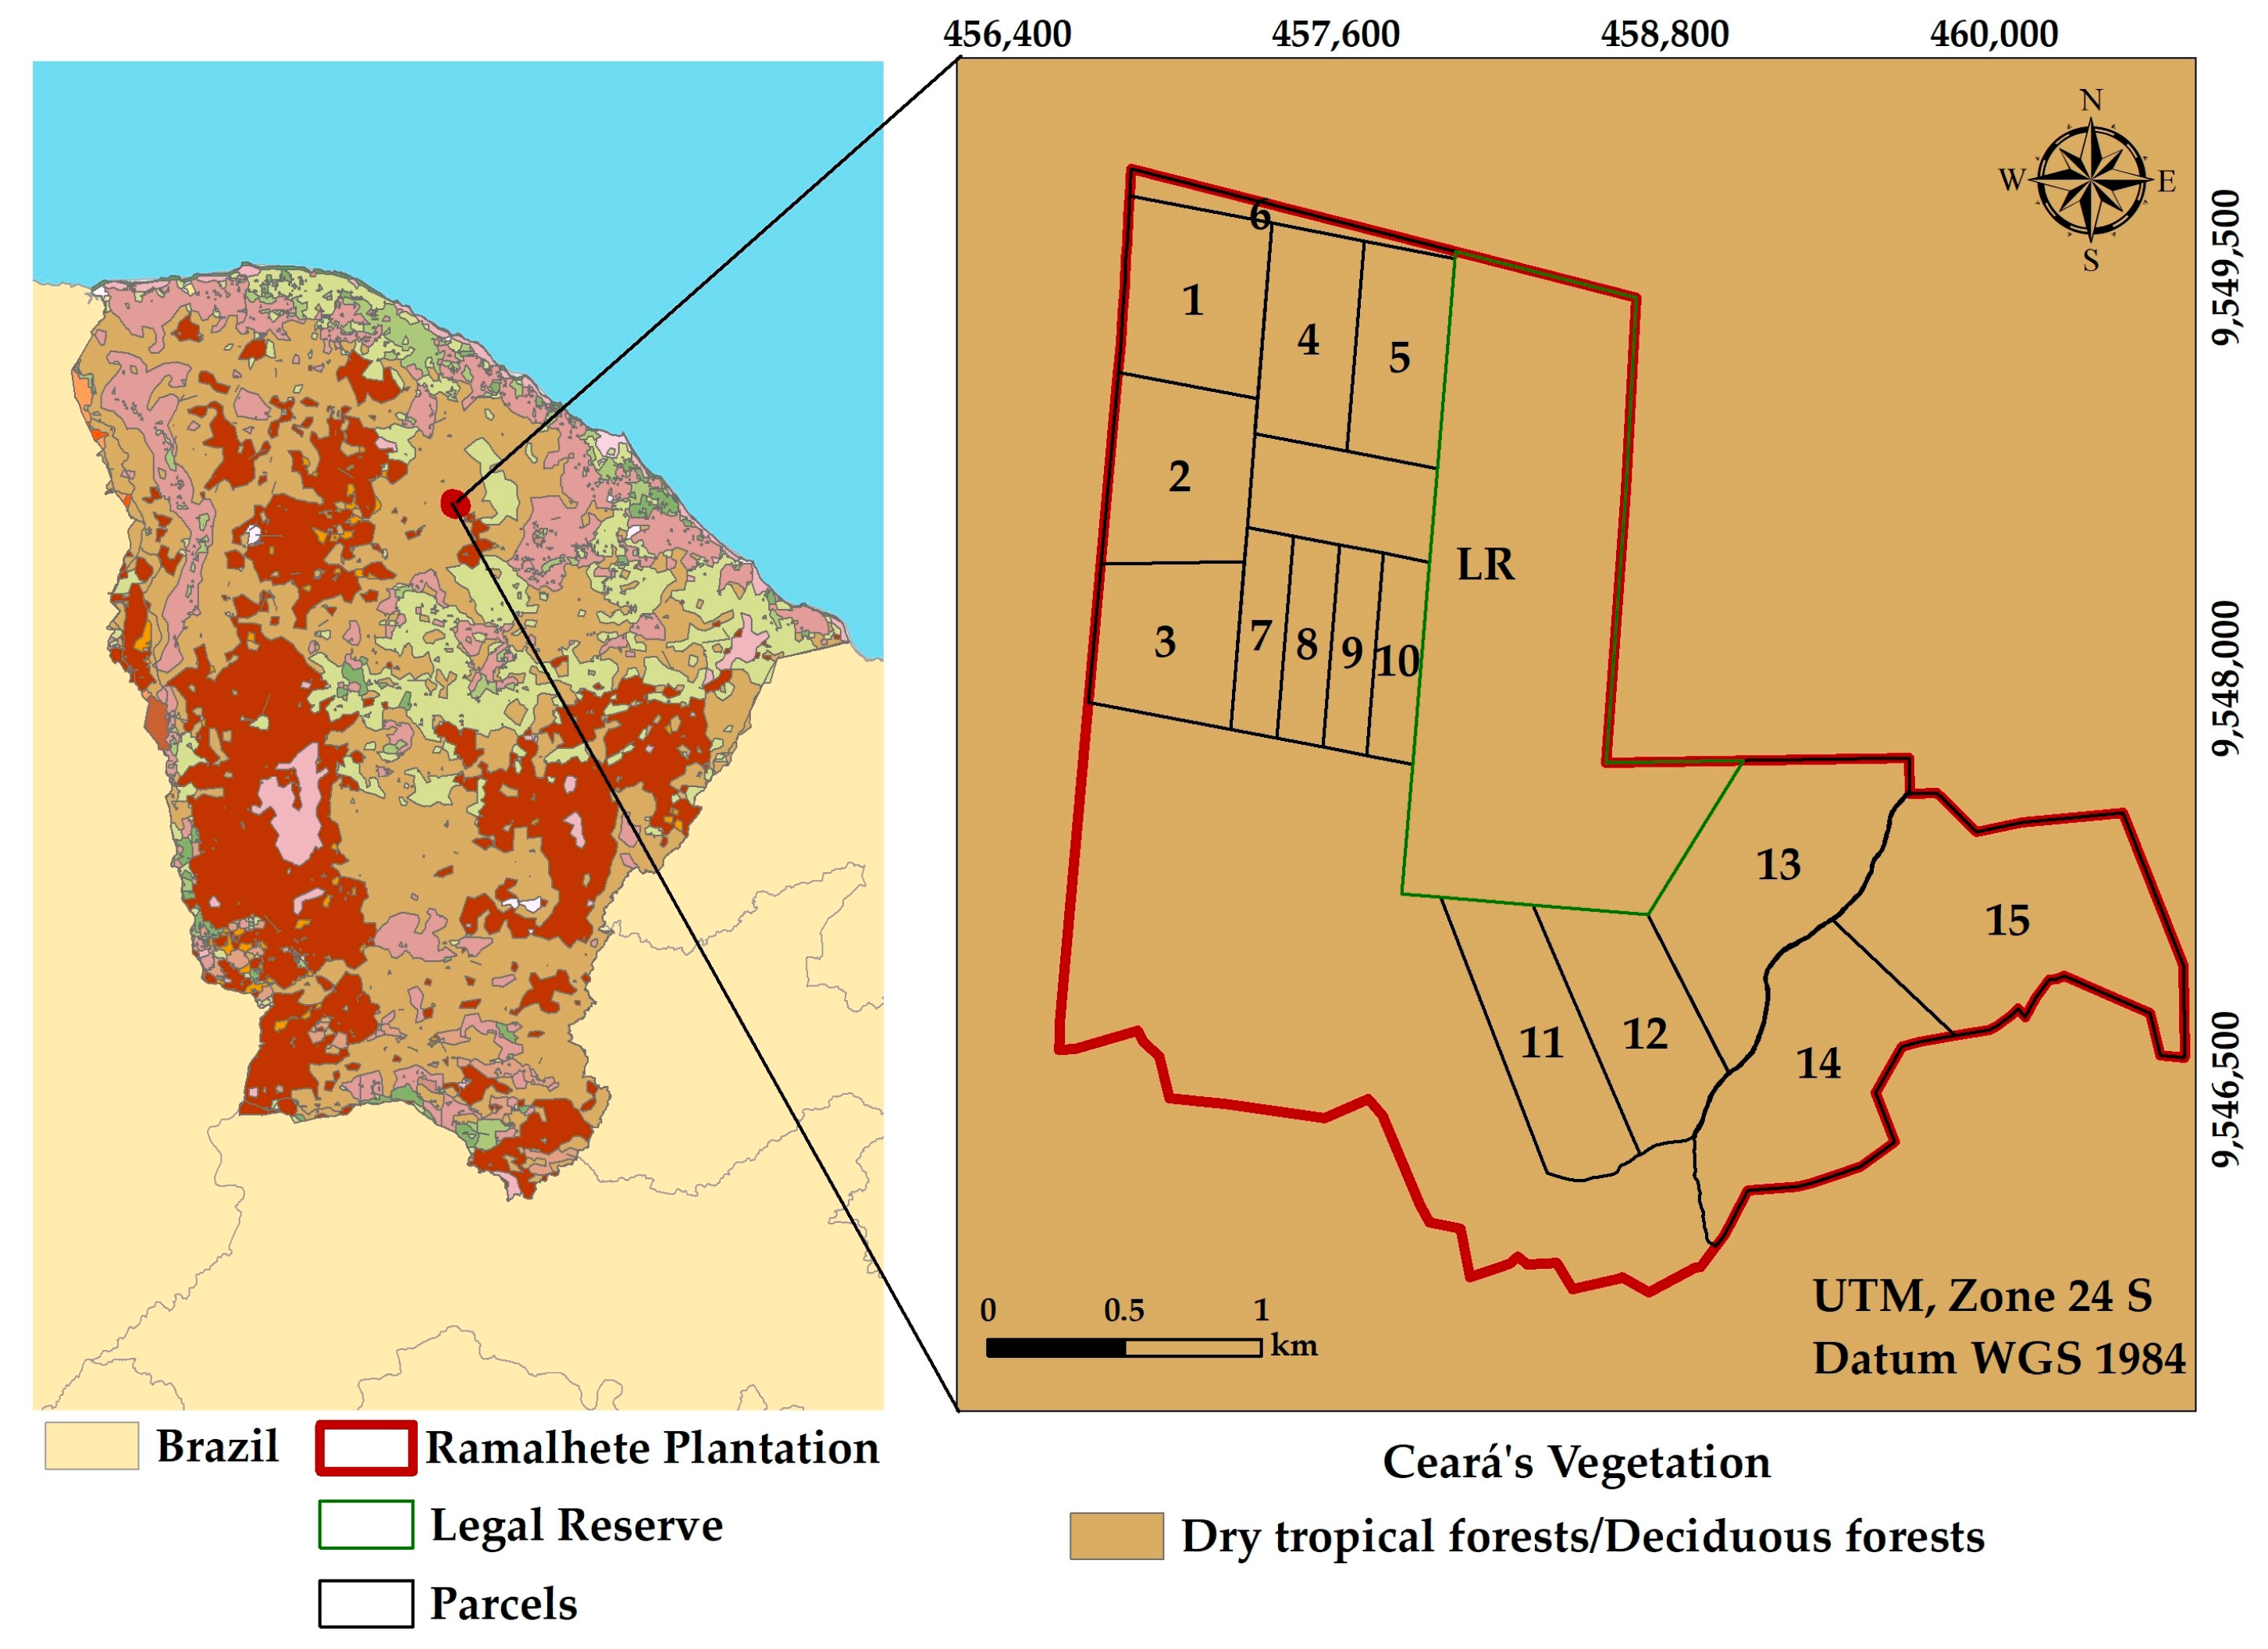
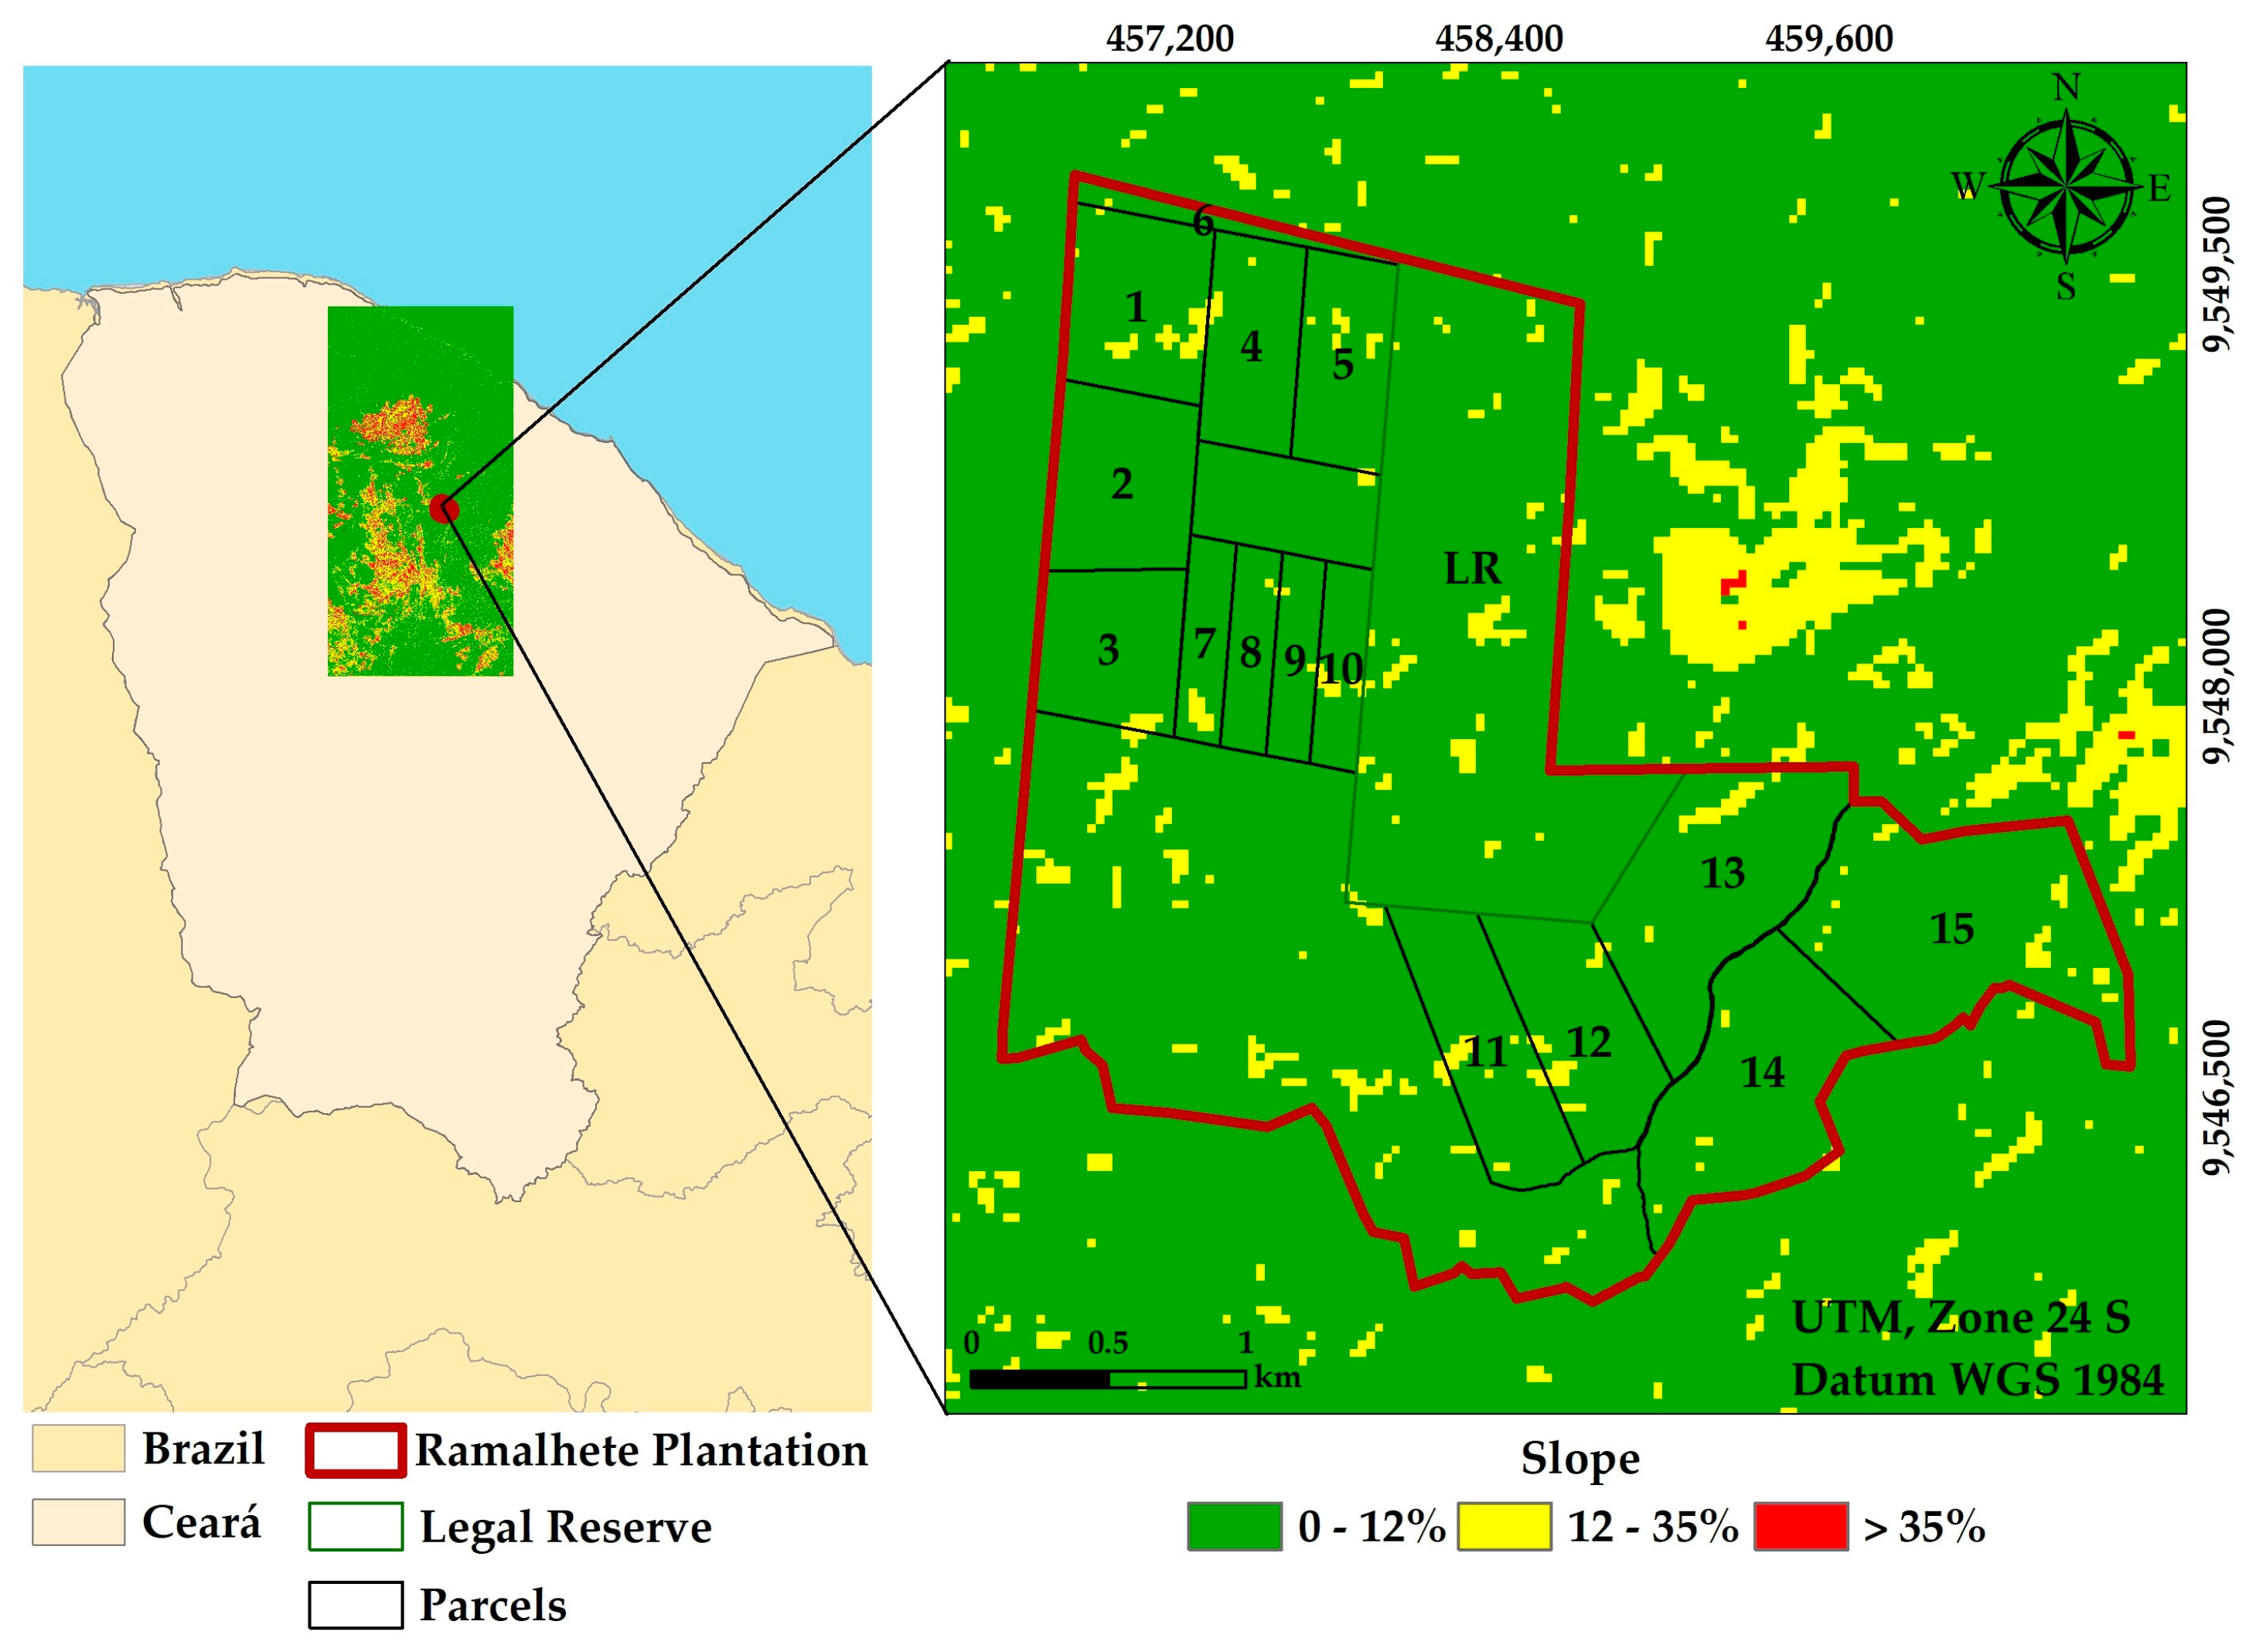
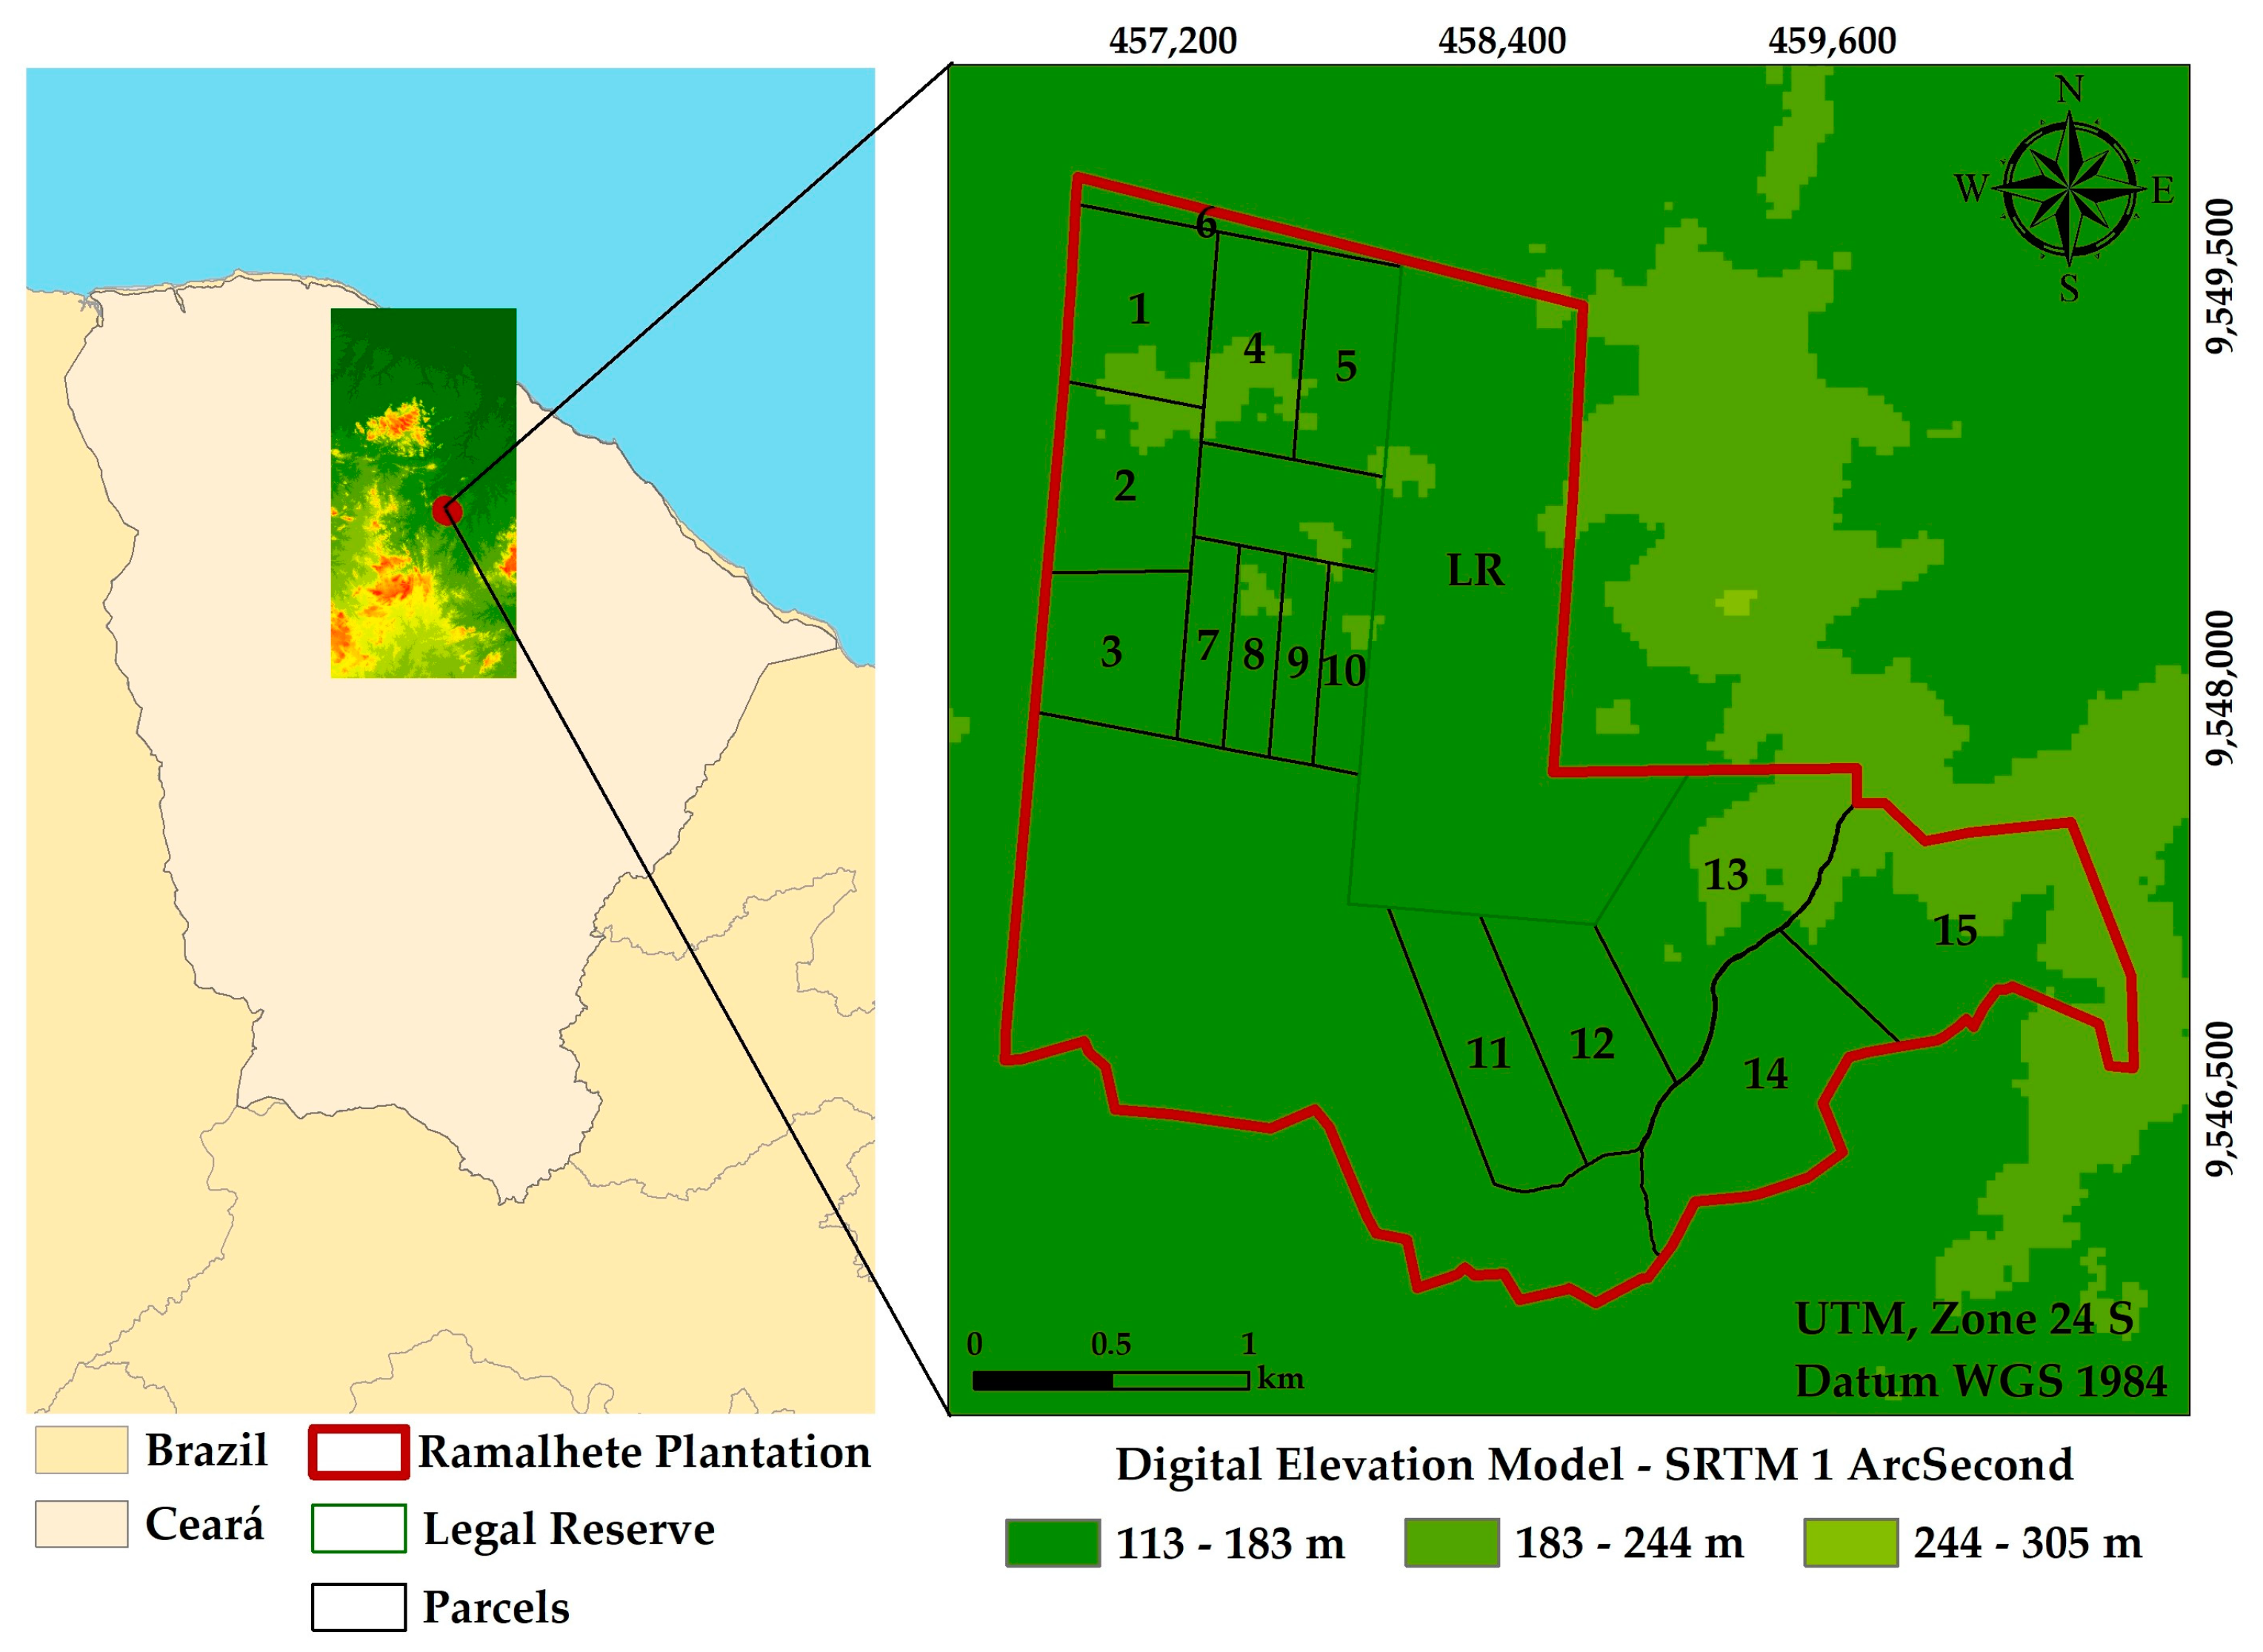
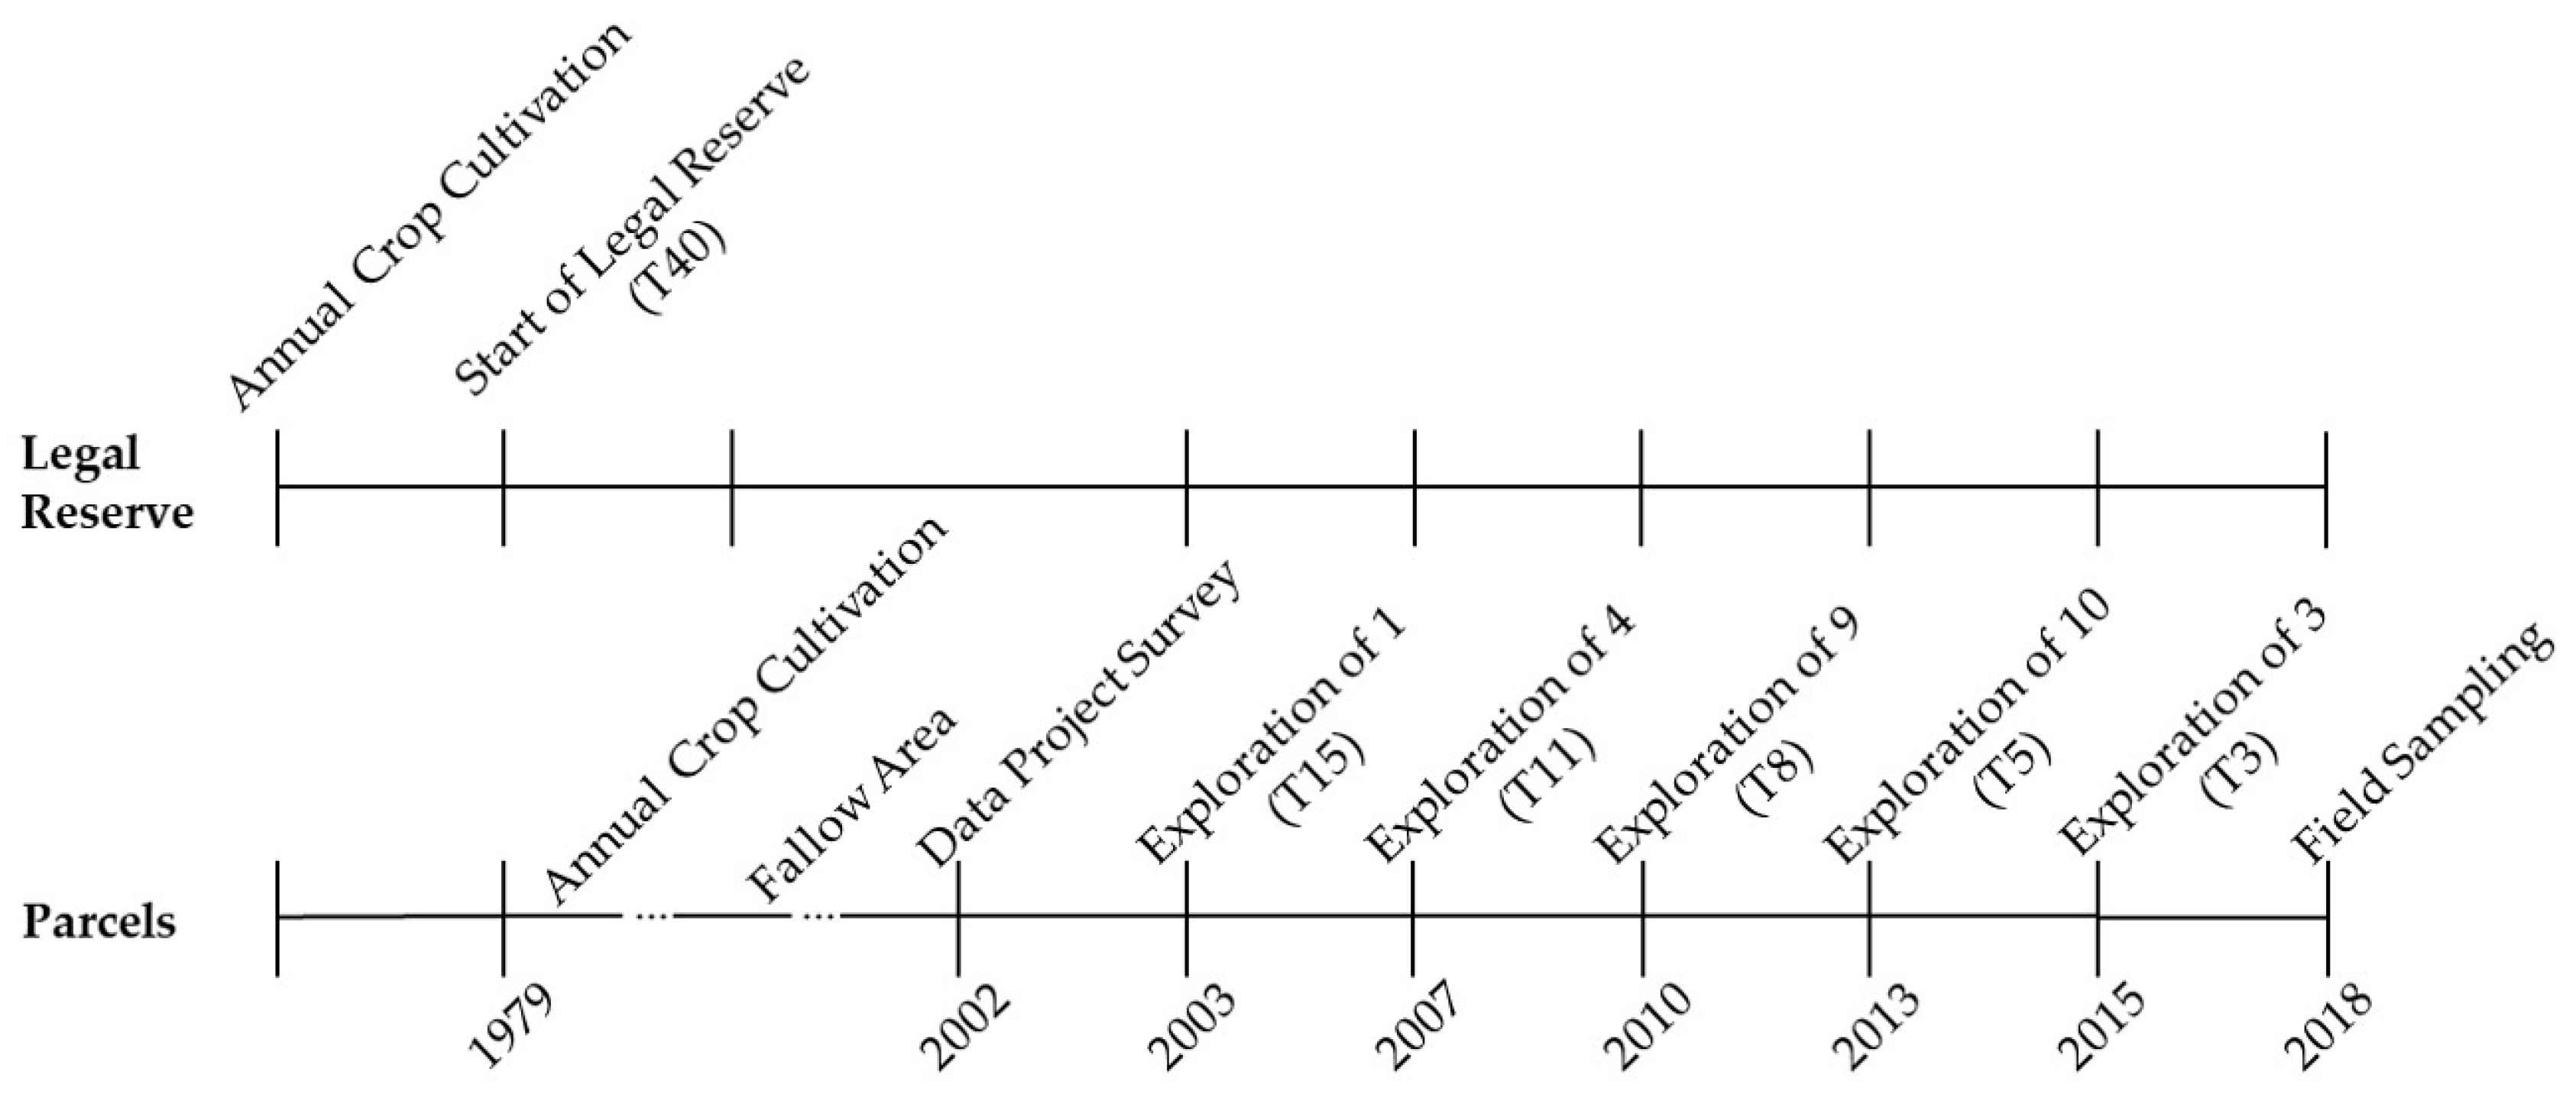
2.1. Study Area

The study was carried out in 2018 in an area under the agrosilvopastoral forest management plan under clear-cutting, inserted in the Ramalhete Settlement Project in the district of General Sampaio, Ceará (Figure 1). The settlement has an area of 890.10 ha, of which 431.23 ha are allocated to the management plan and another 178.22 ha to the Legal Reserve. Forest management began in 2002.
According to the Köppen classification, the climate in the region is of the hot semi-arid type (BSh’w’), with an average monthly temperature greater than 18 °C, predominant rainfall in the autumn, with an average of 773.9 mm (Figure 2), potential evapotranspiration of 1556.39 mm and aridity index of 0.49 [48]. The region presents rainfall of high spatial and temporal variability [17,49]. The predominant soils are Planosols, Luvisols and Argisols, and the vegetation is characterised as dense shrub–tree caatinga [50].
To identify the similarity between the legal reserve and the plots studied (Figure 1), we developed maps of the following parameters: annual rainfall depth [48] (Figure 2), soil classification [51] (Figure 3), cover vegetation [52] (Figure 4), slope [53] (Figure 5) and altitude [53] (Figure 6). The areas presented the same parameters, being, therefore, homogeneous.
The historical timeline of the study area (Figure 7) shows the land being used before the beginning of the Legal Reserve, as well as the year in which the Legal Reserve was created, the year the forest management project began, and the dates of the interventions in each of the sampled plots.
Legal Reserve—LR: an area that had been undergoing regeneration for 40 years. Earlier, the vegetation had been cut (drilled), and maize, beans and cotton were planted. This area is used for grazing cattle, sheep and goats, albeit with no overgrazing, according to the residents.
Areas undergoing regeneration: areas that were undergoing regeneration for 3, 5, 8, 11 and 15 years. In 2002 (when the forest management plan was created), these presented an average of 42.00 Mg ha−1 of shrub–tree biomass—STB [25,50]. These areas were submitted to clear-cutting on the dates shown in Figure 7, all the wood that could be processed to produce charcoal having been extracted. The cut was made approximately 30 cm from the ground (height of the stumps), with the residue (branches) distributed in ridges over the area [25,50,54]. From the third year after clear-cutting, the areas are also used for grazing cattle, sheep and goats [50], with, according to the residents, no overgrazing.

2.2. Sampling the Vegetation

Seven sample plots (repetitions), each of 400 m2 (20.0 m × 20.0 m), were marked out in each area and in the LR, as per [55], making a total of 42 plots. The number of plots was defined based on the collector’s curve [56]. The predominant normalised vegetation index (NDVI) in each treatment was used to randomly locate the plots.
In each sample plot, the circumference at breast height (CBH—circumference at 1.3 m from the ground) of all living and dead individuals (still capable of being used as an energy source) with CBH ≥ 6 cm was measured with a tape. Each individual was taxonomically identified to the species level, with the exception of three species, which were noted as unknown. The shrub–tree biomass (STB) of each plant was determined using Equation (1) [15] and converted into Mg ha−1. For multi-stem trees, the equivalent diameter was first calculated (DBH equivalent = square root of the sum of squares of the CBHs) [55].
STB = 0.173 × DBH2.295
where: STB—shrub–tree biomass of each tree (kg); DBH—diameter at breast height (cm).
In the area covered by this study, the species Miracrodruon urundeuva, Amburana cearensis, Sapium lanceolatum, Commiphora leptophloeos, Ziziphus joazeiro and Libidibia ferrea were protected from cutting [50]. Normally, in areas under a forest management plan, species of low density, frequency and volume are preserved. These plants serve as seed carriers and carry out other ecological functions.
The individuals were categorised into three ecological groups: pioneer, early secondary and late secondary, a classification that is related to the ecophysiology of the species, including their structural characteristics, dispersion syndrome and nutritional requirements, one of the main factors being the light demand of the species. Individuals were also categorised into four diameter classes based on converting the CBH into the diameter at breast height (DBH): 2–4.99 cm, 5–7.99 cm, 8–14.99 cm and >15 cm. These classes, which appear in the project that established the creation of the forest management area [50], are related to the possible specific uses that certain species may have upon reaching the larger classes.
The density of live and dead individuals (individuals ha−1) was calculated from the number of sampled plants and the area of the plots. The basal area of the living individuals was obtained (m2 ha−1) from the area of the plots and the DBH of each plant. From these data, the mean density and basal area were determined per ecological group and diameter class for all the species in each treatment. The importance value index (IVI) was then calculated for each shrub–tree species in each treatment (Equation (2)) [57].
IVI = (DeR + DoR + FrR)/3
where: DeR—relative density; DoR, relative dominance (based on basal area); FrR, relative frequency (based on the presence of each species in the seven plots of each treatment).

2.3. Analysis

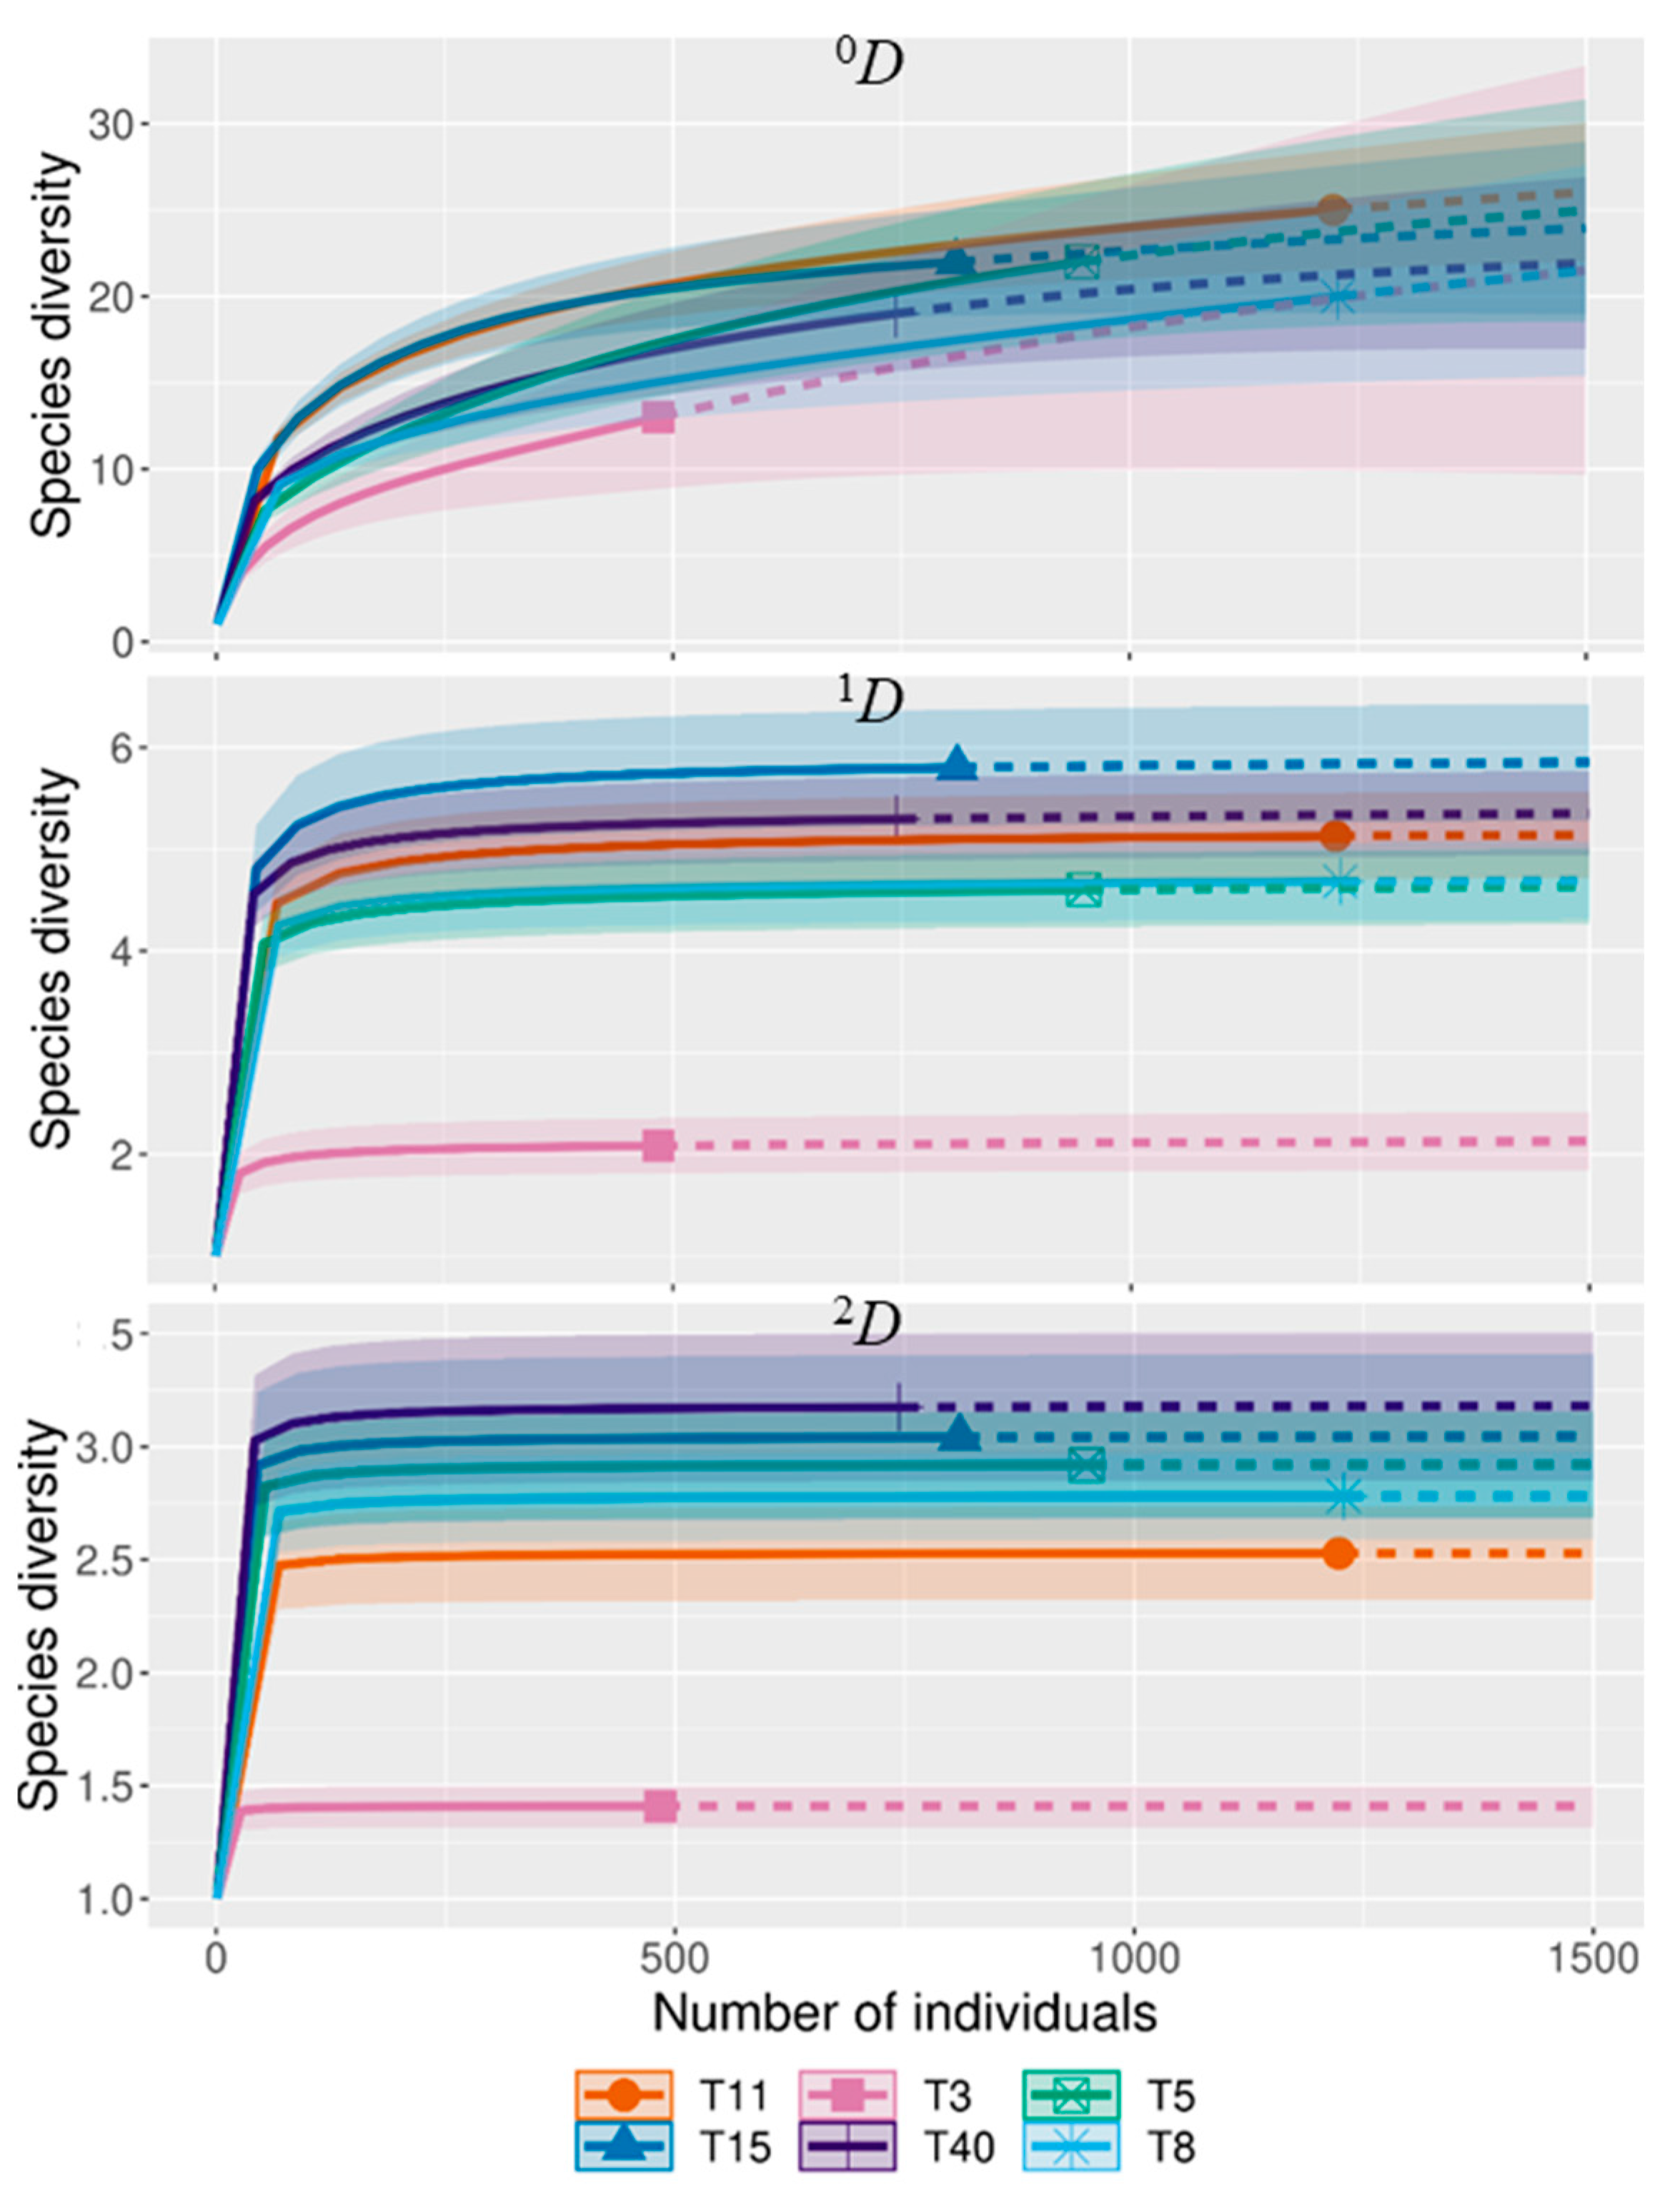
2.3.1. Species Diversity between Treatments

To assess the diversity of shrub–tree species between treatments, a methodology was used that employs species abundance to obtain three diversity parameters, represented using Hill numbers [58]: 0D, species richness (effective number of species); 1D, common species (equal to the exponential of the Shannon diversity index); 2D, dominant species (equal to the inverse of Simpson’s diversity index) [59]. According to the authors, the inclusion of these three measurements, represented using the true values for species diversity, considers different degrees of importance for the relative density of each species to thereby determine ecological processes in the communities. The concept underlying this classification is that a reduction in the ‘q’ parameter is capable of determining the diversity of infrequent (less common) species, while an increase in the ‘q’ parameter would be capable of determining the diversity of groups of dominant species, and can be calculated by the equation:
q D = i = 1 s p i q 1 1 q
where: s = number of species; pi = relative density and q = is the parameter that determines sensitivity for the relative species density.
True values for diversity were obtained using the rarefaction (interpolation) and extrapolation (prediction) methods. These methods avoid problems with bias in estimating species diversity, which may arise when the numbers of individuals between treatments are different. Using this method of standardisation generates species accumulation curves with a confidence interval of 95% that are calculated using the bootstrapping method so that species diversity can be quantified and visually compared in multiple assemblages [60]. The analysis was carried out using species abundance data per plot within each treatment. The iNEXT package (https://chao.shinyapps.io/iNEXTOnline/, accessed on 26 June 2023) was used in the analysis.

2.3.2. Differences between Treatments

Statistical analysis of the other variables was carried out using an experimental arrangement comprising completely randomised blocks, with six treatments: five plots undergoing regeneration (T3, T5, T8, T11 and T15) and the Legal Reserve (T40), with seven repetitions. Average values ± standard error are shown for each treatment. For the variables STB, total density, density by ecological group (pioneer) and total basal area, whenever the sample data presented a normal distribution (Shapiro–Wilk test), an analysis of variance (ANOVA) was carried out, with the mean values compared by Tukey’s test (p ≤ 0.05). For variables without normal distribution, the Kruskal–Wallis test was applied (p ≤ 0.05), namely: density of dead individuals, density by ecological group (early secondary and late secondary), density by diameter class (2–4.99 cm, 5–7.99 cm, 8–14.99 cm and >15 cm), basal area by ecological group (pioneer, early secondary and late secondary), basal area by diameter class (2–4.99 cm, 5–7.99 cm, 8–14.99 cm and > 15 cm), basal area of individuals suitable for posts and basal area of individuals suitable for sawmills and/or civil construction. All the statistical analyses were carried out using the SPSS 16.0 software for Windows.

3. Results

3.1. Species Composition and Diversity

A total of 5437 individuals (shrubs and trees) with a CBH > 6 cm were found in the 42 plots of the treatments, distributed as follows: 484 in T3, 948 in T5, 1228 in T8, 1223 in T11, 810 in T15 and 744 at T40 (Table S1). These individuals represented 34 species (Table 1 and Table S1). No significant difference was found in species richness (0D) between treatments, where the number of observed species were 0DT11 = 25, 0DT15 = 23, 0DT5 = 22, 0DT8 = 20, 0DT40 = 19, 0DT3 = 13 (p > 0.05; Figure 8).
Among the 34 species, 10 belonged to the pioneer ecological group, nine to the early secondary group and eight to the late secondary group. For seven species, it was not possible to determine the ecological group. The highest number of species in the pioneer group was seen in treatments T5 (8) and T15 (8), while the highest number of species in the early (8) and late secondary (6) groups was seen in T11. In percentage terms, T3 had more species from the pioneer group (54%), while the greatest percentage of early and late secondary groups, 37% and 26%, respectively, were seen in T40 (Table 1 and Table S1).
The richness of observed species (0D) did not differ between treatments (p > 0.05) (Figure 8). In terms of the most common species (1D), however, it was found that T3 was significantly lower (p < 0.05) than the other treatments (T5, T8, T11, T15 and T40), with no difference between these treatments (p > 0.05). The number of dominant species (2D) was also significantly lower (p < 0.05) in T3 compared to the other treatments. The other treatments had around three dominant species and did not differ from each other. T3, therefore, was the least diversified treatment, with practically one dominant species, followed by the other treatments, which had around three dominant species and were more diversified.

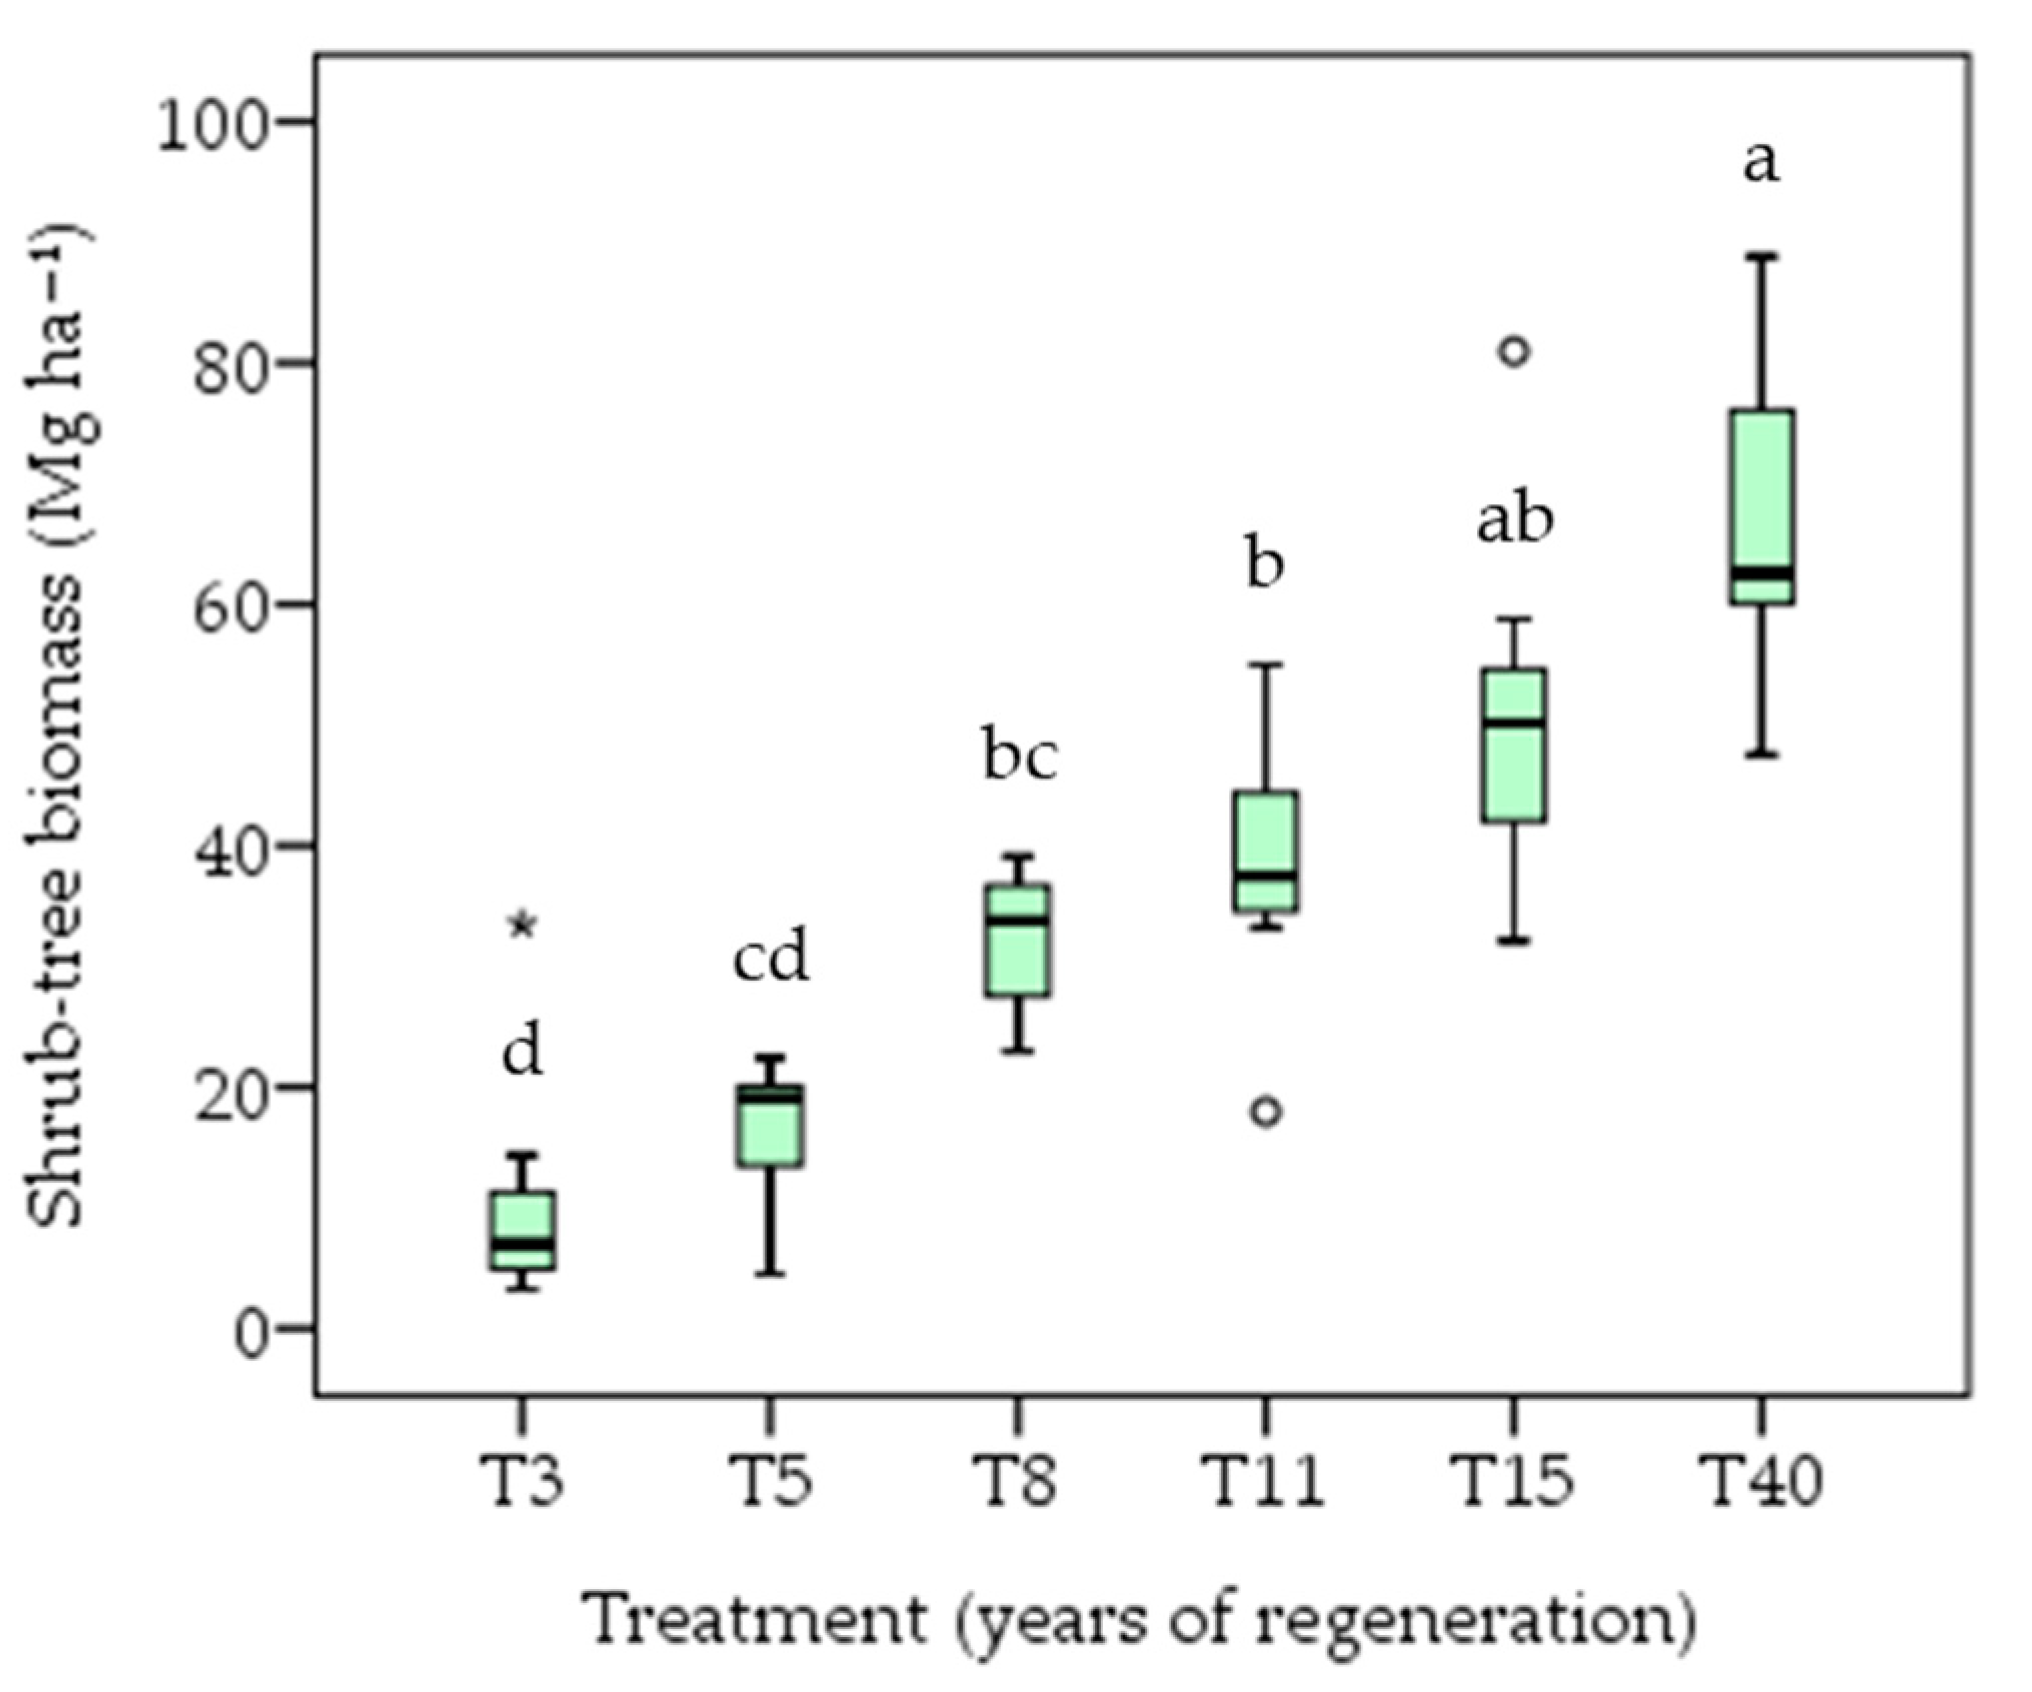
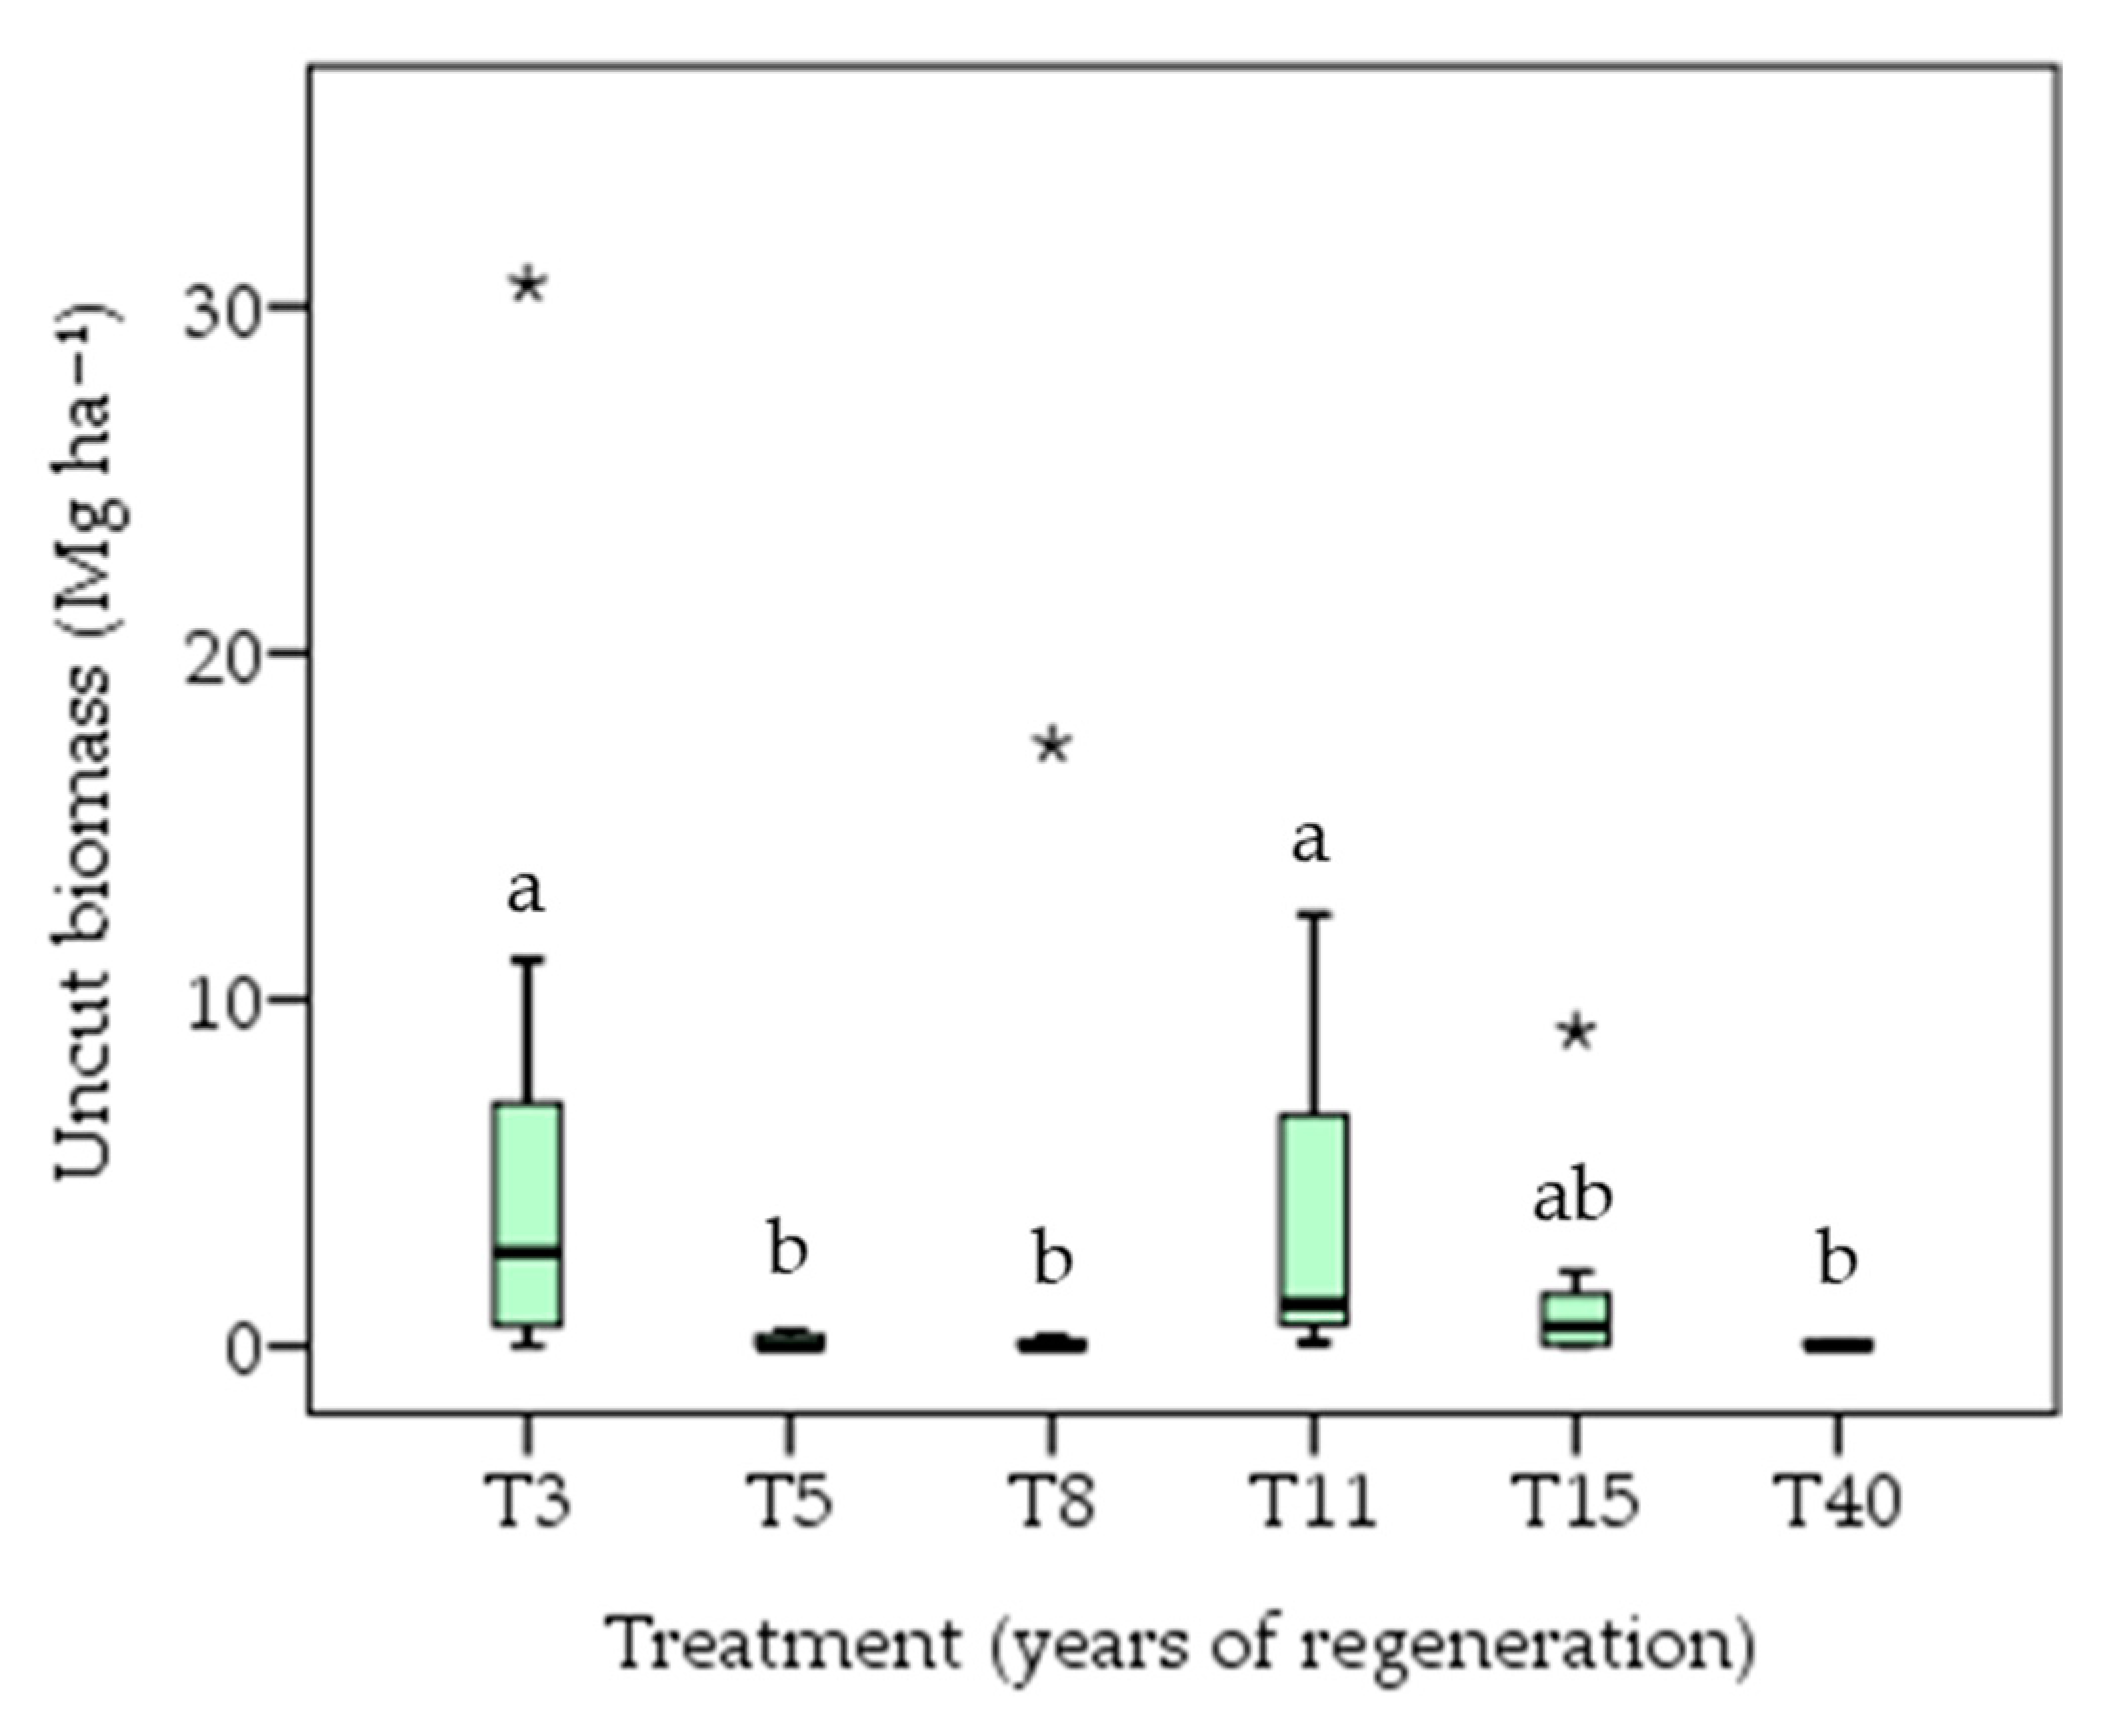
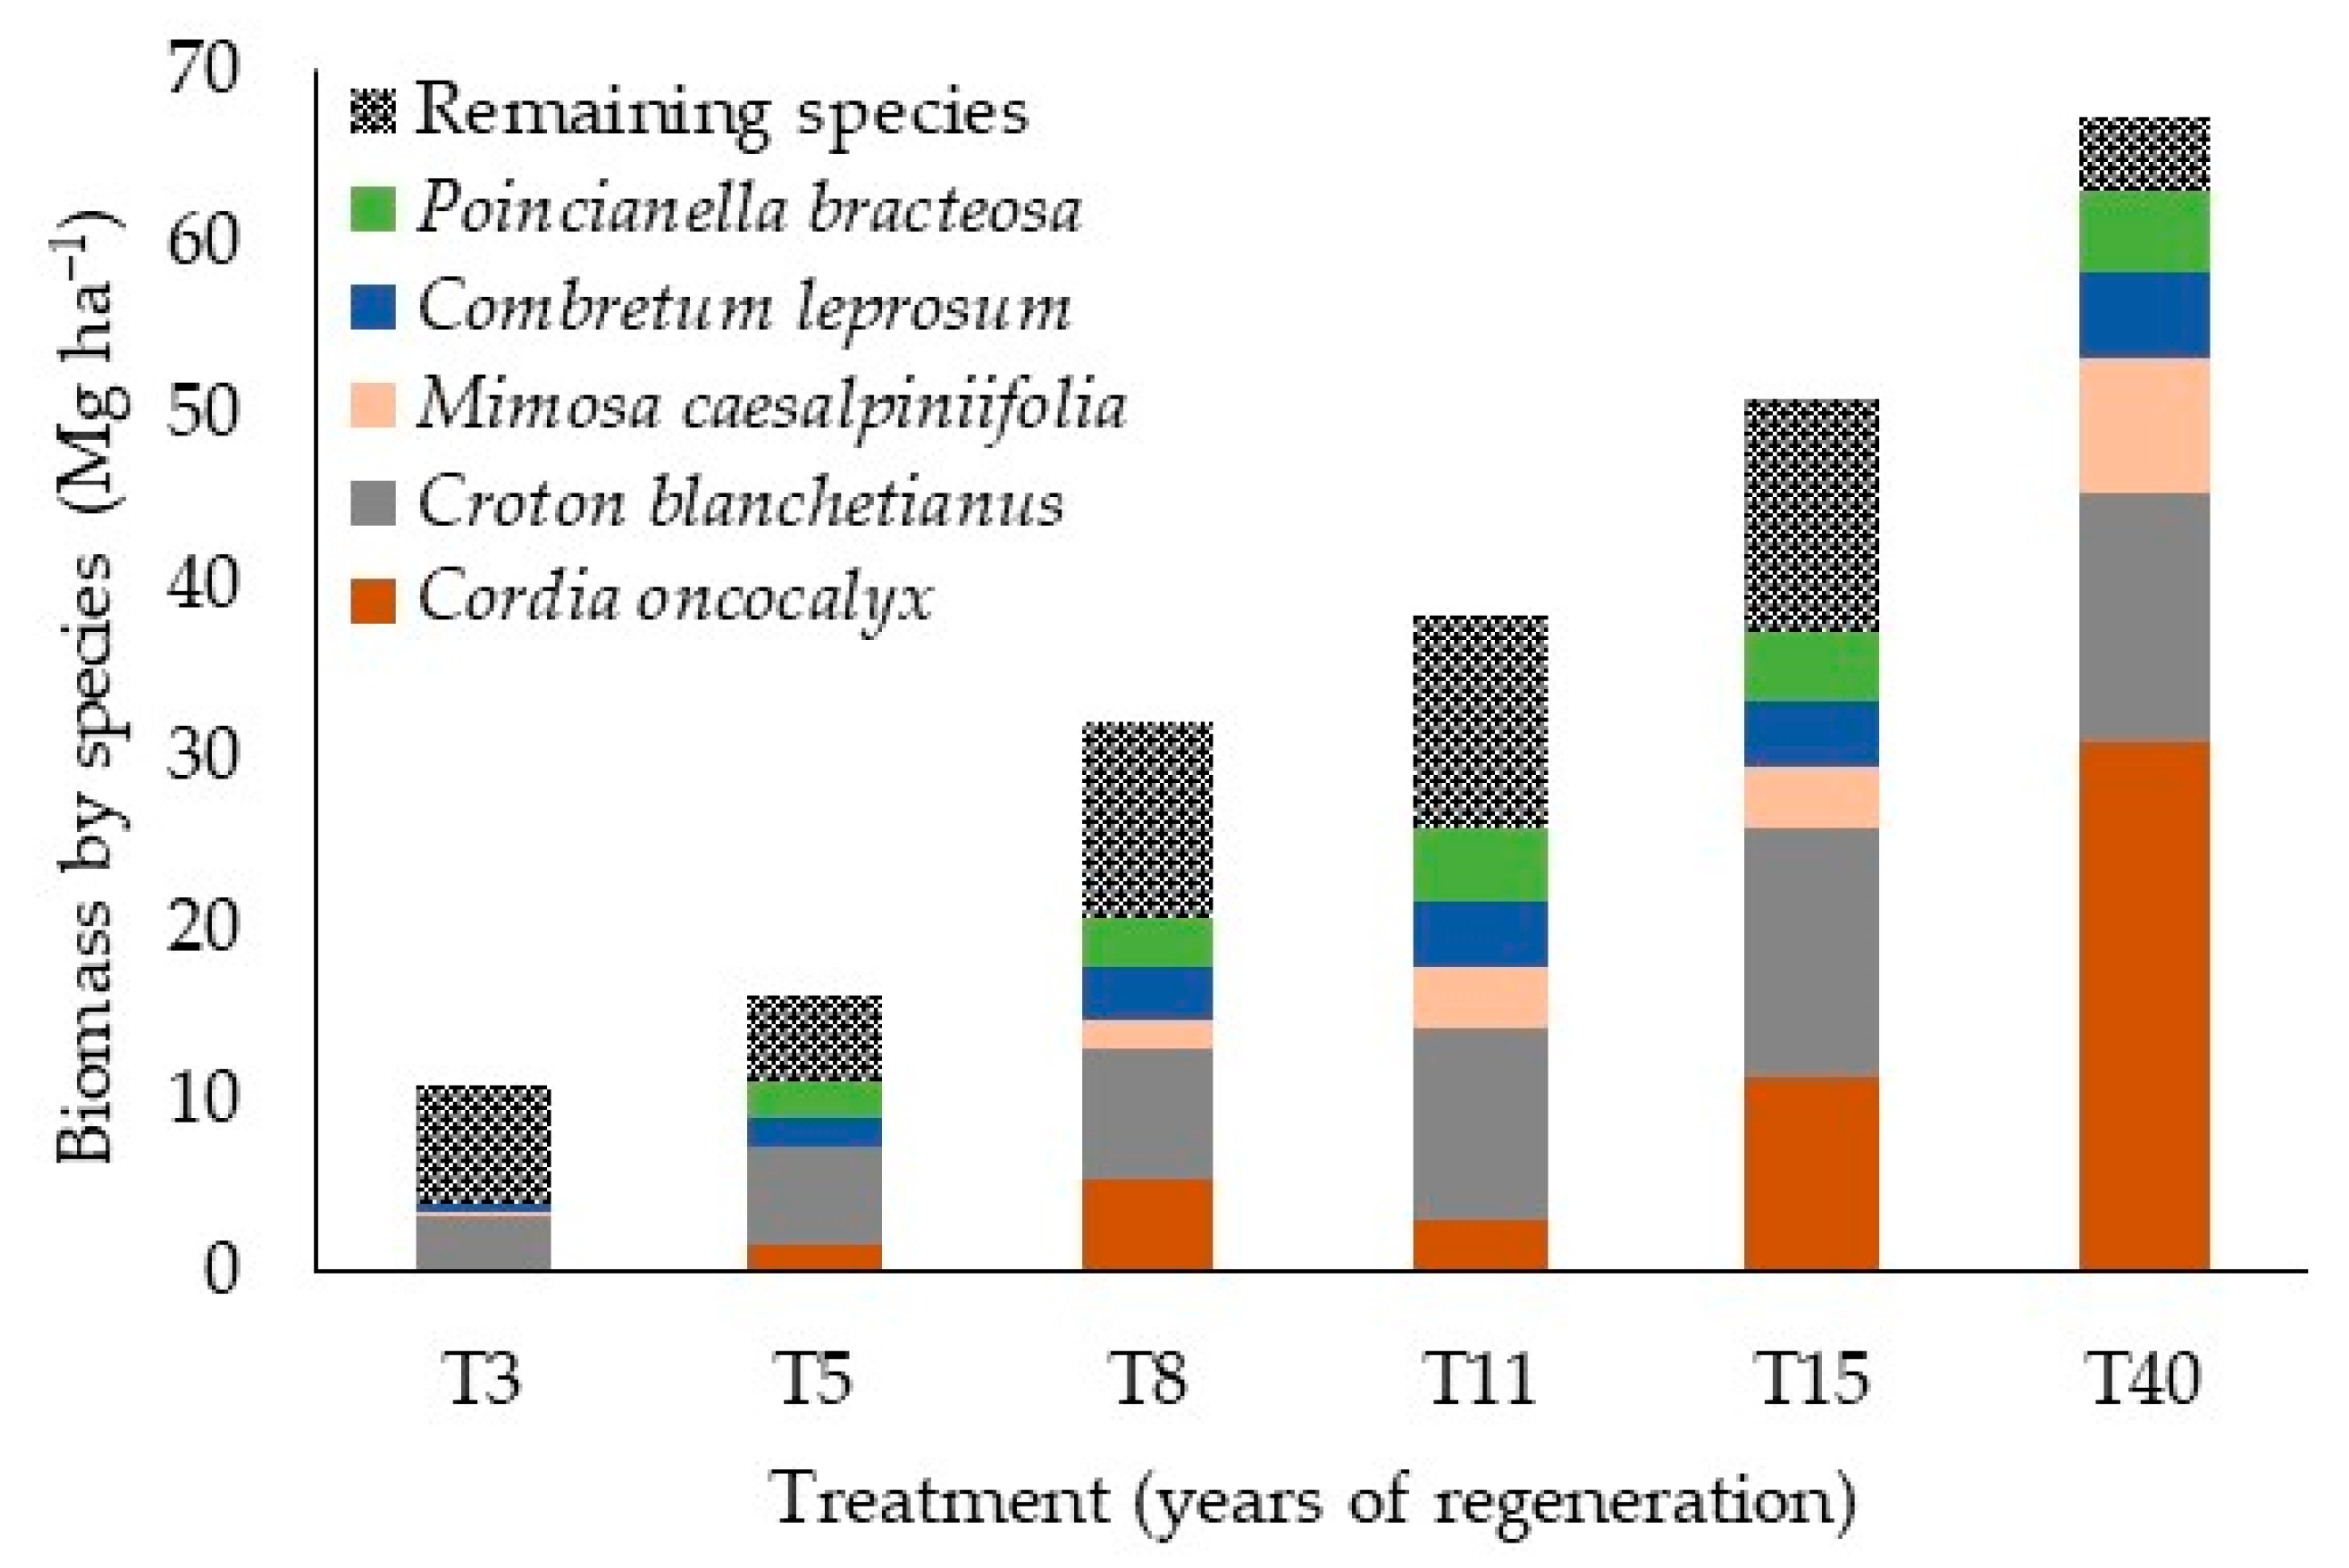
3.2. Biomass Accumulation

The vegetation showed an accumulation of shrub–tree biomass—STB—as a function of regeneration time (Figure 9). After three years of regeneration, the mean STB (±standard error) was 10.89 ± 4.01 Mg ha−1, not differing statistically from that found after five years (16.16 ± 2.34 Mg ha−1). The three-year treatment, however, showed the greatest amount (65%) of biomass of preserved species (6.93 ± 4.21 Mg ha−1), i.e., uncut plants (Figure 10).
There was no statistical difference between the 5-year and 8-year treatments (32.05 ± 2.51 Mg ha−1). The same occurred between the 8-year (32.05 ± 2.51 Mg ha−1), 11-year (38.33 ± 4.48 Mg ha−1) and 15-year (50.25 ± 5.99 Mg ha−1) treatments. For these last three, the 11-year treatment had the greatest numerical amount of uncut species biomass (4.04 ± 1.98 Mg ha−1) (Figure 10).
The STB of the 15-year treatment represented approximately 76.0% of the STB seen after 40 years (67.33 ± 5.86 Mg ha−1). These two treatments showed no statistical difference (p > 0.05), even though the first is 25 years younger than the second. Both treatments showed numerically small amounts of uncut-species biomass, 1.82 ± 1.24 Mg ha−1 and 0.06 ± 0.03 Mg ha−1, respectively.
Regarding species contribution to the biomass of each treatment (Figure 11, Table 2), the dominance of Croton blanchetianus was seen up to the 15-year treatment. During this period, the biomass of this species changed from 3.28 ± 0.83 Mg ha−1 (at 3 years) to 14.76 ± 1.66 Mg ha−1 (at 15 years), being the species with the most biomass in each treatment. After 40 years, however, Cordia oncocalyx presented a greater amount of biomass (30.88 ± 11.28 Mg ha−1). In general, there was a trend towards an increase in the biomass of species C. oncocalyx and Mimosa caesalpiniifolia with the years in regeneration (treatments). It should be noted, however, that no statistical difference (p > 0.05) was seen between T15 and T40.

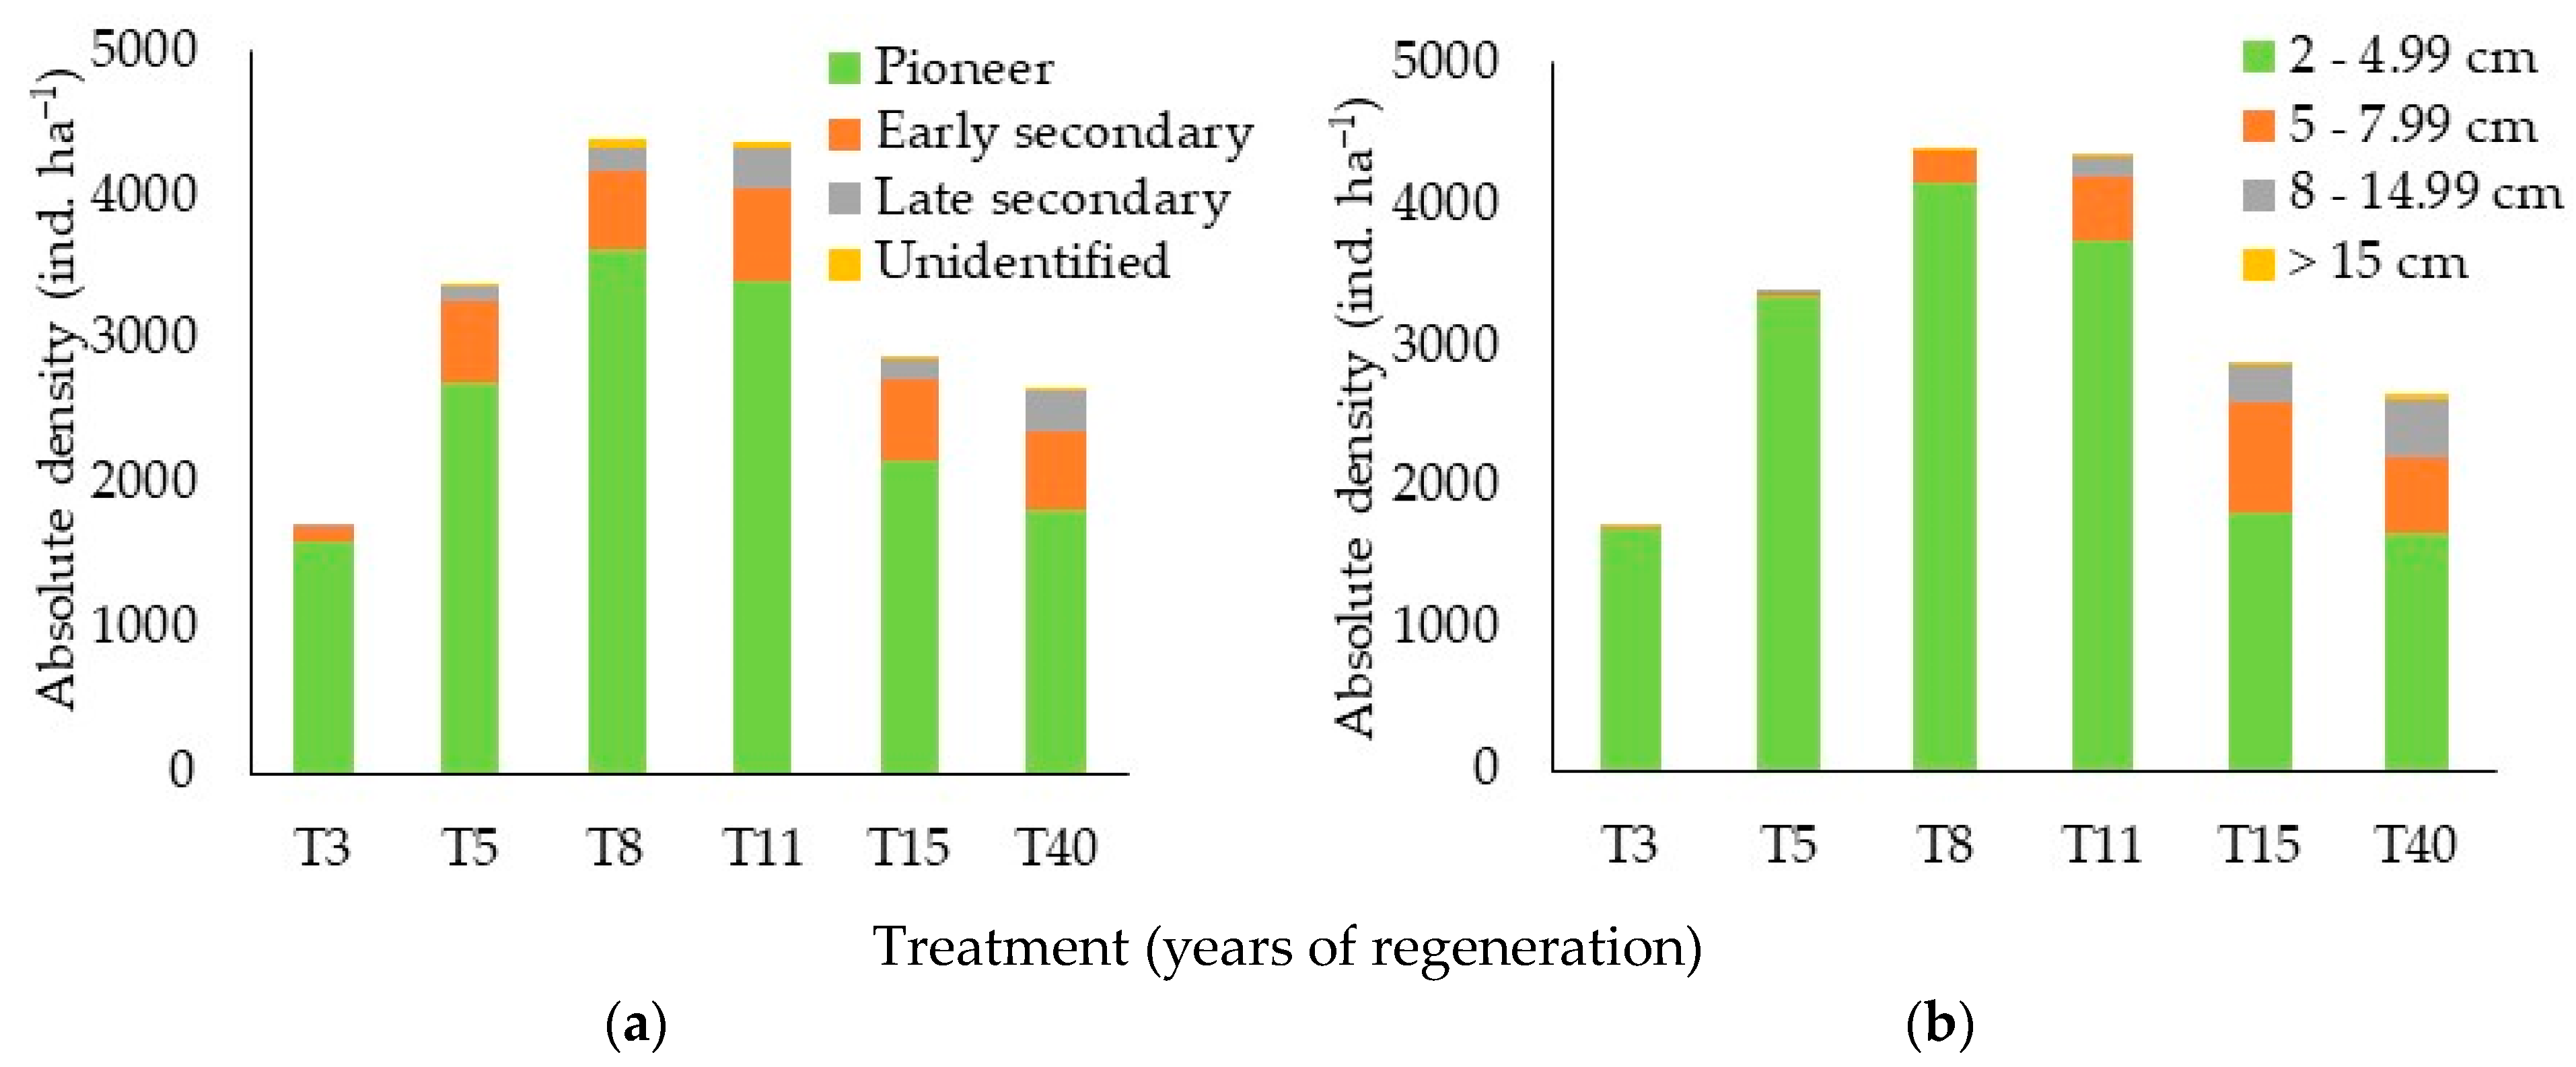
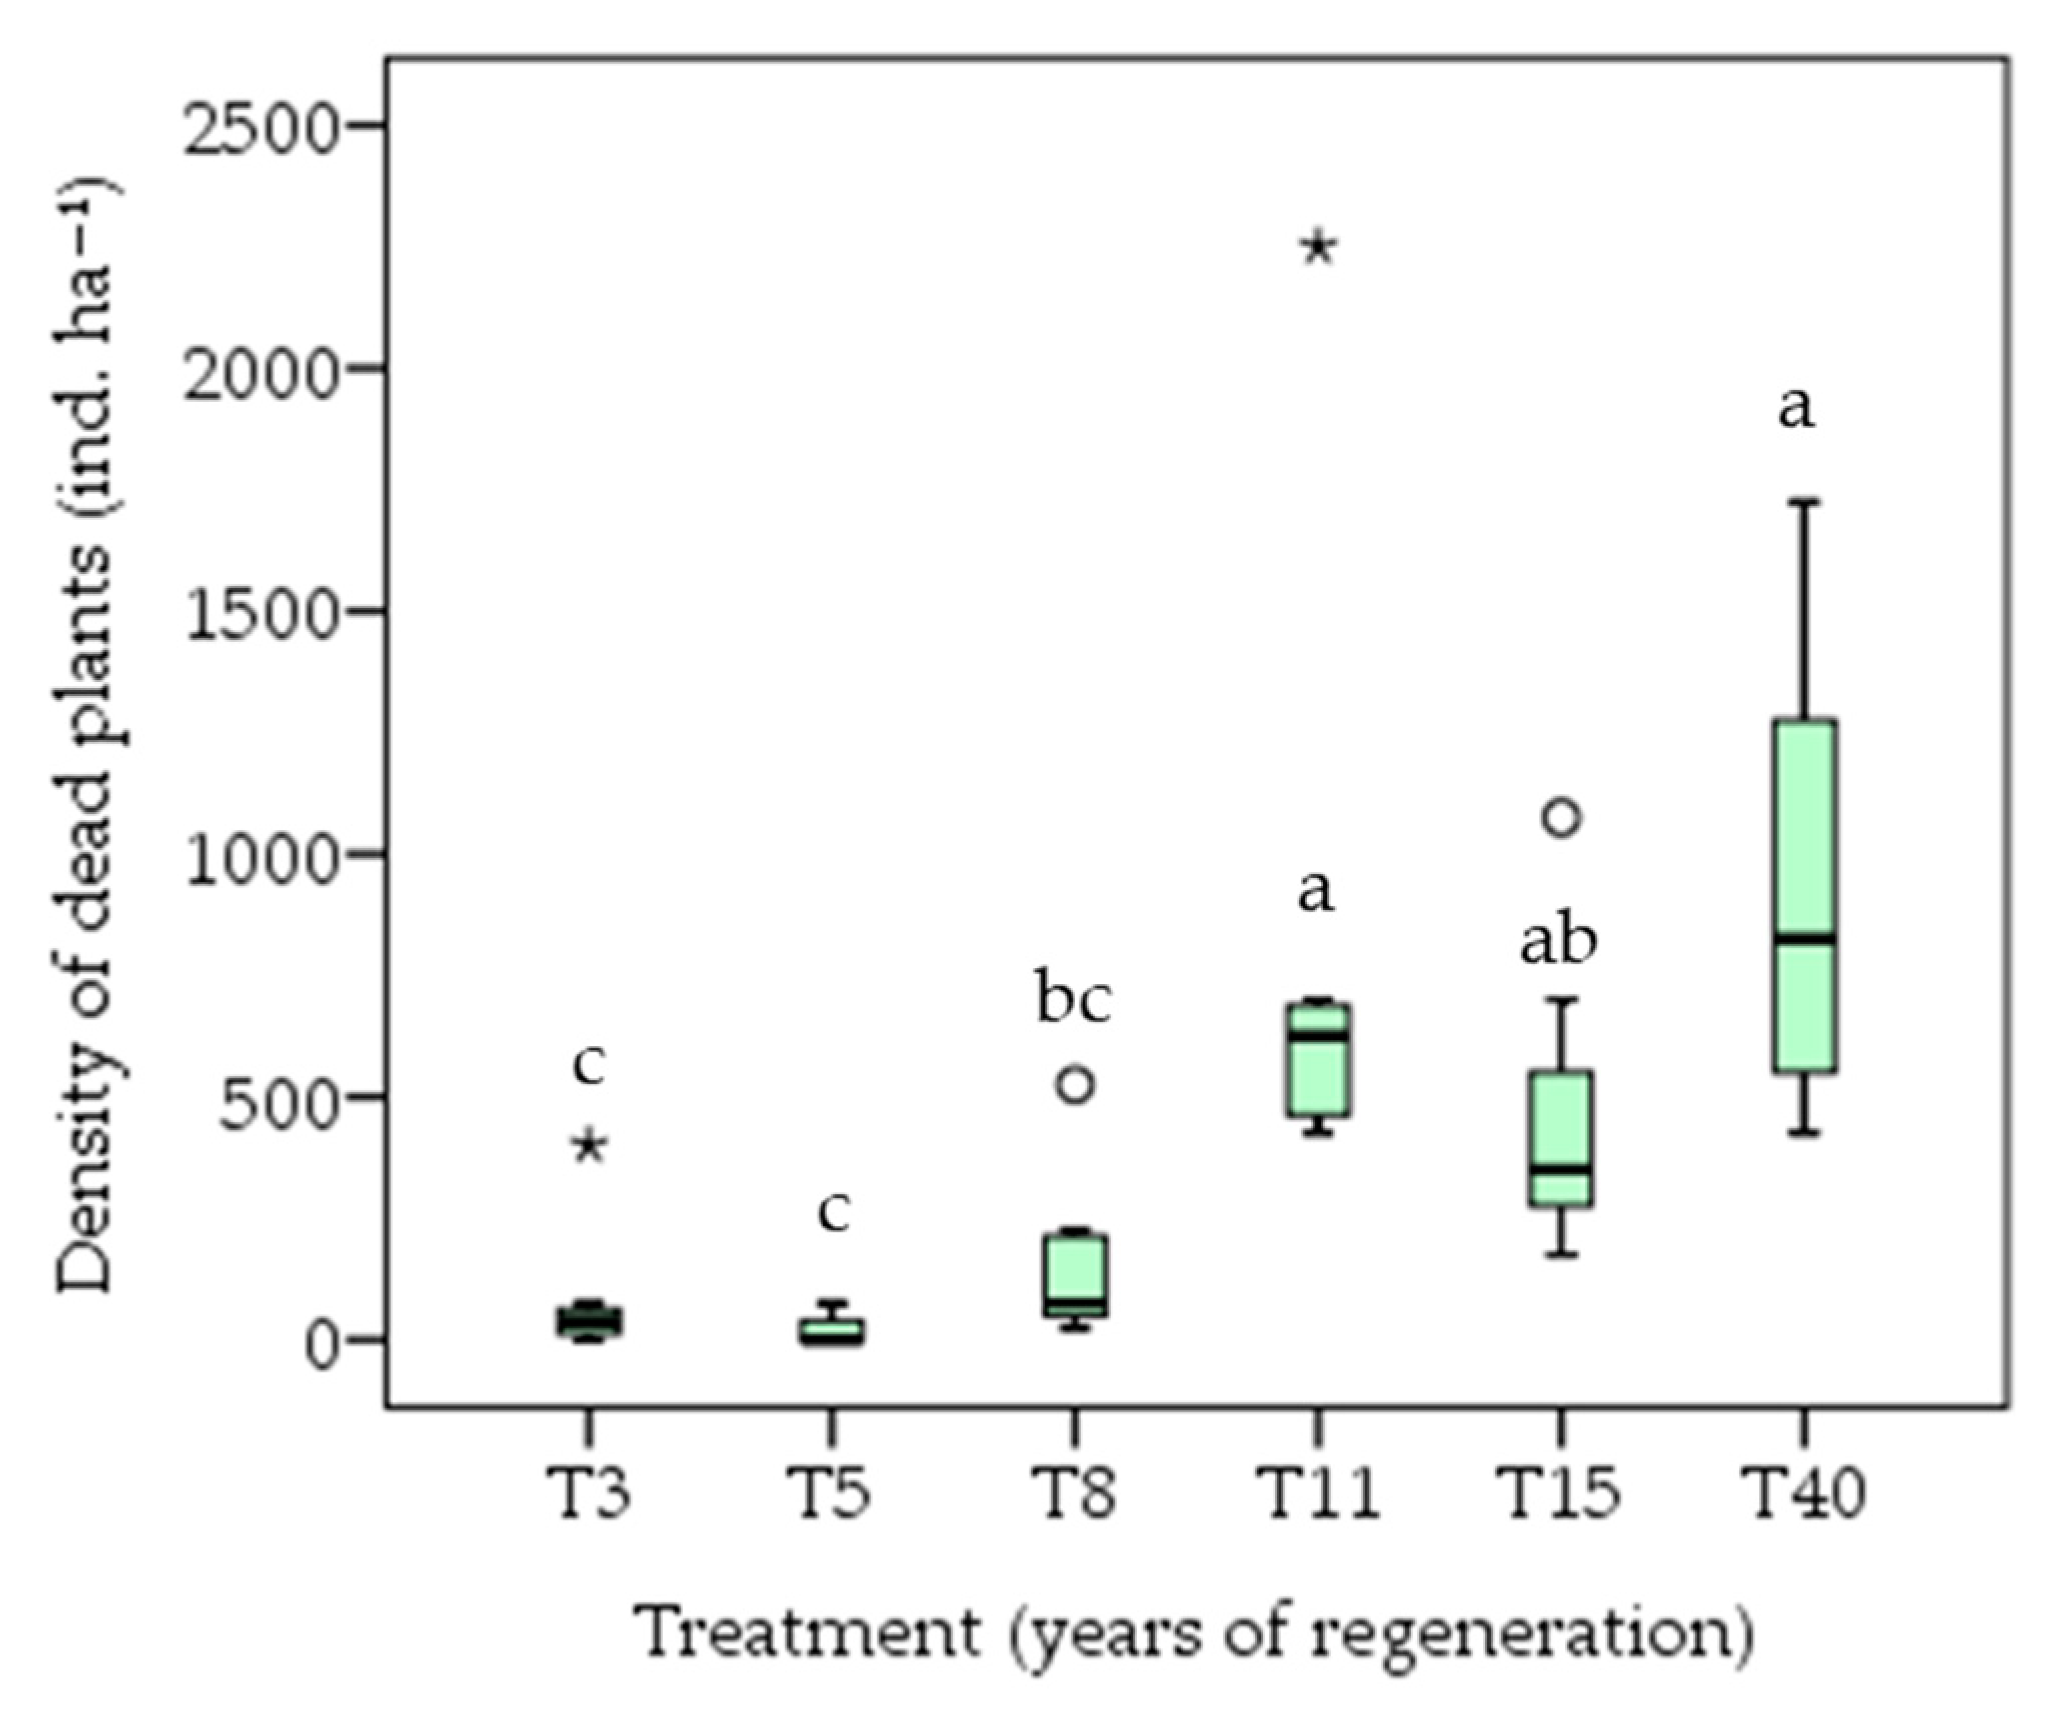
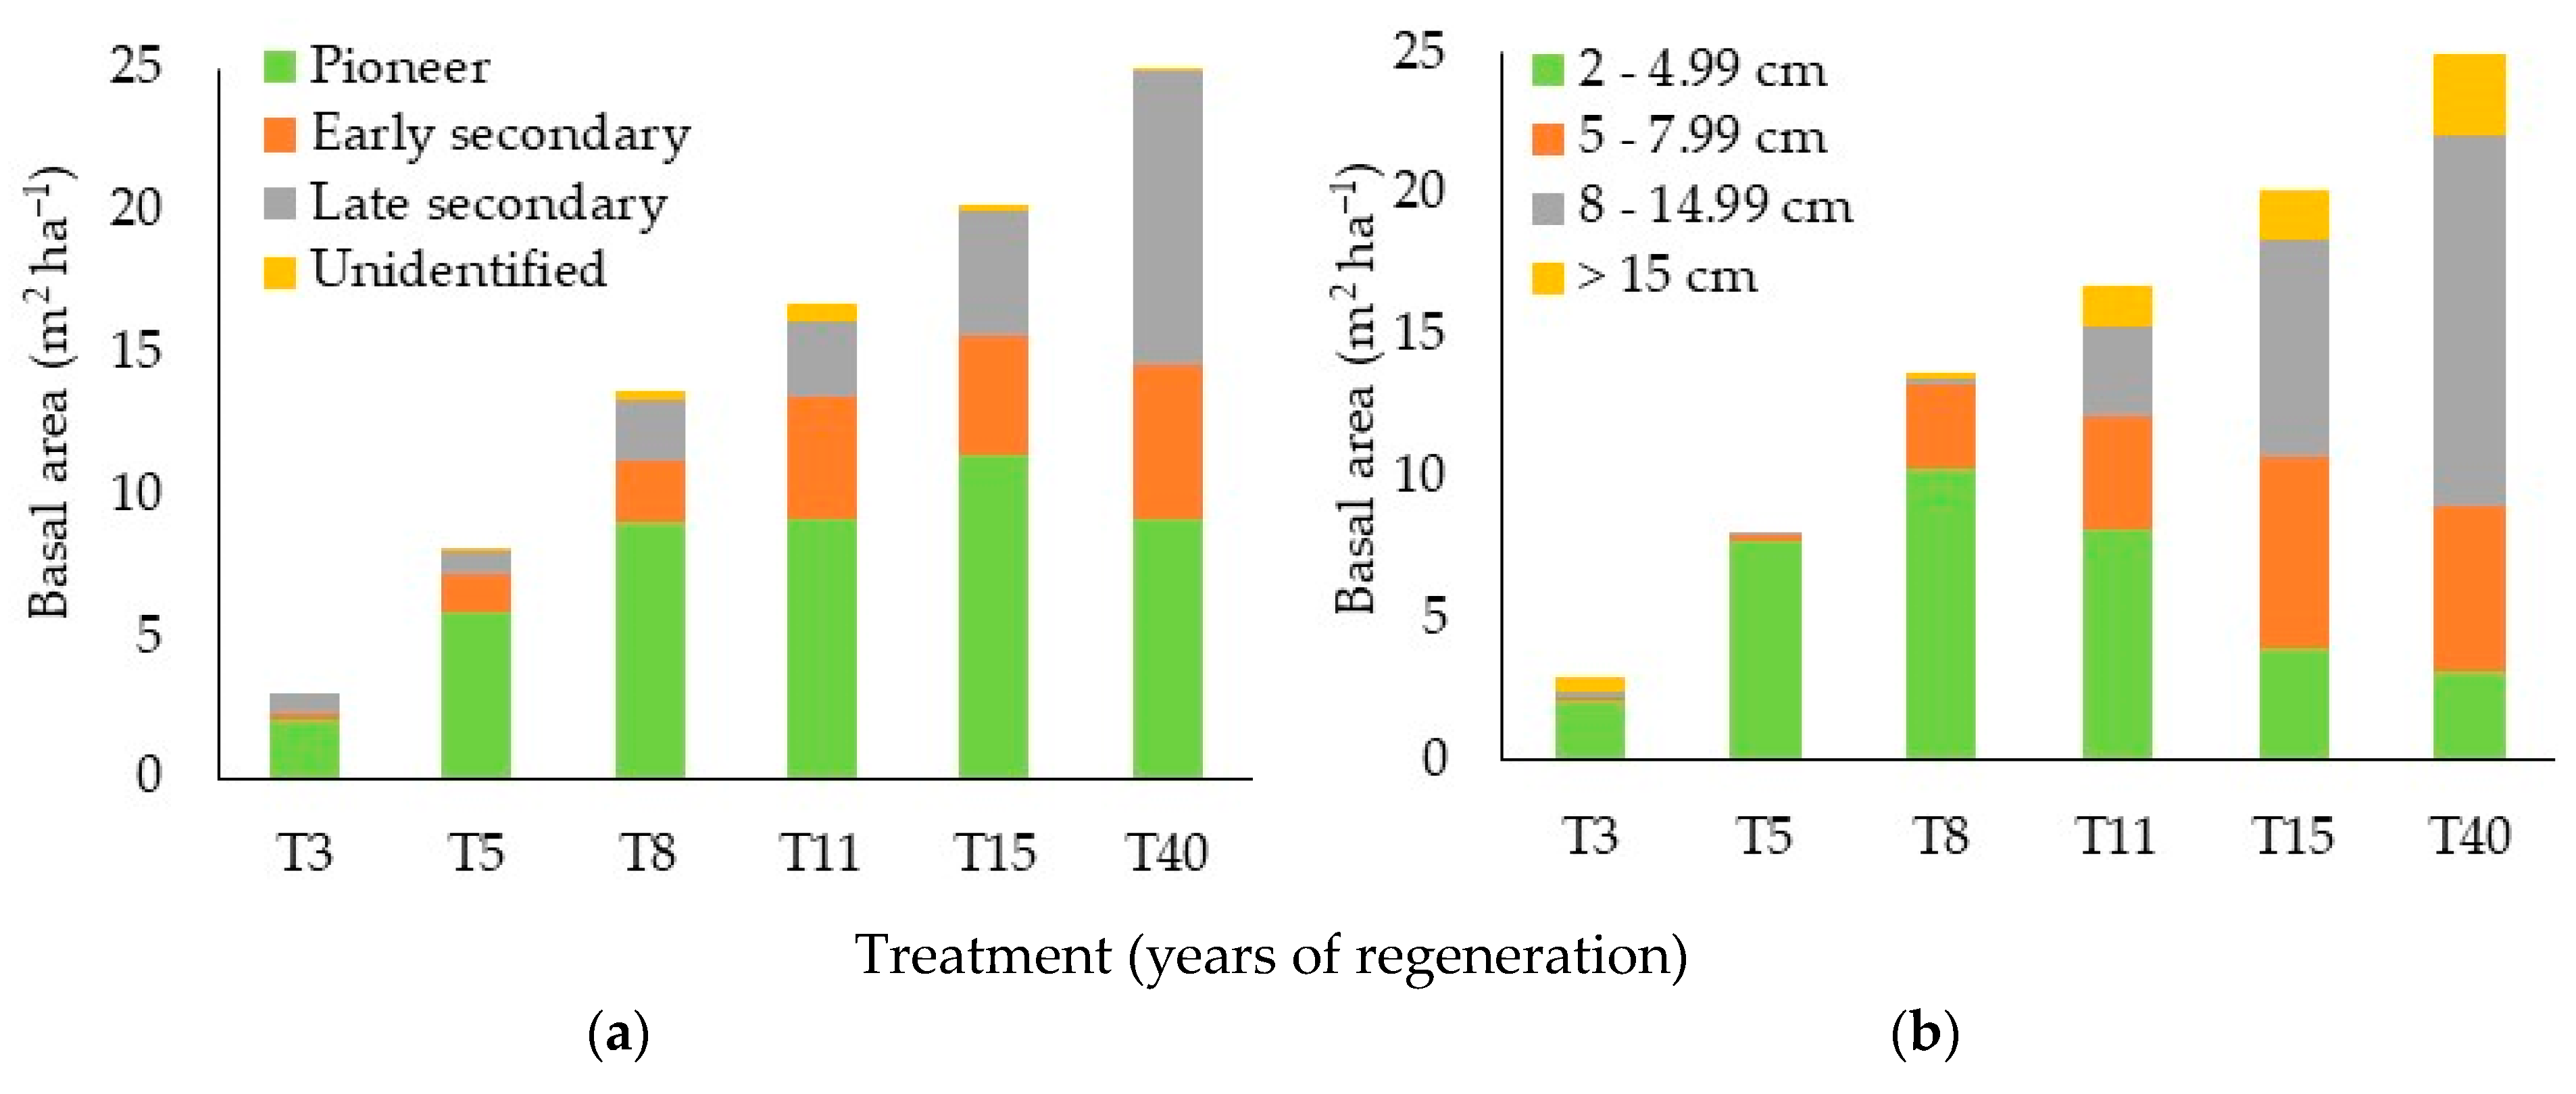
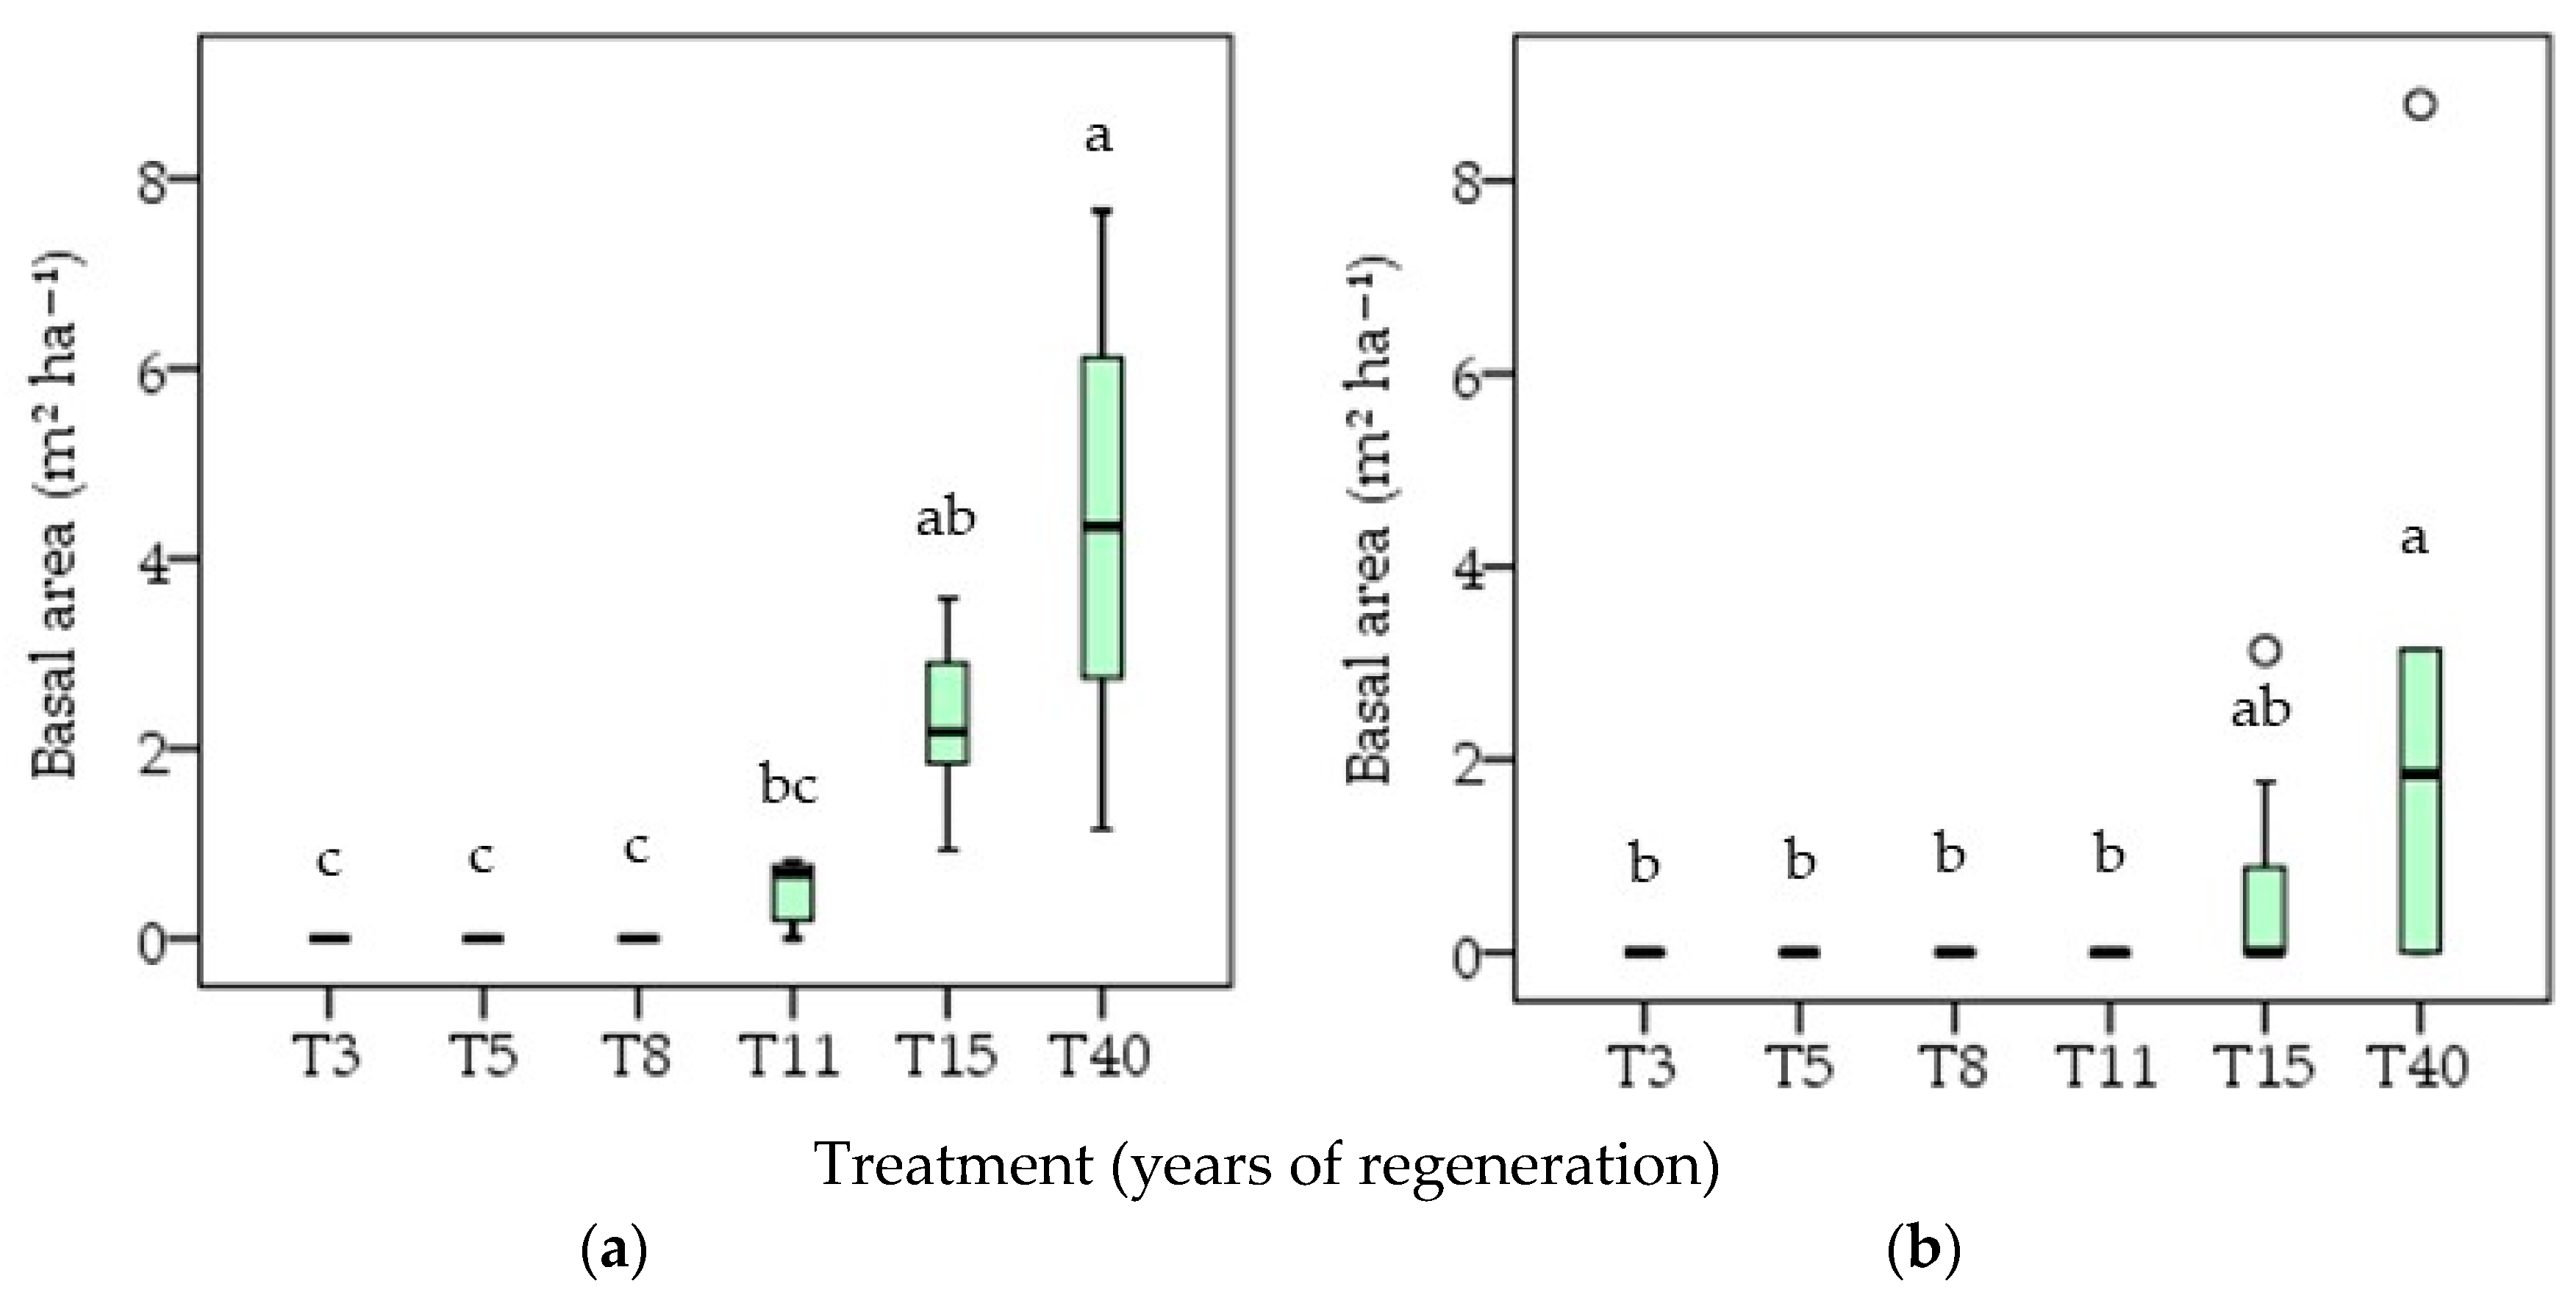
3.3. Community Structure

The mean density (±standard error) for live plants ranged from 1729 ± 265 ind. ha−1 to 4386 ± 216 ind. ha−1 for treatments with three and eight years of regeneration, respectively (Figure 12a, Table 3). During this period (three to eight years), the density can be seen to increase. From the age of 11 years, a large number of dead plants was observed (796 ± 246 ind. ha−1), with the highest amount observed at age 40, with 946 ± 188 ind. ha−1 (Figure 13). The density after 40 years (2657 ± 441 ind. ha−1) was significantly (p < 0.05) lower than after 11 years (4368 ± 516 ind. ha−1) and slightly lower than after 15 years (2893 ± 242 ind. ha−1), there been no difference between 15 and 40 years. It should be noted that the density seen after three years did not differ from those after 15 or 40 years.
The pioneer ecological group was predominant in relation to the other groups in all treatments, with the distribution between treatments following similar behaviour to that of total density (all individuals) (Figure 12a, Table 3). After 40 years, the density of the pioneer group was 1821 ± 417 ind. ha−1, which was significantly (p < 0.05) lower than that seen after eight years (3625 ± 122 ind. ha−1) and after 11 years (3407 ± 537 ind. ha−1), and slightly lower than that seen after 15 years (2168 ± 293 ind. ha−1), with no statistical difference between 15 and 40 years. Unlike the pioneer ecological group, density in the early and late secondary groups generally increased with the regeneration time. At three years, the densities of these groups (early and late) accounted for only 7% of the total density and reached 31% after 40 years.
Very similar behaviour to that of density by ecological group can be seen when analysing density by diameter class (Figure 12b, Table 3). Plant density for the smallest diameter class (2–4.99 cm) predominated in relation to the other classes within each treatment, a behaviour that can be seen in all the treatments. Furthermore, comparing treatments, this class also had a similar distribution to that of total density (all individuals) (Figure 12a, Table 3). For this diameter class (2–4.99 cm), the density at 15 and 40 years, 1814 ± 232 ind. ha−1 and 1689 ± 407 ind. ha−1, respectively, was significantly (p < 0.05) lower than after eight years (4161 ± 209 ind. ha−1) and 11 years (3750 ± 537 ind. ha−1). Once again, the 15- and 40-year treatments show no statistical difference (p > 0.05).
As with total density (Figure 12, Table 3), the density of the first diameter class (2–4.99 cm) increased up to at least 11 years and then followed a downward trend up to 40 years. This trend, however, was not seen in the other diameter classes, which, in general, increased with the regeneration time, i.e., with the age of the treatments. It should be noted that the two largest classes (8–14.99 cm and >15 cm)—which can provide wood of greater added value—represented less than 1% of individuals after eight years. This percentage increased to approximately 4% after 11 years, 10% after 15 years, and 17% after 40 years.
The mean values for the basal area (± standard error) (Figure 14, Table 3) increased with the years under regeneration (treatments), ranging from 3.0 ± 0.6 m2 ha−1 (three years) to 25.0 ± 1.6 m2 ha−1 (40 years). There was no difference (p > 0.05) between a given treatment and the treatment with an immediately later or earlier age. However, it was found that between three and 15 years, there was a significant increase in basal area of approximately seven times. From 15 to 40 years, there was no statistical difference (p > 0.05) and the increase in basal area, of approximately 5.0 m2 ha−1, remained small for a relatively long period of regeneration (25 years).
It was found that in the 3- to 15-year treatments, the distribution of basal area by ecological group was generally the same (Figure 14a, Table 3). In these treatments, the pioneer ecological group predominated, with more than twice the basal area than the other groups, followed by the early secondary group and then the late secondary group, except for the 15-year treatment, when the late secondary group was 0.3 m2 ha−1 greater. It was also found that, in general, the basal area of these ecological groups increased for up to at least 15 years. At 40 years, however, the dominant basal area is that of the late secondary ecological group, followed by the pioneer group and the early secondary. Even with these changes, the increase in basal area after 40 years in the late secondary ecological group and reduction in the pioneer group did not result in any statistical difference (p > 0.05) between the ecological groups in the 15-year treatment.
For basal area distribution by diameter class, it was found that the smallest diameter class (2–4.99 cm) predominated up to 11 years. Up to 8 years, the basal area of the smallest diameter class was always greater than 70%, and after 11 years it represented approximately 49% (Figure 14b, Table 3). At 15 years, the second class (5–7.99 cm) and the third (8–14.99 cm) began to predominate, with the latter greater by 1.1 m2 ha−1. However, after 40 years, the third diameter class (8–14.99 cm) became predominant, occupying more than 50% of the basal area of this treatment. It should be noted that after 40 years, the third diameter class (8–14.99 cm) and the largest class (>15 cm), which are the two classes with the greatest potential for providing wood of greater added value, numerically represented almost double the basal area seen after 15 years, albeit with no statistical difference (p > 0.05) in these classes between 15 and 40 years. Also, no statistical differences were seen between the other classes in the 15- and 40-year treatments.
The basal area was determined of species with the potential for supplying wood of greater added value, i.e., M. caesalpiniifolia, C. blanchetianus and Aspidosperma pyrifolium from the 8–14.99 cm diameter class, whose wood can be sold for posts, and C. oncocalyx, Anadenanthera colubrina, Handroanthus impetiginosus and A. pyrifolium from the >15 cm diameter class, whose wood can be sold for sawmills and/or civil construction. However, it should be noted that for posts, the only suitable individuals were from species M. caesalpiniifolia and C. blanchetianus; for sawmills and/or civil construction, the only suitable species was C. oncocalyx (Figure 15).
No individuals suitable for use as posts were found with less than eight years of regeneration (Figure 15a). The basal area of suitable individuals represented around 11% of the basal area occupied by all individuals after 15 years (Figure 14b, Table 3), increasing to approximately 18% in the 40-year treatment. For both these treatments (15 and 40 years of regeneration), the basal area occupied by individuals suitable for posts almost doubled during this period, from 2.3 ± 0.3 m2 ha−1 to 4.4 ± 0.9 m2 ha−1, respectively. However, although numerically superior after 40 years, no statistical difference (p > 0.05) was found between the two treatments.
Individuals suitable for sawmills and/or civil construction were not seen until after at least 11 years of regeneration (Figure 15b). In the 15-year treatment, however, the basal area of suitable individuals was around 3%, increasing to approximately 10% after 40 years (Figure 14b). It was further found that from 15 to 40 years, the basal area of these individuals increased by around three times, from 0.7 ± 0.5 m2 ha−1 to 2.4 ± 1.2 m2 ha−1, respectively, albeit with no statistical difference (p > 0.05) between the two treatments.
In terms of the importance value index (IVI), the pioneer ecological group predominated, although the contribution decreases with the regeneration time (Table 4). At three years, this ecological group accounted for 75% of the IVI, decreasing after 40 years to approximately 50%. It was also found that, generally, species of the pioneer group accounted for approximately 79% of the total number of sampled individuals (Table 3), at the same time that they accounted for around 61% of the IVI for the entire area under forest management (Table 4).
For the early secondary ecological group, the percentage contribution to the IVI ranged between 19% and 30%, with the exception of the youngest treatment (three years), where it was 13.8%. For the late secondary group, there was a general trend towards an increase in percentage contribution to the IVI for years of regeneration (age of the treatments). This contribution went from 10% after five years to 25.4% after 40 years. It should be noted that the percentage contribution of the individuals that could not be identified in any successional group (therefore called ‘undetermined’) was small, 1% of the managed area as a whole, never reaching more than 3.5% of the IVI in any treatment.
In terms of species, C. blanchetianus, a species of the pioneer ecological group, was predominant in the managed area. Despite the trend towards a decrease in contribution to the IVI with the regeneration time (treatments), this species still accounted for more than 30% of the IVI in the 40-year treatment. Other prominent species in the pioneer group were Poincianella bracteosa and Mimosa arenosa. In general, species M. caesalpiniifolia and Combretum leprosum showed the greatest share in the IVI of the early secondary group.
Species C. oncocalyx predominated in the late secondary ecological group, with a significant share of the IVI of the group, especially with the increase in regeneration time (treatments), accounting for 20.5% of the IVI after 40 years, compared to 10% after 15 years. It should be noted that this species was the only one with individuals suitable for supplying wood for sawmills and/or civil construction.
The species A. pyrifolium (which has the potential for use as stakes and in sawmills and/or civil construction) and A. colubrina (with the potential for use in sawmills and/or civil construction), albeit present in almost all treatments, showed very low IVI values and had no suitable individuals (which met the criteria for such use). Species H. impetiginosus, (potential for use in sawmills and/or civil construction) was present in the five-year treatment only (with an IVI of 0.8%), also with no suitable individuals.

4. Discussion

4.1. Species Composition and Diversity

The aim of forest management in the SDTF is to extract biomass, albeit without modifying the structure or composition of the forest. However, applying such management implies the elimination of the aerial part (only the stumps, of around 30 cm, are left) of practically all individuals (except for the few individuals protected from cutting), which can considerably modify the forest. On the other hand, consistent biomass accumulation was already seen after 15 years (date of the new clear-cut) (Figure 9). Good regeneration during the initial stages, following disturbances by itinerant agriculture (slash and burn) in one area of the forest, was related to the origin of the individuals, with the predominance of root sprouts, followed by stump sprouts and, of far less importance, seedlings [5]. It is likely that in the areas of this forest under forest management (the case of the present study), regeneration from stump sprouts predominates (since fire is not used), which can promote even faster regeneration; however, due to the magnitude of this management (non-selective clear-cutting), changes in species composition and diversity are to be expected. A greater number of pioneer species and a smaller number of late-successional species have been associated with the disturbance and modification of forests through logging [47].
Thirty-four species were found throughout the managed area. However, in the individual treatments, 13 to 25 species were seen, not very different from those seen in a remnant of this forest in the district of Iguatu, Ceará, where 22 species were found [18]. In the Refúgio da Vida Silvestre Pedra de Andorinha conservation unit, located in Sobral, Ceará, 22 woody species were also found [24]. In areas of the Northern Sertaneja Depression (where this study is also located), the number of species ranges from 14 to 34 [29]. In the case of other dry forests in the world, the number of species found in this study is smaller than seen in areas of Africa [61] and Asia [62]. It should be noted that a positive correlation has been found between annual precipitation and species richness [63,64].
Throughout the study area, a greater proportion of species was found in the pioneer ecological group (10), followed by the early secondary group (9) and, finally, the late secondary group (8), although it was not possible to include seven species in any ecological group. The greatest proportion of species from the pioneer ecological group (54%) was seen in treatment T3, which is also the treatment with the lowest density. Despite a short regeneration time (treatment T3), various species were found in the field but could not be counted; these mainly belonged to the early and late secondary ecological groups. However, due to their slower growth, the regrowth, or even the recruited individuals (those originating from the seed bank were in far smaller numbers), still did not meet the inclusion criteria, i.e., they did not have a CBH > 6 cm.
In treatments T5 to T15, the percentage of species from the pioneer group was always less than 36%, with the sum of the percentages in the secondary groups varying from 50% to 56%. In treatment T40, this sum (early and late secondary groups) was slightly higher, reaching 63%, but showing little progress during the successional phases, even after 40 years of regeneration. Unlike what was found, a greater abundance of species from the late secondary ecological group was expected in treatment T40. It is, therefore, possible that the earlier management adopted in the area that today comprises the Legal Reserve (T40) acted to modify the composition of all current species, even after a considerable number of years had passed.
Contrary to what was expected that differences would be seen between treatments (especially T40, compared to the others), the results showed that the adopted forest management, despite clear-cutting, did not affect species richness (0D). In addition to species richness (which is not the case in this study), other forest attributes can be affected by forest management (species diversity, abundance, density and importance value, among others), as discussed throughout this article. In terms of diversity, which encompasses the Hill numbers (0D, 1D, 2D), the only difference was seen in treatment T3 in relation to the other treatments (which did not differ between themselves) for the variables number of common species (1D) and number of dominant species (2D). In T3, the short time following clear-cutting and the slow growth of later species possibly contributed to the lower values of these variables. However, from what was seen in the other treatments from T5 onwards, it is believed that with more regeneration time, T3 will also begin to present the same number of common and dominant species as other treatments. A high abundance of regrowth or sources of regrowth (i.e., stumps and roots) at the time the land was abandoned (following exploitation for agriculture and/or livestock) probably explains why some forest stands undergoing regeneration have plant assemblages similar to those supported by ancient forest stands [5,46]. In this respect, the complete preservation of these sources in areas under forest management in the SDTF (since there is no burning and stumps and roots are not removed) should avoid any differences in species richness. Furthermore, in these areas, in addition to the lack of burning or stump removal, stubble is raked over the ground (see [25]). These factors, added to the high level of regeneration seen in this study following clear-cutting, should mitigate the impacts associated with agricultural use (compared to conventional management with itinerant agriculture), such as those seen on surface water resources in the region [32,33,34].
Although the results showed that forest management (by clear-cutting) did not drastically affect species diversity for up to at least 15 years, further investigation is needed. It is necessary to begin and/or continue studies in managed areas of this forest, ideally including more than one cutting cycle.

4.2. Biomass Accumulation

The main focus in these forest management areas is the production of biomass to be used as a source of energy in the form of firewood or charcoal, as these products are widely consumed in the semi-arid region of Brazil. Thus, no specific management is adopted to favour those species which might generate a higher income, although there are species whose wood is more valued when sold in other ways than just for firewood or charcoal.
In general, there is a consensus on the need to ensure that forest exploitation does not permanently affect ecosystem processes [10]; this includes the need to fully understand the effects of logging on the composition, structure and diversity of forests [47]. When it comes to forest management in the SDTF under clear-cutting, not much is known about how clear-cutting interferes with the balance of these managed areas.
In this study, there was a large accumulation of STB (Figure 9) with regeneration time (treatments). The 15-year treatment stands out (the period suggested for further clear-cutting), with biomass accumulation (50.95 ± 5.99 Mg ha−1) not statistically different (p > 0.05) from the area of Legal Reserve, which had been undergoing regeneration for 40 years (67.33 ± 5.86 Mg ha−1). This showed how vigorous and fast this type of forest vegetation was for the accumulating biomass following clear-cutting. In the Miombo tropical dry forest in Mozambique, areas undergoing regeneration showed high resilience following low-intensity and short-duration disturbance [43].
The STB after 40 years (67.33 ± 5.86 Mg ha−1) was equal to that found in an area of SDTF (64.88 Mg ha−1) undergoing regeneration for 32 years with no grazing, located close to the study area [65]. The mean value of the STB in the 40-year treatment, however, was higher than that seen in a fragment of the same forest in Iguatu, Ceará—43.28 Mg ha−1—, in an area after 35 years of regeneration [18]. Similarly, the STB after 40 years was also higher than that seen in a study in the state of Paraíba, 37.56 Mg ha−1 (40 years of regeneration), where the slow process of vegetation succession was attributed to the high degree of earlier disturbance [29]. These authors also found that even during the late stage (60 years), there was relatively little biomass (49.47 Mg ha−1), with most of it coming from a few species only, indicating strong competition for water, the most limiting resource.
In most of this forest, whose size is limited by the less favourable conditions (water and nutrients) and human action, stocks of woody–stratum biomass are between 20 Mg ha−1 and 80 Mg ha−1 [66]. In a dry deciduous tropical forest in eastern Ghats, India, 98.87 Mg biomass ha−1 was found, albeit under a mean annual rainfall of 1262 mm [62], which is higher than the rainfall of other studies in the SDTF.
When the STB was analysed using biomass composition by species (Figure 11, Table 2), it was found that C. blanchetianus, of the pioneer ecological group (Table 4), predominated for at least 15 years. This indicates that the vegetation is in the shrubland stage, i.e., in the early stages of secondary succession [16]. The author adds that the high density of this species, which occurs in soils that have good physical and chemical characteristics, is an indicator of secondary succession recovery. At 40 years, however, the greater expression of species C. oncocalyx of the late secondary ecological group (Table 4), in terms of dominance (Table S2) and biomass (Figure 11, Table 2), is an indication that the area is in the intermediate stages of secondary succession [16]. In areas undergoing regeneration, especially following agriculture or pasture, but also following the removal of firewood, the floristic composition tends to be simpler than before, with few dominant species [67].
Although the amount of biomass of the species protected from cutting is very small (Figure 10) in relation to the STB (Figure 9) and achieved values of little importance (Table 4 and Table S2), the preservation of these species plays an important role in their survival, which are then able to fulfil their ecological function in the forest community. Among these species are M. urundeuva, with its resistant wood widely used for posts, sleepers, fencing, furniture and medicinal use, and A. cearensis, a source of wood for handicrafts/carpentry and medicinal uses. In the SDTF, the natural existence of these two species is made difficult by the unbridled and extractive use they were and (to a certain extent) are still subject to without being replaced [68]. In a study carried out in the neotropical dry forest of Argentina, the species A. cearensis (threatened with extinction there) was not found in areas under recovery following exploitation by selective cutting [44].

4.3. Community Structure

4.3.1. Density and Basal Area by Ecological Group and Diameter Class

Forest management was seen to affect the density of individuals, which increased and remained higher for at least 11 years (Figure 12, Table 3). At 15 years, however, the density was already equal to that seen after 40 years; the latter was far lower and very different (p < 0.05) to that seen after 11 years (for more information, see [44]). This increase in density, seen following the exploitation of the area, is due to less competition for light, water and nutrients in the managed areas in the early years after clear-cutting [67], which promoted the emergence of new seedlings. An important part of these new individuals probably originates from roots already existing in the area [5]. It should also be noted that regrowth (which predominates in this area) can favour seeds and seedlings by eliminating/reducing any imposed environmental filtering, such as a scarcity of water and nutrients in the surface layers of the soil [69,70].
In this managed area, the density seen after 40 years (2657 ± 441 ind. ha−1) was slightly lower than that found in a fragment of the same forest undergoing regeneration for 35 years (3738 ind. ha−1) in Iguatu, another district in the state of Ceará [18]. In an extensive study compiling floristic–phytosociological data in different environments of the SDTF, densities were found that ranged from 242 ind. ha−1 to 10,080 ind. ha−1 [71]. Competition for light, water and nutrients, as well as successional aspects of the species in the area, probably act so that there is a convergence, albeit dynamic, in the density of living individuals in these areas [67]. The early successional stages allow for the establishment of more individuals, while in more preserved areas, the density is lower due to greater competition [21].
The number of dead individuals, a direct reflection of the processes that occur in this environment, became significant after 11 years, reaching 796 ± 246 ind. ha−1 (Figure 13). A large quantity of dead plants was also seen after 15 years (464 ± 317 ind. ha−1) and after 40 years (946 ± 188 ind. ha−1). In contrast, from three to eight years, the highest mean dead plants were 164 ± 67 ind. ha−1, seen after eight years. In a study in an area of the same forest (with 40 years of regeneration), it was found that the occurrence of consecutive dry years (six in all) resulted in a recruitment/mortality ratio for woody species of 0.11, reducing the density from 3063 ind. ha−1 to 2113 ind. ha−1 over an 11-year period [26]. They also found that mortality was more related to the stage of plant development (younger plants being more prone to death) than to species.
The behaviour of individual density in the pioneer ecological group (Figure 12a, Table 3) was very similar to that of density as a whole, i.e., increased following intervention for up to at least 11 years, then decreased, and after 40 years differed (p < 0.05) from the 8- and 11-year treatments. In terms of individual density, the pioneer ecological group determined the density of the managed area as a whole, accounting for 93% of individuals after three years, for example, and for almost 69% after 40 years. On the other hand, the contribution of both the early and late secondary ecological groups generally tended to increase with the regeneration time (treatments), characterising a difference between the groups in carrying out their ecological functions during the regeneration process in the SDTF after clear-cutting. A greater abundance of individuals of species belonging to the pioneer ecological group has been seen in research in this forest formation [20,26].
Clear-cutting also affected the basal area (Figure 14, Table 3), as shown by the different values for this variable with the years of regeneration (treatments). However, unlike density, the basal area increased during the period covered by the treatments, and the data from this study showed that it had not stagnated. The value for the basal area after 40 years (25 ± 1.6 m2 ha−1) is the same as seen at 30 years (24.9 m2 ha−1) for vegetation in the Agreste area of the state of Pernambuco [14]. However, higher values for basal area—35.26 m2 ha−1 [23] and 36.25 m2 ha−1 [24]—were seen in the same forest in the state of Ceará, where in the places under study, species C. oncocalyx was distinctive, and had the highest importance values (IVI). Yet, in the present study, despite its strong presence, the species does not achieve the highest IVI, not even after 40 years, which may explain the differences. C. oncocalyx is a species that stands out for being relatively tall and developing stems of relatively large diameter [23,24]. On the other hand, a lower value for the basal area was found in Patos, Paraíba, with a total of 18.79 m2 ha−1 [19], equal to that found in this study in the 15-year treatment (20.2 ± 1.8 m2 ha−1).
The almost 5 m2 ha−1 additional basal area in the 40-year treatment compared to the 15-year treatment (in this study) once again did not result in any statistical difference (p > 0.05) between them. In terms of basal area occupied by ecological groups (Figure 14a, Table 3), the behaviour of this variable was also different from that seen for density since the pioneer ecological group, for example, did not occupy the largest basal area after 40 years (as seen for density, the pioneer group was always greater in all treatments). In this treatment (40 years), despite the density of the pioneer group representing 69% of the individuals, it does not exceed 37% of the basal area. The late secondary ecological group, which occupied little basal area until at least 8 years, occupied a greater basal area than the pioneer group after 40 years (Figure 14a, Table 3 and Table S2). This was mainly due to the characteristics of the predominant species in these groups: C. oncocalyx (which predominated in the late secondary group) presents a relatively large diameter [23,24] with regeneration time, compared to C. blanchetianus (which predominated in the pioneer group).
An analysis of density by diameter class showed that the smallest class (2–4.99 cm), which was the predominant class in all treatments (Figure 12b, Table 3), presented a very similar distribution to the density of living individuals, as well as similar densities as the pioneer ecological group (Figure 12a). This first diameter class accounted for approximately 98% of the individuals after three years, when most individuals are in bud or being recruited. After 11 years, this first class still accounted for approximately 86% of individuals. At 15 and 40 years, however, the percentage of individuals in this class decreases, although they are still responsible for approximately 63%. When added to the second diameter class (5–7.99 cm), the percentage densities were always greater than 96%, at least up to the 11-year treatment. In the 15- and 40-year treatments, the first two classes still accounted for approximately 90% and 83%, respectively, showing that individuals with small diameters predominated in the managed area, especially the 15-year treatment, which has now reached the age for carrying out the new clear-cut (for more information, see [25]). The use of biomass (which comes from thinner stems) is limited to firewood and/or charcoal, which are products of lower added value compared to wood for fencing or sawmills, for example [12]. Add to this the fact that biomass with a smaller diameter results in raw material of lower quality, leading to losses in energy efficiency due to the lower calorific value of the thinner wood [72,73].
Basal area by diameter class is another variable that was strongly affected by forest intervention (Figure 14, Table 3). There was a tendency for the basal area to recover with the regeneration time (treatments), with growth being proportionally far greater during the first 15 years. From 15 to 40 years, despite the 25-year interval, the growth in the basal area was less than 5.0 m2 ha−1. This underlines that the managed area had a good capacity for recovery, which is very intense up to at least 15 years, a treatment that did not differ statistically (p > 0.05) from the 40-year treatment.
It was found that the two largest diameter classes (Figure 14b) contributed practically nothing to the basal area until at least eight years. At 11 years, these two classes contributed approximately 27.5%, increasing more in later years, reaching 46.5% (after 15 years) and 64% (after 40 years). Between the two largest diameter classes, however, that of 8–14.99 cm stood out and is responsible for more than half of the basal area after 40 years.

4.3.2. Basal Area of Individuals with the Potential for Greater Added Value

The forest management developed for the SDTF, unlike that carried out in other forests, such as selective cutting in the Amazon Forest in Brazil [10] or rotation in the Ocotones forest in southern Mexico [11], does not aim to obtain different forest products of greater added value (such as wood for fencing or sawmills). Generally, under this management, the aim is to obtain the maximum amount of biomass without differentiating by species, for example. Despite this, when finding reasonable numbers of individuals of species capable of providing products of greater added value, farmers can choose to market them as separate products (wood for fencing or sawmills) (Figure 15). This allows them greater profitability compared to selling products such as firewood and/or charcoal only [12].
The following species can provide wood for fencing: C. blanchetianus (pioneer ecological group), M. caesalpiniifolia and A. pyrifolium (early secondary ecological group), the products being stakes (individuals with DBH between 8 and 14.99 cm, third diametric class) and posts (individuals with DBH > 15 cm, fourth diametric class). It should be noted from the start that no individual of these species suitable for posts was found (Figure 15).
As for individuals suitable for cutting, it was found that the presence of species A. pyrifolium was low in all treatments and included no suitable individuals. In the case of C. blanchetianus and M. caesalpiniifolia, the former predominating in all treatments, individuals suitable for the different uses were few considering the total number of individuals. As an example, the individuals of these two species accounted forapproximately 40% of the dominance (basal area) after 15 years (Table S2); however, only 11.4% (or 2.3 ± 0.3 m2 ha−1) of the basal area (Figure 15a) comes from individuals of these two species with DBH between 8 and 14.99 cm, and which could therefore be used for stakes. After 40 years, the percentage dominance (basal area) of the two species (C. blanchetianus and M. caesalpiniifolia) was approximately 37%. In comparison, the percentage basal area of suitable individuals was only 17.6% (or 4.4 ± 0.9 m2 ha−1).
There was a numerical increase in the basal area of these species (C. blanchetianus and M. caesalpiniifolia), including suitable individuals (DBH between 8 and 14.99 cm) from 15 to 40 years (2.3 ± 0.3 m2 ha−1 to 4.4 ± 0.9 m2 ha−1, respectively); however, there were no statistical differences between these treatments (p > 0.05). Furthermore, there was a large number of individuals of both species whose biomass could only be used as firewood and/or charcoal, as they did not achieve the minimum diameter to be used as stakes. The fact that there are few individuals of these species that achieved diameters that qualify them to be used as posts (especially after 15 years), and that no individual achieved the minimum diameter for use as posts (even after 40 years) proved to be a limiting factor to obtaining products of greater added value, especially for use as posts.
In the case of species that provide products for sawmills and/or civil construction (C. oncocalyx, A. colubrina, H. impetiginosus—only present in T5—and A. pyrifolium), only the first presented suitable individuals, i.e., with DBH > 15 cm. These suitable individuals were only found after 15 years of regeneration (Figure 15b), albeit with a very small percentage basal area, approximately 3% (or 0.7 ± 0.5 m2 ha−1). Therefore, very few individuals of these four species were suitable since if the entire basal area of the species in this treatment is considered, the total percentage is around 22% (Table S2). Even after 40 years, the number of suitable individuals makes up only 10% of the basal area (or 2.4 m2 ± 1.2 ha−1) (Figure 15b), compared to a possible 40%, which was the basal area occupied by all the individuals of the three species (Table S2). For that reason, the individuals of these species have difficulty in reaching DBH > 15 cm and being marketed as a product for sawmills and/or civil construction. Under the regenerating conditions of the managed area, in which competition for water, nutrients and sunlight occurs freely between species (without human interference, which might favour one or other species), there is little potential for obtaining products of greater added value by 15 or even 40 years. Added to this is the lack of statistical difference (p < 0.05) between the 15- and 40-year treatments, despite the basal area of suitable individuals (DBH > 15 cm) being approximately three times greater in T40.

4.3.3. Value Index by Species and Ecological Group

Even after 40 years, the area still presented the characteristics of vegetation in a phase of intermediate secondary succession, with few species of the late secondary ecological group (Table 4). Although the late secondary ecological group showed a trend towards an increasing IVI with regeneration time (treatments), it still did not surpass the IVI of the pioneer ecological group in the final treatment (40 years). On the contrary, the pioneer ecological group, which predominated in each treatment (after three years, it accounted for three-quarters of the IVI), despite showing a tendency to reduce its contribution with regeneration time, still accounted for approximately half of the IVI after 40 years.
C. blanchetianus, of the pioneer ecological group, was the predominant species in the managed area (Table 4 and Table S2). In second place in the pioneer ecological group was P. bracteosa, which also showed a high level of importance. In the early secondary group, the species M. caesalpiniifolia and C. leprosum have the greatest contribution to the IVI and, therefore, stood out in this group. These species also frequently appear in other regenerating areas of the forest [4,5,29,63,74].
In the late secondary ecological group, C. oncocalyx stood out for presenting an IVI that increased with regeneration time (treatments) and achieved the second highest value between the species in treatments T15 (9.98%) and T40 (20.48%). This growth was mainly due to the relative dominance (DoR) of the species, which reached 18.50% after 15 years and 40.65% after 40 years (Table S2). In the latter treatment, the relative dominance (DoR) of C. oncocalyx was greater than that of C. blanchetianus. C. oncocalyx is considered endemic to the SDTF [75] and has played a significant role in various floristic surveys in the state of Ceará [23,24], with occurrences also seen in some districts of the states of Rio Grande do Norte, Paraíba, Pernambuco, Minas Gerais and Bahia [76]. Despite its great economic potential, especially as timber, this species has undergone uncontrolled and inordinate extraction (which can cause depredation) in the SDTF, which has not guaranteed enough quality raw material to supply demanding sectors of the furniture industry [77]. The importance of this species is also due to its use as forage (albeit limited), and it can be found in agrosilvopastoral management systems [16,78].
As for the other species of the late secondary ecological group (M. urundeuva, Commiphora leptophloeo and A. cearensis), their contribution to the variables under study was still in the early stage. Although found in the managed area, their presence was small or even absent in some treatments, and their low contribution to the 15- and 40-year treatments should be noted. These species are usually associated with the most protected or well-preserved areas of the forest [16,27,29]; however, the preservation and protection of these species, or even the implementation of initiatives that could increase their presence, are urgent. In the youngest treatment (T3), the only individuals from the secondary ecological group were M. urundeuva and A. cearensis, precisely because they had not been cut. This shows that, in addition to the ecological function developed by these species, their maintenance mitigates the impacts of intervention, allowing, however modestly, their continued presence in the managed area.
In general terms, although the 15-year treatment showed good performance compared to the 40-year treatment, the study area showed signs of an environment under some simplification. This is because, even after 40 years, the area of Legal Reserve (control), in addition to having had little contribution of species associated with more protected areas (M. urundeuva, Commiphora leptophloeo and A. cearensis), includes only two species (C. blanchetianus and C. oncocalyx) that accounted for more than 60% of the abundance and dominance, and more than 50% of the IVI. This showed that human action, whether by the earlier exploitation of rainfed agriculture or by ongoing chronic disturbances, must be contributing to the simplification of this environment. A study that evaluated the effect of different chronic anthropogenic disturbances on the woody flora of the SDTF showed phylogenetic impoverishment of the forest [41,42]. It should be noted that these studies did not cover managed areas under clear-cutting, showing that there are still gaps for future research.

4.4. Effects of Management and Conservation

In general, however, the present work showed that forest intervention greatly affected the managed areas with regard to the following variables: biomass, biomass by species, total density, density by diameter class and by ecological group, density of dead plants, total basal area, basal area by diameter class and by ecological group, basal area of individuals suitable as stakes and basal area of individuals suitable for sawmills and/or construction. The changes promoted by clear-cutting were quite noticeable until at least 11 years following the intervention. With regard to common and dominant species, it was found that only the three-year treatment (T3) proved to be different and had less common or dominant species than the other treatments. There was no impact from the forest management on species richness. It was found that as regeneration advances (age of the treatments), the new structure and composition are able to meet certain diversity parameters, the conservation of ecosystem services, and the provision of habitats for different organisms, compared to the characteristics of the Legal Reserve (40-year treatment), although the Legal Reserve should receive some attention in terms of promoting the indicator species of more-protected areas. It should be noted that the high level of regeneration after 15 years is largely due to the sources (stumps and roots) being preserved and not subjected to so many chronic disturbances as the areas exploited under itinerant agriculture (conventional management), e.g., the use of fire, removal of stumps and no prohibition on removing wood before the new cutting cycle—15 years. In the latter, it has even been suggested that regeneration is limited or determined by extensive agricultural practices and/or forest exploitation (both in primary and secondary forests) that favour the regrowth of woody plant species in sandy soils [5]. In addition, the recruitment of seedlings from seeds plays an important role in certain contexts [28].
Although no statistical differences were seen between the 15-year treatment (the period suggested for further clear-cutting) and the 40-year treatment, it should be noted that there are limitations on the quality of the biomass despite the high level of regeneration due to the large accumulation of biomass. These limitations are due to the fact that an important part of this biomass (in T15) comes from the first two diameter classes (almost 90% of the individuals that occupy approximately 53.5% of the basal area), consisting of biomass that can only be used for firewood and/or charcoal and that comprises individuals of smaller diameter. As for the possibility of employing this biomass for different purposes (wood for stakes, posts, sawmills and/or civil construction), only a relatively small number of the species that are able to supply these different products achieved the required diameter. In the neotropical dry forest of Argentina, fewer trees with logging potential were seen in the forest undergoing regeneration [44], with researchers suggesting that to preserve the economic and ecological value of the forest, the density of non-timber tree species and the horizontal cover of the understorey should be kept at values close to those of the control forest.
The vast majority of forest management plans in the SDTF are at the intermediate stage, either because they were recently implemented and there has not been enough time for all 15 plots to be cut or because there were delays in cutting the plots, requiring longer than 15 years to complete exploitation of all the 15 plots. For this and other reasons, there are not many studies (of plots with up to 15 years of regeneration) on either the implications of management under clear-cutting during the first cutting cycle, with regard to the consequences for regeneration, or on the possible cumulative impacts of carrying out the second clear-cut (second cycle). The normative framework is deficient, with an almost total lack of forecasts, criteria and indicators for assessing the effectiveness of the applied management and its real impact on the sustainability of forest use [9]. It is necessary to carry out long-term studies, both from the temporal point of view (with more than one cutting cycle) and spatial (encompassing the most diverse features of the SDTF, especially in areas where there is forest management). Changes to current forms of forest exploitation are also defended in studies conducted in the neotropical dry forests of Argentina [44] and in the Miombo tropical dry forest in Africa [43].
Dry forests are less studied than wet forests [13]. It is therefore necessary for the scientific community, development agencies, and governments, among others, to pay more attention to dry environments since they will be more negatively affected by ongoing climate change than wet environments [30]. In this SDTF, there is a lack of information on the regeneration of vegetation in plots with more than one cutting cycle. There is no system with accurate information on management plans, such as clear-cutting times and ages of vegetation regeneration in the stands. This hinders both management and research. Furthermore, in this SDTF, one of the largest in the world [2], there are at least 13 phytophysiognomies [23,76], which need to be included in studies such as this. In addition, it is doubtful whether clear-cutting forest management will result in simplification of vegetation following successive cuts in these areas. In addition, numerous variations in temporal and spatial factors and indicators studied can be significant, which requires further research.
Considering the still early contribution of species that are protected from cutting, research should also be carried out to encourage a greater contribution of these species in managed areas. Other research aimed at adapting the current form of forest management (only clear-cutting) is essential to directing production towards obtaining products of greater added value. In this respect, the paring-down and/or thinning of certain species—bearing some similarity with management by rotation in the Ocotones forest of southern Mexico [11]—could favour an increase in the diameter and, consequently, the biomass of unaffected individuals (species with the potential for different uses, e.g., as stakes, posts or wood for sawmills and/or civil construction). With more individuals reaching a larger diameter class, greater profitability could be obtained by families marketing products of greater added value [12]. Finally, it should be noted that forest management in the SDTF competes for the same areas that are exploited on an itinerant basis by agriculture and livestock (predominantly including deforestation and burning), with livestock having a negative impact on more than just the areas under forest management. Furthermore, on these properties, both itinerant exploitation (with agriculture and livestock) and exploitation in the form of forest management cannot be carried out in areas of Legal Reserve (which are protected from slashing and burning and clear-cutting).

5. Conclusions

Up to at least 11 years following clear-cutting, many important characteristics of the forest related to the composition of the ecological groups and the structure of the vegetation are strongly affected, and major impacts can be seen. The effect of these impacts, however, decreases with the regeneration time, and they are practically neutralised after 15 years. Therefore, contrary to expectation, 15 years after clear-cutting, the SDTF presents an accumulation of shrub–tree biomass, species richness and a structure similar to an area undergoing regeneration for 40 years. However, given the low contribution of indicator species of more-preserved areas, especially after 15 and 40 years, more effort is needed with management so that these species become more prominent and are able to fulfil their ecological functions in the forest community. There is also a need for changes in management to promote species of greater added value, as well as for long-term research that answers whether the forest will maintain its species diversity and structure after successive clear-cutting (every 15 years).

Supplementary Materials

The following supporting information can be downloaded at: https://www.mdpi.com/article/10.3390/f14091870/s1, Table S1: Number of shrub–tree individuals by species and ecological group sampled in the different treatments in an area under a forest management plan in the Seasonally Dry Tropical Forest, Brazil: T3 to T15 (plots/years of regeneration) and T40 (legal reserve/years of regeneration); Table S2: Importance value index (IVI) (%) by species and ecological group sampled in an area under a forest management plan in the Seasonally Dry Tropical Forest, Brazil: T3 to T15 (plots/years of regeneration) and T40 (Legal Reserve/years of regeneration). This index is estimated based on the relative density (DeR), relative dominance (DoR) (based on basal area), and relative frequency (FrR) of trees. IVI was calculated as: IVI = (DeR + DoR + FrR)/3.

Author Contributions

Conceptualization, J.F.B.L., F.B.L. and E.M.d.A.; methodology, J.F.B.L., F.B.L., E.M.d.A. and E.C.B.P.; validation, F.B.L., E.M.d.A. and I.C.d.S.A.; formal analysis, J.F.B.L., F.B.L., E.d.O.F. and E.M.d.A.; investigation, J.F.B.L., F.B.L., E.M.d.A. and M.L.S.M.B.; resources, J.F.B.L., F.B.L., E.M.d.A., I.C.d.S.A., E.C.B.P., M.L.S.M.B., E.d.O.F., N.R.d.S.L., G.G.d.S., A.V.A. and B.d.F.I.; writing—original draft preparation, J.F.B.L., F.B.L. and E.M.d.A.; writing—review and editing, J.F.B.L., F.B.L., E.M.d.A., I.C.d.S.A., E.C.B.P., M.L.S.M.B., E.d.O.F., N.R.d.S.L., G.G.d.S., A.V.A. and B.d.F.I.; visualization, J.F.B.L., F.B.L., E.M.d.A., I.C.d.S.A., E.C.B.P., M.L.S.M.B., E.d.O.F., N.R.d.S.L., G.G.d.S., A.V.A. and B.d.F.I.; supervision, F.B.L. and E.M.d.A.; project administration, J.F.B.L., F.B.L. and E.M.d.A.; funding acquisition, J.F.B.L., F.B.L. and E.M.d.A. All authors have read and agreed to the published version of the manuscript.

Funding

The authors wish to thank the National Council for Scientific and Technological Development—CNPq, process no 439.304/2018-0 and process no 311886/2020-5, the National Institute of Colonization and Agrarian Reform—INCRA, the State Development Agency of Ceará (Adece), process no 09/2017 and the Graduate Program in Agricultural Engineering of the Federal University of Ceará—PPGEA/UFC for their financial support.

Data Availability Statement

Not applicable.

Acknowledgments

Thanks go to the State Superintendence of the Environment of Ceará–SEMACE for suggesting the original project. Further thanks go to the Prefeitura Municipal de General Sampaio for granting access and for introducing the researchers to the community. Finally, we would like to thank the Associação do Assentamento Ramalhete for allowing the area to be used for research and for the cordial welcome.

Conflicts of Interest

The authors declare no conflict of interest.

References

  1. FAO. Trees, Forests and Land Use in Drylands: The First Global Assessment—Full Report. FAO Forestry Paper No. 184. Rome. 2019. Available online: https://www.fs.usda.gov/rm/pubs_journals/2019/rmrs_2019_patriarca_c001.pdf (accessed on 20 June 2023).
  2. Silva, J.M.C.; Leal, I.R.; Tabarelli, M. Caatinga: The Largest Tropical Dry Forest Region in South America; Springer International Publishing: Cham, Switzerland, 2017; 482p. [Google Scholar] [CrossRef]
  3. Moro, M.F.; Nic Lughadha, E.; de Araújo, F.S.; Martins, F.R. A Phytogeographical Metaanalysis of the Semiarid Caatinga Domain in Brazil. Bot. Rev. 2016, 82, 91–148. [Google Scholar] [CrossRef]
  4. Souza, D.G.; Sfair, J.C.; de Paula, A.S.; Barros, M.F.; Rito, K.F.; Tabarelli, M. Multiple drivers of aboveground biomass in a human-modified landscape of the Caatinga dry forest. For. Ecol. Manag. 2018, 435, 57–65. [Google Scholar] [CrossRef]
  5. Barros, M.F.; Ribeiro, E.M.; Vanderlei, R.S.; de Paula, A.S.; Silva, A.B.; Wirth, R.; Cianciaruso, M.V.; Tabarelli, M. Resprouting drives successional pathways and the resilience of Caatinga dry forest in human-modified landscapes. For. Ecol. Manag. 2020, 482, 118881. [Google Scholar] [CrossRef]
  6. Arnan, X.; Leal, I.R.; Tabarelli, M.; Andrade, J.F.; Barros, M.F.; Câmara, T.; Jamelli, D.; Knoechelmann, C.M.; Menezes, T.G.; Menezes, A.G.; et al. A framework for deriving measures of chronic anthropogenic disturbance: Surrogate, direct, single and multi-metric indices in Brazilian Caatinga. Ecol. Indic. 2018, 94, 274–282. [Google Scholar] [CrossRef]
  7. APNE—Associação Plantas do Nordeste: Planos de Manejo Florestal Sustentado na Caatinga. Available online: http://www.cnip.org.br/planos_manejo.html (accessed on 20 June 2023).
  8. SEMACE—Superintendência Estadual do Meio Ambiente do Estado do Ceará. Relação de Planos de Manejo. Available online: https://www.semace.ce.gov.br/wp-content/uploads/sites/46/2019/11/PLANILHA-PMF-ATUALIZADA.pdf (accessed on 20 June 2023).
  9. Riegelhaupt, E.; Pareyn, F.G.C.; Gariglio, M.A. O manejo florestal como ferramenta para o uso sustentável e conservação da caatinga. In Uso Sustentável e Conservação dos Recursos Florestais da Caatinga; Gariglio, M.A., Sampaio, E.V.S.B., Cestaro, L.A., Kageyama, P.Y., Eds.; Serviço Florestal Brasileiro: Brasília, Brasil, 2010; pp. 349–367. ISBN 978-85-63269-04-1. [Google Scholar]
  10. Sist, P.; Mazzei, L.; Blanc, L.; Rutishauser, E. Large trees as key elements of carbon storage and dynamics after selective logging in the Eastern Amazon. For. Ecol. Manag. 2014, 318, 103–109. [Google Scholar] [CrossRef]
  11. Martínez-Meléndez, N.; Ramírez-Marcial, N.; Martínez-Zurimendi, P.; Cach-Pérez, M.J.; García-Franco, J.G. How Timber Harvest Affects the Structure and Diversity of a Montane Forest in Southern Mexico. Forests 2021, 12, 895. [Google Scholar] [CrossRef]
  12. Lopes, J.F.B.; Lopes, F.B.; Andrade, E.M.; Aquino, D.N. Composição florística com indutor da agregação de valor à biomassa florestal em vegetação caatinga. In Proceedings of the V Simpósio Brasileiro de Recursos Naturais do Semiárido-SBRNS, Fortaleza, Ceará, Brasil, 27 October 2021; Available online: https://drive.google.com/file/d/1Y2HHyi38nKBxVdbBR8WCw2kmNgqmWLNJ/view (accessed on 21 June 2023).
  13. Schröder, J.M.; Rodríguez, L.P.; Günter, S. Research trends: Tropical dry forests: The neglected research agenda? For. Policy Econ. 2020, 122, 102333. [Google Scholar] [CrossRef]
  14. Alcoforado-Filho, F.G.; Sampaio, E.V.d.S.B.; Rodal, M.J.N. Florística e fitossociologia de um remanescente de vegetação caducifólia espinhosa arbórea em Caruaru, Pernambuco. Acta Bot. Bras. 2003, 17, 287–303. [Google Scholar] [CrossRef]
  15. Sampaio, E.V.; Silva, G.C. Biomass equations for Brazilian semiarid caatinga plants. Acta Bot. Bras. 2005, 19, 935–943. [Google Scholar] [CrossRef]
  16. Araújo Filho, J.A. Manejo Pastoril Sustentável da Caatinga; Projeto Dom Helder Câmara: Recife, PE, Brasil, 2013; 200p, ISBN 978-85-64154-04-9. [Google Scholar]
  17. Andrade, E.M.; Aquino, D.N.; Chaves, L.C.G.; Lopes, F.B. Water as Capital and Its Uses in the Caatinga, In Caatinga: The Largest Tropical Dry Forest Region in South America, 1st ed.; Silva, J.M.C., Leal, I.R., Tabarelli, M., Eds.; Springer International Publishing: Cham, Switzerland, 2017; pp. 281–302. [Google Scholar] [CrossRef]
  18. Júnior, L.R.P.; de Andrade, E.M.; Palácio, H.A.d.Q.; Raymer, P.C.L.; Filho, J.C.R.; Pereira, F.J.S. Carbon stocks in a tropical dry forest in Brazil. Rev. Ciên. Agron. 2016, 47, 32–40. [Google Scholar] [CrossRef]
  19. Sabino, F.G.d.S.; Cunha, M.D.C.L.; Santana, G.M. Estrutura da Vegetação em Dois Fragmentos de Caatinga Antropizada na Paraíba. Flor. Amb. 2016, 23, 487–497. [Google Scholar] [CrossRef]
  20. de Souza, M.R.; Ferreira, M.B.; de Sousa, G.G.; Alves, A.R.; de Holanda, A.C. Caracterização florística e fitossociológica do componente lenhoso de um fragmento florestal de caatinga em serra do mel, rio grande do norte, brasil. Nativa 2020, 8, 329–335. [Google Scholar] [CrossRef]
  21. Santos, D.L.; Lopes, F.B.; Aquino, D.N. Análise da densidade de indivíduos em fragmentos da vegetação arbórea-arbustiva no bioma caatinga. In Proceedings of the V Simpósio Brasileiro de Recursos Naturais do Semiárido-SBRNS, Fortaleza, Ceará, Brasil, 27 October 2021; Available online: https://drive.google.com/file/d/16ybbmslYhDrT_cahyuOUTUMDcK5aq0sL/view (accessed on 23 June 2023).
  22. Maia, A.R.S.; Lopes, F.B.; de Andrade, E.M. Influence of Climatic Seasonality on a Survey of Land Use and Cover in the Semi-arid Region. J. Agric. Sci. 2018, 10, 311–325. [Google Scholar] [CrossRef]
  23. Costa, R.C.; Araújo, F.S. Physiognomy and structure of a caatinga with Cordia oncocalyx (Boraginaceae), a new type of community in Andrade-Lima’s classification of caatingas. Rodriguésia 2012, 63, 269–276. [Google Scholar] [CrossRef]
  24. Souza, E.B.; Nepomuceno, F.Á.A.; Santos, F.D.S.; Araújo, F.F.; Nepomuceno, I.V.; Paula, A.S.; Amorim, V.O.; Branco, M.S.D.; Rabelo, S.T.; Pinto, D.M.M.; et al. Flora and physiognomy of Caatinga vegetation over crystalline bedrock in the northern Caatinga domain, Brazil. Rodriguésia 2022, 73, e01252021. [Google Scholar] [CrossRef]
  25. Lopes, J.F.B.; De Andrade, E.M.; Pereira, E.C.B.; Campos, D.A.; Aquino, D.D.N. Cut cycles and soil carbon potential stocks in a managed forest in the caatinga domain in brazil. Rev. Caatin. 2020, 33, 735–745. [Google Scholar] [CrossRef]
  26. Campos, D.A.; Andrade, E.M.; Castanho, A.D.A.; Feitosa, R.C.; Palácio, H.Q.A. Biomass Dynamics in a Fragment of Brazilian Tropical Forest (Caatinga) over Consecutive Dry Years. Appl. Sci. 2020, 10, 7813. [Google Scholar] [CrossRef]
  27. Andrade, L.A.; Pereira, I.M.; Leite, U.T.; Barbosa, M.R.V. Análise da cobertura de duas fitofisionomias de caatinga, com diferentes históricos de uso, no município de São João do Cariri, Estado da Paraíba. Rev. Cerne 2005, 11, 253–262. Available online: https://cerne.ufla.br/site/index.php/CERNE/article/view/442/381 (accessed on 23 June 2023).
  28. Lopes, C.G.R.; Ferraz, E.M.N.; de Castro, C.C.; de Lima, E.N.; dos Santos, J.M.F.F.; dos Santos, D.M.; Araújo, E.d.L. Forest succession and distance from preserved patches in the Brazilian semiarid region. For. Ecol. Manag. 2012, 271, 115–123. [Google Scholar] [CrossRef]
  29. Cabral, G.A.L.; Sampaio, E.V.S.B.; Almeida-Cortez, J.S. Estrutura espacial e biomassa da parte aérea em diferentes estágios sucessionais de Caatinga, em Santa Terezinha, Paraíba. Rev. Bras. Geog. Fís. 2013, 6, 566–574. [Google Scholar] [CrossRef]
  30. Siyum, Z.G. Tropical dry forest dynamics in the context of climate change: Syntheses of drivers, gaps, and management perspectives. Ecol. Proc. 2020, 9, 1–16. [Google Scholar] [CrossRef]
  31. Aquino, D.d.N.; Neto, O.C.d.R.; Moreira, M.A.; Teixeira, A.d.S.; de Andrade, E.M. Use of remote sensing to identify areas at risk of degradation in the semi-arid region. Rev. Cienc. Agron. 2018, 49, 420–429. [Google Scholar] [CrossRef]
  32. Duarte, M.R.N.; Pereira, T.M.; Lima, P.F.; Pereira, E.C.B.; Lopes, F.B.; Rezende, C.F. Limnological dynamics in artificial reservoir and intermittent river in the semiarid region depending on land use and occupation. Rev. Cien. Agron. 2021, 51, e20207181. [Google Scholar] [CrossRef]
  33. Chaves, L.C.G.; Lopes, F.B.; Maia, A.R.S.; Meireles, A.C.M.; De Andrade, E.M. Water quality and anthropogenic impact in the watersheds of service reservoirs in the Brazilian semi-arid region. Rev. Cien. Agron. 2019, 50, 223–233. [Google Scholar] [CrossRef]
  34. Pereira, E.C.B.; Lopes, F.B.; Almeida, A.M.M.; Andrade, E.M.; Lopes, J.F.B. Sedimentos e nutrientes aportados a um reservatório de pequeno porte no Semiárido tropical. Rev. Cien. Agron. 2021, 52, e20196717. [Google Scholar] [CrossRef]
  35. Edwards, D.P.; Socolar, J.B.; Mills, S.C.; Burivalova, Z.; Koh, L.P.; Wilcove, D.S. Conservation of Tropical Forests in the Anthropocene. Cur. Biol. 2019, 29, R1008–R1020. [Google Scholar] [CrossRef]
  36. Carlson, K.M.; Heilmayr, R.; Gibbs, H.K.; Noojipady, P.; Burns, D.N.; Morton, D.C.; Walker, N.F.; Paoli, G.D.; Kremen, C. Effect of oil palm sustainability certification on deforestation and fire in Indonesia. Proc. Natl. Acad. Sci. USA 2018, 115, 121–126. [Google Scholar] [CrossRef]
  37. WWF—World Wildlife Fund. Forests the Size of France Grow Again in the Last 20 Years—New Study. Available online: https://www.wwf.org.uk/press-release/wwf-forest-regeneration-study (accessed on 16 August 2023).
  38. Nanni, A.S.; Sloan, S.; Aide, T.M.; Graesser, J.; Edwards, D.; Grau, H.R. The neotropical reforestation hotspots: A biophysical and socioeconomic typology of contemporary forest expansion. Glob. Environ. Chang. 2019, 54, 148–159. [Google Scholar] [CrossRef]
  39. Potapov, P.; Hansen, M.C.; Pickens, A.; Hernandez-Serna, A.; Tyukavina, A.; Turubanova, S.; Zalles, V.; Li, X.; Khan, A.; Stolle, F.; et al. The Global 2000–2020 Land Cover and Land Use Change Dataset Derived from the Landsat Archive: First Results. Front. Remo. Sens. 2022, 3, 856903. [Google Scholar] [CrossRef]
  40. Brancalion, P.H.S.; Chazdon, R.L. Beyond hectares: Four principles to guide reforestation in the context of tropical forest and landscape restoration. Restor. Ecol. 2017, 25, 491–496. [Google Scholar] [CrossRef]
  41. Ribeiro, E.M.S.; Arroyo-Rodríguez, V.; Santos, B.A.; Tabarelli, M.; Leal, I.R. Chronic anthropogenic disturbance drives the biological impoverishment of the Brazilian Caatinga vegetation. J. Appl. Ecol. 2015, 52, 611–620. [Google Scholar] [CrossRef]
  42. Ribeiro, E.M.S.; Santos, B.A.; Arroyo-Rodríguez, V.; Tabarelli, M.; Souza, G.; Leal, I.R. Phylogenetic impoverishment of plant communities following chronic human disturbances in the Brazilian Caatinga. Ecology 2016, 97, 1583–1592. [Google Scholar] [CrossRef]
  43. Montfort, F.; Nourtier, M.; Grinand, C.; Maneau, S.; Mercier, C.; Roelens, J.; Blanc, L. Regeneration capacities of woody species biodiversity and soil properties in Miombo woodland after slash-and-burn agriculture in Mozambique. For. Ecol. Manag. 2021, 488, 119039. [Google Scholar] [CrossRef]
  44. Tallei, E.; Rivera, L.; Schaaf, A.; Vivanco, C.; Politi, N. Post-logging changes in a neotropical dry forest composition and structure modify the ecosystem functioning. For. Ecol. Manag. 2023, 537, 120944. [Google Scholar] [CrossRef]
  45. Arroyo-Rodríguez, V.; Melo, F.P.L.; Martínez-Ramos, M.; Bongers, F.; Chazdon, R.L.; Meave, J.A.; Norden, N.; Santos, B.A.; Leal, I.R.; Tabarelli, M. Multiple successional pathways in human-modified tropical landscapes: New insights from forest succession, forest fragmentation and landscape ecology research. Biol. Rev. 2015, 92, 326–340. [Google Scholar] [CrossRef] [PubMed]
  46. Chazdon, R.L.; Guariguata, M.R. Natural regeneration as a tool for large-scale forest restoration in the tropics: Prospects and challenges. Biotropica 2016, 48, 716–730. [Google Scholar] [CrossRef]
  47. Ding, Y.; Zang, R.; Lu, X.; Huang, J. The impacts of selective logging and clear-cutting on woody plant diversity after 40 years of natural recovery in a tropical montane rain forest, south China. Sci. Total Environ. 2017, 579, 1683–1691. [Google Scholar] [CrossRef]
  48. FUNCEME. Fundação Cearense de Meteorologia e Recursos Hídricos. Índices de Aridez do Estado do Ceará. Available online: http://www.funceme.br/?page_id=5826 (accessed on 11 August 2023).
  49. Andrade, E.M.; Sena, M.G.T.; Silva, A.G.R.; Pereira, F.J.S.; Lopes, F.B. Uncertainties of the rainfall regime in a tropical semi-arid region: The case of the State of Ceará. Rev. Agro@mbiente Online 2016, 10, 88–95. [Google Scholar] [CrossRef]
  50. VERDE VIDA. Reformulação de Plano de Manejo Agrossilvipastoril de Ramalhete; Verde Vida Engenharia Ambiental: General Sampaio, CE, Brasil, 2010; 121p. [Google Scholar]
  51. Santos, H.G.; Carvalho Junior, W.; Dart, R.O.; Aglio, M.L.D.; Sousa, J.S.; Pares, J.G.; Fontana, A.; Martins, A.L.S.; Oliveira, A.P. O Novo Mapa de Solos do Brasil: Legenda Atualizada, 1st ed.; Embrapa Solos: Rio de Janeiro, Brasil, 2011; 67p, ISSN 1517-2627. Available online: https://ainfo.cnptia.embrapa.br/digital/bitstream/item/123772/1/DOC-130-O-novo-mapa-de-solos-do-Brasil.pdf (accessed on 16 August 2023).
  52. EMBRAPA. Embrapa Monitoramento por Satélite. Mapa de Cobertura Vegetal do Brasil. Available online: http://geoinfo.cnpm.embrapa.br/ (accessed on 10 August 2023).
  53. NASA JPL. NASA Shuttle Radar Topography Mission Global 1 Arc Second [Data Set]. NASA EOSDIS Land Processes Distributed Active Archive Center. 2013. Available online: https://lpdaac.usgs.gov/products/srtmgl1v003/ (accessed on 10 August 2023).
  54. Lopes, J.F.B. Dinâmica da Biomassa Aérea e Remanescente em área de Plano de Manejo na Floresta Tropical Seca, Caatinga. Mestrado; Universidade Federal do Ceará: Fortaleza, CE, Brasil, 2018; Available online: https://repositorio.ufc.br/handle/riufc/37030 (accessed on 10 August 2023).
  55. Jesus, K.N.; Albuquerque, E.R.G.M.; Pareyn, F.G.C.; Menezes, R.S.C.; Sampaio, E.V.S.B.; Costa, T.L.; Althoff, T.D. Guia Metodológico Para o Desenvolvimento de Atividades de Campo e Laboratório do Projeto CNPQ; Rede—C—NE: Recife, PE, Brasil, 2016; 35p. [Google Scholar]
  56. Rodal, M.J.N.F.; Sampaio, E.V.S.B.; Figueiredo, M.A. Manual Sobre Métodos de Estudos Florísticos e Fitossociológicos—Ecossistema Caatinga, 1st ed.; Sociedade Botânica do Brasil: Brasília, Brasil, 2013; 24p, ISBN 978-85-60428-03-8. Available online: https://www.botanica.org.br/wp-content/uploads/man_sob_met_est_flo_fit.pdf (accessed on 26 June 2023).
  57. Curtis, J.T.; Mcintosh, R.P. The interrelations of certain analytic and synthetic phytosociological characters. Ecology 1950, 31, 434–455. [Google Scholar] [CrossRef]
  58. Hill, M.O. Diversity and evenness: A unifying notation and its consequences. Ecology 1973, 54, 427–432. [Google Scholar] [CrossRef]
  59. Chao, A.; Gotelli, N.J.; Hsieh, T.C.; Sander, E.L.; Ma, K.H.; Colwell, R.K.; Ellison, A.M. Rarefaction and extrapolation with Hill numbers: A framework for sampling and estimation in species diversity studies. Ecol. Monog. 2014, 84, 45–67. [Google Scholar] [CrossRef]
  60. Hsieh, T.C.; Ma, K.H.; Chao, A. iNEXT: An R package for rarefaction and extrapolation of species diversity (Hill numbers). Meth. Ecol. Evol. 2016, 7, 1451–1456. [Google Scholar] [CrossRef]
  61. Banda, T.; Mwangulango, N.; Meyer, B.; Schwartz, M.W.; Mbago, F.; Sungula, M.; Caro, T. The woodland vegetation of the Katavi-Rukwa ecosystem in western Tanzania. For. Ecol. Manag. 2008, 255, 3382–3395. [Google Scholar] [CrossRef]
  62. Sahu, S.C.; Suresh, H.S.; Ravindranath, N.H. Forest Structure, Composition and Above Ground Biomass of Tree Community in Tropical Dry Forests of Eastern Ghats, India. Not. Sci. Biol. 2016, 8, 125–133. [Google Scholar] [CrossRef]
  63. Rito, K.F.; Arroyo-Rodríguez, V.; Queiroz, R.T.; Leal, I.R.; Tabarelli, M. Precipitation mediates the effect of human disturbance on the Brazilian Caatinga vegetation. J. Ecol. 2017, 105, 828–838. [Google Scholar] [CrossRef]
  64. Poorter, L.; Bongers, F.; Aide, T.M.; Zambrano, A.M.A.; Balvanera, P.; Becknell, J.M.; Boukili, V.; Brancalion, P.H.S.; Broadbent, E.N.; Chazdon, R.L.; et al. Biomass resilience of Neotropical secondary forests. Nature 2016, 530, 211–214. [Google Scholar] [CrossRef]
  65. Feitosa, R.C. Estoque de Carbono em Floresta Tropical Sazonalmente Seca no Nordeste do Brasil: Uma Comparação Entre dois usos do solo. Doutorado; Universidade Federal do Ceará: Fortaleza, CE, Brasil, 2017; Available online: https://repositorio.ufc.br/handle/riufc/28686 (accessed on 3 July 2023).
  66. Sampaio, E.V.S.B. Caracterização do bioma caatinga—características e potencialidades. In Uso Sustentável e Conservação dos Recursos Florestais da Caatinga; Gariglio, M.A., Sampaio, E.V.S.B., Cestaro, L.A., Kageyama, P.Y., Eds.; Serviço Florestal Brasileiro: Brasília, Brasil, 2010; pp. 29–42. ISBN 978-85-63269-04-1. [Google Scholar]
  67. Sampaio, E.V.S.B.; Araújo, E.L.; Salcedo, I.H.; Tiessen, H. Regeneração da vegetação de caatinga após corte e queima, em Serra Talhada, PE. Pesq. Agrop. Bras. 1998, 33, 621–632. Available online: https://seer.sct.embrapa.br/index.php/pab/article/view/4890 (accessed on 26 June 2023).
  68. Kiill, L.H.P. (Coord.). Plantas da Caatinga Ameaçadas de Extinção: Estudos Preliminares e Manejo; Embrapa Semi-Árido: Petrolina, PE, Brasil, 2008; 87p, Available online: https://www.infoteca.cnptia.embrapa.br/infoteca/handle/doc/160098 (accessed on 27 June 2023).
  69. Kammesheidt, L. Forest recovery by root suckers and above-ground sprouts after slash-and-burn agriculture, fire and logging in Paraguay and Venezuela. J. Trop. Ecol. 1999, 15, 143–157. [Google Scholar] [CrossRef]
  70. Stoner, K.E.; Sánchez-Azofeifa, G.A. Ecology and regeneration of tropical dry forests in the Americas: Implications for management. For. Ecol. Manag. 2009, 258, 903–906. [Google Scholar] [CrossRef]
  71. Moro, M.F.; Araújo, F.S.; Rodal, M.J.N.; Martins, F.R. Síntese dos estudos florísticos e fitossociológicos realizados no semiárido brasileiro. In Fitossociologia No Brasil, 1st ed.; Eisenlohr, P.V., Felfili, J.M., Melo, M.M.R.F., Andrade, L.A., Meira Neto, J.A.A., Eds.; Editora da Universidade Federal de Viçosa: Viçosa, MG, Brasil, 2015; Volume 2, pp. 412–451. [Google Scholar]
  72. Yan, P.; Xu, L.; He, N. Variation in the calorific values of different plants organs in China. PLoS ONE 2018, 13, e0199762. [Google Scholar] [CrossRef]
  73. Zeng, W.S.; Tang, S.Z.; Xiao, Q.H. Calorific values and ash contents of different parts of Masson pine trees in southern China. J. For. Res. 2014, 25, 779–786. [Google Scholar] [CrossRef]
  74. Pereira Filho, J.M.; Bakke, O.A. Produção de forragem de espécies herbáceas da caatinga. In Uso Sustentável e Conservação dos Recursos Florestais da Caatinga; Gariglio, M.A., Sampaio, E.V.S.B., Cestaro, L.A., Kageyama, P.Y., Eds.; Serviço Florestal Brasileiro: Brasília, Brasil, 2010; pp. 145–159. ISBN 978-85-63269-04-1. [Google Scholar]
  75. Brito, L.B.M.; Araújo, F.S. Banco de sementes de Cordia oncocalyx Allemão em uma área de Caatinga sobre planossolo. Rev. Caat. 2009, 22, 206–212. Available online: https://periodicos.ufersa.edu.br/caatinga/article/view/321/631 (accessed on 27 June 2023).
  76. Andrade-Lima, D. The caatinga dominium. Rev. Bras. Bot. 1981, 4, 149–153. [Google Scholar]
  77. Muniz, C.R.; Correia, D.; Soares, A.A. Method of opening the fruits, biometry and anatomical description of embryonic development in pau-branco (Cordia oncocalyx Allemão) seeds. Ciên. Flor. 2022, 32, 979–995. [Google Scholar] [CrossRef]
  78. Aguiar, M.I.; Fialho, J.S.; Campanha, M.M.; Oliveira, T.S. Florística e estrutura vegetal em áreas de Caatinga sob diferentes sistemas de manejo. Pesq. Flor. Bra. 2019, 39, 1–11. [Google Scholar] [CrossRef]
Figure 1. Location of the Ramalhete Settlement Project, General Sampaio, Ceará, Brazil.
Forests 14 01870 g001
Figure 2. Rainfall (mm) of the Ramalhete Settlement Project, General Sampaio, Ceará, Brazil.
Forests 14 01870 g002
Figure 3. Soils classification of the Ramalhete Settlement Project, General Sampaio, Ceará, Brazil.
Forests 14 01870 g003
Figure 4. Vegetation of the Ramalhete Settlement Project, General Sampaio, Ceará, Brazil.
Forests 14 01870 g004
Figure 5. Slope map of the Ramalhete Settlement Project, General Sampaio, Ceará, Brazil.
Forests 14 01870 g005
Figure 6. Altitude map of the Ramalhete Settlement Project, General Sampaio, Ceará, Brazil.
Forests 14 01870 g006
Figure 7. Historical timeline of interventions that took place in the study area. T3 to T15 (plots/years of regeneration) and T40 (Legal Reserve/years of regeneration).
Forests 14 01870 g007
Figure 8. Accumulation curves of shrub–tree species as a function of regeneration time in an area under a forest management plan in the Seasonally Dry Tropical Forest, Brazil: T3 to T15 (plots/years of regeneration) and T40 (Legal Reserve/years of regeneration). Solid lines show interpolation (rarefaction), while dashed lines show extrapolation. Diversity is represented using Hill numbers: 0D, observed richness; 1D, common species; 2D, dominant species. The coloured bands correspond to the confidence interval of 95%.
Forests 14 01870 g008
Figure 9. Shrub-tree biomass as a function of regeneration time in an area under a forest management plan in the Seasonally Dry Tropical Forest, Brazil: T3 to T15 (plots/years of regeneration) and T40 (Legal Reserve/years of regeneration). Different letters indicate significant differences between treatments (Tukey’s test; p ≤ 0.05). Outliers: ° discrepant; * extreme.
Forests 14 01870 g009
Figure 10. Unexploited shrub–tree biomass (preserved plants) as a function of regeneration time in an area under a forest management plan in the Seasonally Dry Tropical Forest, Brazil: T3 to T15 (plots/years of regeneration) and T40 (Legal Reserve/years of regeneration). Different letters indicate significant differences between treatments (Kruskal–Wallis test; p ≤ 0.05). Outliers: * extreme.
Forests 14 01870 g010
Figure 11. Tree–shrub biomass by species as a function of regeneration time in an area under a forest management plan in the Seasonally Dry Tropical Forest, Brazil: T3 to T15 (plots/years of regeneration) and T40 (Legal Reserve/years of regeneration).
Forests 14 01870 g011
Figure 12. Density of all living individuals by ecological group (a) and by diameter class (b) as a function of regeneration time (treatments) in an area under a forest management plan in the Seasonally Dry Tropical Forest, Brazil: T3 to T15 (plots/years of regeneration) and T40 (Legal Reserve/years of regeneration).
Forests 14 01870 g012
Figure 13. Density of dead plants as a function of regeneration time in an area under a forest management plan in the Seasonally Dry Tropical Forest, Brazil: T3 to T15 (plots/years of regeneration) and T40 (Legal Reserve/years of regeneration). Different letters indicate significant differences between treatments (Kruskal–Wallis test, p ≤ 0.05). Outliers: ° discrepant; * extreme.
Forests 14 01870 g013
Figure 14. Basal area of all individuals by ecological group (a) and diameter class (b) as a function of regeneration time (treatments) in an area under a forest management plan in the Seasonally Dry Tropical Forest, Brazil: T3 to T15 (plots/years of regeneration) and T40 (Legal Reserve/years of regeneration).
Forests 14 01870 g014
Figure 15. Basal area of individuals with the potential for greater added value—suitable for stakes (a) and for sawmills (b)—as a function of regeneration time (treatments) in an area under a forest management plan in the Seasonally Dry Tropical Forest, Brazil: T3 to T15 (plots/years of regeneration) and T40 (Legal Reserve/years of regeneration). (a) Posts (individuals of species M. caesalpiniifolia and C. blanchetianus with a diameter of 8–14.99 cm) and (b) sawmill/civil construction (individuals of species C. oncocalyx with a diameter > 15 cm). Different letters indicate significant differences between treatments (Kruskal–Wallis test, p ≤ 0.05). Outliers: ° discrepant.
Forests 14 01870 g015
Table 1. Accumulated number and percentage of species as a function of regeneration time, in an area under a forest management plan in the Seasonally Dry Tropical Forest, Brazil: T3 to T15 (plots/years of regeneration) and T40 (Legal Reserve/years of regeneration). Species numbers are separated ecologically.
ParameterAccumulated Number and Percentage of Species of Each Treatment
T3%T5%T8%T11%T15%T40%Total
Species13382265205925742368195634
Ecological Group
Pioneer75483673572883563210
Early secondary4317326308328357379
Late secondary2155234206244175268
Undetermined0029315416313157
Total13100221002010025100231001910034
Table 2. Tree–shrub biomass by species as a function of regeneration time in an area under a forest management plan in the Seasonally Dry Tropical Forest, Brazil: T3 to T15 (plots/years of regeneration) and T40 (Legal Reserve/years of regeneration). Average values ± standard errors are shown for the main species. Different letters indicate significant differences in each row (* Kruskal–Wallis p < 0.05).
SpeciesBiomass of Each Treatment (Mg ha−1)
T3T5T8T11T15T40
Poincianella bracteosa *0.05 ± 0.03 b2.29 ± 0.58 a3.04 ± 0.86 a4.50 ± 1.88 a4.10 ± 1.21 a4.66 ± 3.19 a
Croton blanchetianus *3.28 ± 0.83 d5.74 ± 0.80 cd7.69 ± 1.07 bcd11.38 ± 2.16 abc14.76 ± 1.66 a14.60 ± 4.29 ab
Combretum leprosum *0.35 ± 0.08 a 1.54 ± 0.33 a 3.01 ± 1.37 a 3.83 ± 1.64 a3.69 ± 1.25 a4.91 ± 2.50 a
Cordia oncocalyx *0.00 b1.57 ± 0.45 a5.37 ± 2.06 a2.96 ± 1.17 a11.25 ± 4.64 a30.88 ± 11.28 a
Mimosa caesalpiniifolia *0.27 ± 0.21 b0.04 ± 0.03 b1.63 ± 0.80 a3.35 ± 1.17 a3.53 ± 1.50 a7.94 ± 3.30 a
Remaining species 16.93 ± 4.214.98 ± 1.1211.32 ± 2.0912.31 ± 3.4813.62 ± 2.634.33 ± 2.43
1 Analysis was not carried out, since the objective was to verify the existence of differences at the species level, between treatments, and this line contains the biomass of several species together.
Table 3. Density and basal area of trees (CBH > 6 cm) as a function of regeneration time in an area under a forest management plan in the Seasonally Dry Tropical Forest, Brazil: T3 to T15 (plots/years of regeneration) and T40 (Legal Reserve/years of regeneration). Average values ± standard errors are shown for each variable by ecological group and diameter class. Different letters indicate significant differences in each row (* Tukey p < 0.05; ** Kruskal–Wallis p < 0.05).
VariableDensity and Basal Area of Trees of Each Treatment
T3T5T8T11T15T40
Density (individuals ha−1) *1729 ± 265 c3386 ± 392 ab4386 ± 216 a4368 ± 516 a2893 ± 242 abc2657 ± 441 bc
Ecological Group
Pioneer *1604 ± 281 b2704 ± 307 ab3625 ± 122 a3407 ± 537 a2168 ± 293 ab1821 ± 417 b
Early secondary **107 ± 15 b564 ± 177 a546 ± 156 a650 ± 131 a557 ± 147 a543 ± 99 a
Late secondary **18 ± 7 c100 ± 26 bc164 ± 59 ab 275 ± 31 a139 ± 22 ab289 ± 135 ab
Undetermined018 ± 950 ± 2936 ± 2429 ± 164 ± 4
Diameter class
2–4.99 cm **1693 ± 270 c3357 ± 386 ab4161 ± 209 a3750 ± 537 a1814 ± 232 bc1689 ± 407 c
5–7.99 cm **14 ± 9 d25 ± 13 cd214 ± 45 bc457 ± 121 ab779 ± 68 a525 ± 80 ab
8–14.99 cm **14 ± 5 bc4 ± 4 c7 ± 7 c139 ± 57 ab279 ± 44 a414 ± 68 a
>15 cm **7 ± 5 abc0 c4 ± 4 bc21 ± 10 ab21 ± 9 ab29 ± 10 a
Basal área (m2 ha−1) *3.0 ± 0.6 e8.0 ± 1.1 de13.7 ± 1.1 cd16.7 ± 1.7 bc20.2 ± 1.8 ab25.0 ± 1.6 a
Ecological Group
Pioneer **2.1 ± 0.5 c5.8 ± 0.8 bc9.0 ± 0.3 ab9.2 ± 1.1 ab11.4 ± 0.7 a9.2 ± 2.5 ab
Early secondary **0.2 ± 0.0 c1.3 ± 0.3 bc2.2 ± 0.7 b4.2 ± 1.3 ab4.1 ± 0.9 ab5.4 ± 0.9 a
Late secondary **0.7 ± 0.4 c0.8 ± 0.2 bc2.1 ± 0.8 ab2.7 ± 0.7 ab4.4 ± 1.5 ab10.3 ± 3.8 a
Undetermined0.00.00.4 ± 0.30.7 ± 0.50.2 ± 0.10.1 ± 0.1
Diameter class
2–4.99 cm **2.2 ± 0.5 d7.8 ± 1.1 ab10.3 ± 0.9 a8.2 ± 1.3 ab4.0 ± 0.3 bcd3.2 ± 0.7 cd
5–7.99 cm **0.1 ± 0.1 b0.2 ± 0.1 b2.9 ± 0.8 a4.0 ± 0.9 a6.8 ± 0.8 a5.8 ± 1.1 a
8–14.99 cm **0.1 ± 0.1 c0.1 ± 0.1 c0.2 ± 0.2 c3.2 ± 1.1 a7.7 ± 1.9 a13.1 ± 2.3 a
>15 cm **0.6 ± 0.4 bc0.0 c0.2 ± 0.2 bc1.4 ± 0.6 ab1.7 ± 0.9 ab2.9 ± 1.2 a
Table 4. Importance value index (IVI) by species and ecological group (EG) sampled in an area under a forest management plan in the Seasonally Dry Tropical Forest, Brazil: T3 to T15 (plots/years of regeneration) and T40 (Legal Reserve/years of regeneration). More details can be found in Table S2.
TreatmentEG PioneerIVIEG Early SecondaryIVIEG Late SecondaryIVIUndeterminedIVI
T3Croton blanchetianus54.07Combretum leprosum9.77Amburana cearensis9.86
Mimosa arenosa8.52Mimosa caesalpiniifolia2.08Myracrodruon urundeuva1.34
Poincianella bracteosa4.98Manihot glaziovii1.01
Jatropha mollissima4.36Bauhinia cheliantha0.95
Croton anisodontus1.17
Piptadenia stipulacea0.96
Mimosa tenuiflora0.95
Total 75.01 13.80 11.20 0.00
T5Croton blanchetianus34.55Combretum leprosum9.51Cordia oncocalyx6.52Unknown 11.75
Mimosa arenosa15.83Cordia thichotoma6.90Libidibia ferrea1.23Chloroleucon dumosum0.67
Poincianella bracteosa10.88Bauhinia cheliantha2.60Pisonia tomentosa0.88
Mimosa tenuiflora0.61Anadenanthera colubrina1.29Handroanthus impetiginosus0.83
Croton anisodontus0.60Ziziphus joazeiro1.25Pseudobombax marginatum0.57
Cochlospermum vitifolium0.59Mimosa caesalpiniifolia1.22
Piptadenia stipulacea0.57Aspidosperma pyrifolium0.60
Piptadenia viridiflora0.56
Total 64.17 23.37 10.03 2.43
T8Croton blanchetianus32.92Combretum leprosum7.82Cordia oncocalyx9.39Unknown 32.26
Mimosa arenosa13.39Mimosa caesalpiniifolia7.70Amburana cearensis0.65Acacia glomerosa0.58
Poincianella bracteosa9.35Bauhinia cheliantha1.86Libidibia ferrea0.64Unknown 20.58
Mimosa tenuiflora6.48Capparis cynophallophora0.58Pisonia tomentosa0.58
Piptadenia stipulacea2.56Cordia thichotoma0.57
Piptadenia viridiflora0.89Anadenanthera colubrina0.57
Croton anisodontus0.64
Total 66.23 19.09 11.27 3.41
T11Croton blanchetianus34.77Mimosa caesalpiniifolia7.15Cordia oncocalyx5.88Ximenia americana2.21
Poincianella bracteosa7.98Combretum leprosum6.89Amburana cearensis2.94Chloroleucon dumosum0.43
Mimosa arenosa4.52Piptadenia stipulacea4.46Myracrodruon urundeuva2.88Crataeva tapia0.41
Croton anisodontus2.56Bauhinia cheliantha3.40Commiphora leptophloeos2.31Unknown 20.41
Mimosa tenuiflora1.93Cordia thichotoma2.60Libidibia ferrea1.80
Aspidosperma pyrifolium0.87Anadenanthera colubrina1.19Pisonia tomentosa0.60
Jatropha mollissima0.41Manihot glaziovii0.98
Ziziphus joazeiro0.41
Total 53.04 27.08 16.42 3.46
T15Croton blanchetianus32.16Combretum leprosum7.95Cordia oncocalyx9.98Unknown 21.06
Poincianella bracteosa9.08Mimosa caesalpiniifolia5.97Libidibia ferrea2.06Unknown 10.65
Mimosa tenuiflora7.57Bauhinia cheliantha5.25Pisonia tomentosa1.93Acacia glomerosa0.08
Mimosa arenosa3.42Anadenanthera colubrina2.52Myracrodruon urundeuva1.59
Piptadenia stipulacea2.09Cordia thichotoma1.79
Cochlospermum vitifolium1.22Aspidosperma pyrifolium1.35
Croton anisodontus0.86Manihot glaziovii0.49
Croton conduplicatus0.46Capparis cynophallophora0.48
Total 56.85 25.80 15.56 1.79
T40Croton blanchetianus30.36Mimosa caesalpiniifolia9.59Cordia oncocalyx20.48Ximenia americana0.78
Poincianella bracteosa9.77Combretum leprosum8.66Pisonia tomentosa2.15
Mimosa arenosa3.87Cordia thichotoma2.78Myracrodruon urundeuva1.35
Mimosa tenuiflora3.61Aspidosperma pyrifolium1.33Commiphora leptophloeos0.71
Cochlospermum vitifolium1.00Manihot glaziovii0.81Libidibia ferrea0.68
Piptadenia stipulacea0.68Bauhinia cheliantha0.72
Anadenanthera colubrina0.67
Total 49.29 24.56 25.37 0.78
Disclaimer/Publisher’s Note: The statements, opinions and data contained in all publications are solely those of the individual author(s) and contributor(s) and not of MDPI and/or the editor(s). MDPI and/or the editor(s) disclaim responsibility for any injury to people or property resulting from any ideas, methods, instructions or products referred to in the content.

