Article

Improvement of the Dimensional Stability of Rubber Wood Based on the Synergies of Sucrose and Tung Oil Impregnation

1
Yunnan Provincial Key Laboratory of Wood Adhesives and Glued Products, Southwest Forestry University, Kunming 650224, China
2
Department of Forest Products, Faculty of Forestry, Kasetsart University, Bangkok 10900, Thailand
3
International Joint Research Center for Biomass Materials, Southwest Forestry University, Kunming 650224, China
*
Author to whom correspondence should be addressed.
Forests 2023, 14(9), 1831; https://doi.org/10.3390/f14091831
Submission received: 8 August 2023 / Revised: 5 September 2023 / Accepted: 6 September 2023 / Published: 8 September 2023

Abstract

:
Rubber wood often exhibits dimensional instability during use, which seriously hinders its widespread application. In order to enhance the dimensional stability of rubber wood, a two-step method was employed in this study to modify rubber wood using two plant-derived compounds, namely sucrose and tung oil. Samples treated alone with sucrose or tung oil were also prepared. The water absorption, dimensional stability, and thermal stability of modified and untreated wood were evaluated. The results show that wood samples treated with 30% sucrose and tung oil had excellent water resistance and dimensional stability based on the synergistic effect of sucrose and tung oil. After 384 h of immersion, the 30% sucrose and tung oil group presented a reduction in water absorption by 76.7% compared to the control group, and the anti-swelling efficiency was 57.85%, which was 66.81% higher than that of the tung oil treatment alone. Additionally, the leaching rate of the 30% sucrose and tung oil group decreased by 81.27% compared to the sample modified with the 30% sucrose solution alone. Simultaneously, the 30% sucrose and tung oil group showed better thermal stability. Therefore, this study demonstrates that the synergistic treatment of modified rubber wood by sucrose and tung oil is an eco-friendly, economical, and highly efficient approach with the potential to expand the range of applications of rubber wood products.

1. Introduction

The rubber tree (Hevea brasiliensis) is a fast-growing and versatile tree with dual economic significance, primarily cultivated for collecting rubber [1,2]. The primary regions for rubber tree cultivation and production in China are Hainan Province and Xishuangbanna, Yunnan Province [3]. Rubber wood is a by-product of rubber trees, which is taken from the trunk of rubber trees. Due to its light color, hardness, and ease of processing, rubber wood finds frequent applications in furniture manufacturing and interior decorations [3,4,5]. Nevertheless, one of the main drawbacks of rubber wood is its dimensional instability, which can be easily affected by environmental humidity during use, leading to dimensional deformation and seriously affecting its use [5,6,7,8]. Therefore, it is very necessary to modify rubber wood to enhance its properties and expand its range of applications.
Various methods have been researched and compared to enhance the dimensional stability and other properties of wood, mainly including impregnation treatment, chemical modification treatment, and heat treatment [9]. Among them, the methods of the impregnation modification and chemical modification of wood mainly include acetylation [10], furfurylation [11], esterification [12], silylation [13], grafting polymerization [14], paraffin modification [15], resin impregnation [16], and so on. Although these methods can enhance the properties of wood, the majority of modifiers contain hazardous chemicals or solvents that can cause serious environmental and health problems. For instance, wood treated with phenolic (PF) resins and melamine-urea-formaldehyde (MUF) resins release formaldehyde, phenols, and other harmful substances that restrict their use in indoor applications [17]. In contrast, high-temperature heat treatment avoids using chemicals, while treated wood does not release harmful substances during use. Many studies have demonstrated the efficacy of heat treatment in enhancing wood properties, including dimensional stability and resistance to biological degradation [18,19,20,21]. However, heat-treated wood may reduce both mass and volume, which can lead to a reduction in the actual recovery rate of wood and a decrease in long-term resistance to water absorption [22]. Shukla et al. discovered that the weight loss of rubber wood became more pronounced with an increasing heat treatment temperature, and heat treatment reduces of its mechanical strength [23]. With the growing awareness of sustainable development, developing an environmental-friendly, sustainable, efficient, and economical wood modifier is urgently needed.
The primary treatment agent utilized in this experiment is sucrose (S), which exists in almost the entire plant kingdom. It is mainly derived from sugarcane and sugar beets and has the advantages of easy access, low price, and high purity [24]. Sucrose is extensively utilized in various chemical and process industries such as fine chemicals, bioethanol, surfactants, etc. [25,26,27]. Previously, sucrose was mainly used to protect archaeological wooden artifacts [28]. Parrent used sucrose to safeguard the archaeological timber in Port Royal, Jamaica, and achieved favorable outcomes [29]. However, there has been limited research on the utilization of sucrose-modified wood for enhancing the properties of wood. In recent years, Petr et al. have discovered that vacuum impregnation of poplar wood with an aqueous mixture of sucrose and sodium chloride can increase the anti-swelling efficiency of poplar wood by up to 36%, indicating that sucrose is a highly effective and environmentally friendly agent for modifying wood [30]. Nevertheless, because sucrose is a polyhydroxy compound, it is difficult to fix in wood, and its high leachability is a major problem.
Tung oil (TO), a traditional Chinese wood oil extracted from the tung tree’s seeds, consists of alpha oleic acid, oleic acid, and linoleic acid [31]. It has been extensively used for safeguarding wooden structures and furnishings for over a millennium due to its biodegradable nature and non-toxicity towards humans [32]. As a dry oil, TO can quickly dry in the air and polymerize into tough, smooth, and transparent films. Even after undergoing severe aging, tung oil still maintains excellent water resistance [33,34]. Moreover, several researchers have reported that impregnating wood with TO could enhance its dimensional stability, decay resistance, and weathering resistance [35,36]. Both S and TO treatments can improve certain properties of wood; however, currently, no research has focused on the combined effects of S and TO on the properties of rubber wood, mainly including dimensional stability and thermal stability.
In this study, a two-step method was applied to modify Xishuangbanna rubber wood using sucrose (S) and tung oil (TO) as treatment agents. In the first step, the wood was impregnated with different concentrations of an S solution. Then, impregnation of TO strengthens S fixation. Simultaneously, wood samples that were untreated and separately treated with S or TO were also prepared for comparative analysis. The effects of S and TO on the moisture absorption, water absorption, dimensional stability, color, and thermal stability of the rubber wood were evaluated. Furthermore, the microstructural and chemical structural changes of the rubber wood before and after modifications were analyzed through the utilization of scanning electron microscopy (SEM) and Fourier transform infrared spectra (FTIR). This work may provide an economical and effective approach to improving the durability of rubber wood.

2. Materials and Methods

2.1. Materials

Wood samples were collected from the sapwood of rubber wood in Xishuangbanna, Yunnan Province. After being air-dried, the lumbers were cut into pieces of 20 × 20 × 20 mm3 (Longitudinal × Tangential × Radial, eight replicates for each test) according to the Chinese standard (GB/T 1927.2-2021, 2021) [37] for the measurement of the weight percent gain (WPG), water absorption rate (WA), equilibrium moisture content (EMC), volumetric swelling rate (VSR), anti-swelling efficiency (ASE), and leaching rate (LR). In addition, samples with dimensions of 20 × 50 × 50 mm3 (Longitudinal × Tangential × Radial) were prepared for measuring color changes. The samples were dried to a constant weight at 80 °C and then divided into different groups. Sucrose (S) and tung oil (TO) were bought from Xilong Scientific Co., Ltd. (Shenzhen, China) and Gushi Anshan Tung Oil Sales Co., Ltd. (Xinyang, China), respectively.

2.2. Sample Preparation

The wood samples were modified using a two-step method. The samples were prepared following Table 1, resulting in twelve sets. In the first step, the wood samples were impregnated with aqueous solutions of S at concentrations of 10, 20, 30, 40, and 50% (wt/wt) and then marked S10, S20, S30, S40, and S50, respectively. The impregnation method was employed in accordance with the full cell process. Specifically, the samples were subjected to a vacuum of −0.1 MPa for 30 min, followed by the introduction of the S solution and an increased pressure to 0.6 MPa for 90 min. Afterward, the wood samples were removed and dried in an oven at 80 °C until reaching a stable weight. In the second step, the S-treated samples were impregnated by TO using an identical process. After removing the samples, the surface of the samples was wiped with a tissue to remove the excess TO on the surface. To obtain a uniformly flat cured surface, the samples were subjected to further oven drying at 80 °C until their weight remained constant. The samples treated with the S and TO two-step methods were marked as S10-TO, S20-TO, S30-TO, S40-TO, and S50-TO, respectively. Additionally, the wood specimens treated by TO only were also prepared and marked as TO. The untreated wood specimens were used as the control group and marked as C. The weight percent gain (WPG) was calculated, which included WPG1 (for the first step), WPG2 (for the second step), and WPGT (for both two steps).

2.3. Density

The density (specific gravity) of the samples was measured using the common water displacement method [38]. The density was measured by an electronic balance densitometer (XFMD-12001A, Lichen, Shanghai, China). Density can be calculated by Equation (1):
D e n s i t y = M a s s / V o l u m e

2.4. Dimensional Stability Test

2.4.1. Moisture Sorption and Dimensional Stability Test

The samples were placed in a constant temperature and humidity chamber at 25 °C and 65% relative humidity (RH) for two weeks. The equilibrium moisture content (EMC), volumetric swelling rate (VSR), and anti-swelling efficiency (ASE) were calculated according to Equations (2)−(4).
E M C ( % ) = ( m r m 1 ) / m 1 × 100
VSR ( % ) = ( V r V 1 ) / V 1 × 100
A S E ( % ) = ( VSR c VSR m ) / VSR c × 100
where mr (g) is the weight of the sample at the hygroscopic equilibrium condition, m1 (g) is the weight of the sample in the oven-dry condition before hygroscopic absorption, Vr (cm3) is the volume of the sample at the hygroscopic equilibrium condition, and V1 (cm3) is the volume of the sample in the oven-dry condition before hygroscopic absorption. VSRm (%) and VSRc (%) are the mean VSRs in the modified and control groups, respectively.

2.4.2. Water Absorption and Dimensional Stability Test

The oven-dried wood specimens were submerged in deionized water at room temperature, with the liquid level maintained 50 mm above the surface of the sample. After being immersed for 1, 3, 6, 12, 24, 48, 96,192, and 384 h respectively, these specimens were taken out, and the water was wiped off the surface. The water absorption rate (WA), water absorption volumetric swelling rate (VSRWA), and water absorption anti-swelling efficiency (ASEWA) were calculated according to Equations (5)−(7).
WA n ( % ) = ( m n m 2 ) / m 2 × 100
VSR WA ( % ) = ( V n V 2 ) / V 2 × 100
ASE WA ( % ) = ( VSRW Am VSR WAc ) / VSR WAc × 100
where mn (g) and m2 (g) represent the weight of the sample after n hours of immersion and the drying weight of the sample before the immersion test, respectively. Vn (cm3) and V2 (cm3) represent the volume of the sample after n hours of immersion and the volume of the sample before the immersion test, respectively. The VSRWA values of the modified and control samples are represented by VSRWAm (%) and VSRWAc (%), respectively.

2.5. Leachability Test

After being dried, the modified samples were immersed in deionized water for 384 h (with the water changed every 48 h) and were subsequently removed and dried at a temperature of 103 °C until the weight was constant. The leaching rate (LR) was calculated according to Equation (8).
L R ( % ) = ( m m m 3 ) / ( m m m 0 ) × 100
where m0 (g) and mm (g) are the mass of the sample in the oven before and after modifications, respectively. m3 (g) is the oven-dry weight of the sample after 384 h of immersion.

2.6. Color Changes

The International Commission on Illumination CIE’s (1976) [39] L*a*b* standard chromaticity system was used to characterize the colors. The precision colorimeter (NH145, 3 nh, Shenzhen, China) was used to measure the L*, a*, and b* of all samples. Three measurements were taken at different locations on each surface for two tangential sections of the test samples. The measured data were used to calculate ΔL* (luminance difference), Δa* (color index difference on the red and green axes), Δb* (color index difference on the yellow and blue axes), and ΔE* (total color difference) according to the formula of the L*a*b* color system (CIE 1976) according to Equations (9)−(12).
Δ L * = L * m L * c
Δ a * = a * m a * c
Δ b * = b * m b * c
Δ E = ( Δ L * ) 2 + ( Δ a * ) 2 + ( Δ b * ) 2
where L*c, a*c, and b*c are the values measured for the control group; L*m, a*m, and b*m are the values measured after the modification, respectively.

2.7. Characterizations and Microscopic Observations

2.7.1. Scanning Electron Microscope (SEM) Analysis

The surface morphologies of the samples were evaluated using a scanning electron microscope (SEM) (TESCAN MIRA LMS, Czech Republic) to investigate changes in physical structure. The samples were affixed directly onto the conductive adhesive and coated with Au using a Quorum SC7620 sputter coater at 10 mA. Subsequently, imaging of the samples was photographed using a TESCAN MIRA LMS scanning electron microscope with an accelerating voltage of 3 kV.

2.7.2. Fourier Transform Infrared (FTIR) Analysis

Fourier transform infrared (FTIR) spectra (Thermo Scientific Nicolet iS50, USA) was employed to characterize the changes in the chemical structures of the wood samples. A powder sample of 1.5 mg and pure KBr of 200 mg were finely ground and pressed into transparent sheets using a hydraulic press. The samples were then subjected to infrared spectroscopy with a wave number range of 400–4000 cm−1, a scan number of 32, and a resolution of 4 cm−1.

2.7.3. Thermogravimetric (TG) Analysis

The thermal stability of the wood samples was evaluated using thermogravimetric analysis (TG) before and after treatment. The thermal stability of each sample was assessed using a thermogravimetric analyzer (Netzsch TG 209 F1, Germany) under a nitrogen atmosphere with a heating rate of 10 °C/min and a final temperature of 600 °C.

2.8. Statistical Analysis

An Analysis of Variance (ANOVA) test was conducted using IBM SPSS Statistics (V 0.23) software to evaluate the effects of different modification treatments on the properties of the samples. The Least Significant Difference (LSD) method was further employed to identify the significant difference between every mean value at p < 0.05.

3. Results and Discussion

3.1. Weight Percent Gain and Density

Weight percent gain (WPG) is a significant parameter for assessing wood modifications, which was used to evaluate the S and TO uptake. As illustrated in Table 1, the WPG1 of the specimens treated by S at concentrations of 10, 20, 30, 40, and 50% (wt/wt) were 7.78, 17.98, 31.14, 44.37, and 58.13%, respectively. WPG1 increases with the rise of S concentration and exhibits a positive correlation with S concentration. The statistical analysis shows that there were significant differences between different concentrations of S and WPG1. Due to the small molecular nature of S, it easily permeates into the wood samples during impregnation. As water evaporates, S can penetrate and deposit within the wood samples. The WPG2 of the TO-impregnated samples alone was 52.72%, indicating that TO could penetrate into the wood and occupy its voids. The WPG2 of S10-TO, S20-TO, S30-TO, S40-TO, and S50-TO were 50.61, 45.77, 41.79, 32.01, and 21.34%, respectively. The WPG2 value exhibits a negative correlation with the concentration of S, and the WPG2 values of the S30-TO, S40-TO, and S50-TO groups exhibited significant differences compared to the WPG2 of the TO group. This may be attributed to the deposition of S inside the wood during the first impregnation process, which hinders TO penetration and consequently causes the reduction of the WPG2 value. In addition, density is also an important indicator for the evaluation of wood properties and has a significant impact on the strength and processing properties of wood. As shown in Table 1, the density of the samples treated solely with 10 to 50% of the S solution exhibited varying degrees of increase compared to the untreated samples. After the impregnation of TO alone, the density of the samples increased by 48.15% compared to the control group. And the density of the samples treated with both different concentrations of S and TO increased significantly, ranging from 57.41% to 70.37%, compared to the untreated specimens. Furthermore, statistical analyses show significant differences in density in all modified groups compared to the control group.

3.2. Dimensional Stability Analysis

3.2.1. Moisture Sorption and Dimensional Stability

The dimensional stability of wood is one of the most important parameters in wood applications, including its moisture absorption and water absorption state. In the former case, wood with low dimensional stability may shrink or swell as the EMC decreases or increases in the surrounding environment [40]. Therefore, the dimensional stability of wood seriously affects the quality and application of wood products.
The EMCs and ASE values are shown in Figure 1 to evaluate the hygroscopicity and hygroscopic dimensional stability of the wood in the control and modified groups. After treatment with different concentrations of the S solution alone, the EMC was reduced to varying degrees. The EMC of the S10, S20, S30, S40, and S50 groups exhibited reductions of 5.75%, 11.19%, 21.68%, 22.74%, and 25.13%, respectively, when compared to the control group (9.28%). The EMC decreased continuously as the concentration of S increased; however, the observed differences in EMC between the S30, S40, and S50 groups were not statistically significant, probably indicating that the sucrose entering the wood had already reached saturation. Wood is hygroscopic because the cellulose chains have many hydroxyl groups which are bound to atmospheric oxygen. S can establish hydrogen bonds with these exposed hydroxyl groups, thereby reducing the number of hydroxyl groups that are bound to atmospheric moisture within the wood. At relative humidity levels above 85%, S exhibits a high degree of hygroscopicity, whereas, at lower humidity levels, it diminishes the wood’s hygroscopic properties [29]. After treatment with TO, the EMC of the samples was significantly reduced compared to the untreated wood. However, no significant difference in EMC was observed between the TO group and the S10-TO group. The EMC values for the S30-TO, S40-TO, and S50-TO treated samples were 4.13%, 4.15%, and 4.11% respectively, representing a remarkable decrease of approximately 55% compared to the control group. Additionally, the statistical analyses suggested significant differences in the EMC of the S30-TO, S40-TO, and S50-TO groups compared to the TO group.
The ASEs of the modified samples are shown in Figure 1b. Both the S and TO impregnations exhibited a positive impact on enhancing dimensional stability. When impregnated with the S solution alone, S30 exhibited the best effect with an ASE of 41.57%. After the introduction of TO, the ASE values of TO, the S10-TO, S20-TO, S30-TO, S40-TO, and S50-TO groups were 48.34%, 52%, 54.98%, 63.10%, 62.90%, 60.04%, respectively. The ASE of the S30-TO group exhibited a significant increase of 30.5% compared to the sole impregnation of TO, thereby indicating a remarkable synergistic effect achieved through the combined utilization of both S and TO.

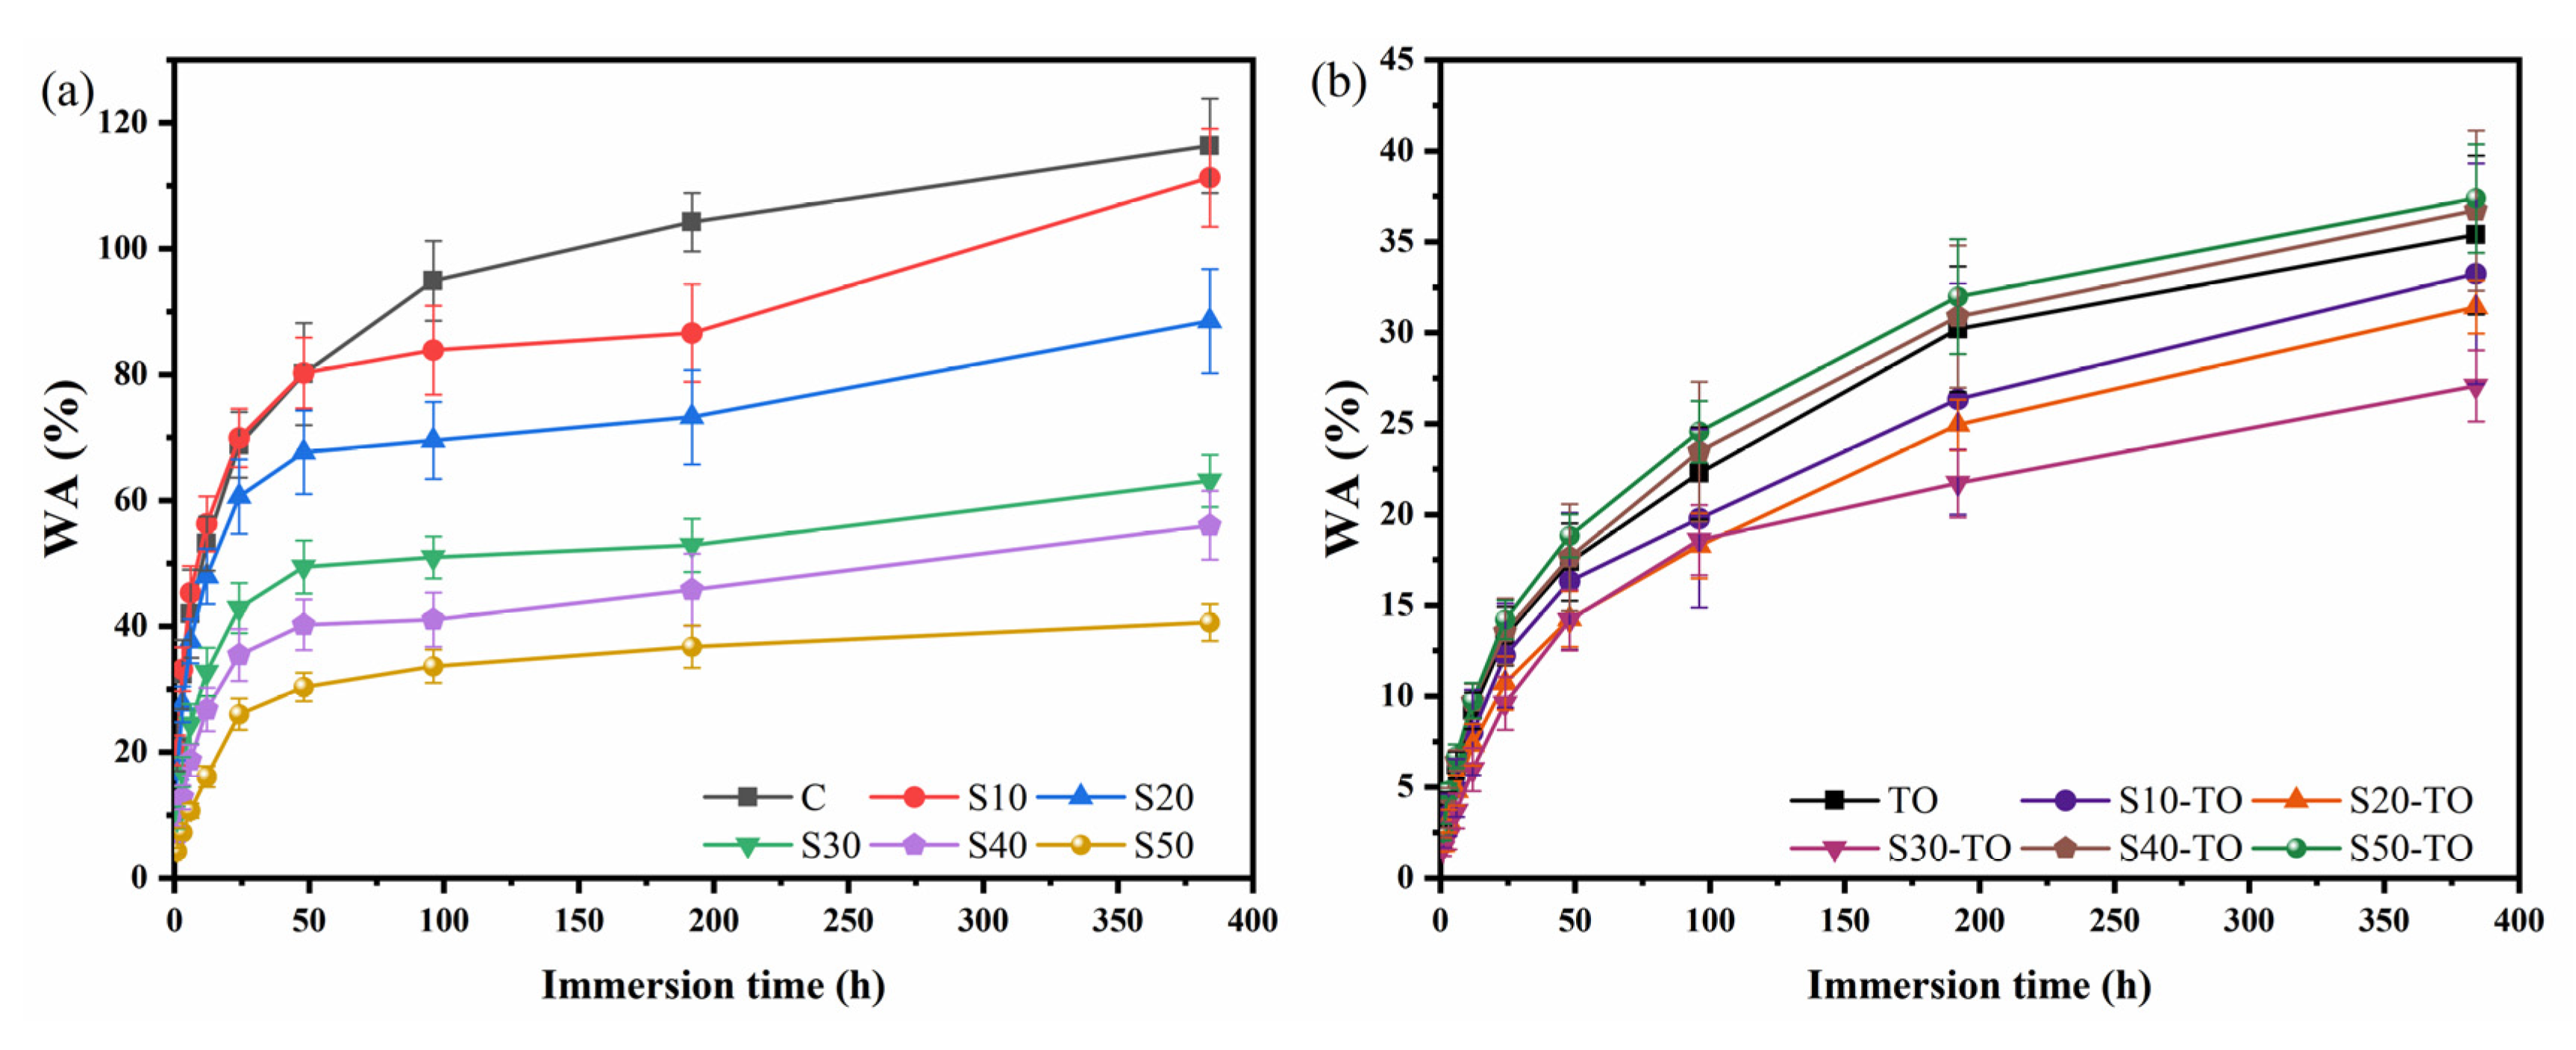
3.2.2. Water Absorption and Dimensional Stability

As a natural polymer material, wood contains a large number of free hydroxyl groups, which are very easy to combine with water molecules in the form of hydrogen bonds [41]. Simultaneously, wood has a multitude of void structures, which can store a large amount of water molecules, and this is one of the reasons why wood is very easy to absorb water. To investigate the water absorption values of wood treated with S and TO, the WA values of all the wood specimens were computed and are illustrated in Figure 2.
The WA exhibited an increase with a prolonged immersion time. The untreated wood exhibited a WA of 116.37% after being immersed for 384 h. For the S-treated samples (Figure 2a), the WA values for S10, S20, S30, S40, and S50 were 111.29, 88.52, 63.12, 56.03, and 40.62%, respectively. These results indicate that the presence of S effectively inhibits water penetration into the wood. The addition of S swelled the cell wall of the wood and blocked some of the pits [30,42], thereby impeding water movement within the cell wall and subsequently reducing WA. In comparison, the WA of the TO group exhibited a sharp decline to 35.38% after soaking for 384 h (Figure 2b), indicating its excellent water repellency. Humar and Lesar reported that TO can effectively reduce the water absorption of wood [43]. However, the samples treated by both S and TO showed different WA trends. As shown in Figure 2b, after introducing tung oil, the WA of the samples showed a significant reduction. WA reduction rates of 71.4%, 73.1%, and 76.7% were observed in the S10-TO, S20-TO, and S30-TO treatments, respectively, after 384 h of immersion compared to the control group. Noteworthily, the S30-TO group exhibited the lowest WA of 27.1% after immersing for 384 h. Based on previous studies, the WA values of wood modified with epoxidized linseed oil, carnauba wax, and rosin were 129%, 92%, and 87%, respectively [44,45]. Thus, our treatment exhibited superior water resistance properties compared to natural water repellents. However, the WA of the S40-TO group and S50-TO group were 36.72% and 37.78%, respectively, which were slightly higher than that of the TO group. This situation may be due to the lower WPG2 values of the S40-TO and S50-TO groups because TO plays a more important role in improving water resistance performance.
Chemical modification decreases the water absorption of wood and enhances its dimensional stability. ASEWA is primarily utilized for assessing the dimensional stability of wood following water immersion. The ASEWA for the different modification groups is shown in Figure 3. The ASEWA of the samples treated with the S solutions of different concentrations alone exhibited a significant decrease from 1 to 48 h after immersion in water. After 48 h of soaking, the ASEWA tended to stabilize. The ASEWA of the samples treated with S30, S40, and S50 remained stable at approximately 34% after being immersed in water for 384 h. S can easily penetrate the cell wall and forms hydrogen bonds with cellulose molecules. At the same time, S can swell the cell wall, reduce the stretching deformation of the cell wall, and ultimately enhance the dimensional stability of wood [29,42].
Additionally, treatment with TO demonstrates a significantly greater improvement in dimensional stability. After soaking for 6 h, the ASEWA of all the TO-treated samples exceeded 80%. When treated with TO alone, ASEWA was 71.77% at 12 h and decreased to 34.68% at 384 h. This finding is consistent with the studies conducted by He et al. and Lee et al. [21,35], which suggest that oil uptake and the formation of a protective layer on the wood are the main factors in increasing the dimensional stability of wood. As previously mentioned, tung oil has the ability to fill cell gaps, deeply penetrate the cell wall, and reduce the number of available water-uptaking sites. Therefore, it improves the deformation resistance of wood. By comparison, the two-step S and TO treatments demonstrated superior dimensional stability due to the synergistic effect of S and TO impregnation. Particularly, for S30-TO, the ASEWA still reached 75.66% after 24 h of immersion. The ASEWA was 57.85% after 384 h of immersion, representing a 66.81% improvement compared to treatment with TO alone. These results suggest that the implementation of composite modifications is highly effective in reducing water absorption and enhancing dimensional stability. In conclusion, the samples treated with the 30% S solution and TO demonstrate the best dimensional stability, and the ASEWA results are in agreement with WA.

3.3. Leachability Analysis

In high-humidity environments, such as bathrooms, it is essential to fix modifiers used in wood products to prevent leaching. This is due to the fact that the absence of modifiers will significantly diminish both the water resistance and dimensional stability of wood. The leaching rate (LR) of the wood samples treated with 30% S and/or TO are shown in Table 2. After 384 h of immersion, the LR of the untreated wood was 0.45%, which should be related to the extractives of the wood. This suggests that the testing process rarely affects the leaching of wood component contents. The LR of the S30 group was 94.32%. Because S is a polyhydroxy compound, it was easy to be washed away by water in the wood, and its fixation was poor. The LR of TO was 1.22%, indicating little leaching of TO during the experiment. The LR of S30-TO was 17.66%, which was 81.27% lower than S30, significantly reducing the leaching rate of the S. Furthermore, the statistical analyses demonstrated the significant efficiency of TO on the fixation of S in wood. TO has a positive fixation effect on S in wood as it forms a solidified film on the inner surface of the wood. Meanwhile, the high retention of effective modifiers contributed to the wood maintaining long-term water resistance and dimensional stability.

3.4. Color Changes

The surface color of the modified wood exhibited varying degrees of change compared to the control wood. The colors of the TO and S30-TO groups were similar, as illustrated in Figure 4a. Moreover, Figure 4b illustrates the alterations in the L*, a*, and b* values of the rubber wood subjected to various treatments. For color parameters including L*, a*, and b*, the lightness of all the modified wood samples decreased, with the L* values of S30, TO, and S30-TO decreasing by 9.89, 19.89, and 20.03%, respectively, compared to the control wood. This decrease in the L* value is indicative of a darker coloration.
The a* value of S30 exhibited a 69.17% increase, while those of TO and S30-TO demonstrated respective increases of 111.85% and 110.8%. The increase in the a* value signifies an inclination for the wood surface to exhibit a red hue. The b* values of the S-30, TO, and S30-TO groups exhibited increases of 42.88, 81.28, and 77.10%, respectively, indicating a propensity for yellowing on the wood surface. The impact of modifications on the total color difference is also demonstrated in Figure 4b. The total color difference of S30, TO, and S30-TO increased from 0 to 25. The surface colors of TO and S30-TO were yellow or dark yellow, which may be due to the formation of a yellow film after TO solidification [46], resulting in a darker color of the modified sample. However, the solidified TO film does not cover the natural grain of the wood and maintains its aesthetic characteristics.

3.5. Morphology and Structure

The microstructures of the control and modified wood samples are shown in Figure 5. By comparing the cross and tangential sections of the control group, all three treatment methods altered the natural cell morphology of the wood to a certain degree. Observing the cross and tangential sections of S30 reveals that sucrose can easily enter the interior of the wood and can block some pits. Many sucrose particles can be observed on S30-T. After treatment with TO, the wood cell lumens were almost completely filled with TO (TO-C), and the path of the water movement (e.g., pits and ray cells) was completely blocked in the tangential section (TO-T).
The formation of a cured film can be distinctly observed in the TO and S30-TO groups, which is due to the fact that TO is polymerized by free radicals with oxygen under sunlight and heating conditions, leading to the creation of a cured film within the wood. The microstructure of the S30-TO group was found to be similar to that of the TO group. As a consequence of blocking and covering, the number of water channels is reduced, and the hygroscopicity of the wood decreases, thus improving the dimensional stability of the wood. This result is consistent with the moisture and water absorption dimensional stability results.

3.6. FTIR Spectroscopy Analysis

Figure 6 displays the FTIR spectra of both the untreated and modified samples. It can be seen that the chemical structure of the samples treated with different modifications changed compared to the control, while the spectra remained fundamentally unaltered. The band at 3420 cm−1 exhibits a stretching vibration peak of hydroxyl (-OH) [47]. After modification, the intensity of the stretching vibration peak of -OH decreases, which may be attributed to the stretching vibration of free hydroxyl groups in sucrose molecules [48]. This indicates that the modification treatment reduces the relative content of hydroxyl groups in wood and improves its dimensional stability. The band at the 3420 cm−1 intensities of the TO group and S30-TO group decreased significantly, indicating that after TO treatment, the relative number of hydroxyl groups was reduced, which is beneficial for improving the dimensional stability of wood [49]. The bands of 2927 cm−1 and 2855 cm−1 only appear in the TO and S30-TO groups, which are attributed to the saturated C–H symmetric and antisymmetric stretching vibrations of tung oil [50]. The control group and S30 group did not find these two peaks, further confirming that tung oil successfully impregnated the wood interior. In addition, the band intensities at 1740 cm−1 and 1596 cm−1 correspond to the tensile vibration of carbonyl groups (C=O) [51,52], and their strength changes can be observed after modification treatment. The band intensities at 1374 cm−1 and 895 cm−1 correspond to C–H stretching vibrations [53,54], and the band at 1160 cm−1 corresponds to C–O stretching vibrations [55]. After modifications, the composition of the wood was essentially unchanged, but some of the chemical structure of the wood changed to some extent. Therefore, it can be inferred that sucrose penetration into the cell wall and crystallization there, wood oil uptake, deposition of oil in the cell wall, and the production of a hydrophobic oil film are all important factors contributing to the dimensional stability of wood.

3.7. Thermal Stability

In addition to being able to resist water, it is also crucial for wood products to possess thermal stability. In order to estimate the changes in the thermal properties of wood before and after the modification treatments, thermogravimetric (TG) and derivative thermogravimetric (DTG) curves were plotted for the modified and control samples, as shown in Figure 7.
For the control group, the different components of the wood degraded accordingly with temperature variations. In the first stage, TG curves in the range of 100–220 °C are considered as a degradation of unstable components such as hemicellulose and a bond breaking of complex components [56,57]. Subsequently, temperatures ranging from 220 to 450 °C result in a significant reduction in mass loss by approximately 80%, which encompasses both thermal decomposition (220–290 °C) and carbonization phases (260–450 °C) [35,58]. The control sample exhibited a peak at 342 °C, which can be ascribed to the decomposition of cellulose resulting in wood mass loss. The pyrolysis temperature of TO ranges from 420 to 450 °C. Thus, treatment with TO can effectively enhance the thermal stability of wood [59]. As depicted in Figure 7b, the pyrolysis temperature of the samples treated with TO was higher than that of the control group. The S30 and S30-TO groups exhibited a distinct peak at 228 °C, attributed to the sucrose dehydration and condensation leading to caramel formation; however, this peak was of a short duration. When the temperature rises to 256 °C, a large edge peak appears, which is mainly due to further carbonation and polymerization after the complete caramelization of sucrose; concurrently, gaseous byproducts such as CO2, CO, acetic acid, acetone, and furfural compounds are generated [60,61]. The S30, TO, and S30-TO groups exhibited a maximum mass loss at 351 °C, 353 °C, and 361 °C, respectively, all of which were higher than that of the control group at 342 °C. This suggests that all the modified treatments enhanced the thermal stability of the wood. The levels of residual substances were observed to decrease in the TO and S30-TO groups as compared to the control group. This reduction in residual substances could be attributed to the degradation of most of the tung oil, while some wood components remained undecomposed [59]. In the same weight loss range (80 to 20%), the S30-TO group showed the highest pyrolysis temperature. It exhibited better thermal stability due to the synergistic effect of sucrose caramelization and tung oil impregnation. Thus, modified wood is suitable for heat-resistant applications like solid wood flooring with a heating system and furniture in the kitchen.

4. Conclusions

In this study, sucrose (S) and tung oil (TO) were used as treatment agents to modify rubber wood by a two-step method. The wood samples treated with 30% S and TO exhibited excellent anti-hygroscopicity, water resistance, and dimensional stability based on the synergistic effect of S and TO. After 384 h of immersion, the S30-TO group presented a 76.7% reduction in WA compared to the control group, and the ASEWA was 57.85%, which was 66.81% higher than the TO treatment alone. Compared with the S30 group, the leaching rate of the S30-TO group decreased by 81.27%, indicating that TO has a remarkable fixation effect on S. The addition of S could swell the cell wall and effectively reduce the tensile deformation of the cell wall. Meanwhile, TO had the capability to obstruct wood voids and form a solidified protective film on the wood surface, thereby impeding water infiltration. Furthermore, S and TO treatments significantly enhance the thermal stability of rubber wood. These findings suggest that, as environmental-friendly natural materials, the treatment of S and TO, probably by synergistic effects, could impart rubber wood with better water resistance, dimensional stability, and thermal stability. Therefore, this work offers an eco-friendly, economical, and highly efficient approach to improving the performance of rubber wood, with broad potential applications and commercial values.

Author Contributions

Conceptualization, C.Y. and J.Q.; methodology, C.Y.; software, S.Y.; validation, H.Y.; investigation, C.Y.; resources, J.Q.; data curation, C.Y.; writing—original draft preparation, C.Y.; writing—review and editing, J.Q. and B.P.; supervision, J.Q.; project administration, J.Q. All authors have read and agreed to the published version of the manuscript.

Funding

This research was funded by the Natural Science Foundation of China (31971586) and the China Scholarship Council (CSC) scholarship.

Data Availability Statement

Data will be made available on request.

Acknowledgments

The authors gratefully thank the technicians and scientific associates from the College of Materials and Chemical engineering of the Southwest Forestry University and the Faculty of the Forestry of Kasetsart University.

Conflicts of Interest

The authors declare no conflict of interest.

References

  1. Srivaro, S.; Lim, H.; Li, M.; Pasztory, Z. Properties of Mixed Species/Density Cross Laminated Timber Made of Rubberwood and Coconut Wood. Structures 2022, 40, 237–246. [Google Scholar] [CrossRef]
  2. Meethaworn, B.; Khongtong, S. The Tuneable Rubberwood: Roles of Impregnated Polymer Level. Wood Mater. Sci. Eng. 2020, 16, 397–406. [Google Scholar] [CrossRef]
  3. Yang, S.; Wu, X.; Liu, L.; Yan, Y.; Qiu, J.; Qin, L. Analysis of Fungal Diversity before and after Discoloration of Rubberwood in Xishuangbanna. Diversity 2023, 15, 471. [Google Scholar] [CrossRef]
  4. Teoh, Y.P.; Don, M.M.; Ujang, S. Assessment of the Properties, Utilization, and Preservation of Rubberwood (Hevea brasiliensis): A Case Study in Malaysia. J. Wood Sci. 2011, 57, 255–266. [Google Scholar] [CrossRef]
  5. Chen, C.; Tu, D.; Zhao, X.; Zhou, Q.; Cherdchim, B.; Hu, C. Influence of Cooling Rate on the Physical Properties, Chemical Composition, and Mechanical Properties of Heat-Treated Rubberwood. Holzforschung 2020, 74, 1033–1042. [Google Scholar] [CrossRef]
  6. de Jesus Eufrade Junior, H.; Ohto, J.M.; da Silva, L.L.; Lara Palma, H.A.; Ballarin, A.W. Potential of Rubberwood (Hevea brasiliensis) for Structural Use after the Period of Latex Extraction: A Case Study in Brazil. J. Wood Sci. 2015, 61, 384–390. [Google Scholar] [CrossRef]
  7. Long, X.; Fang, Y.; Qin, Y.; Yang, J.; Xiao, X. Latex-Specific Transcriptome Analysis Reveals Mechanisms for Latex Metabolism and Natural Rubber Biosynthesis in Laticifers of Hevea brasiliensis. Ind. Crops Prod. 2021, 171, 113835. [Google Scholar] [CrossRef]
  8. Umar, I.; Zaidon, A.; Lee, S.; Halis, R. Oil-Heat Treatment of Rubberwood for Optimum Changes in Chemical Constituents and Decay Resistance. J. Trop. For. Sci. 2016, 28, 88–96. [Google Scholar]
  9. Dong, Y.; Wang, K.; Li, J.; Zhang, S.; Shi, S.Q. Environmentally Benign Wood Modifications: A Review. ACS Sustain. Chem. Eng. 2020, 8, 3532–3540. [Google Scholar] [CrossRef]
  10. Bryne, L.E.; Wålinder, M.E.P. Ageing of Modified Wood. Part 1: Wetting Properties of Acetylated, Furfurylated, and Thermally Modified Wood. Holzforschung 2010, 64, 295–304. [Google Scholar] [CrossRef]
  11. Shen, X.; Yang, S.; Li, G.; Liu, S.; Chu, F. The Contribution Mechanism of Furfuryl Alcohol Treatment on the Dimensional Stability of Plantation Wood. Ind. Crops Prod. 2022, 186, 115143. [Google Scholar] [CrossRef]
  12. Chabert, A.J.; Fredon, E.; Rémond, R. Improving the Stability of Beech Wood with Polyester Treatment Based on Malic Acid. Holzforschung 2022, 76, 268–275. [Google Scholar] [CrossRef]
  13. Ghorbani, M.; Poorzahed, N.; Amininasab, S.M. Morphological, Physical, and Mechanical Properties of Silanized Wood-Polymer Composite. J. Compos. Mater. 2019, 54, 1403–1412. [Google Scholar] [CrossRef]
  14. Wang, K.; Dong, Y.; Yan, Y.; Zhang, S.; Li, J. Improving Dimensional Stability and Durability of Wood Polymer Composites by Grafting Polystyrene onto Wood Cell Walls. Polym. Compos. 2016, 39, 119–125. [Google Scholar] [CrossRef]
  15. Jiang, J.; Chen, Y.; Cao, J.; Mei, C. Improved Hydrophobicity and Dimensional Stability of Wood Treated with Paraffin/Acrylate Compound Emulsion through Response Surface Methodology Optimization. Polymers 2020, 12, 86. [Google Scholar] [CrossRef] [PubMed]
  16. Schwarzkopf, M. Densified Wood Impregnated with Phenol Resin for Reduced Set-Recovery. Wood Mater. Sci. Eng. 2020, 16, 35–41. [Google Scholar] [CrossRef]
  17. Shi, J.; Li, J.; Zhou, W.; Zhang, D. Improvement of Wood Properties by Urea-Formaldehyde Resin and Nano-SiO2. Front. For. China 2007, 2, 104–109. [Google Scholar] [CrossRef]
  18. Hill, C.; Altgen, M.; Rautkari, L. Thermal Modification of Wood—A Review: Chemical Changes and Hygroscopicity. J. Mater. Sci. 2021, 56, 6581–6614. [Google Scholar] [CrossRef]
  19. Ditommaso, G.; Gaff, M.; Kačík, F.; Sikora, A.; Sethy, A.; Corleto, R.; Razaei, F.; Kaplan, L.; Kubš, J.; Das, S.; et al. Interaction of Technical and Technological Factors on Qualitative and Energy/Ecological/Economic Indicators in the Production and Processing of Thermally Modified Merbau Wood. J. Clean. Prod. 2019, 252, 119793. [Google Scholar] [CrossRef]
  20. Candelier, K.; Thevenon, M.-F.; Petrissans, A.; Dumarcay, S.; Gerardin, P.; Petrissans, M. Control of Wood Thermal Treatment and Its Effects on Decay Resistance: A Review. Ann. For. Sci. 2016, 73, 571–583. [Google Scholar] [CrossRef]
  21. Lee, S.H.; Ashaari, Z.; Lum, W.C.; Abdul Halip, J.; Ang, A.F.; Tan, L.P.; Chin, K.L.; Md Tahir, P. Thermal Treatment of Wood Using Vegetable Oils: A Review. Constr. Build. Mater. 2018, 181, 408–419. [Google Scholar] [CrossRef]
  22. Allegretti, O.; Cuccui, I.; Terziev, N.; Sorini, L. A Model to Predict the Kinetics of Mass Loss in Wood during Thermo-Vacuum Modification. Holzforschung 2021, 75, 474–479. [Google Scholar] [CrossRef]
  23. Shukla, S.R.; Sharma, S.K. Effect of High Temperature Processing under Different Environments on Physical and Surface Properties of Rubberwood (Hevea brasiliensis). J. Indian Acad. Wood Sci. 2014, 11, 182–189. [Google Scholar] [CrossRef]
  24. Kusumah, S.S.; Umemura, K.; Guswenrivo, I.; Yoshimura, T.; Kanayama, K. Utilization of Sweet Sorghum Bagasse and Citric Acid for Manufacturing of Particleboard II: Influences of Pressing Temperature and Time on Particleboard Properties. J. Wood Sci. 2017, 63, 161–172. [Google Scholar] [CrossRef]
  25. Sheldon, R.A. Green and Sustainable Manufacture of Chemicals from Biomass: State of the Art. Green Chem. 2013, 16, 950–963. [Google Scholar] [CrossRef]
  26. Kobayashi, H.; Fukuoka, A. Synthesis and Utilisation of Sugar Compounds Derived from Lignocellulosic Biomass. Green Chem. 2013, 15, 1740–1763. [Google Scholar] [CrossRef]
  27. Plat, T.; Linhardt, R.J. Syntheses and Applications of Sucrose-Based Esters. J. Surfactants Deterg. 2001, 4, 415–421. [Google Scholar] [CrossRef]
  28. Morgós, A.; Imazu, S.; Ito, K. Conservation and Digitalization: Conference Proceedings; Piotrowska, K., Konieczny, P., Gdańsku, N.M.M.W., Eds.; National Maritime Museum: Gdańsk, Poland, 2015; ISBN 978-83-64150-10-4. [Google Scholar]
  29. Parrent, J.M. The Conservation of Waterlogged Wood Using Sucrose. Stud. Conserv. 1985, 30, 63–72. [Google Scholar] [CrossRef]
  30. Petr, P.; Aleš, D. Moisture Absorption and Dimensional Stability of Poplar Wood Impregnated with Sucrose and Sodium Chloride. Maderas Cienc. Tecnol. 2014, 16, 299–311. [Google Scholar] [CrossRef]
  31. Ribeiro, B.O.; Valério, V.S.; Gandini, A.; Lacerda, T.M. Copolymers of Xylan-Derived Furfuryl Alcohol and Natural Oligomeric Tung Oil Derivatives. Int. J. Biol. Macromol. 2020, 164, 2497–2511. [Google Scholar] [CrossRef]
  32. Xiong, X.Z.; Liu, Y.; Huang, X.H.; Wang, X.X.; Chen, Y.; Yin, X.H. Current Situation and Development Prospect of Tung Oil Tree (Vernicia fordii) in Chongqing Three Gorges Reservoir Area. Adv. Mater. Res. 2012, 518–523, 5385–5389. [Google Scholar] [CrossRef]
  33. Samadzadeh, M.; Boura, S.H.; Peikari, M.; Ashrafi, A.; Kasiriha, M. Tung Oil: An Autonomous Repairing Agent for Self-Healing Epoxy Coatings. Prog. Org. Coat. 2011, 70, 383–387. [Google Scholar] [CrossRef]
  34. Li, H.; Cui, Y.; Li, Z.; Zhu, Y.; Wang, H. Fabrication of Microcapsules Containing Dual-Functional Tung Oil and Properties Suitable for Self-Healing and Self-Lubricating Coatings. Prog. Org. Coat. 2018, 115, 164–171. [Google Scholar] [CrossRef]
  35. He, Z.; Qian, J.; Qu, L.; Yan, N.; Yi, S. Effects of Tung Oil Treatment on Wood Hygroscopicity, Dimensional Stability and Thermostability. Ind. Crops Prod. 2019, 140, 111647. [Google Scholar] [CrossRef]
  36. Peng, Y.; Wang, Y.; Zhang, R.; Wang, W.; Cao, J. Improvement of Wood against UV Weathering and Decay by Using Plant Origin Substances: Tannin Acid and Tung Oil. Ind. Crops Prod. 2021, 168, 113606. [Google Scholar] [CrossRef]
  37. GB/T 1927.2-2021; Test Methods for Physical and Mechanical Properties of Small Clear Wood Specimens—Part 2: Sampling Methods and General Requirements. Standard Press: Beijing, China, 2021.
  38. Wang, J.P.; Matthews, M.L.; Williams, C.M.; Shi, R.; Yang, C.; Tunlaya-Anukit, S.; Chen, H.-C.; Li, Q.; Liu, J.; Lin, C.-Y.; et al. Improving Wood Properties for Wood Utilization through Multi-Omics Integration in Lignin Biosynthesis. Nat. Commun. 2018, 9, 1579. [Google Scholar] [CrossRef]
  39. Brocco, V.F.; Paes, J.B.; Costa, L.G. da; Kirker, G.T.; Brazolin, S. Wood Color Changes and Termiticidal Properties of Teak Heartwood Extract Used as a Wood Preservative. Holzforschung 2020, 74, 233–245. [Google Scholar] [CrossRef]
  40. Arends, T.; Pel, L.; Smeulders, D. Moisture Penetration in Oak during Sinusoidal Humidity Fluctuations Studied by NMR. Constr. Build. Mater. 2018, 166, 196–203. [Google Scholar] [CrossRef]
  41. Banks, W.B. Water Uptake by Scots Pine Sapwood, and Its Restriction by the Use of Water Repellents. Wood Sci. Technol. 1973, 7, 271–284. [Google Scholar] [CrossRef]
  42. Tahira, A.; Howard, W.; Pennington, E.R.; Kennedy, A. Mechanical Strength Studies on Degraded Waterlogged Wood Treated with Sugars. Stud. Conserv. 2017, 62, 223–228. [Google Scholar] [CrossRef]
  43. Humar, M.; Lesar, B. Efficacy of Linseed- and Tung-Oil-Treated Wood against Wood-Decay Fungi and Water Uptake. Int. Biodeterior. Biodegrad. 2013, 85, 223–227. [Google Scholar] [CrossRef]
  44. Chen, J.; Wang, Y.; Cao, J.; Wang, W. Improved Water Repellency and Dimensional Stability of Wood via Impregnation with an Epoxidized Linseed Oil and Carnauba Wax Complex Emulsion. Forests 2020, 11, 271. [Google Scholar] [CrossRef]
  45. Dong, Y.; Yan, Y.; Wang, K.; Li, J.; Zhang, S.; Xia, C.; Shi, S.Q.; Cai, L. Improvement of Water Resistance, Dimensional Stability, and Mechanical Properties of Poplar Wood by Rosin Impregnation. Eur. J. Wood Wood Prod. 2016, 74, 177–184. [Google Scholar] [CrossRef]
  46. Liu, M.; Lyu, S.; Peng, L.; Lyu, J.; Huang, Z. Radiata Pine Fretboard Material of String Instruments Treated with Furfuryl Alcohol Followed by Tung Oil. Holzforschung 2021, 75, 480–493. [Google Scholar] [CrossRef]
  47. Kubovský, I.; Kačíková, D.; Kačík, F. Structural Changes of Oak Wood Main Components Caused by Thermal Modification. Polymers 2020, 12, 485. [Google Scholar] [CrossRef] [PubMed]
  48. Lei, H.; Du, G.; Wu, Z.; Xi, X.; Dong, Z. Cross-Linked Soy-Based Wood Adhesives for Plywood. Int. J. Adhes. Adhes. 2014, 50, 199–203. [Google Scholar] [CrossRef]
  49. Kumar, R.; Mago, G.; Balan, V.; Wyman, C.E. Physical and Chemical Characterizations of Corn Stover and Poplar Solids Resulting from Leading Pretreatment Technologies. Bioresour. Technol. 2009, 100, 3948–3962. [Google Scholar] [CrossRef]
  50. Feng, Y.; Cui, Y.; Zhang, M.; Li, M.; Li, H. Preparation of Tung Oil-Loaded PU/PANI Microcapsules and Synergetic Anti-Corrosion Properties of Self-Healing Epoxy Coatings. Macromol. Mater. Eng. 2020, 306, 2000581. [Google Scholar] [CrossRef]
  51. Li, M.-F.; Shen, Y.; Sun, J.-K.; Bian, J.; Chen, C.-Z.; Sun, R.-C. Wet Torrefaction of Bamboo in Hydrochloric Acid Solution by Microwave Heating. ACS Sustain. Chem. Eng. 2015, 3, 2022–2029. [Google Scholar] [CrossRef]
  52. Guo, J.; Song, K.; Salmén, L.; Yin, Y. Changes of Wood Cell Walls in Response to Hygro-Mechanical Steam Treatment. Carbohydr. Polym. 2014, 115, 207–214. [Google Scholar] [CrossRef]
  53. Jin, T.; Zeng, H.; Huang, Y.; Liu, L.; Ji, D.; Guo, H.; Shi, S.; Du, G.; Zhang, L. Synthesis of Fully Biomass High-Performance Wood Adhesives from Xylitol and Maleic Anhydride. ACS Sustain. Chem. Eng. 2023, 11, 11781–11789. [Google Scholar] [CrossRef]
  54. Yin, Y.; Berglund, L.; Salmén, L. Effect of Steam Treatment on the Properties of Wood Cell Walls. Biomacromolecules 2010, 12, 194–202. [Google Scholar] [CrossRef]
  55. Pandey, K.K.; Pitman, A.J. Examination of the Lignin Content in a Softwood and a Hardwood Decayed by a Brown-Rot Fungus with the Acetyl Bromide Method and Fourier Transform Infrared Spectroscopy. J. Polym. Sci. Part Polym. Chem. 2004, 42, 2340–2346. [Google Scholar] [CrossRef]
  56. Lin, B.-J.; Colin, B.; Chen, W.-H.; Pétrissans, A.; Rousset, P.; Pétrissans, M. Thermal Degradation and Compositional Changes of Wood Treated in a Semi-Industrial Scale Reactor in Vacuum. J. Anal. Appl. Pyrolysis 2018, 130, 8–18. [Google Scholar] [CrossRef]
  57. Kesik, H.I.; Korkut, S.; Hiziroglu, S.; Sevik, H. An Evaluation of Properties of Four Heat Treated Wood Species. Ind. Crops Prod. 2014, 60, 60–65. [Google Scholar] [CrossRef]
  58. Wang, Y.; Zhang, R.; Yang, M.; Peng, Y.; Cao, J. Improvement on Dimensional Stability and Mold Resistance of Wood Modified by Tannin Acid and Tung Oil. Holzforschung 2022, 76, 929–940. [Google Scholar] [CrossRef]
  59. Yang, J.J.; Guai, W.S.; Che, H.R. Study on Thermogravimetry and Pyrolysis Dynamics of Tung Oil. Adv. Mater. Res. 2012, 524–527, 1719–1722. [Google Scholar] [CrossRef]
  60. Kim, S. Environment-Friendly Adhesives for Surface Bonding of Wood-Based Flooring Using Natural Tannin to Reduce Formaldehyde and TVOC Emission. Bioresour. Technol. 2008, 100, 744–748. [Google Scholar] [CrossRef] [PubMed]
  61. Wu, Z.; Zhang, B.; Zhou, X.; Li, L.; Yu, L.; Liao, J.; Du, G. Influence of Single/Collective Use of Curing Agents on the Curing Behavior and Bond Strength of Soy Protein-Melamine-Urea-Formaldehyde (SMUF) Resin for Plywood Assembly. Polymers 2019, 11, 1995. [Google Scholar] [CrossRef]
Figure 1. (a) Equilibrium moisture content (EMC) of control group and different treatment groups at equilibrium state of 25 °C, 65% RH. (b) Anti-swelling efficiency (ASE) of different treatment groups at equilibrium state of 25 °C, 65% RH. Different small letters represent significant differences (p < 0.05) for different treatments.
Forests 14 01831 g001
Figure 2. (a) Water absorption rate (WA) of control group and S10, S20, S30, S40, S50 groups. (b) Water absorption rate (WA) of TO group and S10-TO, S20-TO, S30-TO, S40-TO, S50-TO groups.
Forests 14 01831 g002
Figure 3. (a) Water absorption anti-swelling efficiency (ASEWA) of S10, S20, S30, S40, S50 groups. (b) Water absorption anti-swelling efficiency (ASEWA) of TO group and S10-TO, S20-TO, S30-TO, S40-TO, S50-TO groups.
Forests 14 01831 g003
Figure 4. (a) Appearance of the C, S30, TO, and S30-TO groups. (b) Color parameters of the C, S30, TO, and S30-TO groups. Different small letters represent significant differences (p < 0.05) for different treatments.
Forests 14 01831 g004
Figure 5. Microstructure images of the C, S30, TO, and S30-TO groups. (C-C, S30-C, TO-C, and S30-TO-C refer to cross sections of wood samples; C-T, S30-T, TO-T, and S30-TO-T refer to tangential sections of wood samples).
Forests 14 01831 g005
Figure 6. FTIR spectra of the C, S30, TO, and S30−TO groups.
Forests 14 01831 g006
Figure 7. (a) Thermogravimetric and (b) derivative thermogravimetric thermographies of the C, S30, TO, and S30-TO groups.
Forests 14 01831 g007
Table 1. Parameters of different modification treatments and weight percent gains (WPGs) of control (C), samples modified with different concentrations of sucrose (S10, S20, S30, S40, and S50), samples modified with tung oil (TO), and samples modified with both sucrose and tung oil (S10/S20/S30/S40/S50 + TO).
GroupsTreatmentWPG (%)Density (g/cm3)
1st Step2nd StepWPG1WPG2WPGT
C/////0.54 f (0.05)
S1010%S/7.78 e (0.84)//0.59 e (0.02)
S2020%S/17.98 d (1.99)//0.62 e (0.05)
S3030%S/31.14 c (2.76)//0.75 d (0.09)
S4040%S/44.37 b (2.32)//0.76 d (0.04)
S5050%S/58.13 a (2.11)//0.85 b (0.04)
TO/TO/52.72 a (3.45)/0.80 cd (0.06)
S10-TO10%STO7.78 (0.84)50.61 ab (1.57)58.39 c (2.05)0.84 bc (0.05)
S20-TO20%STO17.98 (1.99)45.77 ab (2.96)63.75 b (3.88)0.88 ab (0.03)
S30-TO30%STO31.14 (2.76)41.79 b (3.02)72.93 ab (2.92)0.89 ab (0.03)
S40-TO40%STO44.37 (2.32)32.01 c (3.07)76.38 a (5.74)0.91 a (0.05)
S50-TO50%STO58.13 (2.11)21.34 d (3.31)79.47 a (6.07)0.92 a (0.05)
Data are provided as the average (standard deviation) from replicates; different small letters represent a significant difference (p < 0.05) for different treatments.
Table 2. Leaching rate (LR) of the C, S30, TO, and S30-TO groups.
SamplesLeaching Rate (%)
C0.45 a (0.13)
S3094.32 b (3.37)
TO1.22 c (0.61)
S30-TO17.66 d (2.68)
Data are provided as the average (standard deviation) from replicates; different small letters represent significant differences (p < 0.05) for different treatments.
Disclaimer/Publisher’s Note: The statements, opinions and data contained in all publications are solely those of the individual author(s) and contributor(s) and not of MDPI and/or the editor(s). MDPI and/or the editor(s) disclaim responsibility for any injury to people or property resulting from any ideas, methods, instructions or products referred to in the content.

