Article

Effects of Soil Properties and Nutrients on the Fruit Economic Parameters and Oil Nutrient Contents of Camellia oleifera

1
National Engineering Research Center of Oiltea Camellia, Research Institute of Oiltea Camellia, Hunan Academy of Forestry, Shao Shan South Road No. 658, Changsha 410004, China
2
Hunan Key Laboratory of Economic Crops Genetic Improvement and Integrated Utilization, School of Life and Health Sciences, Hunan University of Science and Technology, Xiangtan 411201, China
3
Forestry Bureau of Leiyang City, Leiyang 421800, China
*
Author to whom correspondence should be addressed.
These authors contributed equally to this work.
Forests 2023, 14(9), 1786; https://doi.org/10.3390/f14091786
Submission received: 21 July 2023 / Revised: 17 August 2023 / Accepted: 28 August 2023 / Published: 1 September 2023
(This article belongs to the Special Issue Advances in Woody Oil Species: Past, Present and Future)

Abstract

:
The Camellia oleifera industry is hindered by the substandard quality of its fruits and the low yield of camellia seed oil. Although soil factors have been shown to affect the productivity of this plant, the relationship between C. oleifera characteristics and soil properties and nutrients remains unclear. Therefore, we investigated soil factors within the central distribution area of this species. Our findings revealed that this plant thrives in acidic soils with a medium cation exchange capacity. There were moderate differences in the main and medium element contents in the soils, while the variation of microelements was significant. Overall, C. oleifera cultivated soils were poor, with an uneven distribution of soil nutrients. Most of the shape characteristics of camellia fruits showed moderate variability, whereas dry kernel rate and oil content exhibited minor variability. The fatty acid profiles remained stable across different planting sites, but there were higher variations in the content of active compounds. Fruit shape characteristics were primarily influenced by soil properties, while soil nutrients mainly affected the seeds and kernels of the fruit. Minor fatty acid content could be influenced by soil properties and nutrients, except for total nitrogen (TN), which specifically affected the content of palmitic acid and oleic acid. There was no significant correlation between soil factors and sterols, polyphenols, and tocopherols, while squalene was affected by soil properties. Our study highlights the importance of considering soil properties and nutrients in the cultivation of C. oleifera and emphasizes the need for rational fertilizer application.

1. Introduction

Camellia oleifera Abel. is one of the four popular woody oil plants in the world [1]. It is widely cultivated in southern China, with a planting area of approximately 4.46 million hectares. The production of C. oleifera seeds reached 3,140,000 tons in 2020 [2]. The fatty acid composition of camellia seed oil primarily consists of palmitic acid (C16:0), stearic acid (C18:0), oleic acid (C18:1), linoleic acid (C18:2), and linolenic acid (C18:3) [3,4], and varies depending on the variety, source, and growth conditions of C. oleifera trees [5]. Some studies have reported that the content of unsaturated fatty acids in camellia seed oil is higher than in olive oil [6]. Additionally, camellia seed oil is rich in bioactive components, such as squalene, phytosterols, polyphenols, and fat-soluble vitamins [2]. The content and composition of these bioactive components can vary depending on the species, planting environment, and extraction process [2,5]. Due to its excellent fatty acid profile and abundant bioactive and volatile components, camellia seed oil possesses high nutritional quality and distinctive sensory characteristics. As a result, camellia seed oil holds great economic potential not only in the food industry but also in the pharmaceutical and cosmetics industries [2,7,8]. Moreover, C. oleifera is vital in soil and water conservation, ecological environment improvement, and biological fireproofing [9,10].
One of the major bottlenecks of C. oleifera cultivation is the inferior quality of C. oleifera fruits and the low yield of camellia seed oil. Some studies have attributed these problems to unsuitable planting sites and a lack of scientific planting and maintenance [11]. Certain researchers have suggested that climatic factors have a more significant impact on the distribution of C. oleifera forest than soil conditions [12]. However, other studies have found that fruit yields and oil production can be influenced by local soil conditions, including the microbial community and function, as well as nutrient availability [13,14]. Specifically, selected soil factors such as soil organic matter (OM), available potassium (AK), phosphorus (AP), calcium, microbial biomass carbon (MBC), and catalase are correlated with oil yield [11]. Despite this, limited research has been conducted to investigate soil quality and its significance for the yield and quality of camellia seed oil. This knowledge gap may be responsible for the improper management of C. oleifera cultivation [14]. More research is necessary to elucidate the impact of soil properties and nutrients on the economic parameters of fruits and the nutrient content of camellia seed oil to achieve high yield and excellent quality.
Hence, this study aims to examine a diverse range of C. oleifera fruits obtained from various soil conditions in its core production area and investigate the influence of specific soil properties and nutrients on the economic parameters of fruits and the nutrient content of camellia seed oil.

2. Materials and Methods

2.1. Sampling Location

The location information for the samples is presented in Table 1. The samples were collected in Leiyang City, Hunan Province, one of the main distribution areas for C. oleifera. Leiyang city is situated at longitude 112°5′13″~113°8′49″ East and latitude 26°11′38″~26°57′35″ North. Leiyang City has a humid subtropical climate with abundant precipitation, simultaneous rain, and heat, and four distinct seasons. Its annual average temperature is 17.9 °C, and the annual average rainfall is 1337 mm. The sampling sites have an altitude variation ranging from 70 to 540 m above sea level, with the highest altitude at Daozi Town and the lowest at Yongji Town. The parent materials of sampling sites include quaternary sediment, granite, plate shale, and limestone. The afforestation periods mainly ranged from 2008 to 2013, with some older forests (Table 1).

2.2. Samples Collection

Acquisition of Camellia fresh fruit samples: The camellia fresh fruits were collected as described before with minor modifications [15,16]. The fresh fruits were harvested during the fruit maturation period in October 2018. Twenty fresh fruits were randomly collected from various directions of the tree crown, with five trees chosen for each site. These fresh fruits were carefully stored in sealed pockets and transported to the laboratory to analyze their economic properties.
Collection of soil samples: The soil samples were collected according to the method described before with minor modifications [15,16]. The samples were collected at a depth of 0–20 cm, eight points for each site. The soil samples were mixed to form a composite sample for each site. The composite samples were air-dried, crushed, and sieved through 2 mm sieves, then subjected to physical and chemical measurements to determine the levels of indicators.
Preparation of oil samples: The oil samples were prepared as described before [17]. The fresh camellia fruits were placed in a room for 6 to 7 days at first, followed by spreading out in the sun for another 3 to 4 days. The fruits were allowed to crack open naturally. If any fruits did not crack open naturally, the seeds and peels were manually separated. The fresh seeds were then collected and dried in an oven at a temperature of 40 °C until a constant weight was achieved. Subsequently, the camellia seed oil was extracted by low-temperature physical pressure.

2.3. Soil Analysis

Soil pH was measured potentiometrically using a pH meter equipped with a glass electrode in a soil suspension made with distilled water at a ratio of 1:2.5 (w/v). Water content (WC) was determined using the oven-drying method at an oven temperature of 105 °C, as described by Lu, R. [18]. Exchangeable Ca2+ and Mg2+ were determined using an atomic absorption spectrophotometer after extraction with 1 M ammonium acetate solution (pH 7). The wavelength settings for calcium and magnesium were 422.7 and 285.2 nm, respectively [18]. The cation exchange capacity (CEC) was determined using the ammonium acetate exchange method in a leaching tube. Samples were saturated with ammonium ions, and the displaced ammonium ions were measured using the Kjeldahl method [19]. Soil organic matter (OM) was measured as the percentage of organic carbon using dichromate oxidization and visible spectrophotometry. The organic carbons present in the sample were converted into carbon dioxide by dichromate wet combustion. A 1:1 (v/v) solution of sulfuric acid and potassium dichromate was added to the dried samples. After digestion at 180 °C for 5 min, the formation of Cr3+ ions was measured at 590 nm [20].
Total nitrogen (TN) was determined via the Kjeldahl method. The samples were digested in concentrated sulfuric acid at 380 °C for 90 min using a Graphite-digestion device. The resulting digestion solution was then analyzed by an automatic Kjeldahl nitrogen analyzer (KDY-9830, Beijing, China). For the measurement of total phosphorus (TP), 0.5 g air-dried soil was digested by adding 5 mL of sulfuric acid and 1–2 mL of hydrogen peroxide within a temperature range of 280–370 °C. TP was measured using a Smartchem 200 Discrete Chemistry Analyzer at a wavelength of 880 nm (WestCo Scientific Instruments, Brookfield, CT, USA). To determine total potassium (TK), 0.1 g of soil was digested in 3 mL of nitric acid and 0.5 mL of perchloric acid solution at a temperature range of 200–225 °C. The resulting solution was then tested using a flame photometer. Alkali nitrogen (AN) was extracted using the alkaline permanganate method. Briefly, the 0.5 g of air-dried soil was digested by adding 5 mL of 0.2 M potassium permanganate and 5 mL of 0.5 M sodium hydroxide for about 30 min. The AN levels were estimated using the Kjeldahl method. For the extraction of available phosphorus (AP), Mehlich 3 solution was prepared by combining 0.56 g of ammonium fluoride, 0.29 g of EDTA, 20 g of ammonium nitrate, 11 mL of glacial acetic acid, and 0.82 mL of concentrated nitric acid. The AP levels were then measured using a Smartchem Discrete Auto Analyzer at a wavelength of 880 nm after coloration with potassium sodium tartrate and ammonium molybdate. Available potassium (AK) was also extracted using Mehlich 3 solution, and its levels were determined using a flame photometer [20].
Diethylenetriaminepentaacetic acid (DTPA) solution contained 0.005 mol/L DTPA, 0.01 mol/L CaCl2, 0.1 mol/L TEA (Triethanolamine). Available Fe, Mn, Cu, and Zn were extracted by the DTPA method. In brief, 10 g of air-dried soil was mixed with 20 mL DTPA solution and kept at 20 °C for 120 min. The extracts were then analyzed using an AA-7000 atomic absorptionspectrophotometer (Shimadzu, Kyoto, Japan) [21].

2.4. Economic Parameters of Fruits

One hundred camellia fruits were selected from each site, and the weight of each fruit was determined using an electronic balance. The average fruit weight (Fw) was calculated. The number of ventricles (Nv) and seeds per fruit (Se) was determined using the manual counter. In addition, the peel thickness, fruit skin thickness (Fst), vertical diameter (Vd), and horizontal diameter (Hd) of the fruits were measured using a 1/100 vernier caliper [22].
The other fruit quality parameters were computed using the following equations:
Fresh seed rate (%) = (total mass of fresh seed (g)/total mass of fresh fruit (g)) × 100%
Dry seed rate (%) = (total mass of dry seed (g)/total mass of fresh seed (g)) × 100%
Dry kernel rate (%) = (total mass of dry kernel (g)/total mass of dry seed (g)) × 100%

2.5. Oil Content Analysis

The dry seeds were peeled and then ground using a mortar. Approximately 10 g of the resulting sample was weighed and placed in a dried filter paper bag. This bag, containing the samples, was then inserted into a Soxhlet extractor (SOX606) for a 10-h extraction using petroleum ether. The fat content was subsequently calculated using the following formula:
Oil content (%) = (total mass of oil (g)/total mass of dry kernel (g)) × 100%.

2.6. Fatty Acid Composition Analysis

The fatty acid profile of camellia seed oil was determined through methyl ester treatment [23]. The oil was methylated using potassium hydroxide-methanol and subsequently extracted using n-hexane. Oil phase was washed with distilled water and dried using anhydrous sodium sulfate. The samples were analyzed using a Shimadzu GC-2014 gas chromatograph under the previously described conditions [23]. Each fatty acid was identified based on the retention time of the corresponding standard sample, and the relative content of each fatty acid was calculated using the peak area normalization method. The reported values represent the average of three repeated experiments.

2.7. Nutritional Substance Determination

The tocopherol content was analyzed using the previously described method. Specifically, 1.0 g of oil samples and 0.1 g of butylated hydroxytoluene (BHT) were dissolved in n-hexane to make a 25 mL solution. The solution was then analyzed using high-performance liquid chromatography under the previously mentioned conditions [24].
Total polyphenols: An oil sample was dissolved in n-hexane and purified using a glycol-based column. The total polyphenols were determined using the Folin-phenol reagent, and the absorption was measured at a wavelength of 750 nm. The polyphenol concentration was determined based on the standard curve of gallic acid, and the content was subsequently calculated [25].
Squalene and phytosterol: An oil sample weighing 0.4 g was placed in a conical bottle, and 10 mL of KOH-ethanol solution (2 mol/L) was added to the sample. The solution was saponified at a temperature of 80 °C for 50 min. The unsaponified substances were extracted using n-hexane, washed to neutrality, dried, and finally brought to a volume of 2 mL. The contents of squalene and phytosterol were determined using gas chromatography with the external standard method [26].

2.8. Statistical Analysis

One-way analysis of variance (ANOVA) was used to examine the differences in fruit economic parameters. Statistical significance was evaluated at the p < 0.05 level. Data analysis was performed using SPSS 20.0 (IBM, Chicago, IL, USA). The correlations between soil factors and the fruit economic parameters, as well as oil nutrient contents, were analyzed using the R statistical language. The Pearson’s correlation coefficient (r value) and the corresponding p value were computed using the “rcorr” function of the Hmisc r package. Correlation plots were generated using the corrplot package. Statistical significance was assessed at the p < 0.05 level.

3. Results

3.1. Physico-Chemical Properties of C. oleifera Cultivated Soils

The properties of soils cultivated with C. oleifera are presented in Table 2. In general, C. oleifera is cultivated in strong acidic (pH < 5.0) or acidic soils (5.0 < pH < 6.5), suggesting adaptability to the typical red acid soil in Hunan province [12]. The highest soil pH value was found at Taipingxu (5.34), while the lowest value was observed at Nanyang (4.22). The average soil pH was 4.52, and its coefficient of variation (CV) was low. This is consistent with previous reports that suggest tea plants prefer acidic soil, with the optimal pH range being 4.0–6.5 [27]. The water content (WC) ranged from 23.95% to 13.61%, with an average of 17.94% and a moderate CV of 17.26%. Cation-exchange capacity (CEC) is an important soil property for describing nutrient availability. The CEC value ranged from 4.80 cmol/kg at Huayuan Village to 19.80 cmol/kg at Shili Village. The average CEC value was 12.97, indicating that the investigated soils have a medium nutrient retention and supply capacity [28]. The CV of CEC is 24.31%.
The exchangeable calcium (Ex. Ca2+) values were less than 2 Cmol/kg in most cases, except at Zaotian Village, where the value was 3.42. The average of Ex. Ca2+ was 0.59 with a moderate variability. The exchangeable magnesium (Ex. Mg2+) values were less than 1 Cmol/kg in all soils, with the highest value observed at Zaotian Village. The CV of Ex. Mg2+ was 42.56%. Effective sulfur (Es) content ranged from 5.60 to 144.80 mg/kg. The average Es value was 71.80 mg/kg, while the CV of Es was 52.01%.
The organic matter (OM) content ranged from 3.90 g/kg in Zifeng Village to 32.80 g/kg in Shaming Village. The average OM content was 16.25 g/kg, with a CV of 50.24%, indicating a slight deficiency [29]. The average OM content of the old forests was 20.37 g/kg, much higher than 13.74 g/kg of new forests, suggesting that C. oleifera cultivation can improve soil OM content, which is consistent with a previous report [30]. Total nitrogen (TN) ranged from 0.56 to 1.74 g/kg, with an average of 1.14, indicating that soil nitrogen sources were generally at a moderate level [29]. Total phosphorus (TP) ranged from 0.18 to 0.68 g/kg, with an average of 0.34, indicating a deficiency of phosphorus in most sites (<0.40 g/kg) [29]. Total potassium (TK) ranged from 8.00 to 23.30 g/kg, with an average of 13.93, indicating a slight deficiency of potassium (<15.00 g/kg) [29]. Alkali nitrogen (AN) ranged from 19.00 to 114.00 mg/kg, with an average of 57.06, indicating a deficiency of alkali nitrogen (<60.00 mg/kg) [29]. Available phosphorus (AP) ranged from 0.30 to 12.90 mg/kg, with an average of 2.00, indicating a low availability of phosphorus in most cases (<3.00 mg/kg) [29]. Available potassium (AK) ranged from 18.00 to 85.00 mg/kg, with an average of 42.75, indicating a deficiency of available potassium in most cases (<50.00 mg/kg) [29]. These results indicated that most essential macronutrients are at low levels in the selected soils [29]. This is consistent with a previous report and the classification data of China’s second soil survey, which suggests poor soil fertility in the C. oleifera planting area [12]. Furthermore, the concentrations of these macro elements differ significantly between different sampling sites, highlighting the need for rational fertilization.
The available iron (Fe) content ranged from 0.88 to 52.75 mg/kg, with an average of 14.32, suggesting Fe is relatively abundant in most cases. However, there was a high CV (100.42%) for Fe content, and available Fe was insufficient in six sites (<4.5 mg/kg) [29]. The available manganese (Mn) content ranged from 0.10 to 45.85 mg/kg, with an average of 6.19, indicating a moderate availability of Mn in most cases. However, the CV of Mn content was even higher, with over half of the selected sites falling below the medium level. The available copper (Cu) content ranged from 0.01 to 0.90 mg/kg, with an average of 0.25, suggesting a moderate availability of Cu in most cases [29]. However, in 10 selected sites, the soils were deficient in Cu (<0.2 mg/kg). The available zinc (Zn) content ranged from 0.13 to 1.94 mg/kg, with an average of 0.79, indicating a moderate availability of Zn in most cases. Overall, the supply of micronutrients in Leiyang is at an intermediate level. However, there is substantial variation between sampling sites, highlighting the need for soil testing and appropriate fertilizer formulas.

3.2. The Parameters of C. oleifera Fruits in Different Studied Sites

The properties of C. oleifera fruits were presented in Table 3, including fruit weight (Fw), horizontal diameter (Hd), vertical diameter (Vd), peel thickness (Pt), middle peel thickness (Ptm), fruit skin thickness (Fst), ventricles per fruit (Nv/F), seeds per fruit (Se/F), fresh seed rate (Fse), dry kernel rate (Dkr), dry seed rate (Dse), and oil content (Oc). The highest recorded Fw was 42.10 g, while the lowest was 10.69 g. Hd varied greatly across sites, with the highest measurement of 37.08 mm in Suyinlou Village and the lowest of 16.96 mm in Zifeng Village. Similarly, Vd ranged from 36.98 mm in Suyinlou Village to 18.41 mm in the lowest site. Pt ranged from 4.04 to 8.41 mm, with the highest value in Shili Village and the lowest in Zaotian Village. Ptm had a wide range, with the highest measurement of 3.99 mm in Shili Village and the lowest of 1.68 mm in Zifeng Village. The fruits from Shili Village presented the highest values of Fst. The number of ventricles per fruit (Nv/F) was consistent across all sites, ranging from 1.87 to 3.00. Shili Village had the highest number of seeds per fruit (Se/F). Approximately 37.01% to 44.81% of the total seed weight consisted of fresh seeds (Fse), and 49.14–60.28% of the fresh seeds were dried seeds (Dse). Shili Village had the highest percentage of dried seeds (Dse), while Dongnan Village had the lowest, and 35.05% to 64.54% of the dry seeds were dried kernels (Dkr). The oil content (Oc) ranged from 36.98% to 48.88% across all fruits. In conclusion, the variations of most shape characteristics of camellia fruits are moderate, whereas the variations of the two most significant yield parameters, Dkr and Oc, are minor.

3.3. Distribution of Fatty Acids in Camellia Seed Oil of Selected Sites

The distribution of fatty acids in camellia seed oil is presented in Table 4. The primary saturated fatty acids (SFA) were palmitic acid (7.85%–9.20%) and stearic acid (1.90%–2.90%), accounting for 10.15%–11.25% of the total fatty acids. The CV for palmitic acid is lower than that for stearic acid. The distribution of SFA is relatively consistent (2.61%) across different sites. The predominant unsaturated acids are palmitoleic, heptadecenoic, oleic, linoleic, linolenic, eicosenoic, and tetracosanoic acids. Oleic acid is the most abundant fatty acid (79.70%–82.70%), followed by linoleic acid (5.60%–8.30%) (Table 4). The average oleic acid content is 81.24%, with a minor CV. Monounsaturated fatty acids (MUFA) account for 80.46%–83.45% of the total fatty acids, exhibiting a very low CV. Polyunsaturated fatty acids (PUFA) comprise 5.87%–8.61% of the total fatty acids, with a relatively higher CV. The fatty acid composition of camellia seed oil remains stable across different sites in Leiyang City, suggesting the advantage of camellia seed oil production in its central distribution area. Furthermore, the content of the dominant fatty acids is more stable than the less abundant fatty acids.

3.4. Distribution of Active Compounds in Camellia Seed Oil

The active compounds in camellia seed oil are listed in Table 5. Sterols are the major active compounds in the camellia seed oil. The content of sterols ranged from 151.50 to 225.00 mg/100 g, with an average of 186.25 mg/100 g, and the CV was 10.77%. The content of squalene ranged from 123 to 272 mg/kg, with an average of 158.85 mg/kg, and the CV was 19.42%. The content of tocopherols ranged from 198 to 292 mg/kg, with an average of 236.25 mg/kg, and the CV was 10.34%. The content of polyphenols ranged from 11.23 to 27.02 mg/kg, with an average of 16.66 mg/kg, and the CV was 21.23%. The variation of active compounds was higher than that of fatty acids. This indicated that the contents of active compounds are more affected by the cultivation conditions and have a rather high improvement potential. The differences in feed nutritive value among different sites can be determined by the minor active compounds.

3.5. Correlations of Selected Soil Properties, Soil Nutrients, and Fruit Parameters

The correlations among selected soil properties, soil nutrients, and fruit yield parameters are presented in Figure 1. There are negative and significant correlations between soil pH and fruit size parameters, such as Hd, Vd, Pt, Ptm, and Fst. Additionally, soil pH exhibits a positive and significant correlation with the number of seeds (Se) per fruit. Moreover, WC shows a significant and positive correlation with fruit yield parameters (Hd, Pt, Ptm, Fst). WC has a significant impact on fruit diameter. The CEC has a significant positive correlation with Hd, Vd, Pt, Ptm, Fst, and the percentage of dry seed (Dse). The exchangeable Ca2+ and Mg2+ exhibit significant and positive correlations with the number of seeds per fruit. Es content shows a significant negative correlation with Se and Fse. Conversely, the correlation between TN and Fse is significant and positive. Importantly, TK demonstrates a significant and positive correlation with the oil content of seeds. Soil microelements, such as Fe, Mn, and Cu, exhibit significant and positive correlations with the number of seeds per fruit. Furthermore, the content of Fe has a significant positive correlation with Fw and a negative correlation with the Dkr. The content of Mn shows a significant negative correlation with the vertical diameter of fruits.

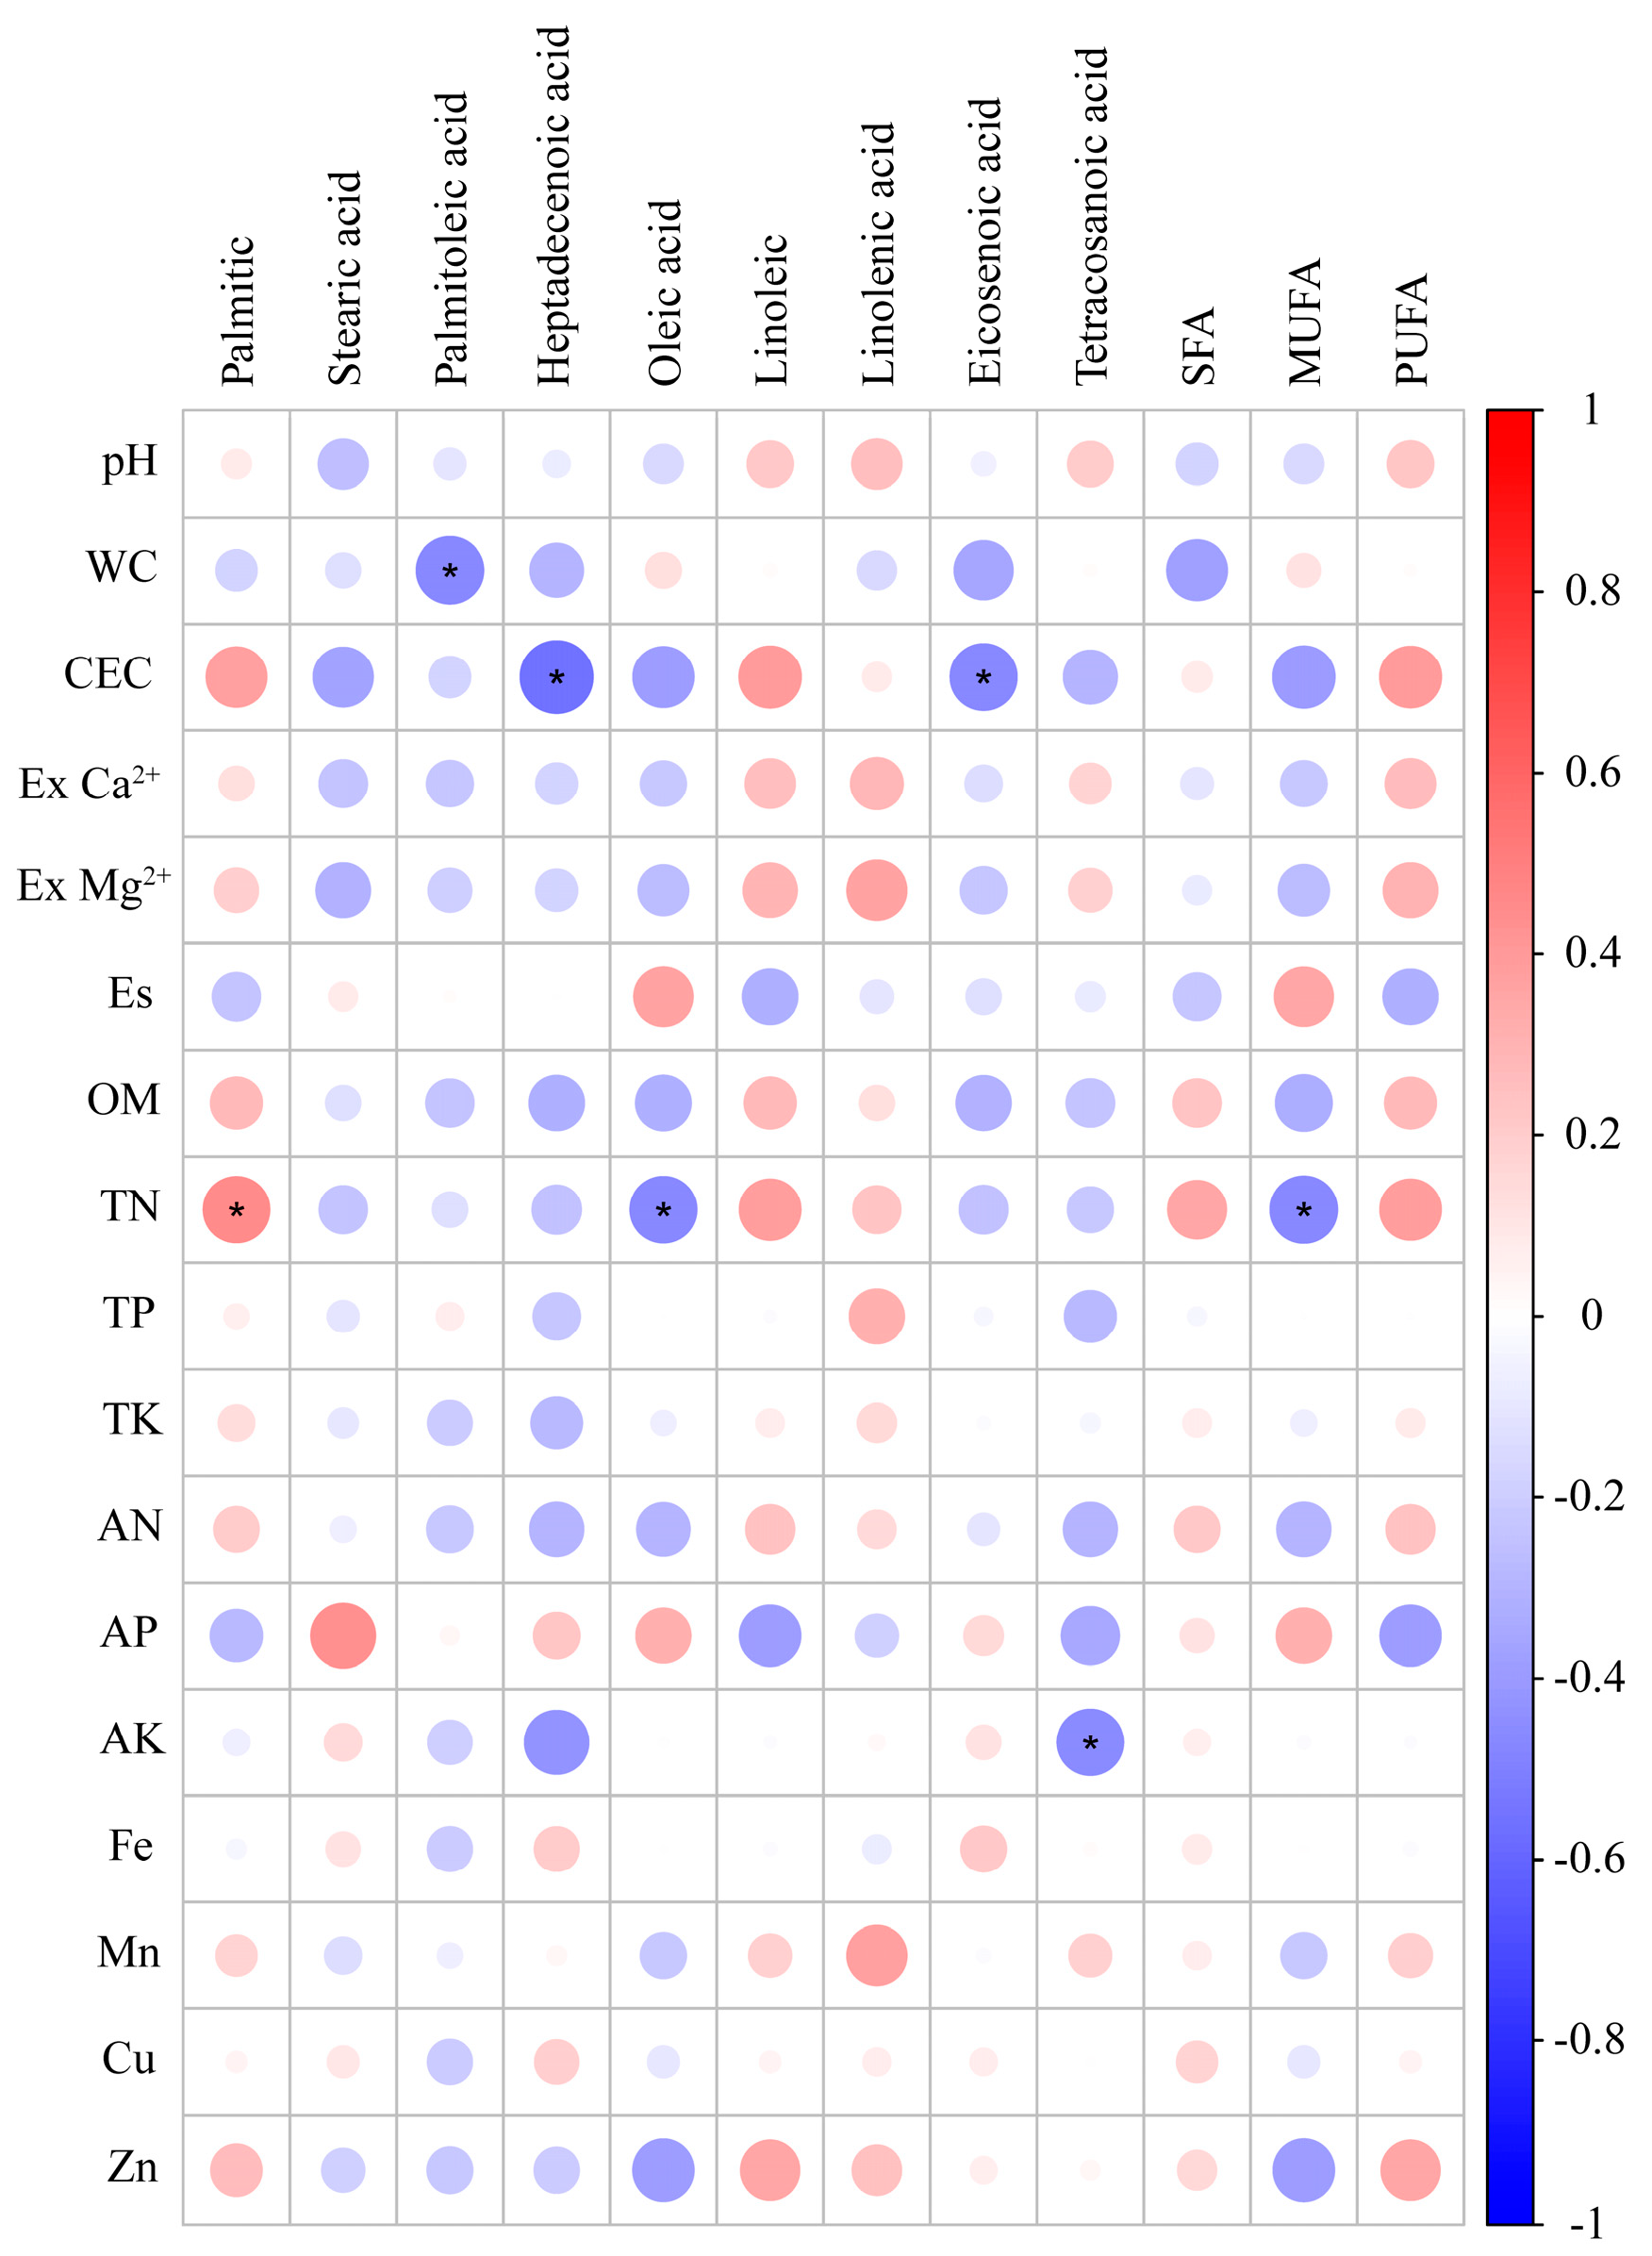
3.6. Correlation of Soil Properties, Soil Nutrients and Fatty Acids

The correlation between soil properties, soil nutrients, and fatty acid profiles is presented in Figure 2. Regarding saturated fatty acids, palmitic acid exhibited a significant correlation with TN, while stearic acid showed no significant correlation with soil properties and nutrients. Several unsaturated fatty acids displayed correlations with soil nutrients and properties. Specifically, palmitoleic acid exhibited a significant correlation with WC, but no significant correlation with other nutrient elements. Heptadecenoic acid exhibited a significant negative correlation with CEC, but no significant correlation with other nutrient elements. Oleic acid exhibited a significant negative correlation with TN, and the same correlation was observed between MUFA and TN. This can be attributed to the high content of oleic acid in camellia seed oil, as shown in Table 4. Eicosenoic acid exhibited a significant correlation with CEC, while tetracosanoic acid exhibited a significant correlation with AK. There was no significant correlation between soil factors and SFA or PUFA.

3.7. Correlation of Soil Properties, Soil Nutrients and Active Compounds

The correlation between soil properties, soil nutrients, and active compound contents is presented in Figure 3. No significant correlation was found between soil factors and sterols, polyphenols, and tocopherols. However, squalene exhibited a significant correlation with soil properties, including pH, exchangeable Ca2+, and exchangeable Mg2+, as well as soil nutrients, such as effective sulfur (Es), manganese (Mn), and copper (Cu). This correlation was positive for all the soil factors, except for Es.

4. Discussion

4.1. C. oleifera Fruits Yield Parameters as Affected by Soil Properties and Nutrients

Previous studies have demonstrated that the fruit and oil yields of C. oleifera can be influenced by local soil conditions [13,14]. The present study examined the relationship between fruit shape parameters and pH values, revealing that as pH values decreased, the fruit shape parameters increased. Additionally, this study found that the number of seeds per fruit increased with higher pH values. The results indicated a significant negative correlation between pH and the fruit shape parameters, while a positive correlation was observed between pH and the number of seeds per fruit. Overall, this study highlights the impact of soil pH on various parameters of C. oleifera fruits, with both positive and negative effects depending on the pH level.
The data from this study indicated that C. oleifera cultivated in Donghu and Yongji had the highest single-fruit weights, measuring 42.10 and 35.47 g, respectively. Additionally, these cultivations displayed a high number of ventricles per fruit, which were 2.87 and 2.73, respectively. The shape parameters of the fruits increased as the water content increased, as depicted in Figure 1. Previous research has shown that C. oleifera is susceptible to soil moisture [31]. Our findings further demonstrate that soil moisture explicitly influences the shape parameters of the fruit. Numerous studies have reported that increasing water supply in the soil affects fruit size, peel thickness, and oil accumulation of C. oleifera [31,32,33,34]. This study establishes a significant and positive correlation between water content and fruit shape parameters, indicating the impact of water content on fruit growth. The severe drought in 2022 in Hunan Province has dramatically reduced the production of camellia seed oil. These findings affirm the positive effect of water content on the growth of C. oleifera fruits.
The impact of soil conditions on the growth of C. oleifera fruit and seed oil production has generally been overlooked compared to climatic conditions [12]. Nonetheless, this study reveals a noteworthy association between the cation exchange capacity (CEC) and various fruit characteristics, including horizontal diameters, peel thickness, fruit skin thickness, the number of ventricles, and the percentage of dry seed. These findings underscore the crucial role played by soil conditions in determining fruit economic yield parameters.
Among the various yield parameters of different fruits, the number of seeds per fruit was influenced by multiple factors, such as soil pH and the application of middle and trace element fertilizers. A previous study reported significant variation in seed number in C. oleifera at both the fruit and tree levels [35]. Our study suggests that the number of seeds per fruit can be greatly influenced by cultural conditions, which partly explains its high variability. Additionally, Fse, Dse, Dkr, and Oc are crucial parameters for fruit yield. CEC, TN, and TK contribute to Fse, Dse, and Oc, respectively. Considering the variable coefficients of these parameters, there is significant potential for improvement.
In conclusion, the shape characteristics of the fruit were primarily influenced by soil conditions, while the seeds and kernels of the fruit were primarily affected by soil nutrients. In the cultivated area of C. oleifera, the soil fertility was found to be low. Therefore, favorable soil conditions can significantly enhance the yield of C. oleifera forests.

4.2. Effects of Soil Properties and Soil Nutrients on the Composition and Content of Fatty Acids

This study has revealed that C. oleifera seed oils from different sampling sites contain both saturated and unsaturated fatty acids. The fatty acid profile observed in this study is consistent with previous reports [36,37], indicating that these fatty acids are commonly found in C. oleifera fruits. Fatty acids play a crucial role in evaluating the quality of camellia seed oil. For example, seed oil with a high concentration of unsaturated fatty acids is known to be sold at higher prices due to its health benefits [4]. In our study, unsaturated fatty acids accounted for over 80% of the total fatty acids, suggesting that the C. oleifera seed oils produced in Leiyang City are of good quality. The distribution and abundance of fatty acids may be influenced by various factors. Previous studies have shown that pollen sources can affect the content and composition of fatty acids [36,38]. In our study, we observed a correlation between palmitic acid and TN (Figure 2). Additionally, TN showed a significant positive correlation with oleic acid and MUFA (Figure 2), indicating that soil properties may impact the content and composition of fatty acids.
Furthermore, a noteworthy and positive correlation exists between incidental fatty acids and soil nutrients. This observation aligns with previous research, which posited that the composition and percentage ratio of fatty acids vary depending on nitrogen addition in the soil [39]. Nonetheless, alternative studies have contended that the disparity in fatty acid content and composition may also be influenced by a combination of factors, including genotype, ontogeny, light, temperature, water, and nutrients [40].
Considering that previous studies have identified a dearth of information regarding the impact of certain soil nutrients and soil properties, such as pH, on the composition and content of fatty acids [40], our research serves to address this gap by demonstrating the correlation between a wide range of soil properties and nutrients with fatty acids and active compounds. Consequently, our findings offer valuable insights into the influence of soil nutrients and properties on the content and composition of seed oils, thereby filling the void regarding the factors that govern the components of these oils.

5. Conclusions

In this study, the planting sites within the central product area for C. oleifera were investigated to find the linkage between soil factors and fruit characteristics. Significant variations in the nutrient characteristics of soils were observed, especially for microelements. The supply of macronutrients was insufficient in most cases. Therefore, the soil fertility level was poor, and its distribution was uneven, thus its potential productivity can be limited. The composition of fatty acids remained relatively stable across different sample sites, while there was greater variation in the minor active compounds. This suggests that it is possible to improve the oil quality by increasing the content of active compounds. Additionally, the properties of soils and their nutrients have an impact on the economic parameters of the fruit. Soil conditions primarily influence the shape characteristics of the fruit, while soil nutrients mainly affect the seeds and kernels. We examined the changes in the composition and content of fatty acids in response to soil properties and nutrients. It was observed that soil properties and nutrients have an impact on minor fatty acids. Furthermore, the content of squalene can vary depending on soil properties and nutrients. Our study emphasizes the critical importance of soil factors, including soil properties and soil nutrients, in promoting the cultivation industry of C. oleifera, as well as providing valuable insights for efficient soil nutrient management in C. oleifera cultivation.

Author Contributions

S.D. and Y.C. conceived the idea for the project, and wrote the paper. B.X. and M.L. collected samples. Y.X., L.M. and J.G. conducted most of the experiments. S.D., M.S. and Y.C. analyzed the results. All authors have read and agreed to the published version of the manuscript.

Funding

This research was funded by Oil Tea Industry Science and Technology Support and Technology Demonstration Project of Hunan Province (2023LYCY0008). Industry Science and Technology Innovation and Entrepreneurship Team’s Project of Hunan Provincial Committee of the Communist Party of China’s Organization Department (Shennong Guoyou). Open fund of Hunan Key Laboratory of Economic Crops Genetic Improvement and Integrated Utilization, grant number (E22326). Science and Technology Commissioner Service Rural Revitalization Project of Hunan Province (2022NK4195). Scientific research project of Education Department of Hunan Province of China, grant number (21B0459).

Data Availability Statement

The data that support the findings of this study are available from the corresponding author upon reasonable request.

Conflicts of Interest

The authors declare no conflict of interest.

References

  1. Zhang, D.; Tan, X.; Peng, W.; Liu, Q.; Zeng, Y.; Chen, H.; Tian, H.; Ma, Q. Improved application of Camellia oleifera on biomass energy by enlarging its production. Acta Sci. Nat. Univ. Sunyatseni 2007, 46, 109–110. [Google Scholar]
  2. Li, G.; Ma, L.; Yan, Z.; Zhu, Q.; Cai, J.; Wang, S.; Deng, S. Extraction of Oils and Phytochemicals from Camellia oleifera Seeds: Trends, Challenges, and Innovations. Processes 2022, 10, 1489. [Google Scholar]
  3. Lin, P.; Wang, K.; Zhou, C.; Xie, Y.; Yao, X.; Yin, H. Seed transcriptomics analysis in Camellia oleifera uncovers genes associated with oil content and fatty acid composition. Int. J. Mol. Sci. 2018, 19, 118. [Google Scholar] [CrossRef]
  4. Yang, C.; Liu, X.; Chen, Z.; Lin, Y.; Wang, S. Comparison of oil content and fatty acid profile of ten new Camellia oleifera cultivars. J. Lipids 2016, 2016, 3982486. [Google Scholar]
  5. Wang, X.; Zeng, Q.; Verardo, V.; del Mar Contreras, M. Fatty acid and sterol composition of tea seed oils: Their comparison by the “FancyTiles” approach. Food Chem. 2017, 233, 302–310. [Google Scholar]
  6. Sahari, M.A.; Ataii, D.; Hamedi, M. Characteristics of tea seed oil in comparison with sunflower and olive oils and its effect as a natural antioxidant. J. Am. Oil Chem. Soc. 2004, 81, 585–588. [Google Scholar] [CrossRef]
  7. Cheng, Y.T.; Wu, S.L.; Ho, C.Y.; Huang, S.M.; Cheng, C.L.; Yen, G.C. Beneficial effects of camellia oil (Camellia oleifera Abel.) on ketoprofen-induced gastrointestinal mucosal damage through upregulation of HO-1 and VEGF. J. Agric. Food Chem. 2014, 62, 642–650. [Google Scholar] [CrossRef]
  8. Ye, Y.; Xing, H.; Li, Y. Nanoencapsulation of the sasanquasaponin from Camellia oleifera, its photo responsiveness and neuroprotective effects. Int. J. Nanomed. 2014, 9, 4475. [Google Scholar] [CrossRef]
  9. Li, J. Soil, water and nutrient loss in young plantation of the inter-cropped tea oil (Camellia oleifera) with different crops. Scientia Silvae Sinicae 2008, 44, 167–172. [Google Scholar]
  10. Gu, W.; Lu, Z.; Huang, C.; Li, Y.; Guan, Y. Screening study of fire resistant tree species in Jianshui County, Yunnan Province of southwestern China. J. Beijing For. Univ. 2020, 42, 49–60. [Google Scholar]
  11. Liu, J.; Wu, L.; Chen, D.; Li, M.; Wei, C. Soil quality assessment of different Camellia oleifera stands in mid-subtropical China. Appl. Soil Ecol. 2017, 113, 29–35. [Google Scholar] [CrossRef]
  12. Liu, C.; Chen, L.; Tang, W.; Peng, S.; Li, M.; Deng, N.; Chen, Y. Predicting potential distribution and evaluating suitable soil condition of oil tea Camellia in China. Forests 2018, 9, 487. [Google Scholar] [CrossRef]
  13. Ruan, J.; Zhang, F.; Wong, M.H. Effect of nitrogen form and phosphorus source on the growth, nutrient uptake and rhizosphere soil property of Camellia sinensis L. Plant Soil 2000, 223, 65–73. [Google Scholar] [CrossRef]
  14. Wu, F.; Li, J.; Chen, Y.; Zhang, L.; Zhang, Y.; Wang, S.; Shi, X.; Li, L.; Liang, J. Effects of phosphate solubilizing bacteria on the growth, photosynthesis, and nutrient uptake of Camellia oleifera Abel. Forests 2019, 10, 348. [Google Scholar] [CrossRef]
  15. Cao, Y.Q.; Yao, X.H.; Ren, H.D.; Wang, K.L.; Li, J.X.; Zhou, Q. Correlations between soil nutrient characteristics and kernel quality traits in Camellia oleifera cultivation. Chin. Agric. Sci. Bull. 2022, 38, 81–85. [Google Scholar]
  16. Qu, M.H.; Chen, X.D.; Ni, Z.L.; Mo, R.H.; Han, S.F.; Tang, F.B. Characteristics and distributions of metal elements in Camellia oleifera fruits and soil in production areas of Zhejiang province. J. Trop. Subtrop. Bot. 2021, 29, 259–268. [Google Scholar]
  17. Liu, J. The Research on Soil Fertility Quality Assessment of Camellia Oleifera in Different Dite Type and Quality of Tea Oil. Ph.D. Theis, Central South University of Forestry & Technology, Changsha, China, 2018. [Google Scholar]
  18. Lu, R. Analytical Methods of Soil Agrochemistry; China Agricultural Science and Technology Press: Beijing, China, 1999. [Google Scholar]
  19. Liu, C.L.; Wang, M.K.; Yang, C.C. Determination of Cation Exchange Capacity by One-Step Soil Leaching Column Method. Commun. Soil Sci. Plan. 2001, 32, 2359–2372. [Google Scholar] [CrossRef]
  20. Liu, C.; Deng, N.; He, Z.; Tang, W.; Wang, X.; Chen, L.; Chen, Y. Effects of Camellia oleifera clone selection on soil nutrient and microbial community structure. Agron. J. 2021, 113, 200–209. [Google Scholar] [CrossRef]
  21. Júnior, J.L.R.; de Oliveira, S.R.; Caldas, N.M.; Neto, J.A.G. Evaluation of alternate lines of Fe for sequential multi-element determination of Cu, Fe, Mn and Zn in soil extracts by high-resolution continuum source flame atomic absorption spectrometry. Anal. Chim. Acta 2008, 627, 198–202. [Google Scholar]
  22. Ji, K.; Song, Q.; Yu, X.; Tan, C.; Wang, L.; Chen, L.; Xiang, X.; Gong, W.; Yuan, D. Hormone analysis and candidate genes identification associated with seed size in Camellia oleifera. R. Soc. Open Sci. 2022, 9, 211138. [Google Scholar] [CrossRef]
  23. Lu, Y.; Chen, Y.; He, M.; Yang, Y. Composition of fatty acid in commercially available bottled vegetable oil. J. Hyg. Res. 2012, 41, 445–448. [Google Scholar]
  24. Gimeno, E.; Castellote, A.I.; Lamuela-Raventos, R.M.; De La Torre, M.C.; Lopez-Sabater, M.C. Rapid determination of vitamin E in vegetable oils by reversed-phase high-performance liquid chromatography. J. Chromatogr. A 2000, 881, 251–254. [Google Scholar] [CrossRef]
  25. Sassano, G.; Sanderson, P.; Franx, J.; Groot, P.; van Straalen, J.; Bassaganya-Riera, J. Analysis of pomegranate seed oil for the presence of jacaric acid. J. Sci. Food Agr. 2009, 89, 1046–1052. [Google Scholar] [CrossRef]
  26. Fang, X.; Du, M.; Luo, F.; Jin, Y. Physicochemical properties and lipid composition of Camellia seed oil (Camellia oleifera Abel.) extracted using different methods. Food Sci. Technol. Res. 2015, 21, 779–785. [Google Scholar] [CrossRef]
  27. Zhang, W.; Yao, Z.; Zheng, X.; Liu, C.; Wang, R.; Wang, K.; Shi, J. Effects of fertilization and stand age on N2O and NO emissions from tea plantations: A site-scale study in a subtropical region using a modified biogeochemical model. Atmos. Chem. Phys. 2020, 20, 6903–6919. [Google Scholar] [CrossRef]
  28. Li, N.; Zare, E.; Huang, J.; Triantafilis, J. Mapping soil cation-exchange capacity using Bayesian modeling and proximal sensors at the field scale. Soil Sci. Soc. Am. J. 2018, 82, 1203–1216. [Google Scholar] [CrossRef]
  29. Bai, W.; Huang, A.; Yang, S.; Lu, X.; Wang, Z.; Wu, N.; Tang, Y.; Zhang, F. Soil nutrient characteristics and comprehensive fertility evaluation of Camellia oleifera in main production area of Guizhou province. Southwest China J. Agric. Sci. 2022, 35, 2096–2106. [Google Scholar]
  30. Sun, W. Analysis of Soil Stoichiometric Characteristics of Camellia oleifera in Different Planting Years. Agricult. Technol. Equip. 2021, 6, 7–8. [Google Scholar]
  31. Zhou, Y.; Wang, R.; Chen, Z.; Zhong, F.; Liao, W. Analysis on soil moisture characteristics of Camellia oleifera forest at low mountain and hill areas. Nonwood For. Res. 2013, 31, 7–12. [Google Scholar]
  32. D’Andria, R.; Lavini, A.; Morelli, G.; Patumi, M.; Terenziani, S.; Calandrelli, D.; Fragnito, F. Effects of water regimes on® ve pickling and double aptitude olive cultivars (Olea europaea L.). J. Hortic. Sci. Biotech. 2004, 79, 18–25. [Google Scholar] [CrossRef]
  33. Lavee, S.; Hanoch, E.; Wodner, M.; Abramowitch, H. The effect of predetermined deficit irrigation on the performance of cv. Muhasan olives (Olea europaea L.) in the eastern coastal plain of Israel. Sci. Hortic. 2007, 112, 156–163. [Google Scholar] [CrossRef]
  34. Moriana, A.; Orgaz, F.; Pastor, M.; Fereres, E. Yield responses of a mature olive orchard to water deficits. J. Am. Soc. Hortic. Sci. 2003, 128, 425–431. [Google Scholar] [CrossRef]
  35. Xiao, Z.; Zhang, Z.; Krebs, C.J. Seed size and number make contrasting predictions on seed survival and dispersal dynamics: A case study from oil tea Camellia oleifera. Forest Ecol. Manag. 2015, 343, 1–8. [Google Scholar] [CrossRef]
  36. Hu, G.; Gao, C.; Fan, X.; Gong, W.; Yuan, D. Pollination compatibility and Xenia in Camellia oleifera. Hort Sci. 2020, 55, 898–905. [Google Scholar] [CrossRef]
  37. Zhang, F.; Li, Z.; Zhou, J.; Gu, Y.; Tan, X. Comparative study on fruit development and oil synthesis in two cultivars of Camellia oleifera. BMC Plant Biol. 2021, 21, 348. [Google Scholar] [CrossRef]
  38. Xie, L.; Hu, J.; Zhang, Q.; Sun, Q.; Zhang, Y.; Niu, L. Influence of pollen sources on the expression of FA and TAG biosynthetic pathway genes in seeds of Paeonia rockii during the rapid oil accumulation. Sci. Hortic. 2019, 243, 477–483. [Google Scholar] [CrossRef]
  39. Vicianová, M.; Ducsay, L.; Ryant, P.; Provazník, M.; Zapletalová, A.; Slepčan, M. Oilseed Rape (Brassica Napus L.) Nutrition by Nitrogen and Phosphorus and its Effect on Yield of Seed, Oil and Higher Fatty Acids Content. Acta Univ. Agric. Silvic. Mendelianae Brun. 2020, 68, 129–136. [Google Scholar] [CrossRef]
  40. Su, M.H.; Shih, M.C.; Lin, K.-H. Chemical composition of seed oils in native Taiwanese Camellia species. Food Chem. 2014, 156, 369–373. [Google Scholar] [CrossRef]
Figure 1. Correlations of selected soil factors and fruit economic parameters. Abbreviation: WC: Water content; CEC: Cation exchange capacity; Ex.: exchangeable; Es: Effective sulfur; OM: Organic matter; TN: Total nitrogen; TP: Total phosphorous; TK: Total potassium; AN: Alkali nitrogen; AP: Available phosphorus; AK: Available potassium; Fw: Fruit weight; Hd: Horizontal diameter; Vd: Vertical diameter; Pt: Peel thickness; Ptm: middle peel thickness; Fst: Fruit skin thickness; Nv/F: ventricles per fruit; Se/F: Seeds per fruit; Fse: Fresh seed rate; Dse: dry seed rate; Dkr: dry kernel rate; Oc: oil content; * p < 0.05, ** p < 0.01, *** p < 0.001.
Forests 14 01786 g001
Figure 2. Correlations of selected soil factors and fatty acids. Abbreviation: WC: Water content; CEC: Cation exchange capacity; Ex.: exchangeable; Es: Effective sulfur; OM: Organic matter; TN: Total nitrogen; TP: Total phosphorous; TK: Total potassium; AN: Alkali nitrogen; AP: Available phosphorus; AK: Available potassium; SFA: saturated fatty acids; MUFA: monounsaturated fatty acids; PUFA: polyunsaturated fatty acids; CV: coefficient of variation. * p < 0.05.
Forests 14 01786 g002
Figure 3. Correlations of selected soil properties, soil nutrients, and active compounds. WC: Water content; CEC: Cation exchange capacity; Ex.: exchangeable; Es: Effective sulfur; OM: Organic matter; TN: Total nitrogen; TP: Total phosphorous; TK: Total potassium; AN: Alkali nitrogen; AP: Available phosphorus; AK: Available potassium. * p < 0.05, ** p < 0.01, *** p < 0.001.
Forests 14 01786 g003
Table 1. Basic information of the sample sites.
NumberSample SiteSampling Site LocationAltitude/mParent MaterialAfforestation Period
1Tangquan Village, Donghu Town113°8′49″ E 26°29′32″ N260Plate shaleOld Forest
2Shaming Village, Daozi Town113°4′14″ E 26°27′24″ N540GraniteOld Forest
3Suyinlou Village, Dayi Town113°3′50″ E 26°16′2″ N160Plate shale2010
4Tianxin Village, Nanyang Town112°56′12″ E 26°18′38″ N170Quaternary2011
5Yicheng Village, Zhaoshi Subdistrict112°55′20″ E 26°17′15″ N85Quaternary2011
6Zaotian Village, Taipingxu Township112°46′3″ E 26°12′15″ N400Limestone2013
7Tanhu Village, Changping Township112°74′22″E 26°20′18″ N360Limestone2011
8Shili Village, Renyi Township112°65′23″ E 26°26′8″ N110Quaternary2009
9Jiangli Village,Nanjing Town112°42′38″ E 26°22′4″ N110Limestone2010
10Jiangli Village, Nanjing Town112°42′49″ E 26°22′7″ N110LimestoneOld Forest
11Liming Village, Zheqiao Town112°42′51″ E 26°26′17″ N99Quaternary2009
12Huayuan Village, Yongji Town112°55′20″ E 26°11′38″ N70Sandstone2010
13Maotian Village, Shuidongjiang Subdistrict112°57′14″ E 26°24′24″ N125Quaternary2010
14Banbei Village, Yuqing Township112°44′4″ E 26°20′34″ N90Limestone2010
15Zifeng Village, Dashi Town112°14′40″ E 26°52′47″ N105Quaternary2009
16Tianhua Company, Zheqiao Town112°47′34″ E 26°28′00″ N108Quaternary2008
17Zhouxing Village, Xinshi Town112°5′13″ E 26°57′35″ N81QuaternaryOld Forest
18Jinzao Village, Donghu Town113°4′56″ E 26°27′26″ N240Plate shaleOld Forest
19Oil-Tea Camellia Cutting Orchard, Mashui Town113°1′26″ E 26°27′26″ N83QuaternarOld Forest
20Dongnan Village, Mashui Town112°58′57″ E 26°39′33″ N110Quaternar2012
Table 2. Nutrient characteristics of studied soils.
SamplepHWC
(%)
CEC (Cmol/kg)Ex. Ca2+ (Cmol/kg)Ex. Mg2+
(Cmol/kg)
Es
(mg/kg)
OM (g/kg)TN
(g/kg)
TP
(g/kg)
TK
(g/kg)
AN
(mg/kg)
AP (mg/kg)AK
(mg/kg)
Fe
(mg/kg)
Mn
(mg/kg)
Cu
(mg/kg)
Zn
(mg/kg)
14.6013.9711.900.680.2128.3024.101.740.3315.5079.001.5044.0052.752.480.340.88
24.4918.0313.400.480.2342.8032.801.730.4323.30114.000.9048.0025.664.860.281.13
34.4022.5314.200.510.23144.807.000.570.3820.7031.000.6043.001.300.120.020.18
44.2220.5814.600.490.2050.3015.801.380.249.9052.000.9037.0010.951.310.200.50
54.3813.6112.700.540.2488.5013.601.070.2712.7066.000.8071.0010.973.940.171.27
65.3414.779.603.420.635.6017.001.070.4211.5072.003.5043.0031.2245.850.901.62
74.7823.9516.201.700.3979.5026.201.400.3212.3083.001.5047.0011.633.410.221.11
84.2619.3919.800.630.1928.8017.001.390.2920.5052.001.0035.0013.500.150.170.97
94.5020.7611.900.880.20102.6010.200.910.2614.6040.000.7042.003.875.320.070.67
104.7419.0216.201.740.3262.1020.701.330.3219.5096.000.7078.0016.2016.210.521.94
114.3016.2314.900.490.1975.7025.501.370.1911.2080.001.1036.0015.307.530.410.87
124.5013.854.800.470.1825.209.000.680.1810.6045.001.1032.0016.806.330.200.45
134.4616.4713.600.720.23108.2013.600.990.679.2067.009.6085.006.212.920.100.33
144.4716.0910.100.670.2035.9019.801.390.3417.1088.0012.9048.0045.046.440.791.29
154.5718.6010.800.580.20109.203.900.750.6810.4019.000.6023.000.880.240.010.22
164.3721.4910.700.610.2296.6016.501.070.2813.9060.000.7038.005.901.960.170.68
174.4915.3312.200.520.2396.1010.001.130.3817.5047.000.3036.003.457.790.060.49
184.5814.6615.400.670.2346.5028.601.550.339.7088.000.9027.0011.746.720.230.90
194.5719.7715.100.440.1995.808.000.720.2510.4037.000.3024.001.620.130.020.13
204.4319.6911.200.510.17113.45.700.560.408.0028.000.3018.001.330.100.020.15
Average4.5217.9412.970.840.2471.8016.251.140.3513.9357.062.0042.7514.326.190.250.79
CV/%5.2817.2624.3184.6642.5652.0150.2431.8637.8232.0642.21164.5240.96100.42163.32100.5963.96
Abbreviation: WC: Water content; CEC: Cation exchange capacity; Ex.: exchangeable; Es: Effective sulfur; OM: Organic matter; TN: Total nitrogen; TP: Total phosphorous; TK: Total potassium; AN: Alkali nitrogen; AP: Available phosphorus; AK: Available potassium; CV: coefficient of variation.
Table 3. Main parameters of C. oleifera fruits in different studied sites.
SampleFw (g)Hd
(mm)
Vd
(mm)
Pt
(mm)
Ptm
(mm)
Fst
(mm)
Nv
(F)
Se
(F)
Fse
(%)
Dse
(%)
Dkr
(%)
Oc
(%)
142.10 a20.64 f35.13 b4.48 d1.81 d2.02 d2.73 a6.40 a44.8151.3835.0548.16
211.45 I,j26.40 e26.60 g6.11 c2.75 c2.70 c2.53 a,b4.07 c39.8152.7850.7542.54
331.05 c37.08 a36.98 a7.63 a,b3.52 a,b3.61 b2.47 a,b4.67 c40.5752.7850.7548.88
424.37 e33.71 b35.70 b7.26 b3.46 a,b3.34 b,c2.53 a,b3.53 d,c43.2651.0454.5339.43
518.44 g30.36 d34.09 c7.12 b2.99 b,c2.94 c2.40 b3.13 c42.9950.8854.3438.64
630.30 c18.60 g19.77 i4.04 d1.86 d2.09 d2.40 b5.36 b43.0150.3864.3438.64
721.87 f32.12 c31.38 d7.57 b3.39 a3.42 b,c3.00 a5.40 b43.3453.0261.4641.86
822.41 f32.96 c36.77 a8.41 a3.99 a4.03 a2.00 c3.00 c38.0460.2864.5444.19
922.76 f33.03 b,c33.40 c6.82 b,c3.35 a,b3.28 b,c1.80 c2.53 d41.7452.6360.7442.13
1015.77 h29.67 d29.39 e7.97 a,b3.28 b3.79 a,b2.07 b,c2.67 c,d38.2553.4855.7543.13
1130.43 c29.51 d29.66 e7.70 a,b3.69 a3.67 b2.80 a4.07 c39.9853.1060.2846.04
1235.47 b19.51 f20.32 h4.37 d1.96 d2.27 d2.87 a5.00 b,c42.5852.1059.6147.11
1328.37 d34.95 b35.00 b,c6.99 b3.74 a3.59 b2.40 b3.27 d,c42.1949.1454.7638.32
1429.13 c,d36.22 a36.13 a,b6.82 b,c3.85 a3.86 a,b2.60 a,b3.73 d44.5350.2055.2540.57
1523.93 e,f16.96 h18.41 i4.19 d1.68 d2.14 d2.67 a,b4.07 c41.9251.5654.8838.87
1623.09 e,f31.97 c,d33.59 c6.51 c3.21 b3.49 b,c2.13 b,c2.73 c,d43.0554.3953.5242.77
1710.69 j25.06 e27.73 f6.47 c2.94 b,c3.42 b,c1.87 c2.53 d37.4355.8361.4340.81
1812.32 i26.75 e27.94 f6.16 c2.81 b,c2.79 c2.07 b,c2.93 c,d43.0255.6060.4941.00
1919.02 g31.10 c,d34.10 c8.20 a3.87 a3.98 a,b2.00 c2.40 d37.0151.7061.2139.10
2023.95 e,f33.38 b,c35.30 b6.71 c3.16 b3.03 c2.20 b,c3.40 d,c48.2648.6158.6936.98
Average23.8529.0030.876.583.073.172.373.7441.7952.5456.6241.96
CV (%)33.8620.8118.8420.3923.6020.3815.0030.066.664.9911.548.21
Abbreviation: Fw: Fruit weight; Hd: Horizontal diameter; Vd: Vertical diameter; Pt: Peel thickness; Ptm: middle peel thickness; Fst: Fruit skin thickness; Nv/F: ventricles per fruit; Se/F: Seeds per fruit; Fse: Fresh seed rate; Dse: dry seed rate; Dkr: dry kernel rate; Oc: oil content; CV: coefficient of variation. Different superscript letters mean significant difference among samples at the level of 0.05.
Table 4. Fatty acids composition in the fruit of C. oleifera.
SamplePalmitic
Acid
(C16:0)%
Stearic Acid
(C18:0)%
Palmitoleic
Acid
(C16:1)%
Heptadecenoic
Acid
(C17:1)%
Oleic
Acid
(C18:1)%
Linoleic
Acid
(C18:2)%
Linolenic
Acid
(C18:3)%
Eicosenoic
Acid
(C20:1)%
Tetracosanoic
Acid
(C24:1)%
SFA
(%)
MUFA
(%)
PUFA
(%)
18.302.300.090.0881.706.700.270.540.0710.6082.486.97
28.501.900.080.0780.408.100.330.540.0710.4081.168.43
38.102.600.090.0882.705.600.270.510.0710.7083.455.87
48.902.000.090.0879.708.300.310.520.0710.9080.468.61
58.552.000.100.0880.507.750.310.560.0810.5581.328.06
68.552.000.090.0880.707.600.330.530.0810.5581.487.93
78.402.000.090.0780.907.600.280.500.0710.4081.637.88
88.652.100.100.0780.607.600.290.530.0710.7581.377.89
98.002.400.090.0882.206.300.290.540.0810.4082.996.59
108.602.200.090.0780.307.800.290.540.0610.8081.068.09
118.102.800.090.0882.105.800.260.510.0610.9082.846.06
127.852.900.110.0882.205.900.250.550.0710.7583.016.15
138.002.700.100.0782.205.900.280.530.0510.7082.956.18
148.102.700.100.0982.105.900.270.550.0710.8082.916.17
158.502.200.100.0881.107.000.300.530.0710.7081.887.30
168.152.500.090.0882.206.100.280.530.0710.6582.976.38
179.201.900.130.0880.207.500.340.520.0711.1081.007.84
189.152.100.120.0880.057.600.310.510.0711.2580.837.91
198.052.100.090.0881.557.200.260.540.0710.1582.337.46
208.152.000.100.0881.407.200.300.560.0810.1582.227.50
Average8.392.270.100.0881.246.970.290.530.0710.6682.027.26
CV (%)4.5514.1612.116.711.1112.438.633.1510.362.611.1012.18
Abbreviation: SFA: saturated fatty acids; MUFA: monounsaturated fatty acids; PUFA: polyunsaturated fatty acids; CV: coefficient of variation.
Table 5. Active compounds in camellia seed oil.
SampleSterols
(mg/100 g)
Squalene
(mg/kg)
Tocopherols
(mg/kg)
Polyphenols
(mg/kg)
1163.50162.50220.0013.62
2173.00146.00277.0013.94
3197.50142.50224.0013.33
4192.50168.00237.0017.77
5216.50170.50250.0016.41
6200.00272.00264.0016.12
7185.00152.50234.0016.92
8202.00158.50225.0027.02
9225.00138.00214.0014.15
10211.50123.00256.0013.63
11167.00177.00198.0018.80
12160.50182.50205.0016.47
13176.50139.50214.0018.37
14199.50131.00231.0018.04
15194.00158.00229.0016.94
16151.50145.00217.0017.50
17194.50149.00292.0021.02
18170.00157.50258.0019.52
19170.50137.50228.0011.23
20174.50166.50252.0012.36
Average186.25158.85236.2516.66
CV (%)10.7719.4210.3421.23
Abbreviation: CV: coefficient of variation.
Disclaimer/Publisher’s Note: The statements, opinions and data contained in all publications are solely those of the individual author(s) and contributor(s) and not of MDPI and/or the editor(s). MDPI and/or the editor(s) disclaim responsibility for any injury to people or property resulting from any ideas, methods, instructions or products referred to in the content.

