Article

Ecological Restoration in the Loess Plateau, China Necessitates Targeted Management Strategy: Evidence from the Beiluo River Basin

1
School of Land Science and Technology, China University of Geosciences (Beijing), Beijing 100083, China
2
Key Laboratory of Land Consolidation and Rehabilitation, Ministry of Natural Resources, Beijing 100035, China
*
Author to whom correspondence should be addressed.
Forests 2023, 14(9), 1753; https://doi.org/10.3390/f14091753
Submission received: 16 July 2023 / Revised: 26 August 2023 / Accepted: 27 August 2023 / Published: 30 August 2023
(This article belongs to the Special Issue Forest Ecological Management and Sustainable Development)

Abstract

:
Vegetation on the Loess Plateau, China, has continuously improved thanks to certain ecological restoration (ER) strategies, including the integrated soil conservation project that began in the late 1970s and the “Grain for Green” project that began in the 1990s. The experience of these strategies in different geomorphological regions is of great value to ER worldwide. In this study, the evolution of the land-use transition (LUT) pathway and ecosystem service value (ESV) in four geomorphological regions of the Beiluo River Basin was analyzed using geo-informatic Tupu and the equivalent factor method with data from 1975 to 2015. The results indicated that, from 1975 to 2015, the proportion of forestland in the Beiluo River basin increased by 18.27%, while the areas of shrub, grassland, cultivated land, and water decreased by 1.03%, 0.16%, 18.23%, and 0.26%, respectively. In the past 40 years, the overall ESV of the basin increased by USD 3.209 billion (54.16%). The landform, vegetation cover, LUT, and ESV analysis indicated that the main ecological functions of the loess hilly and gully (LHG), loess plateau gully (LPG), rocky mountain (RM), and terrace and plain (TP) regions are soil and water conservation (SWC), SWC and food production, regulation and food production, respectively. ER projects enhanced the main ecological function of individual regions. In detail, the transition of “cultivated land → grassland” enhanced SWC function in the LHG region, and the transition of “grassland (shrub) → forestland” enhanced the regulating services of the RM and LPG regions. Moreover, the transition of “cultivated land to grassland” did not seriously lower the food production services of the TP and LPG regions, owing to the increase in grain yield per unit area. However, there were alternating transitions between cultivated land and ecological land types, implying a game between the peasant households’ demands and the ER strategies. Conflicting demands between local households and the public necessitate precision ER strategies, including land planning, ecological compensation, training and employment for local residents, etc.

1. Introduction

In order to cope with climate change and control the deteriorating ecological environment, ecological restoration (ER) projects have been carried out on a global scale [1,2]. In 2010, the Strategic Plan for Biodiversity 2011–2020 was signed at the Conference of the Parties to the Convention on Biological Diversity. In 2012, under the auspices of the United Nations Environment Programme, the Intergovernmental Platform on Biodiversity and Ecosystem Services (ESs) was approved by the United Nations (http://www.ipbes.net (accessed on 10 July 2023)). The United Nations has put forward a series of actions, such as the Decade of Sustainable Development, the Decade of Ecological Restoration, and the Decade of Marine Science for Sustainable Development, to promote the restoration of global ecosystems [3,4]. The implementation of ER projects guarantees the restoration of ESs [5,6]. It is important to study the impact of ER, especially the existing problems, for environmental management [7]. In the context of global ER, countries around the world generally believe that the future will be a key period to improving human well-being and promoting sustainable development through ER, and the study of ER is a hot topic at present [1].
For ER, at the regional scale, there is the influence of topography and landform. Different topographies and landforms determine the main use modes of regional land and determine its main ecological function [7,8]. For example, agricultural land is well-distributed in flat terrain, which enhances ecosystem food production services. Meanwhile, slopes above 25 degrees are more suitable for planting trees than for farming, which can enhance ecosystem water and soil conservation services [9]. Land-use types can produce trade-offs or synergies between different ESs [10]. Jia et al. studied the relationship between “one increase and one decrease” and “co-increase and co-decrease” among ESs in the loess hilly region, and found that afforestation enhanced the “one increase and one decrease” interaction between regulating services and supplying services, and the increase in shrubs improved the soil and water conservation services of the ecosystem [11]. Therefore, it is necessary to study the impact of regional ER in detail according to geomorphic zoning. It is of great significance to find the problems in ER in order to guide and adjust the employed strategies.
The Loess Plateau, located in Northwest China, is one of the areas most seriously affected by soil and water erosion in the world [12]. The poor condition of the ecological environment in the area significantly restricts the social and economic development of the region [13]. In order to improve this situation, China has long governed the environment of the Loess Plateau. From 1950 to 1970, the environmental governance measures of the Loess Plateau included afforestation, the terracing of farmlands on slopes, and building sediment-trapping dams. From 1970 to the late 1990s, the government mainly carried out the comprehensive management of small watersheds and the construction of Three-North shelterbelts. After 2000, environmental governance focused on the projects of “Grain for Green” [14,15]. After years of environmental restoration, the overall vegetation cover area has increased, the sediment entering the Yellow River has reduced, and the land-use structure has also changed dramatically [13,16,17,18,19]. However, owing to the interaction between the ecological environment and the socio-economic relationship, the sustainability of ER can be affected by managers, land-lost farmers, and other stakeholders. It is thus of great significance to study the relationship between LUTs and ESV, find out the deficiencies of ER, and sum up the experience for system governance and precise policy formulation.
The Beiluo River Basin contains four typical landforms of the Loess Plateau, and is one of the key regions in the control of soil and water erosion and “Grain for Green”. The four geomorphic regions are the loess hilly and gully (LHG) region, with the most severe soil erosion; the loess plateau gully (LPG) region; the forested rocky mountain (RM) region; and the terrace plain (TP) region. There have been many studies exploring ER from different perspectives. SUN Zexing et al. evaluated the comprehensive benefits of ER in Shaanxi province [20]. NIU Linan et al. evaluated the extent and potential of ER in the Loess Plateau [21]. XUE Fan et al. studied the evolution of water and sediment characteristics in different landforms and vegetation types in the Beiluo River Basin over the past 70 years [22]. Wang Zhuangzhuang et al. established an evaluation index system of ER benefits for five key fragile ecological zones in China [23]. Finally, Zhao Yonghua et al. explored the changes in the ecosystem service value in Shaanxi Province from 2001 to 2006 and the differences among different regions [24]. These studies provide a reference for the adjustment of ER policies, but few researchers have paid attention to the research on the differentiated effects of LUTs on the main ecosystem service functions in different landforms.
Aiming to address the above problems, this paper takes the Beiluo River Basin as the representative area to study the impact of ER on the Loess Plateau and determine its existing problems, so as to provide a basis for the adjustment of ER strategies. Specifically, this includes (1) using geo-informatic Tupu (GT) to analyze the spatio-temporal characteristics of LUTs, (2) quantifying the spatiotemporal variation in ESV, and (3) analyzing the impact of LUTs on the main services of ecosystems in different landform types and discussing the existing problems.

2. Materials and Methods
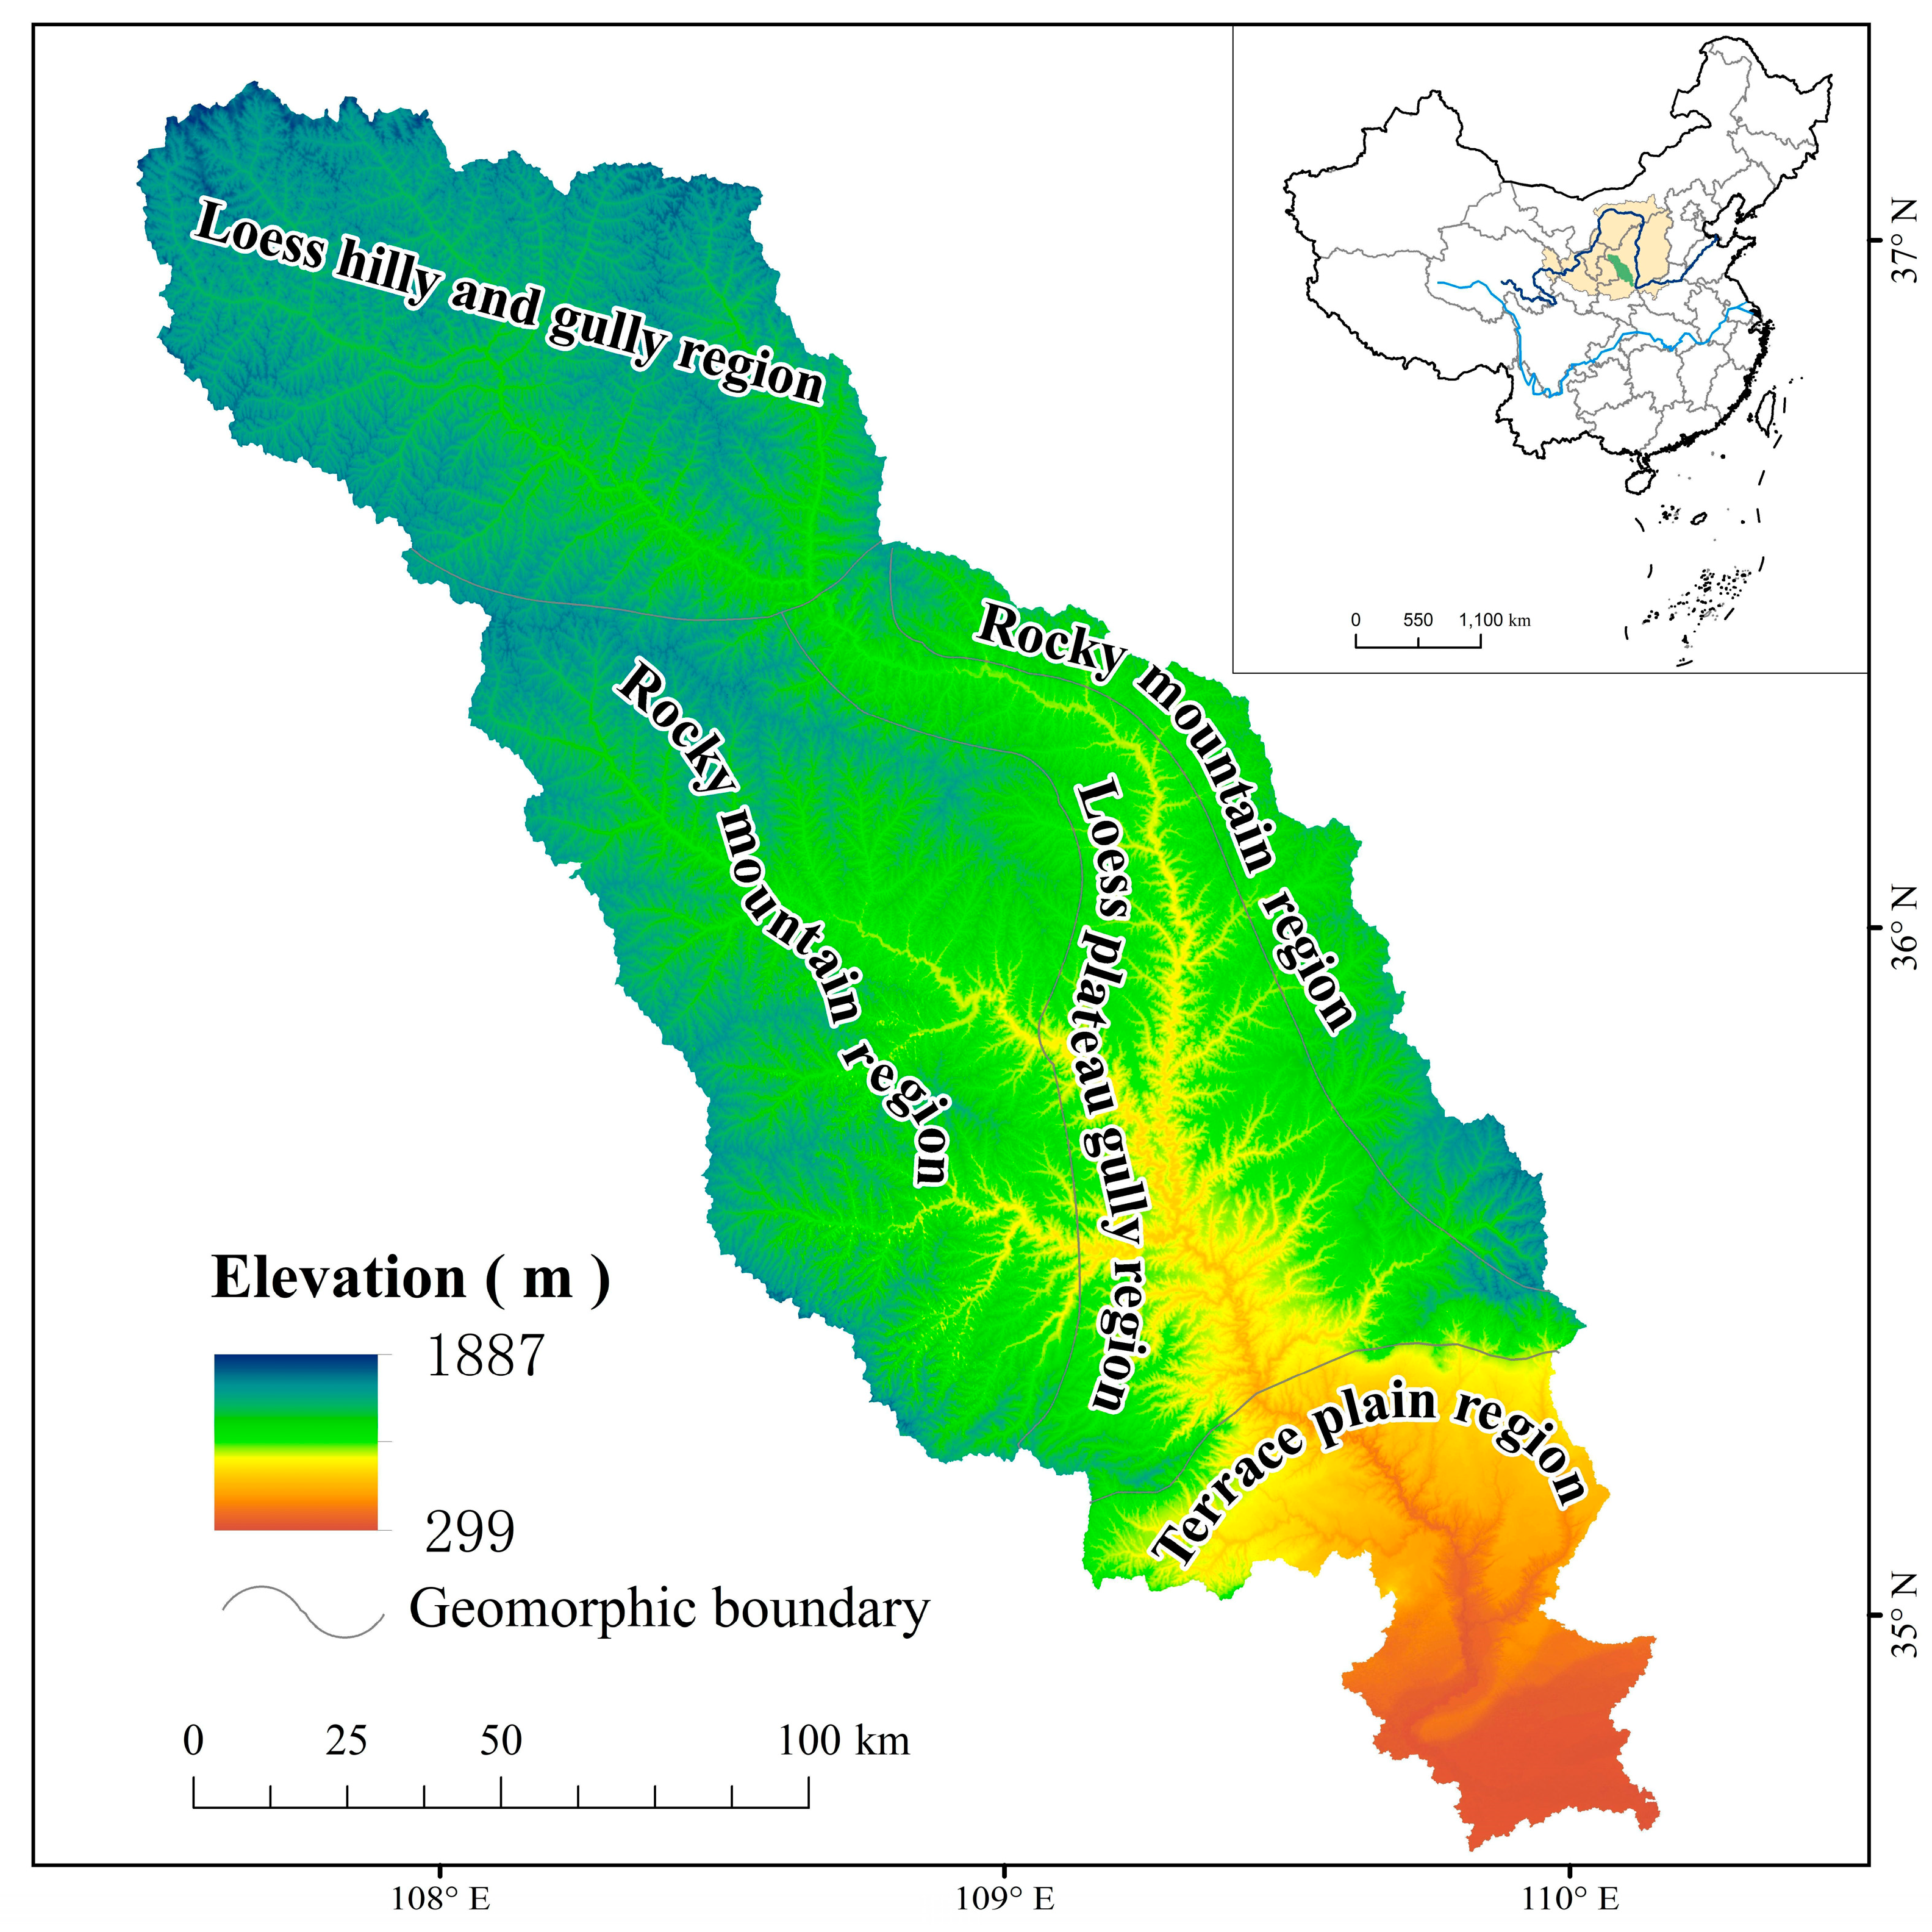
2.1. Study Area

The Beiluo River (34°40′–37°19′ N, 107°35′–110°20′ E) originates in the Baiyu Mountains, Dingbian County, Shaanxi Province (Figure 1) [25]. Its main stream has a total length of 680 km, with an average ratio of 1.52‰ and a watershed area of 26,905 km2. There are four typical landforms of the Loess Plateau in this basin: the loess hilly and gully (LHG) region, the Lloess plateau gully (LPG) region, the rocky mountainous (RM) region, and the terrace plain (TP) region. The LHG region is located in the upper reaches of the Beiluo River Basin and exhibits severe gully erosion. The LPG region is located in the middle reaches with high and flat lands and gullies around these lands. The RM region has high vegetation coverage and a relatively complete natural forest [26]. The TP region is located in the lower reaches of the basin and is its alluvial plain. The largest area, covering 10,542 km2 and accounting for 39.2% of the total watershed area, is the loess hilly forest area, which includes the famous Ziwuling forest region and the Huanglong Mountain forest region. The area of the LHG region is 6755 km2, accounting for 25.1% of the watershed area. It serves as the main sediment-producing area, with a high soil erosion modulus of more than 10,000 t/km·a. The LPG region experiences moderate soil erosion, while the other areas have less pronounced erosion. The Beiluo River Basin has an annual average precipitation (1954–1996) of 514.2 mm, a runoff of 8.652 × 10⁸ m3, and a sediment transport of 8.65 × 10⁷ t [27,28,29]. Over time, the region has undergone ER, with the vegetated area increasing from 41.12% in 1987 to 63.43% in 2007 [25,30]. During this period, there were also significant land-use changes, affecting 56.5% of the entire basin area between 1975 and 2015 [29].

2.2. Data Sources

The Chinese administrative boundaries and typical geomorphology vector data for 1975, 1990, 2000, 2010, and 2015, along with the 30 × 30 m land-use database, were obtained from the RESDC (Resource and Environmental Science Data Center of the Chinese Academy of Sciences, http://www.resdc.cn (accessed on 2 January 2023)) [34,35,36,37]. These datasets were generated using Landsat TM/ETM (thematic mapper/enhanced thematic mapper) remote sensing images from different periods, which were then visually interpreted based on national field surveys. The land-use types were classified as forestland, scrub, grassland, cultivated land, water, construction land, and desert. Furthermore, the data for the national net primary productivity (NPP) of vegetation in 1975, 1990, 2000, 2010, and 2015 were derived from the Global Change Research Data Publishing and Repository [38,39].

2.3. Methodology

2.3.1. Geo-Informatic Tupu Method

This paper uses the geo-informatic Tupu (GT) method to establish a mathematical model. GT is a method for geographical spatiotemporal analysis that can project multi-dimensional spatial information onto two-dimensional maps. By doing so, it greatly reduces the complexity of model simulation. In addition, Tupu helps the model builder to understand the spatial information and its processes [40,41]. We used ArcGIS (10.8.1, Esri, Redlands, CA, USA) software to assign codes 1, 2, 3, 4, 5, 6, and 7 to seven land-use types, namely, forestland, shrub, grassland, cultivated land, construction land, water areas, and desert, respectively. The raster calculator was employed to generate the raster land-use data with a 30 m resolution over five periods. Based on this, a series of GT patterns were constructed.
GT can assign a color to each land-use unit on the map, enabling a more intuitive observation of its distribution. Similarly, the Tupu unit of land-use change can be assigned a color, facilitating the analysis of the spatial characteristics of LUTs. To integrate the value and spatial information of LUTs into the Tupu coding, two adjacent Tupu units can be selected for algebraic superposition. By screening the results and selecting the Tupu related to the LUTs of cultivated land, forest, and grassland, the Tupu can be created. The specific calculation formula is as follows [42]:
T = A × 10 + B
where T is the Tupu code of LUTs in a given period, B is the code of the land-use unit at the beginning of the study, and A is the code of the land-use unit at the end of the study.
This study focuses on land-use change in the five periods of 1975, 1990, 2000, 2010, and 2015. The Tupu pattern of LUTs can be divided into five types: the prophase transition type, the middle transition type, the anaphase transition type, the repeated transition type, and the continuous transition type. The operation equation of the land-use unit code in each period is as follows:
T = 10000 × Q + 1000 × W + 100 × E + 10 × R + D
where T is the land-use change Tupu code in 1975, 1990, 2000, 2010, and 2015; Q is the land-use unit code in 1975; W is the land-use unit code in 1990; E is the land-use unit code in 2000; R is the land-use unit code in 2010; and D is the land-use unit code in 2015 (Table 1).

2.3.2. Statistics of the Changing Characteristics of Tupu

The land-use change Tupu was analyzed using spatial statistics, and the degree of spatial separation and LUT rate were calculated. The formulae for calculating the rate of change and the degree of spatial separation are as follows:
A i j = N i j i = 1 n j = 1 n N i j × 100 % ( i j )
S i j = 1 2 × F i j / i = 1 n j = 1 n N i j N i j / i = 1 n j = 1 n N i j ( i j )
where Aij is the rate of change, which indicates the ratio of the area of a certain LUTs to the total area of LUTs in the study area over a period of time. Sij is the degree of spatial separation, which reflects the degree of spatial dispersion of land-use Tupu units. The greater the absolute value, the greater the degree of dispersion of Tupu units. Fij and Nij indicate the number and area, respectively, of Tupu units in which the land-use type is transformed from land-use type i at the initial time t into j at the end (t + Δt), and n is the number of land-use types.

2.3.3. ESV Calculation

The concept of ESs was first proposed by King in 1966 [43]. Using an economics-based method to calculate the ESV can help human beings to realize the development, utilization, protection, and restoration of ecosystems more scientifically, and finally allow us to achieve the goal of sustainable development. The most common methods used to calculate the ESV are the energy evaluation method and the benefit transfer method [16]. However, regardless of which method is used, the subjective differences in the selection of parameters lead to differences in the calculation results. At present, there is no one standard recognized method for calculating the ESV [44,45]. Based on Burkhard et al.’s study on ESs in 2010 [46], this study classifies ESs into four types: supplying services, regulating services, supporting services, and cultural services. These four services are subdivided into nine services according to the specific conditions of the Chinese ecosystem, as shown in Table 2.
In this paper, the ESV of the Beiluo River Basin was calculated using the average vegetation net primary productivity (NPP) of each land-use ecosystem in China and the NPP of the Beiluo River Basin to modify the ecosystem value equivalent per unit area of ecosystems in China (Table 2), as proposed by Xie Gaodi (Formula (5)) [47]. This method sets the equivalent of food production service value of cultivated land ecosystem to 1.0, and the equivalent of various service values of other land-use ecosystems is derived from this. The ESV of construction land is set to 0. Because NPP cannot accurately reflect the biomass of water areas, this paper takes the average value equivalent of the national river and lake ecosystems proposed by Xie Gaodi as the value of the water area in the study area.
η i = N P P b i N P P c i
where ηi is the correction coefficient of the land-use type i, NPPci is the average net primary productivity of vegetation of the land-use type i in China, and NPPbi is the net primary productivity of vegetation of the land-use type i in the Beiluo River Basin.
The ESV of food production in the cultivated land ecosystem per unit area is a standard equivalent factor, and the ESV is equivalent to 1/7 of the average grain yield market value in the study area. The calculation method is as follows:
E c = 1 7 i n s i × p i × q i S
where Ec represents the value of the food production service function per unit of cultivated land ecosystem (USD/hm2), i is the crop type (the main food crops in the Beiluo River Basin are wheat, corn, millet, potatoes, and vegetables), Si is the area of food crop i (hm2), Pi is the average price of food crop i (USD/hm2), and qi is the per-unit yield of food crop i (t). S is the total area of food crops (hm2).
As the market grain price is significantly affected by monetary value, we used the average grain price and grain output of Yan’an, Tongchuan, Yulin, Weinan, and Qingyang in 2015. According to data from the Municipal Bureau of Statistics, the average grain price in the Beiluo River Basin for 2015 was CNY 2.31/kg and the average grain output was CNY 3.11 (t/hm2), which was substituted into Formula 5. From the average U.S. dollar exchange rate in the interbank foreign exchange market of CNY 1 to USD 0.1541 on 31 December 2015, the equivalent factor of the ESV in the Beiluo River Basin was calculated to be 158.71 USD/hm2.
The ESV of the Beiluo River basin was calculated according to the area of various land-use types and the value of the unit equivalent factor in the study area. The specific formula is as follows:
V C i j = E c × C i j × η i
E S V = i n j n A i × V C i j
where VCij is the unit ESV of service type j of the land-use type i, in USD/hm2, and Cij is the equivalent value of the ecosystem service type j of the land-use type i proposed by Xie Gaodi. Ai is the area of the land-use type i in the study area.
Table 2. The equivalent of various services in various land-use ecosystems (Xie et al., 2003, 2015 [45,48]).
First-Level Service Second-Level Service1 Forestland2 Shrub3 Grassland4 Cultivated Land5 Desert6 Water Area
Supplying services (SuyS)Food production0.330.200.431.00.020.445
Raw material2.981.800.360.390.040.295
Regulating services (RegS)Gas regulation4.322.591.50.720.061.46
Climate regulation4.072.451.560.970.137.805
Hydrological regulation4.093.901.520.770.0716.105
Waste treatment1.721.111.321.390.2614.625
Supporting services (SutS)Soil formation and retention4.022.422.241.470.171.20
Biodiversity protection4.512.721.871.020.403.56
Cultural services (CulS)Recreation and culture2.083.440.870.170.244.565
Total 28.1220.6411.677.901.3950.06

2.3.4. Hot Spot and Spatial Auto Correlation Analysis of ESV Change

Moran’s I is a kind of index that can be used to test the autocorrelation of spatial data [49]. In this paper, GeoDa (1.20, Dr. Luc Anselin et al.) software was used to analyze the spatial autocorrelation of ESV changes in four geomorphic types in the Beiluo River Basin from 1975 to 2015 under the background of ER through the local Moran’s I. The range of Moran’s I is [–1, 1]. When it is greater than 0, it means that the region is a spatial aggregation of similar attributes; that is, the high (low) value of the region is also surrounded by high (low) values. When it is less than 0, it means that the region is a spatial aggregation of non-similar attributes; that is, the high (low) value of the region is surrounded by a low (high) value. When it is equal to 0, it means that there is no spatial association between the region and the neighborhood. A LISA (local indicators of spatial association) cluster map and z LISA significance map are drawn to determine whether the local correlation types of each region and their clustering regions are statistically significant.

3. Results

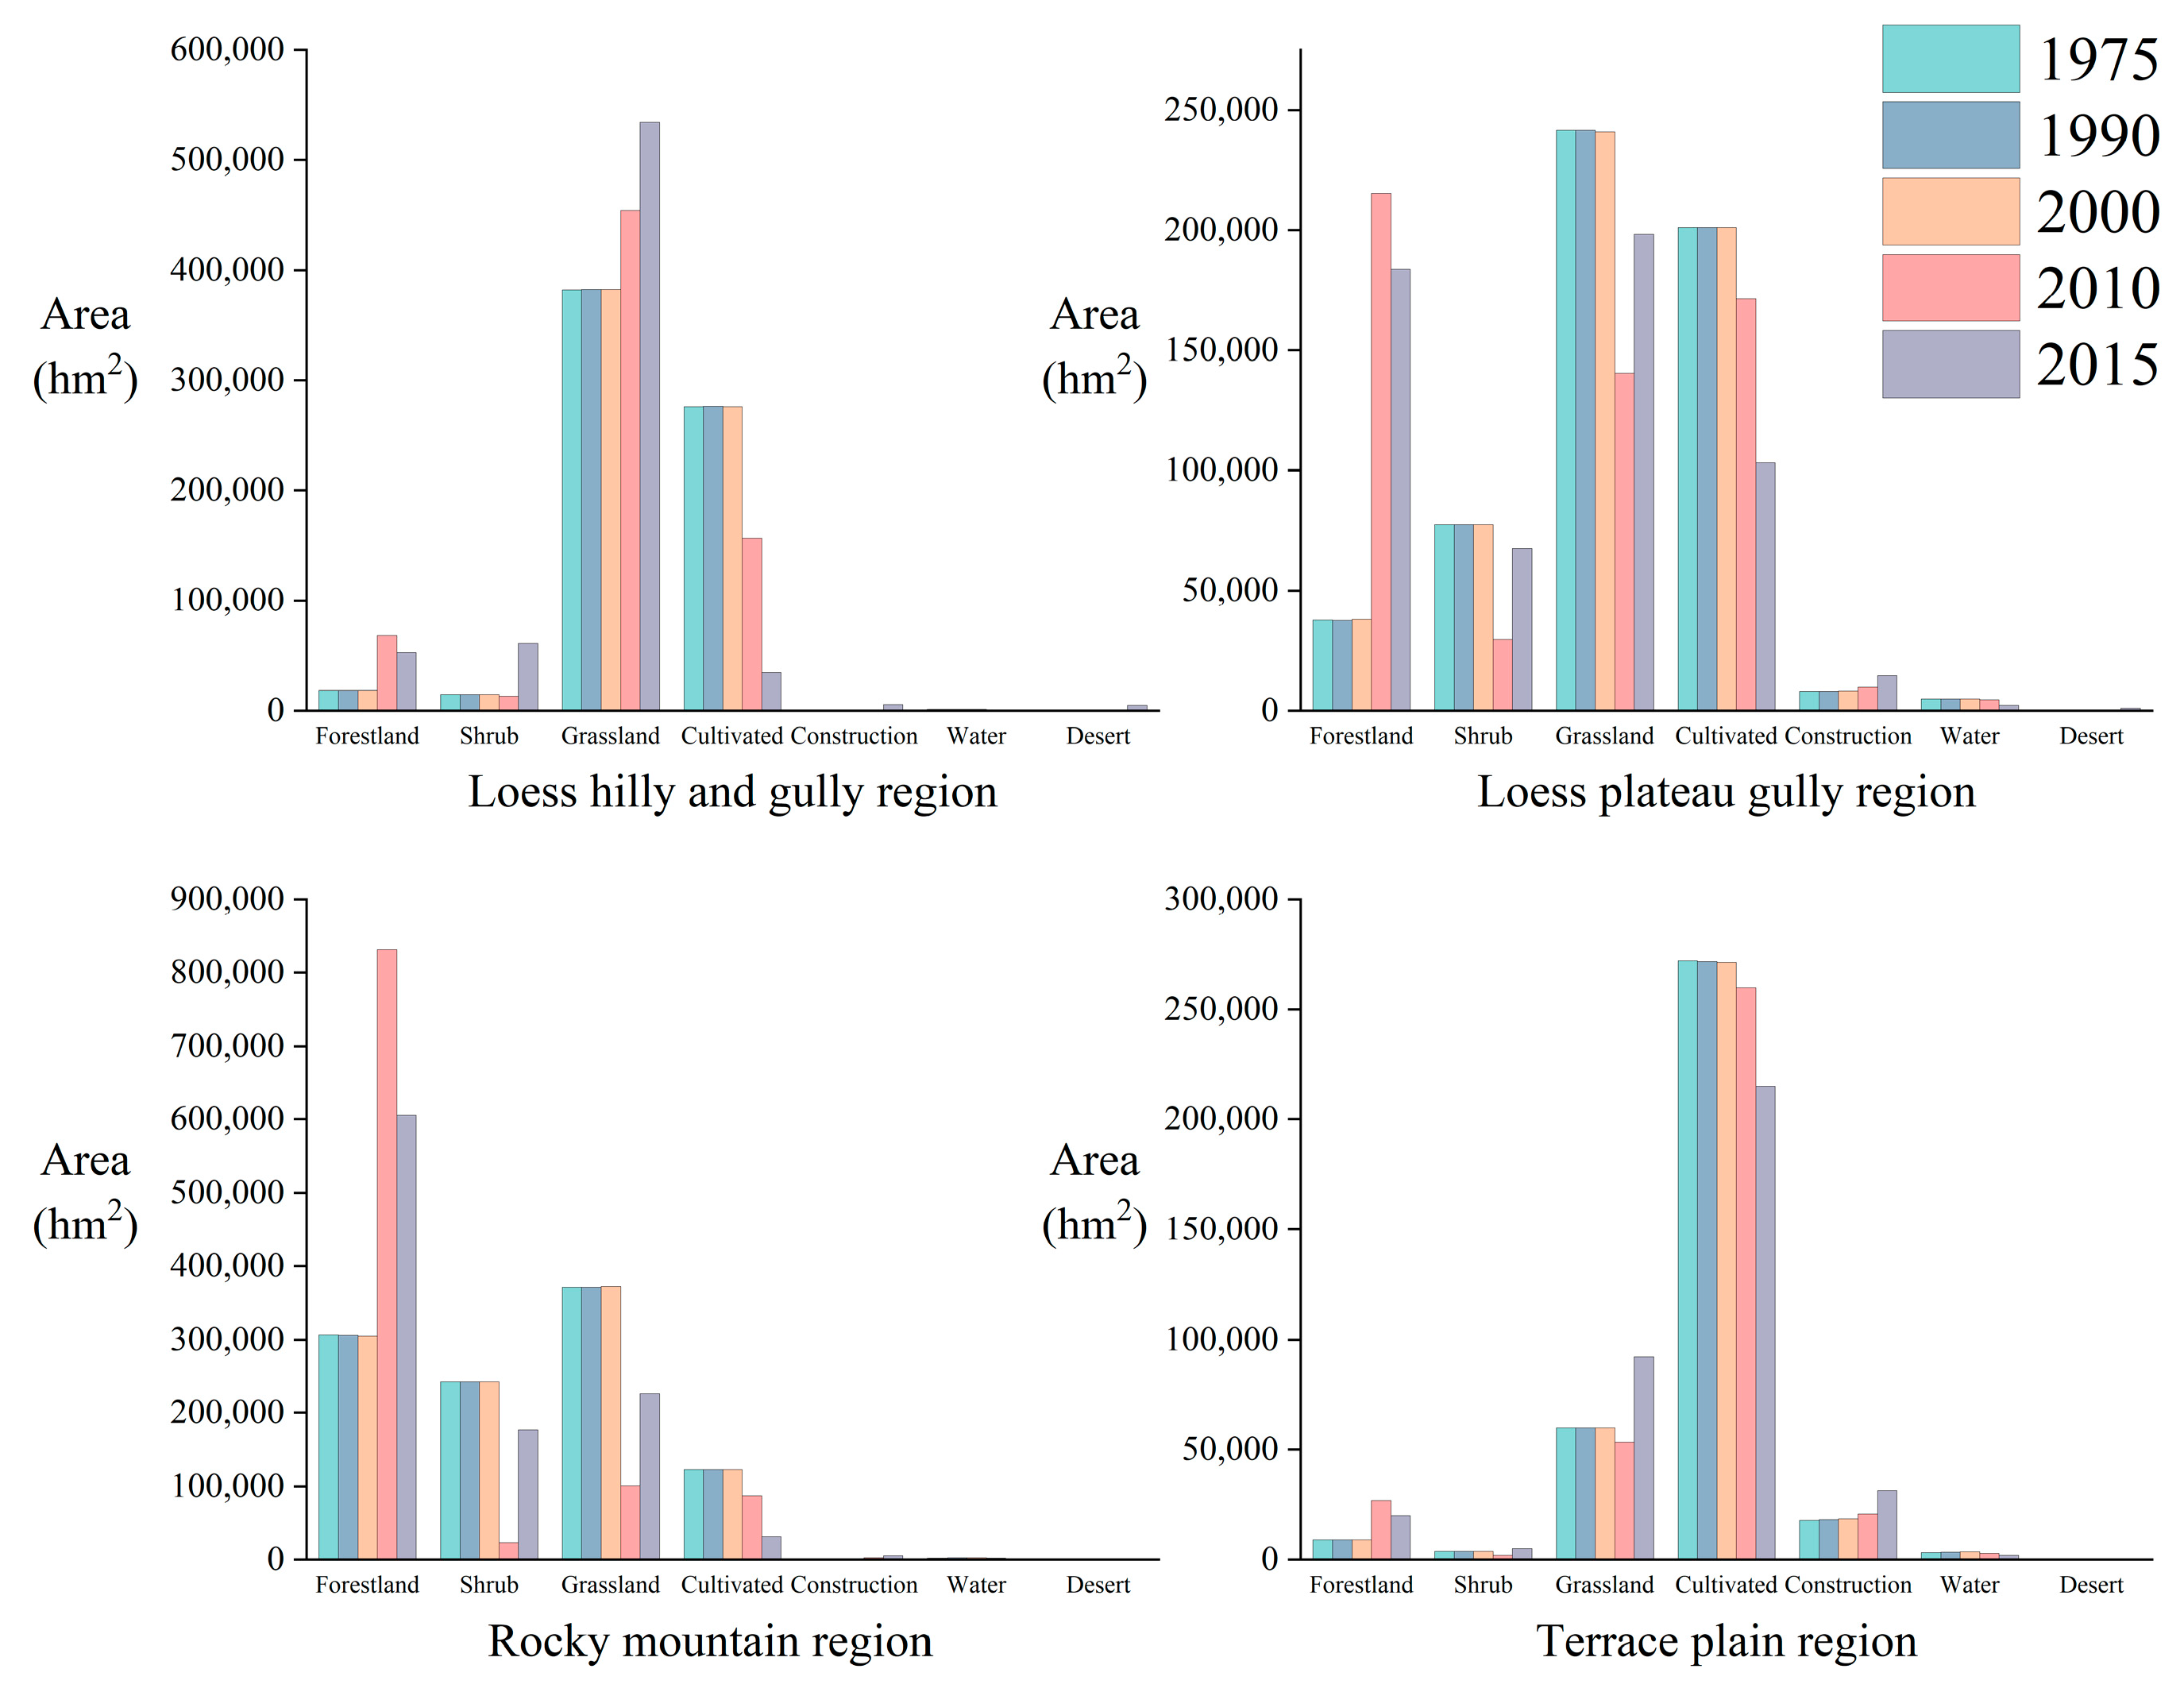
3.1. Spatial and Temporal Evolution of Land-Use Types from 1975 to 2015

From 1975 to 2015, the area of forest land, construction land, and desert in the Beiluo River Basin increased by 18.27%, 1.09%, and 0.32%, respectively, while the area of shrubland, grassland, cultivated land, and water areas decreased by 1.03%, 0.16%, 18.23%, and 0.26%, respectively. The main LUTs in different landform areas exhibit obvious differences. The area of different land-use types in each region is shown in Figure 2.
Grassland in the LHG region accounted for more than 50% at all five time points, reaching 76.96% in 2015, constituting the main land-use type in the region. From 2000 to 2010, the area of forestland increased by 7.31%, whereas cultivated land decreased by 17.27%. Furthermore, from 2010 to 2015, cultivated land experienced a further decrease of 17.52%, while scrub increased by 6.82%.
Before 2000, the main land-use types in the LPG region were forestland and cultivated land. However, there have been significant changes in land-use types since then. From 2000 to 2010, the area of forestland increased by 31.03%. This trend shifted again from 2010 to 2015, with forestland decreasing by 5.52%. During the same period, scrub and grassland saw increases of 6.69% and 10.12%, respectively, while cultivated land experienced a decrease of 11.95%.
Before 2000, the total area of forestland, scrub, and grassland accounted for about 85% of the total area in the RM region. However, by 2010, there had been an increase in the proportion of forestland to 79.29%, while scrub and grassland decreased to 2.26% and 9.63%, respectively. By 2015, there had been a decrease in forestland to 57.74%, while scrub and grassland increased to 16.9% and 21.6%, respectively. The area of cultivated land in this region is relatively small, and continued to decrease after 2000.
The TP region primarily consists of cultivated land, which accounted for more than 70% of land use between 1975 and 2010. However, in 2015, this proportion decreased to 58.59%. In contrast, the areas of forestland, grassland, and construction land all increased to some degree after 2000.
During the four periods after 1975, LUCC occurred in 0.07%, 2.47%, 36.46%, and 33.05% of the area of the whole basin, respectively. In short, there was no large-scale land-use change in the four geomorphological areas before 2000, but drastic changes occurred after 2000.

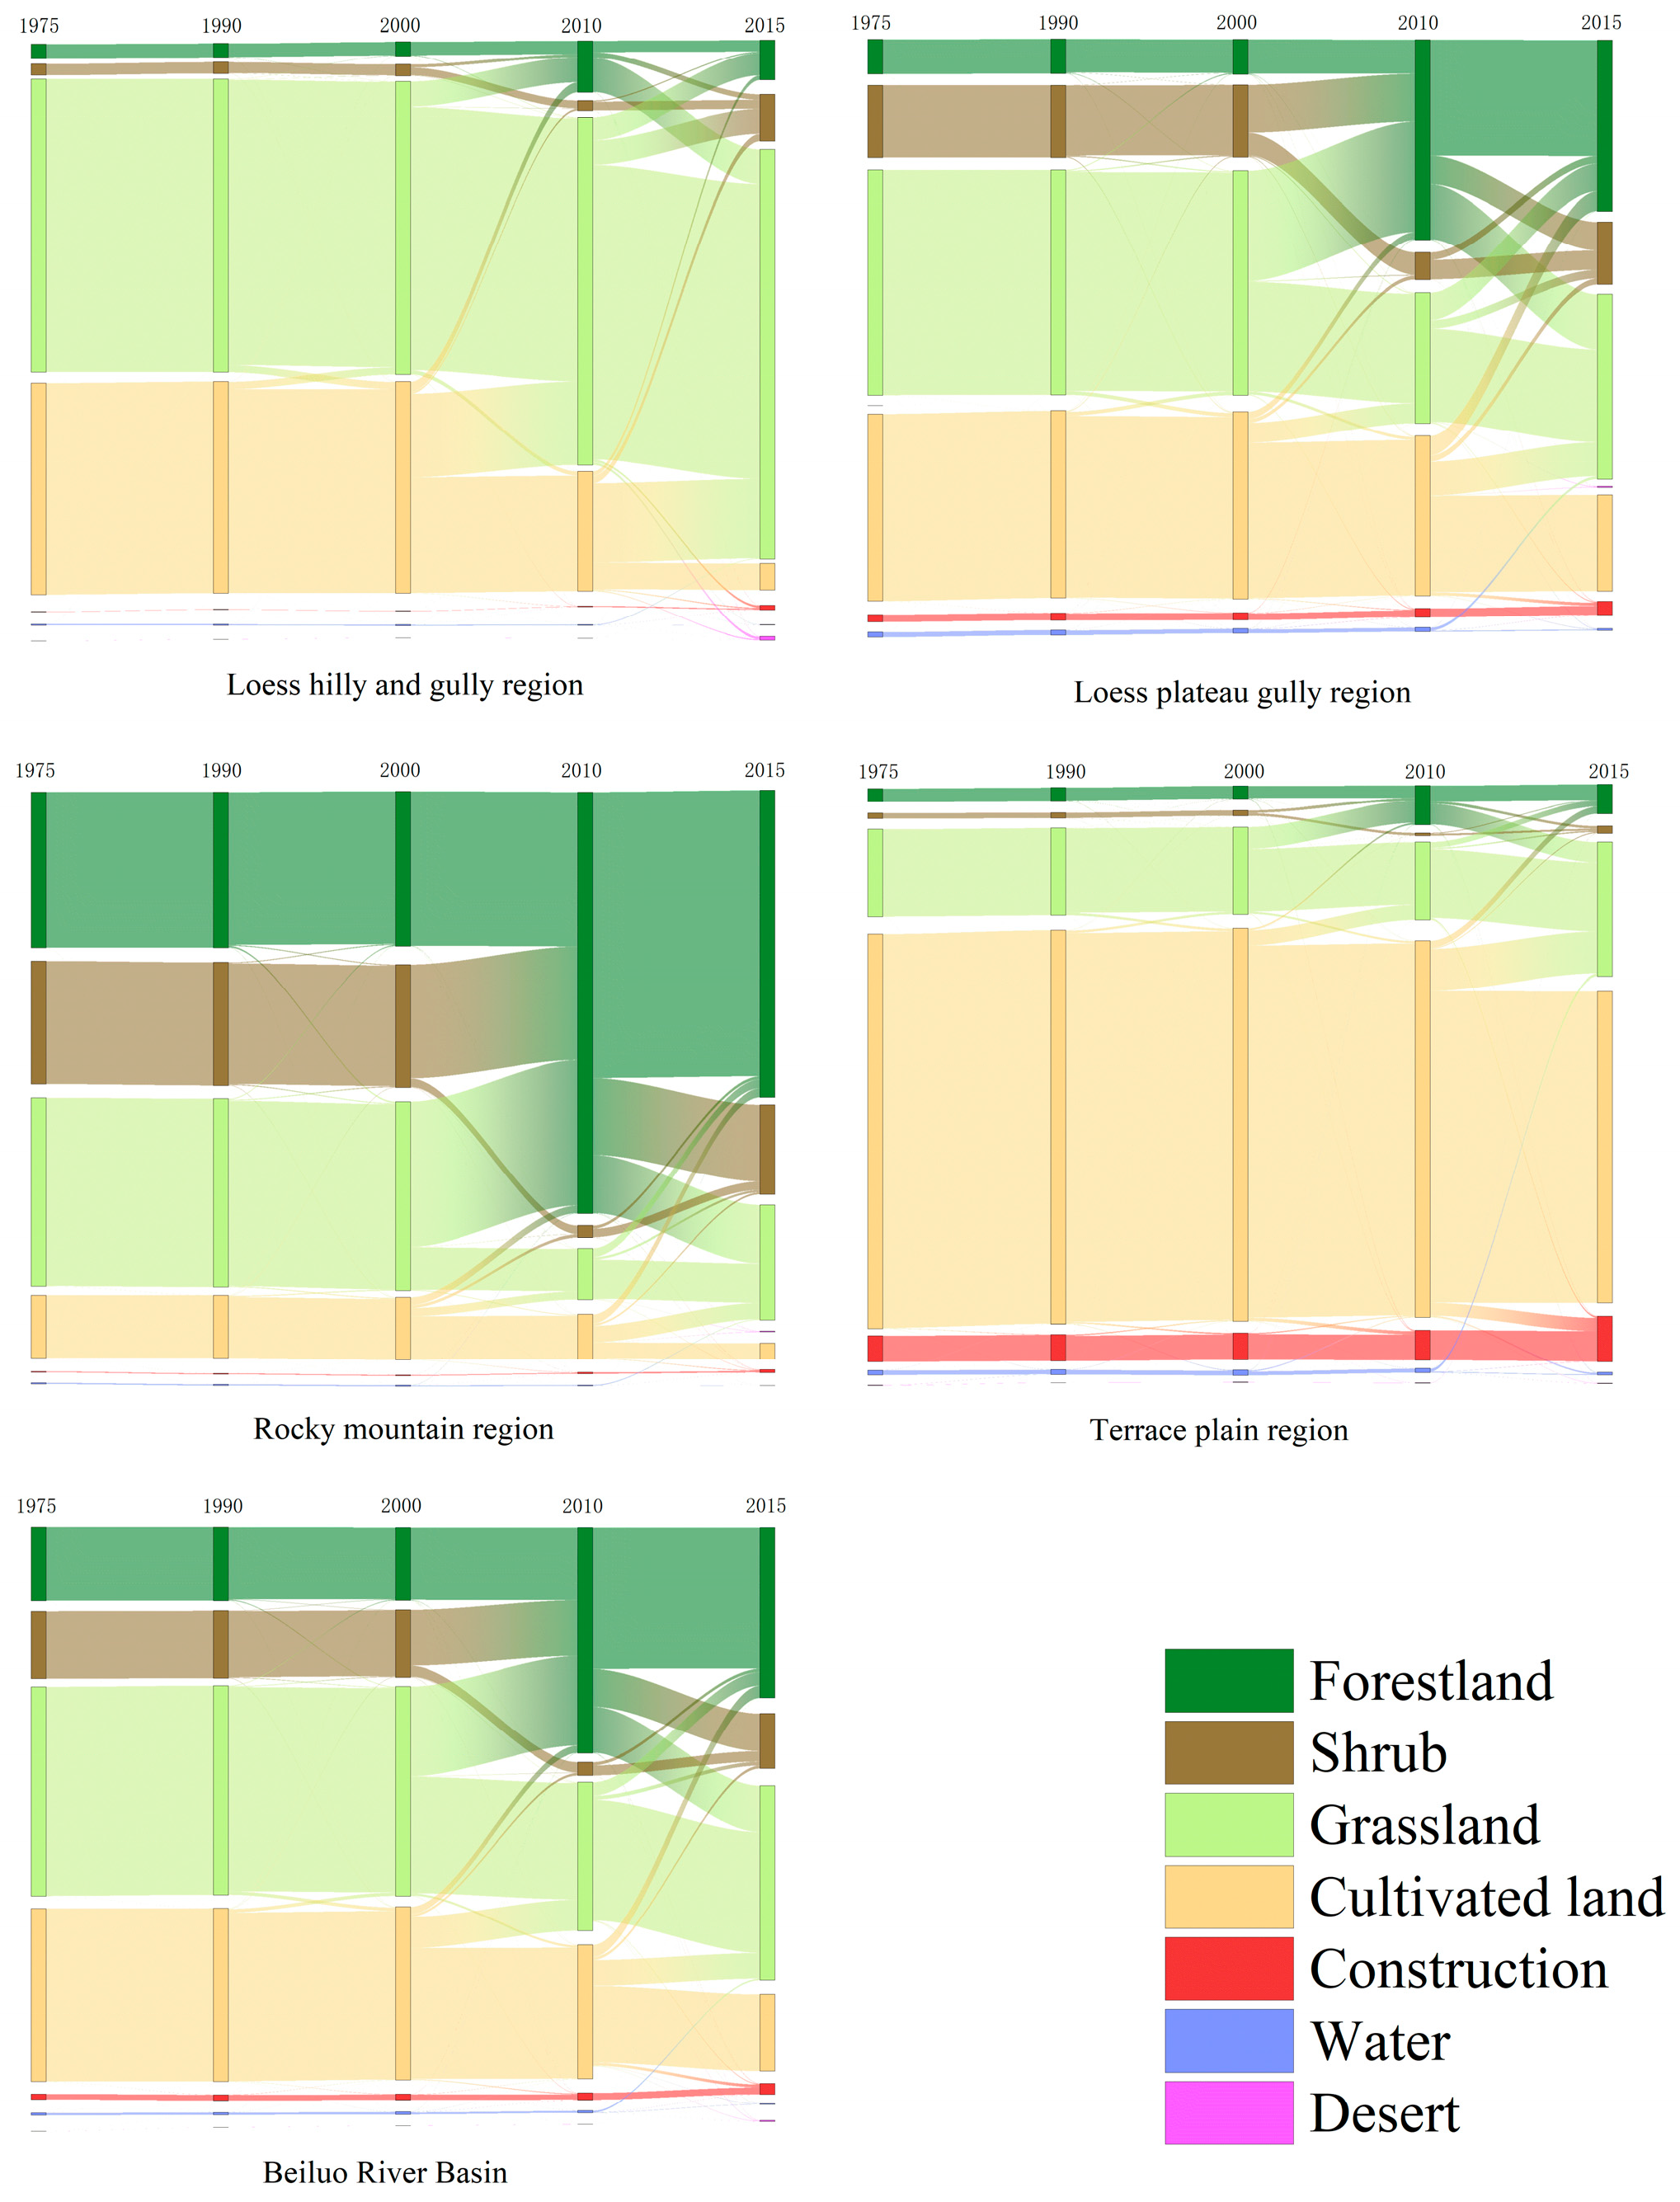
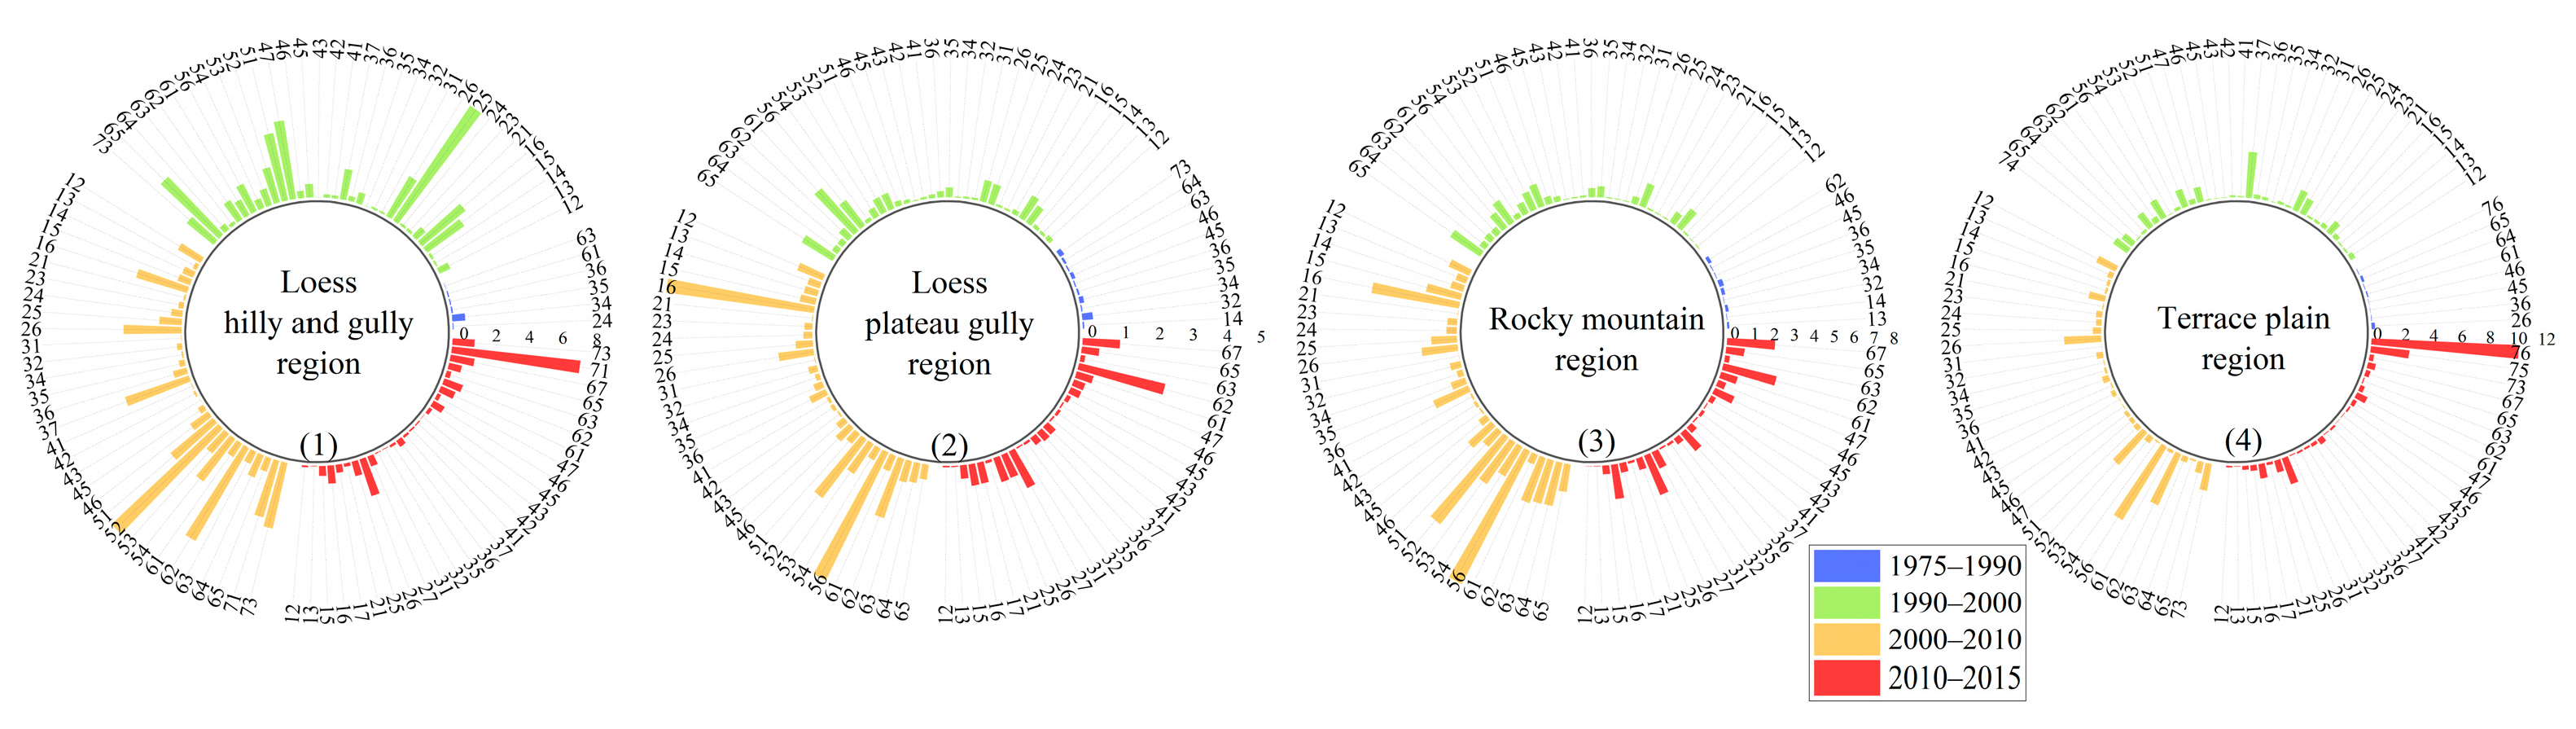
3.2. Analysis of Land-Use Change Tupu Process between 1975 and 2015

The most common forms of land-use change in the Beiluo River Basin are the interconversion between forestland and scrub and forestland and grassland, as well as the reduction in cultivated land area. The Tupu analysis revealed that the largest area of conversion occurs between forestland (12, 13) and scrub or grassland, totaling 6480.88 km2. Additionally, a substantial area, totaling 8433.12 km2, was converted from scrub or grassland to forestland (21, 31), which exceeds the conversions of other Tupu units. The conversion from cultivated land to forestland, scrub, or grassland (41, 42, 43) amounts to 5017.46 km2, with 3766.44 km2 converted to grassland. Conversely, a total of 361.73 km2 was converted from forestland, scrub, and grassland to cultivated land (14, 24, 34), indicating that there was a larger area of cultivated land being transformed into other types of land use compared with the opposite direction. Figure 3 illustrates the direction of the land-use type conversion across the basin in each landform type area.

Land-Use Change Tupu Process between 1975 and 2015

Between 1975 and 1990, in the LHG region and in the LPG region, the Tupu unit of “water area → grassland” (63) is prominent, accounting for 73.15% and 21.65%, respectively. At the same time, the areas of 14 and 34 Tupu units in the LPG region and the RM region, respectively, are relatively large, and the inflow of cultivated land is larger than the outflow. In addition, there was a large proportion of “cultivated land → construction land” (45) Tupu units in the LHG region, RM region, and TP region. The number of LUT units in this period was relatively small, and they were mainly concentrated on the expansion of grassland, cultivated land, and construction land with low spatial isolation, indicating that these changes were more spatially concentrated.
From 1990 to 2000, the mutual transformation between grassland and cultivated land was the major type of land-use change, and their proportions are roughly the same. Their total proportions in the LHG region, LPG region, RM region, and TP region are 88.15%, 48.49%, 21.35%, and 50.29%, respectively. Units 34 and 43 showed low levels of spatial separation in the four zones (Figure 5).
The period from 2000 to 2010 was mainly characterized by the transformation of cultivated land into grassland, scrub, and woodland and grassland to woodland and shrub (43, 42, 41, 32, 31). The proportion of “cultivated land → grassland” in the LHG region was 63.87%. The proportion of “grassland → forestland” in the LPG region was 55.35%. The conversion of “grassland and scrub → forestland” was 51.70% and 40.37%, respectively, in the RM region. The Tupu units of “grassland → forestland” and “cultivated land → grassland” in the TP region accounted for 41.96% and 29.00%, respectively. The lowest levels of spatial isolation during this period were 43 in the LHG region; 31 and 41 in the LPG region; 21 and 31 in the RM region; and 43, 45, and 31 in the TP region.
From 2010 to 2015, the main types of Tupu were still the conversion of “cultivated land → grassland, scrub, and forestland” and “grassland → forestland and scrub” (43, 42, 41, 32, 31). Additionally, the conversion of “forestland → shrub”,” grassland → shrub”, and “forestland → grassland” continued to be present in the four geomorphological regions. In the LHG region, the largest proportion of the total area (41.86%) was “cultivated land → grassland”, followed by “grassland → forestland and scrub” (25.15%) and “forestland → grassland” (18.34%). In the LPG region, “cultivated land → forest land” and “cultivated land → grassland” accounted for 17.11% and 9.97%, respectively, while “grassland → forestland” accounted for 13.99%. The conversion of forestland to grassland and scrub accounted for 27.98% and 14.51%, respectively. In the RM region, a significant amount of forestland was converted to scrub (42.45%) and grassland (32.41%). The conversion of “cultivated land → grassland and forestland” accounted for only 9.05% and 5.05%, respectively. In the TP region, “cultivated land → grassland” was still the main component, accounting for 40.89%. However, there was also some conversion of forestland to grassland, accounting for 19.93%. Similar to the previous two phases, the spatial isolation of the Tupu units involving 31, 32, and 43 was low in all four regions. Additionally, the spatial isolation of Tupu units of types 12 and 13 also showed low levels for this period.

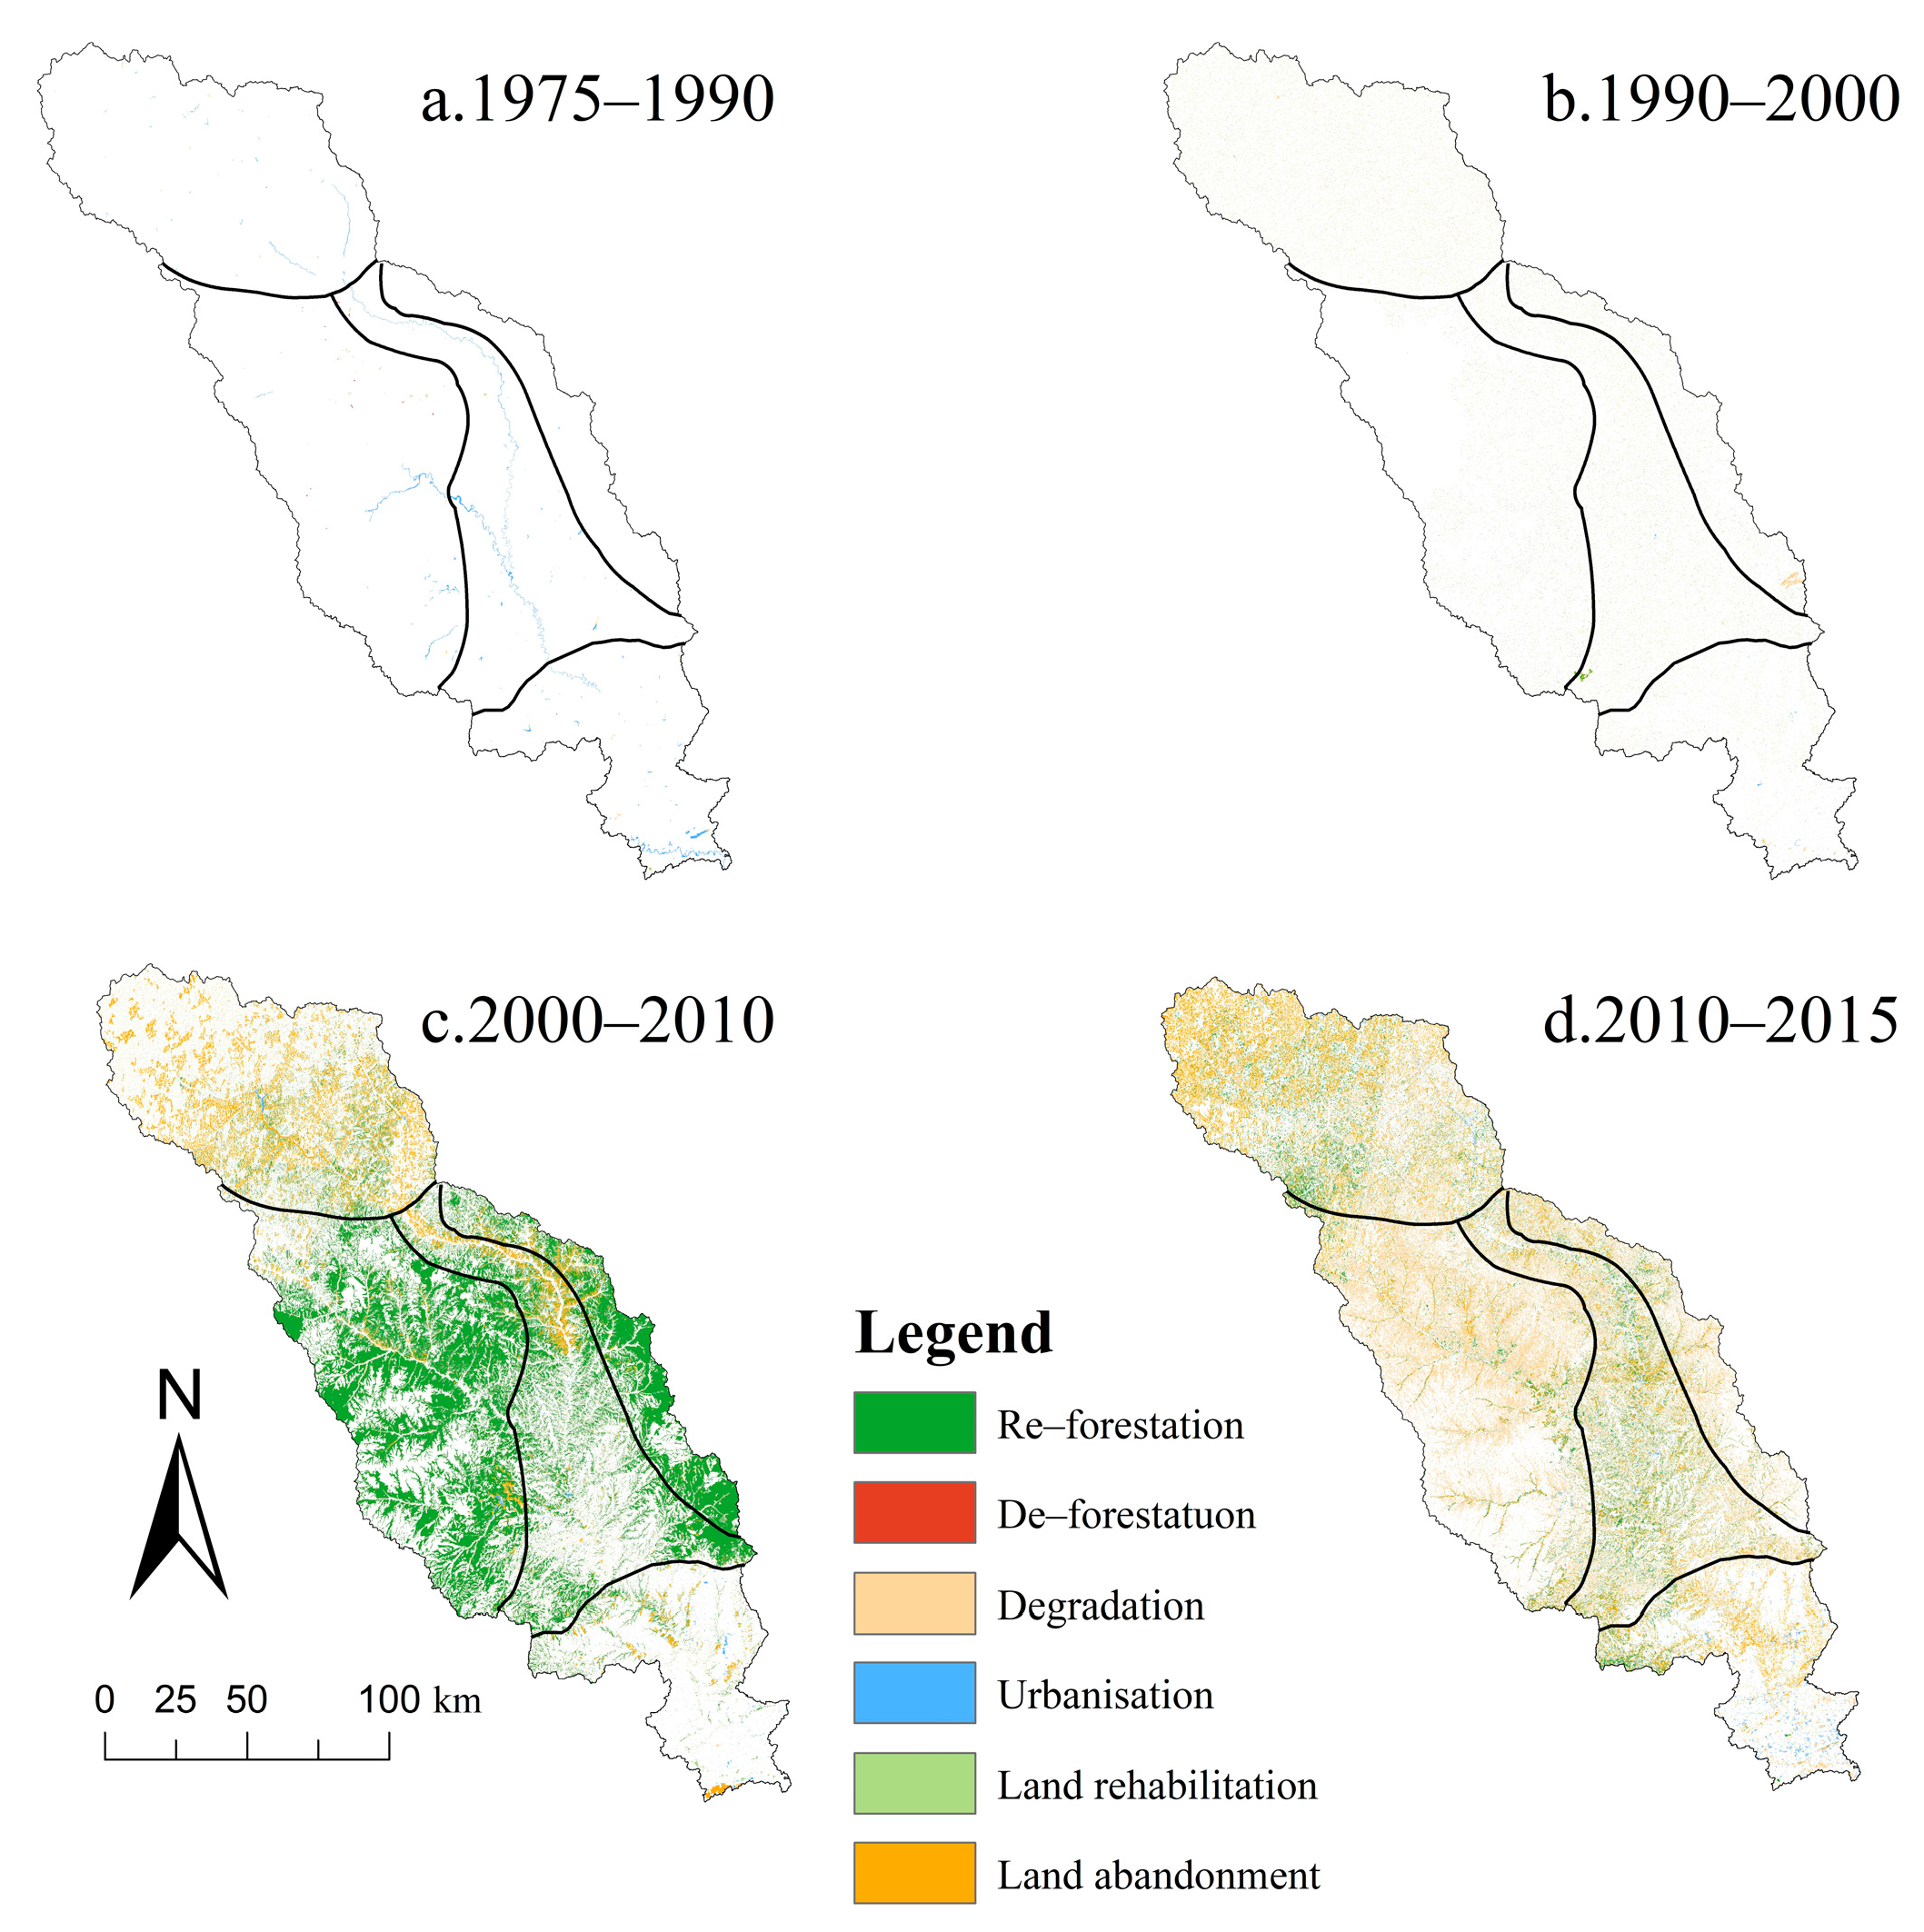
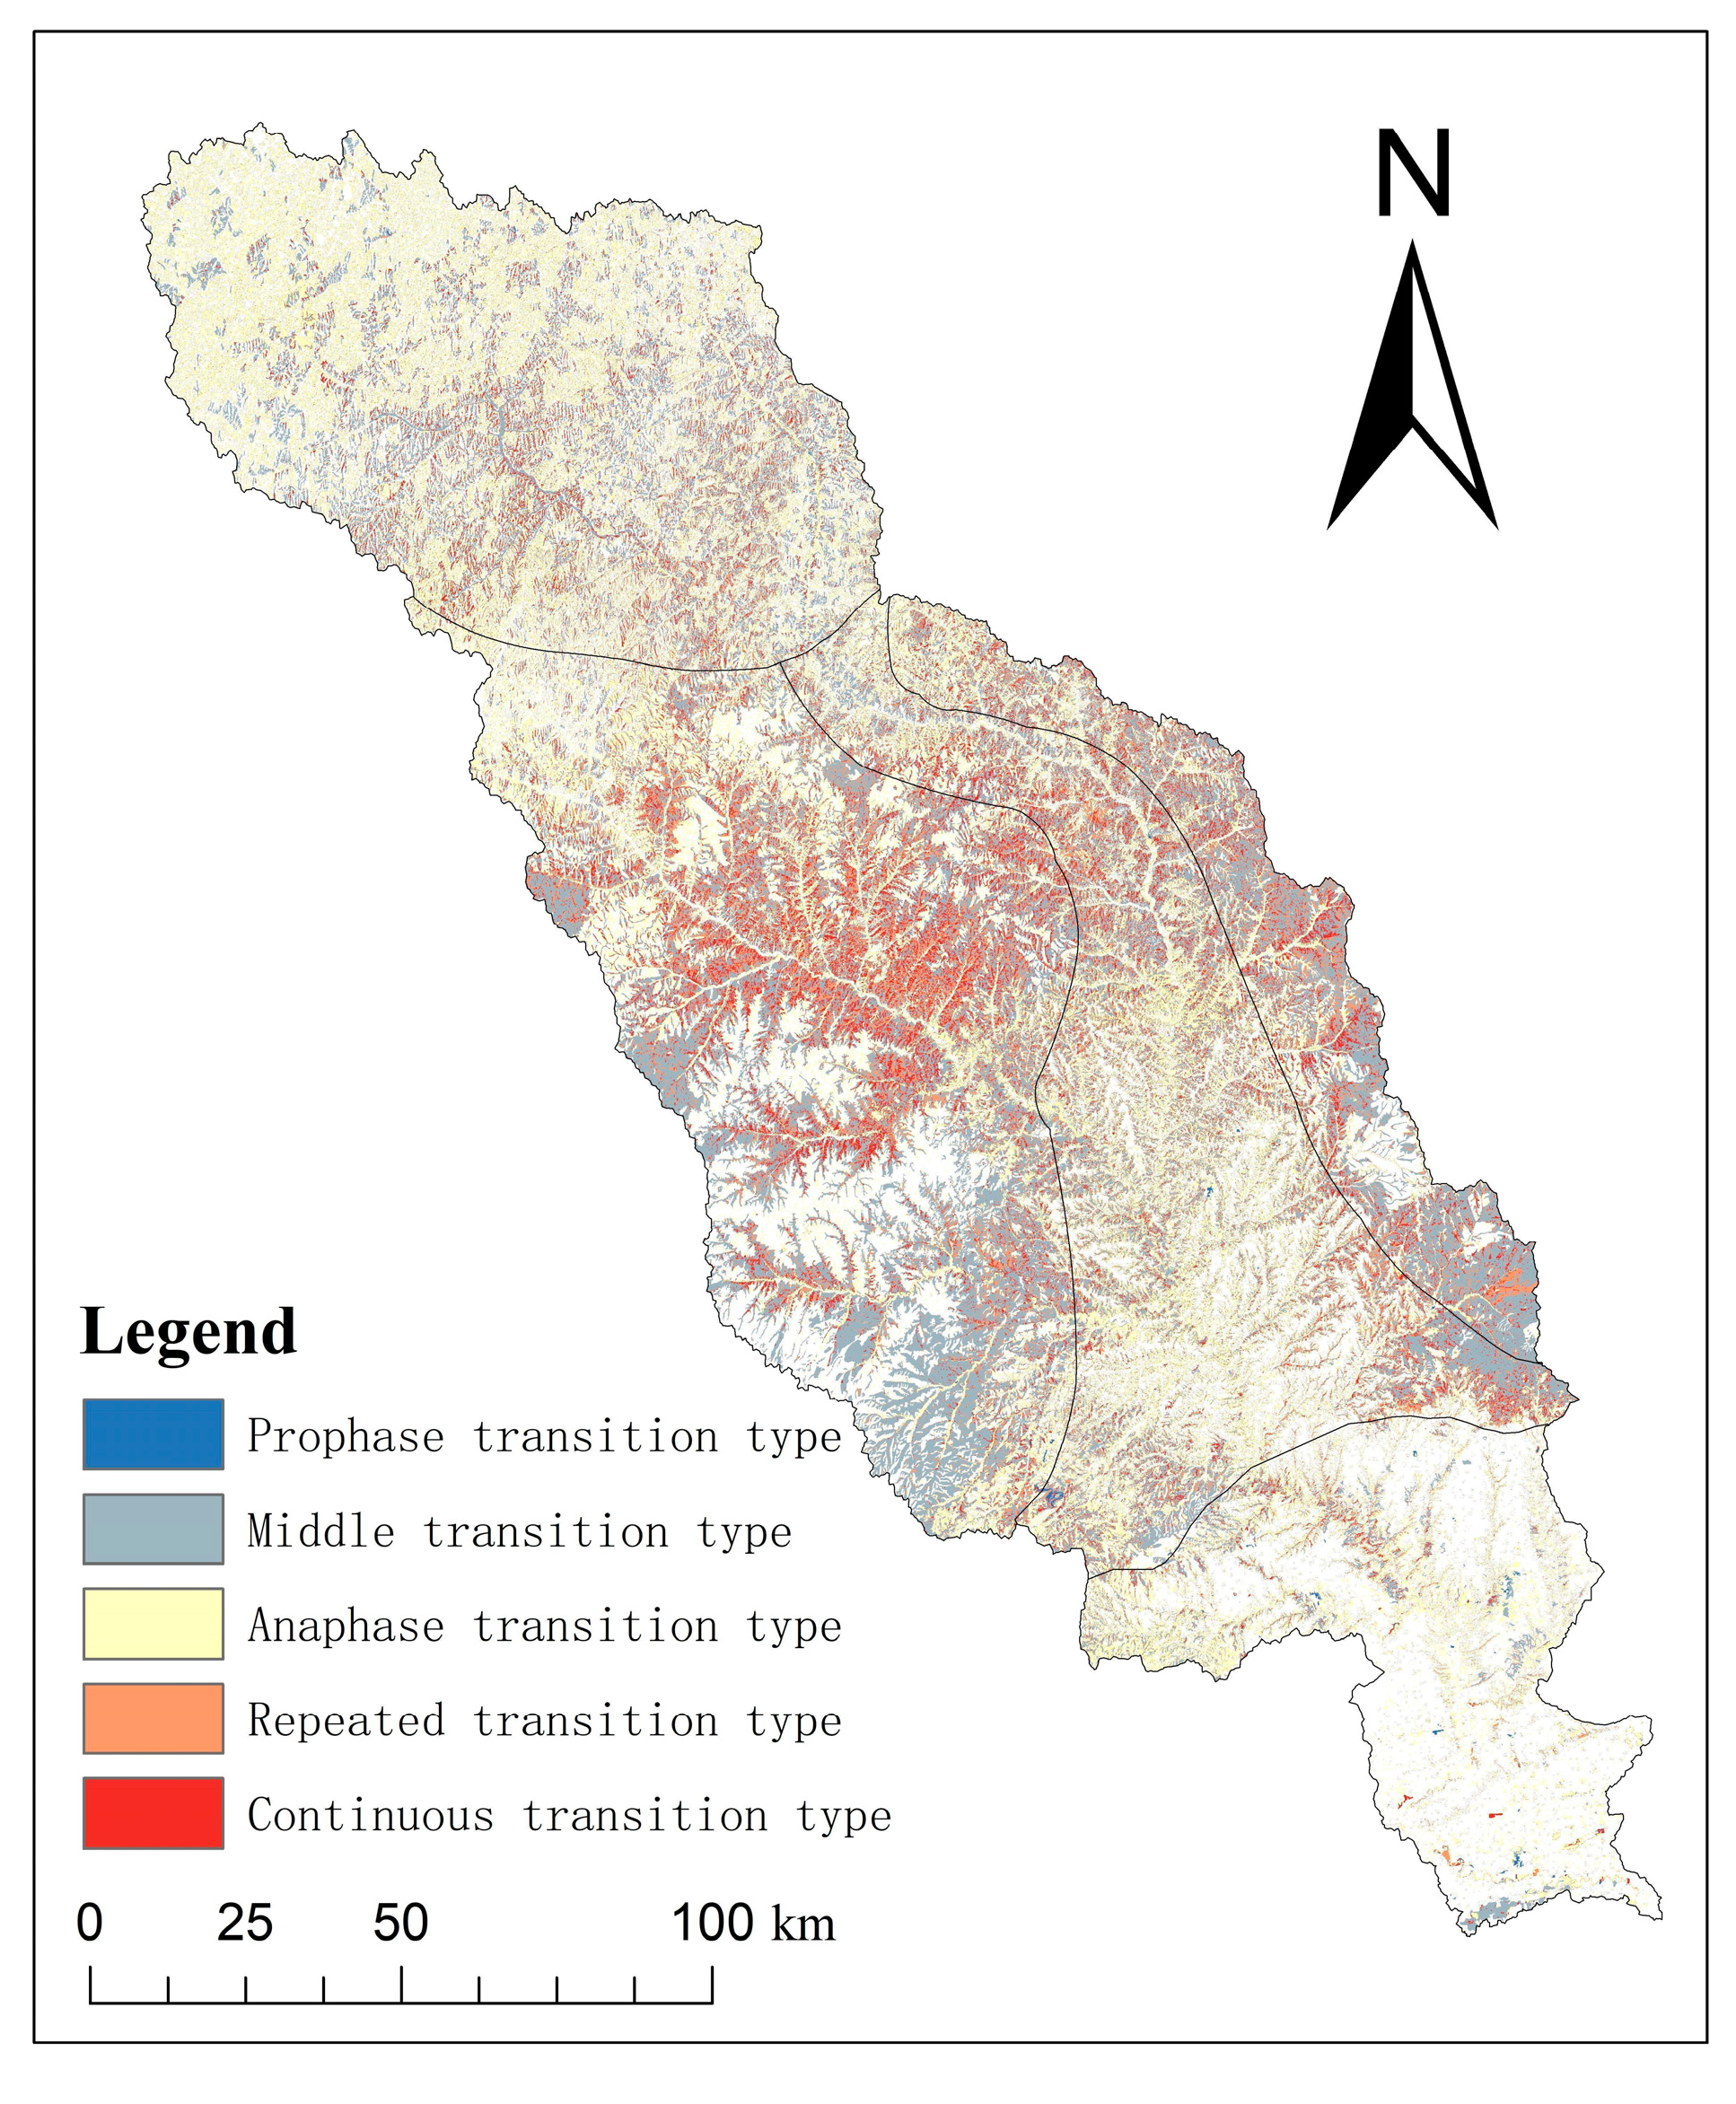
3.3. Land-Use Change Tupu Patterns between 1975 and 2015

Land-use change activity was infrequent between 1975 and 2000, as shown in Figure 3 and Figure 4. However, it increased rapidly after 2000. Accordingly, the period between 1975 and 2000 can be referred to as the prophase, the period between 2000 and 2010 as the middle phase, and the period between 2010 and 2015 as the anaphase. To examine the patterns of land-use change Tupu from 1975 to 2015, the top 90% of land-use change pathways were statistically analyzed, as shown in Table 3. The spatial distribution of various Tupu patterns is shown in Figure 5 and Figure 6.

3.3.1. Prophase Transition Type

From 1975 to 2015, the prophase transition type accounted for the smallest proportion among the five transition types, with a total area of 9.02 km2. This type was predominantly characterized by the transformation of “cultivated land → construction land” (45555), accounting for 53.13%, and it was mainly concentrated in the TP region. This indicated that, from 1975 to 2015, the land-use type did not often change after the transformation of “cultivated land → construction land” with the progress of urbanization.

3.3.2. Middle Transition Type

The area of this transition type was larger than the previous type, with a wider spatial distribution, especially for “cultivated land → grassland” (44433), which not only occupied 23.51% and 8.69% of the LPG region and TP region, respectively, but also appeared in the top 90% of the other two landform types. “Grassland → forestland” (33311) is also a major component of this type, accounting for 18.53% and 22.56% of the RM region and the LPG region, respectively. In addition, there is a high proportion of “scrub → forestland” (22211) within these two landform types, with proportions of 10.01% and 22.55%, respectively.

3.3.3. Anaphase Transition Type

The anaphase accounts for the largest proportion and greatest diversity in the top 90% of the transition types in the other three areas, in addition to the RM region. The anaphase transition type is mainly composed of “cultivated land → forest, shrub, and grassland” and “grassland → forest and shrub”. In the LHG region, “cultivated land → grassland” (44,443) accounts for 27.51%. Similarly, in the TP region, “cultivated land → grassland” (44,443) accounts for 29.98%. It is noteworthy that, although “cultivated land (grassland) → forest and shrub (grassland)” is the predominant type in all districts, there is also the existence of “forest (shrub) → grassland”, particularly in the RM region. Here, the proportion of forest converted to shrub and grassland (11112, 11113) is 5.96% and 4.96%, respectively.

3.3.4. Repeated and Continuous Transition Types

There are 87 and 425 change paths in the repeated transition type and the continuous transition type, respectively. This is far more than for the other three transition types; the areas of these two types account for 13.25% and 16.09% of the five transition types, respectively. For the repeated transition type, the transformation from “grassland → forestland → grassland” (33313) was predominant in all four areas, followed by the repeated transformation of cultivated land and grassland (33433, 44343, 44344). The transition from “scrub → forestland → scrub” (22212) was observed in both the LPG region and the RM region, accounting for 1.78% and 5.50%, respectively. The continuous transition type is dominated by the transition of “cultivated land → grassland → forestland, cultivated land → grassland → scrub, cultivated land → forestland → grassland, and grassland → forestland → scrub“ (44431, 44432, 44413, and 33312). Additionally, within the RM region, there was also the occurrence of “scrub → forestland → grassland” (22213), accounting for 5.50% of the pattern.

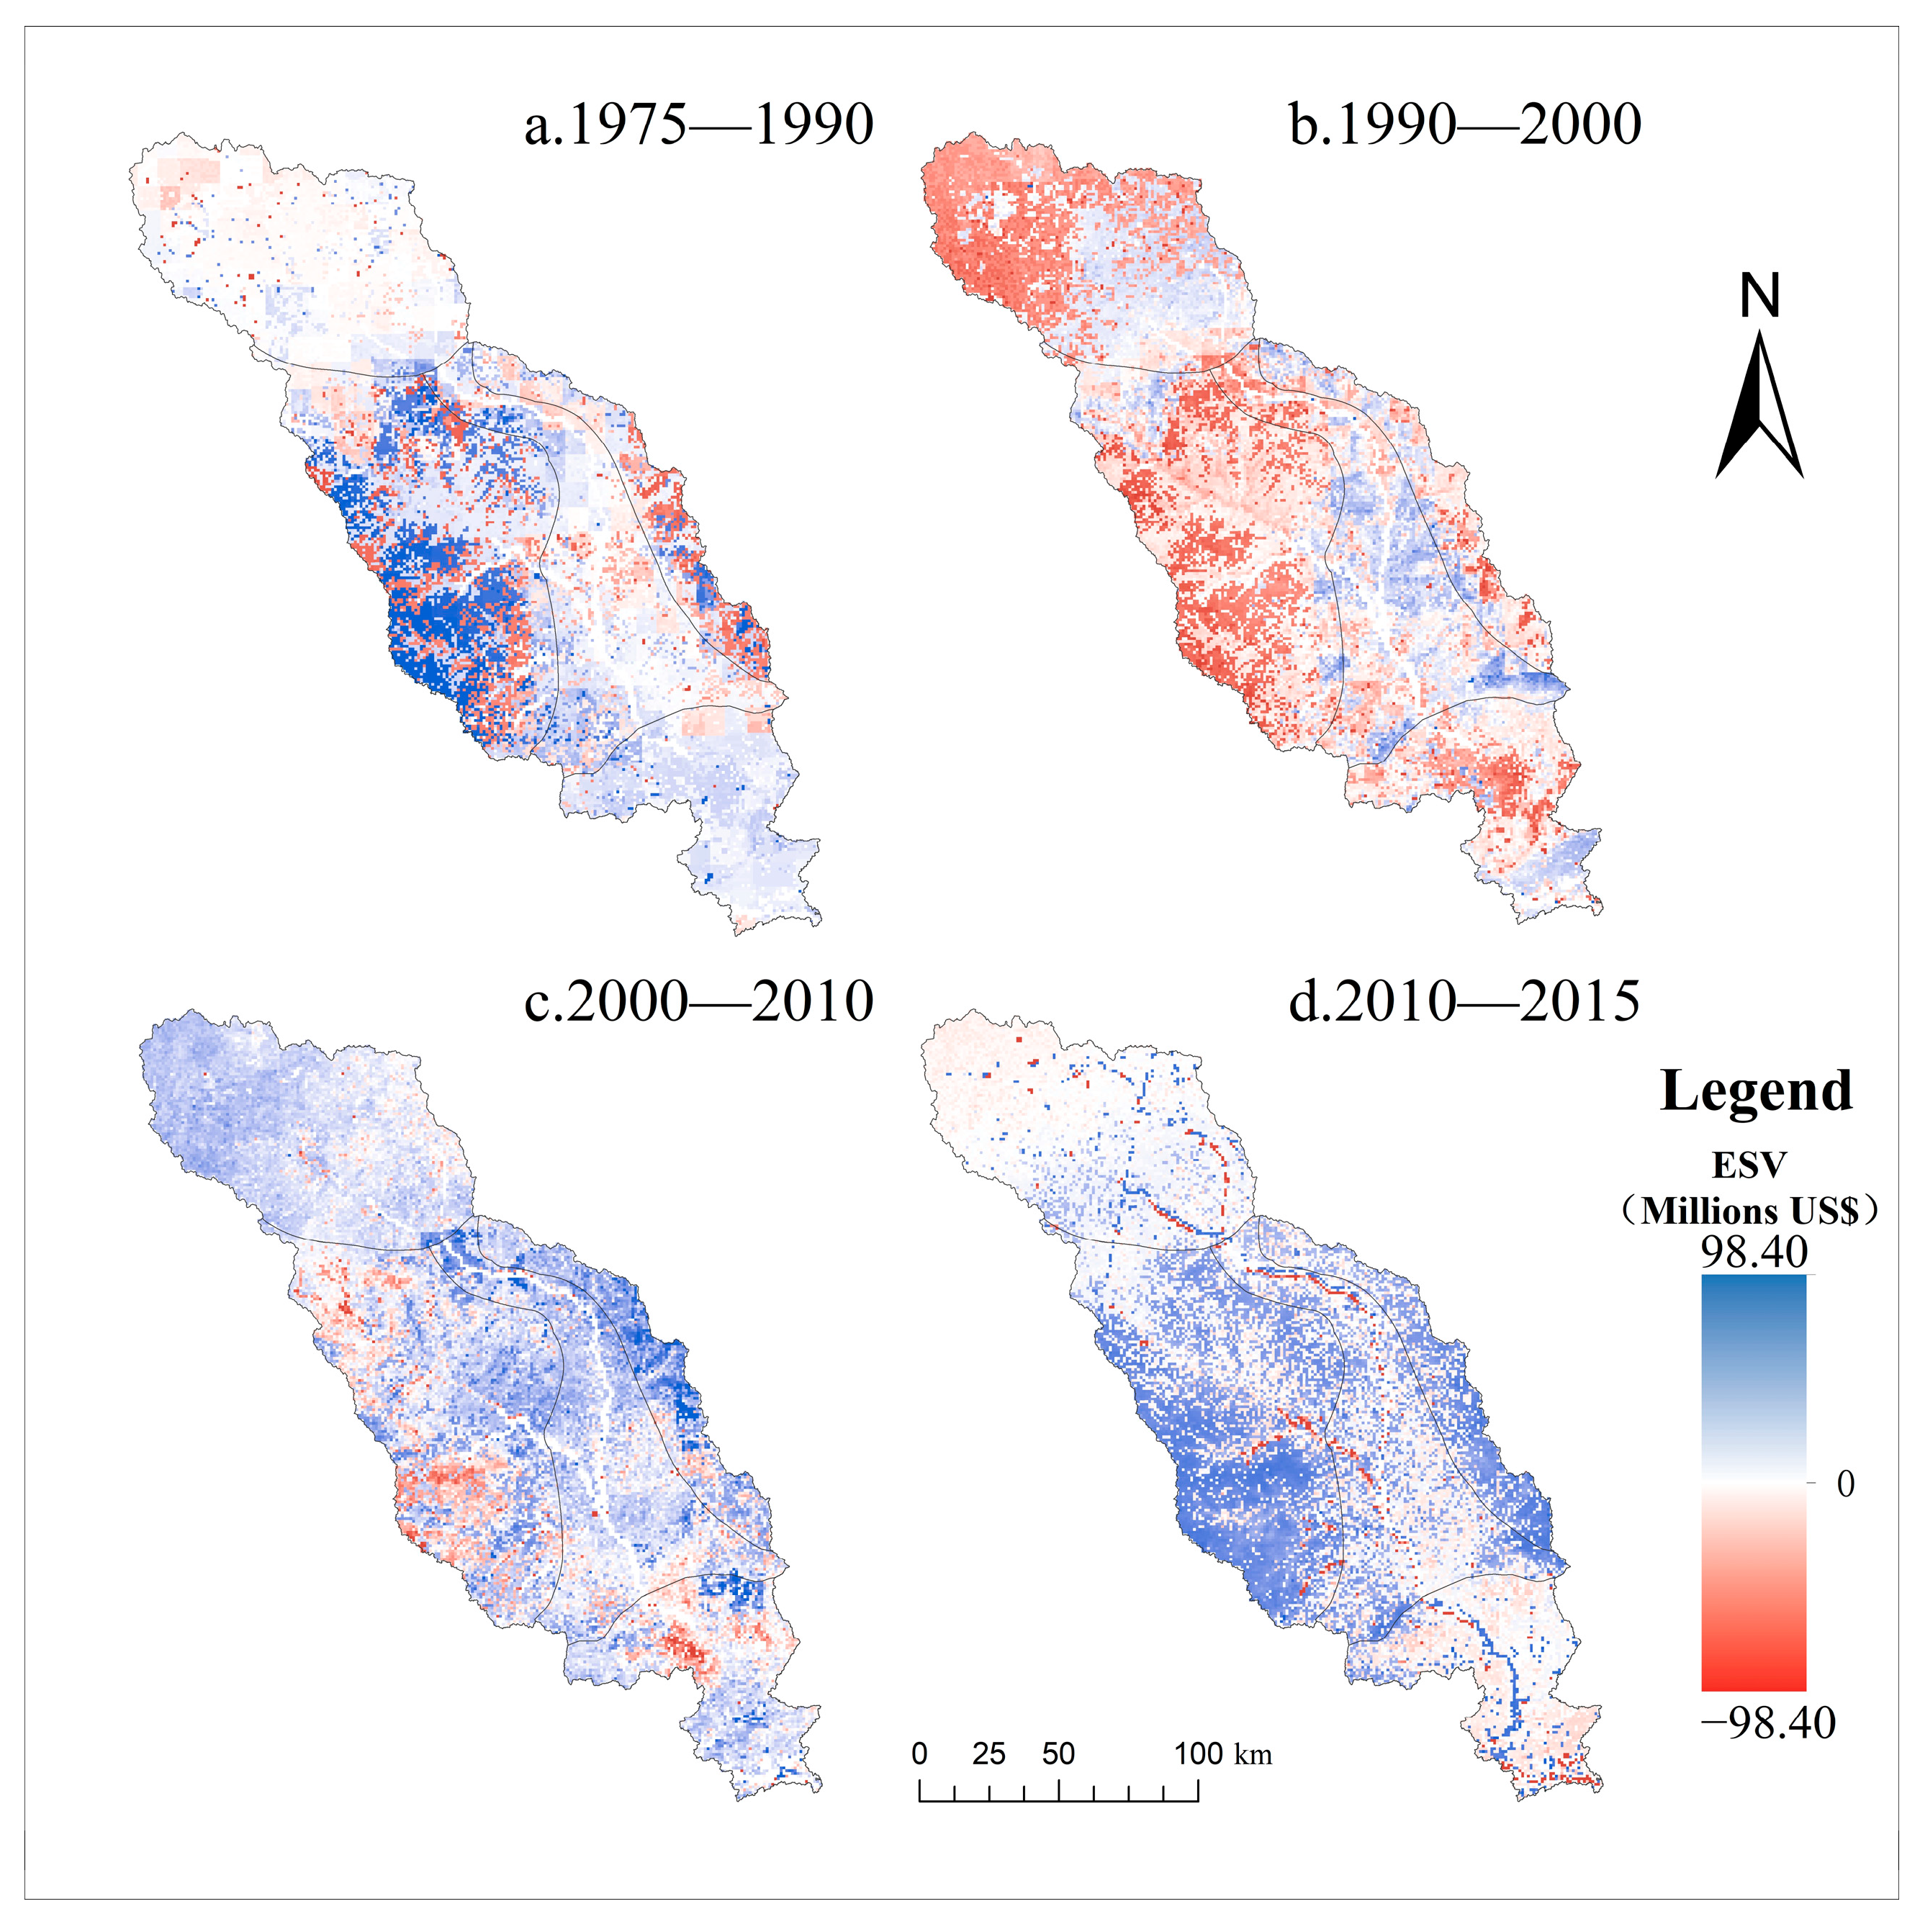
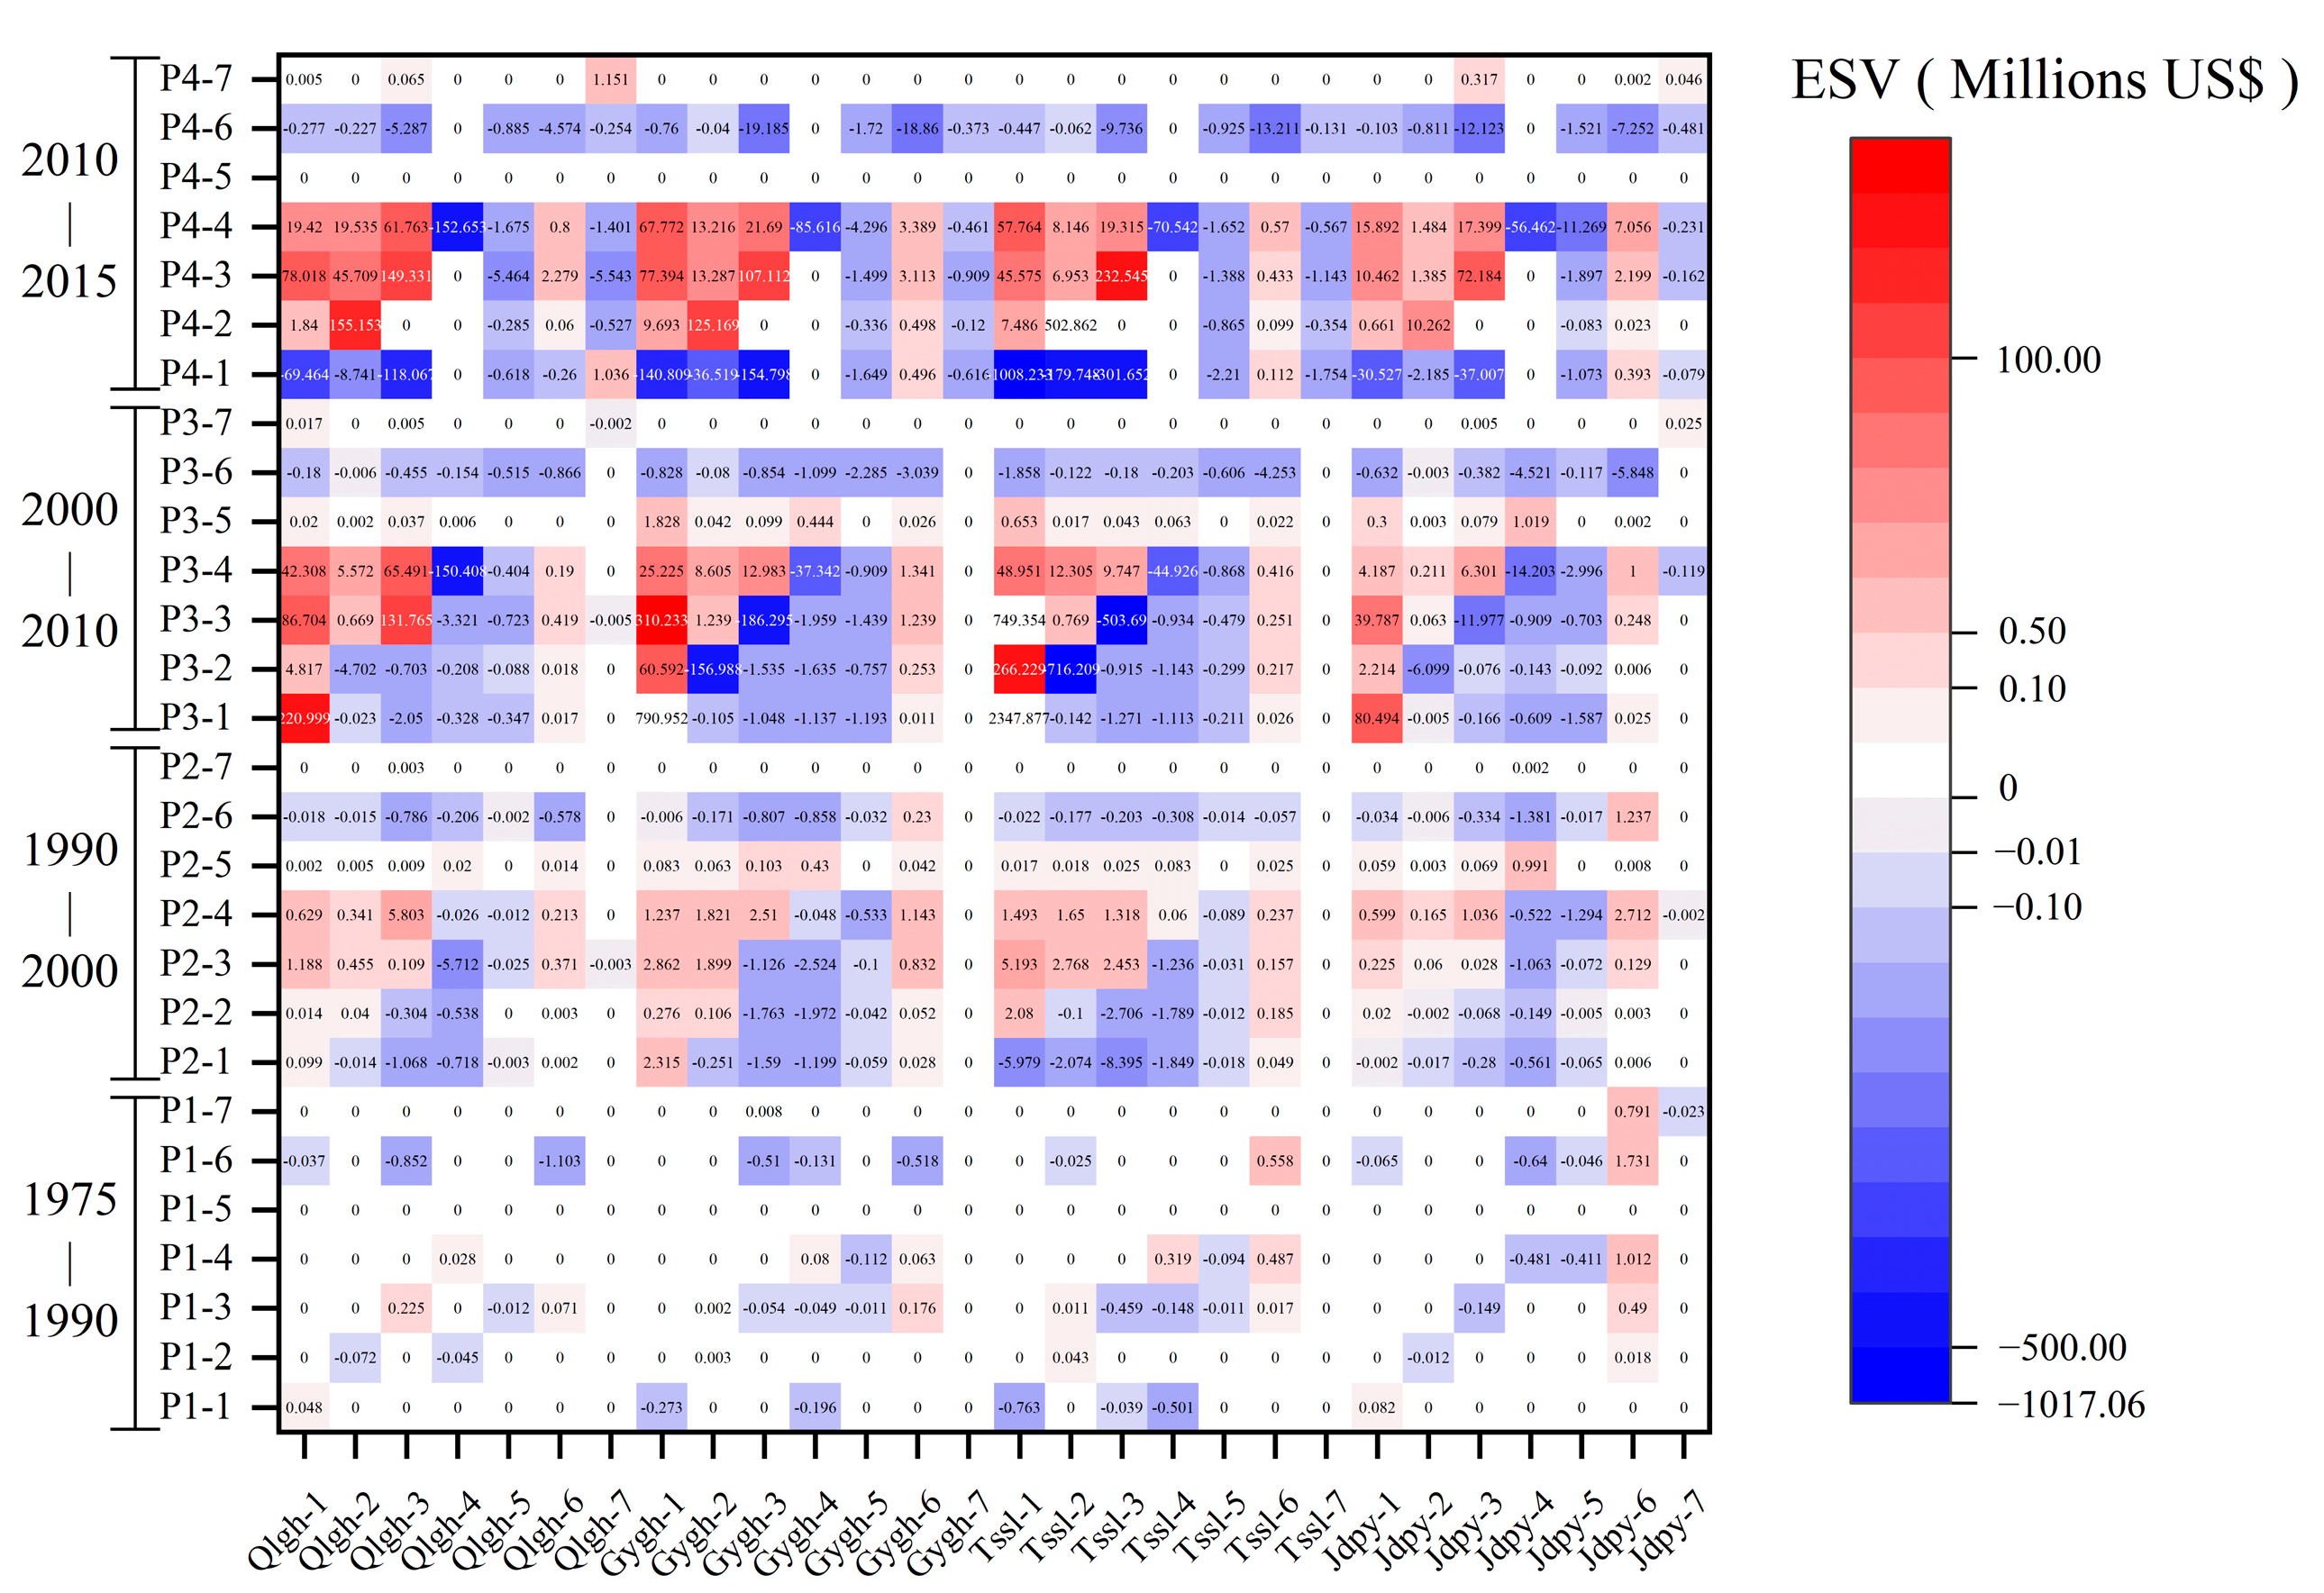
3.4. The Influence of LUCC on ESV

3.4.1. Changes in ESV

As shown in Figure 7 and Figure 8, overall, the ESV in the Beiluo River Basin shows an upward trend year by year, increasing by USD 3.209 billion, or by 54.16%, from 1975 to 2015. For first-level ecosystem services, the largest proportion of the ESV was provided by regulating services, followed by supporting services and supplying services, with cultural services accounting for the smallest proportion.
The ESV in the four geomorphic regions showed an upward trend, and the LHG region’s ESV increased by USD 274.5 million from 1975 to 2015. The ESVs of regulating services, supporting services, and cultural services all increased by 23.1%, 21.86%, and 25.47%, respectively. The ESV of supplying services decreased by USD 12 million, or 1.50%. Specific to the secondary services, the ESVs of soil formation and retention increased by 16.89%; the ESVs of raw material supply, gas regulation, climate regulation, hydrological regulation, and biodiversity protection increased by more than 20%; and the ESVs of recreation and culture increased by 66.44%. The ESV for food production decreased by USD 24.79 million, or 34.63%.
Among the four geomorphological areas, only the LHG region showed a downward trend in ESV, with a total decrease of USD 1.23 million from 1975 to 2015. Among the nine services, there was only a small increase in the following ESV types: hydrological regulation, gas regulation, recreation and culture, and the supply of raw materials. The value of other services has decreased. The value of waste treatment services decreased the most, followed by food production and soil formation and retention. The reduction in the value of other services was not significant. Among them, food production services decreased by 54.83% and waste treatment services decreased by 31.38%.
The values of the nine services in the LPG region have increased significantly since 2000. Among them, the value of biodiversity protection increased the most, reaching USD 175 million, an increase of 67.22%. The second-largest increase is seen in soil formation and retention and gas regulation, with increases of 112.74% and 133.17%, respectively. The value of food production services also increased by USD 12 million, but only by 27.85%.
The ESV in the RM region increased the most, reaching USD 2.079 billion, or 61.54%. The value of all kinds of services has increased significantly. As with the gully region of the plateau, the growth is most obvious for biodiversity conservation, gas regulation, and hydrological regulation, with increases of 67.22%, 73.27%, and 59.64%, respectively. The value of food production services also increased by USD 4.32 million, but only by 5.38%.
The overall ESV of the TP region increased by USD 159 million, with the largest increases in value seen for soil formation and retention and biodiversity protection, with increases of 36.45% and 45.55%, respectively. The value of food production services also rose by USD 4 million, but only by 12.53%.

3.4.2. Response of ESV to LUCC

Figure 9 shows the transfer matrix of ESV changes caused by the transformation of land use types in different geomorphic regions in different periods. In the LHG region, grassland is the main contributor to ESV, accounting for 74.84% in 2015. The expansion of the grassland area has led to a 39.70% increase in the ESV in this region. This is mainly due to the conversion of 2126.83 km2 of “cultivated land → grassland” between 2000 and 2015, resulting in an increase of USD 127 million in the ESV, as shown in Figure 8. The share of cultivated land remained at about 28.3% before 2010, but fell to 3.3% in 2015. The changes in 43, 41, 31, 13, and 32 are the main LUTs in the LHG region.
Before 2000, grassland was the biggest contributor to the ESV in the LPG region, accounting for 38.5%. The contributions to ESV are similar for shrub and cultivated land. Since 2000, forestland has become the biggest contributor to the ESV, accounting for 61.22%. This situation is mainly due to the emergence of a large number of type 31, 21, and 41 Tupu patterns in 2000 and 2010, resulting in a net increase in the forestland area of 1772.31 km2. Specifically, the transfer of cultivated land led to a net increase of USD 47.23 million in ESV, while converting other land types to forestland increased the ESV by USD 40 million. Types 21, 31, 41, 13, and 12 are the biggest driving forces for the change in the overall ESV in the LPG region.
The most obvious changes in the Tupu patterns of the RM region from 2000 to 2010 were observed in 21 and 31, with changes in areas of 2241.25 km2 and 2870.29 km2, respectively. These changes accounted for 92.07% of the total modified area. Moreover, a significant amount of other land was converted into forestland, resulting in a net increase of USD 163 million in the ESV. This net growth accounted for 98.52% of the total net growth of the ESV. It is noteworthy that the biggest driving forces for the change in ESV in the RM region were 12, 13, 21, 31, and 41.
The main contributor to the ESV in the TP area is cultivated land. However, its proportion decreased from 63.92% in 1975 to 47.75% in 2015. Significant changes were observed in the Tupu unit in this area from 2000 to 2010, with a shift leading to a net increase of USD 40 million in ESV. The most significant change from 2010 to 2015 was 43, leading to a net increase of USD 17 million in the ESV. Additionally, there has been a gradual intensification in the conversion of “cultivated land → construction land”, resulting in a total of 89.88 km2 of cultivated land being transformed into construction land within a span of 5 years. The driving forces behind the ESV change in the TP are units 31, 43, 41, and 13.
The main contributor to ESV in the LHG region is grassland, as a large amount of cultivated land has been transformed into grassland and forestland, which has led to an increase in ESV. In the anaphase, the conversion of some of the forestland into shrub and grassland has resulted in a decrease in the ESV. However, the increase in the grassland and shrub area has significantly improved the value of soil formation and retention services in this region. In the LPG region and the RM region, grassland and forestland are the main contributors to the ESV, with reasons 13 and 31 accounting for the changes in the ESV. In the RM region, the increase in the area of forestland, shrubland, and grassland has greatly improved the value of soil formation and retention, as well as the hydrological regulation service. Moreover, in the LPG region and the TP region, a significant amount of cultivated land has been converted into grassland and forestland, increasing the overall ESV of the land without any loss in the value of the food production service.

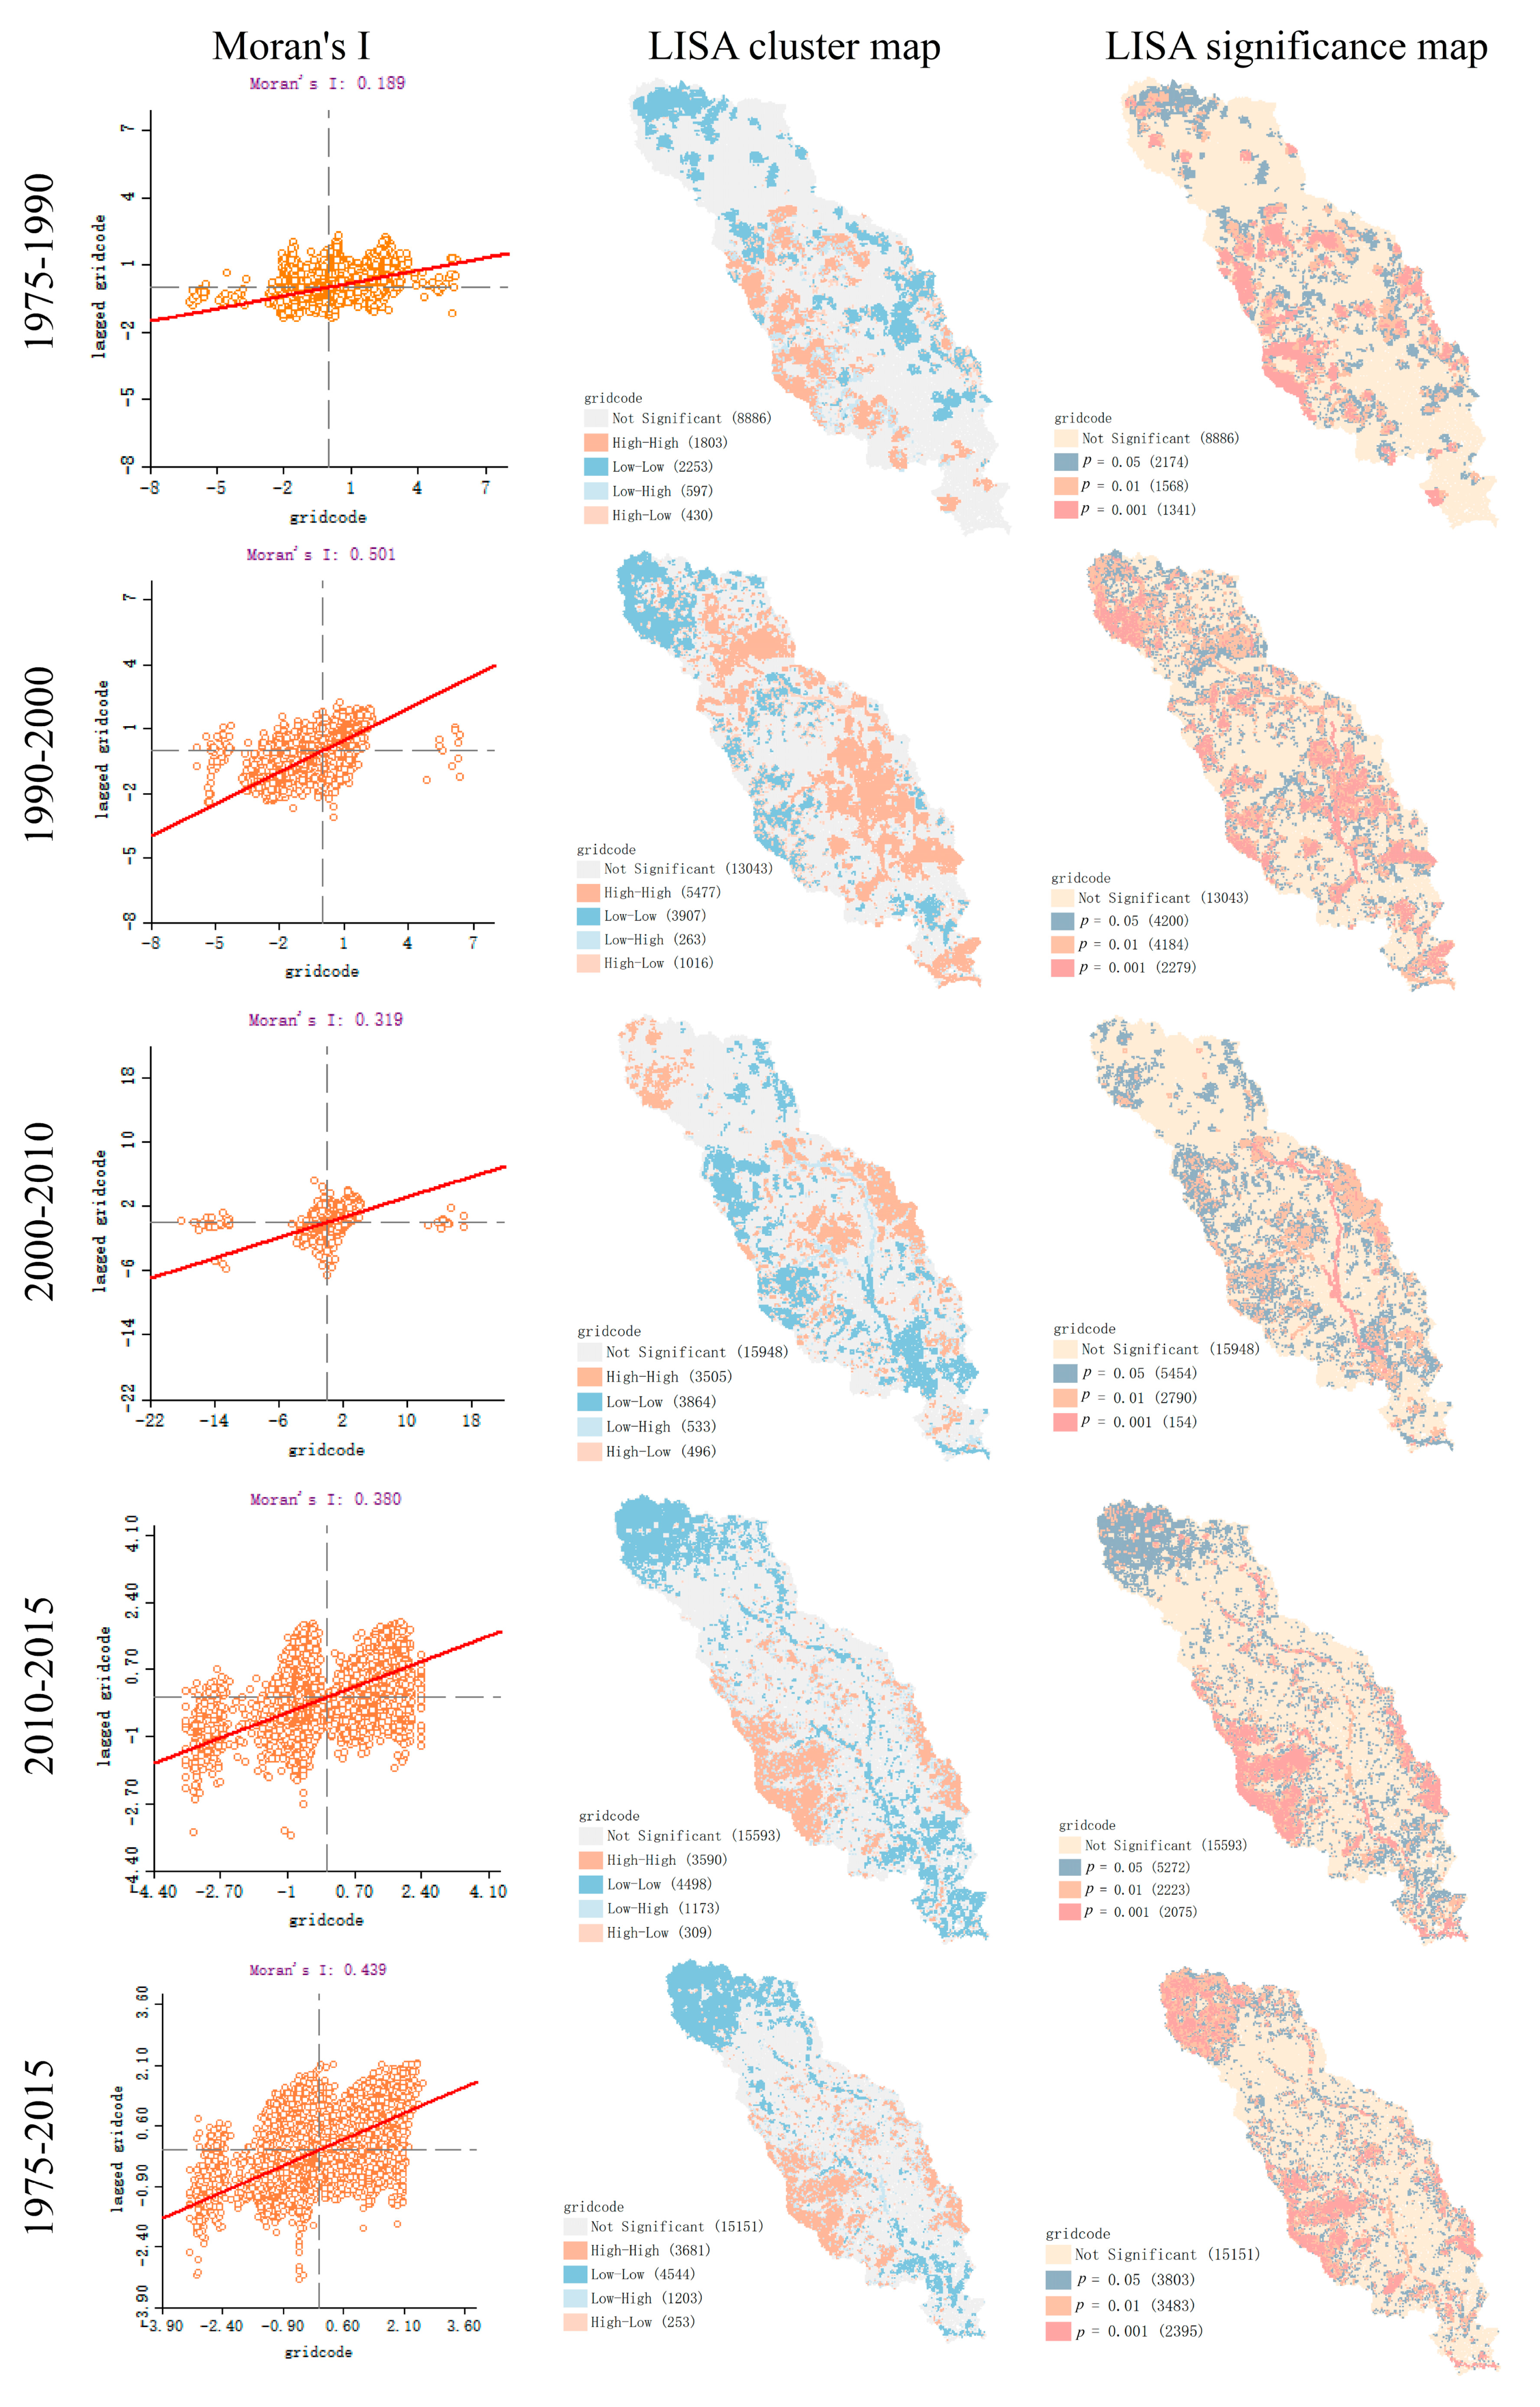
3.4.3. Identifying the Hot and Cold Spots of Changes in ESV

The results of the spatial autocorrelation analysis of ESV changes using GeoDa software are shown in Figure 10. The Moran’s I (a) of ESV change in the Beiluo River Basin from 1975 to 2015 were all greater than 0, indicating the existence of autocorrelation of regional ESV changes, and the distribution of spatial attribute values is a positive correlation. There are four cluster types in the LISA cluster diagram: High–High, Low–Low, Low–High, and High–Low. According to the LISA significance map, the confidence of the High–High and Low–Low core is 99.9%, and the confidence of the edge is 99%. It can be considered that High–High and Low–Low are the hot and cold spots of ESV changes.
In the first stage, the distribution range of hot spots and cold spots is small, in which the hot spots were mainly concentrated in the RM region on the west side of the basin and the cold spots were distributed in the RM region on the east side of the basin. From 1990 to 2000, the hot spots were mainly concentrated in the whole LPG region and the southern part of the LHG region and the TP region, while the cold spots were distributed in the RM region on the west side of the basin and the northern part of the LHG region. From 2000 to 2010, the hot spots of the ESV were concentrated in the east of the basin and the north of the LHG region, while the cold spots were distributed in the west of the basin and the north of the TP region. From 2010 to 2015, hot spots were concentrated in the RM region and cold spots were concentrated in the LHG region and TP region. The distribution trend of hot and cold spots of ESV changes from 1975 to 2015 is similar to that from 2010 to 2015.
On the whole, the development sequence of hot spots is the west RM region → the LPG area and the south LHG region → the east RM region and the north LHG region → the east and west RM region.

4. Discussion

The quantitative expression and evaluation of LUTs and ecosystem service functions is an important research topic that guides ecological protection planning. From 1975 to 2015, the ESV in the Beiluo River Basin showed an overall upward trend, which is consistent with the findings of other researchers [11,21,50,51]. From 1975 to 1990, the ESV of the Beiluo River Basin increased by USD 1.082 billion, indicating that small-scale soil and water conservation engineering measures, such as small-scale check dams and the dry terraces built in villages and towns in this area, played a positive role in the ER of the Loess Plateau [52,53]. From 1990 to 2000, the ER measures of the Loess Plateau mainly focused on the comprehensive management of small watersheds, which were more systematic and scientific [54,55]. From 2000 to 2015, the Loess Plateau began a large-scale “Grain for Green” project. A large number of sloped cultivated lands greater than 25° were converted into forestland or grassland [56]. Most of the ESVs in the Beiluo River Basin increased during this period. The project of returning cultivated land to forest and grassland is currently the largest ER measure in developing countries. While improving the regional ecological environment, such projects have also caused drastic changes in the land-use structure.
In the Tupu pattern, the proportion of the prophase transition type is relatively low in the four regions. That is, engineering interventions are secondary and natural recovery is the main focus [57,58]. Since 2000, land use has undergone significant changes that are mainly attributable to the Tupu patterns of 43, 41, 32, and 31. Since 2000, significant changes have taken place in land use, mainly caused by 44433, 33311, 22211, and 44443 in the Tupu patterns of middle and anaphase transition types. It is also these types of Tupu patterns that have become the backbone of improving the environment of the Beiluo River Basin and improving the main ESs of the four typical geomorphological types.
The ER of the Beiluo River Basin provides basic conditions for its ESs. However, in order to achieve sustainable ER, the coupling of social, economic, and environmental processes needs to be taken into account, as well as the attitudes and strategies of stakeholders [59]. In some of the Tupu patterns, such as the repeated transition type and continuous transition type, we found that there are resource-wasting Tupu units, such as 11112, 33313, 33433, 22212, 44413, and 33312. The emergence of these frequent types of LUCC and ecological degradation indicates the existence of policy discontinuity in the region and the game phenomenon between small-scale stakeholders and policies. After the conversion of cultivated land to forest land, the income of farmers suffered losses. In order to maintain the original living standards, some farmers redeveloped the forest land in the restoration area, and the ER benefit could not achieve sustainable development [60]. The conversion of “cultivated land → grassland and forestland” leads to the loss of supplying services and the enhancement of regulating services, which represents a trade-off between supplying services and regulating services, which can be directly confirmed in the LHG region and RM region in this study. Although the supplying services and regulating services in the LPG region and TP region increased at the same time, there was a big difference in the growth rate of the two regions.
The TP region is the main source of the food production service in the Beiluo River Basin, followed by the LPG region. The service value of food production in the LPG region and the TP region still maintains a positive growth trend, despite the decreasing area of cultivated land [61]. There are several reasons for this: (1) The average elevation and slope of cultivated land have decreased, and most of the cultivated land converted to forest land is at a slope above 25°, so the situation of soil erosion is serious, soil fertility is insufficient, and food production is not high [30]. (2) After the “Grain for Green” project, the implementation of agricultural engineering improved the sustainability of cultivated land ecosystems. In conclusion, the optimization of cultivated land’s spatial pattern improves the environment, and ecological security plays a positive role in promoting food security [20,61,62]. Therefore, in the process of formulating and implementing land-use policy and environmental protection policy, it is necessary to deal with the trade-off between various services. Integrating an ecosystem service assessment system into the formulation and implementation of policies and plans, quantifying the impact of policies and plans, and adopting multiple compensation mechanisms can help to coordinate the relationship between various services and various stakeholders, so as to make land use more reasonable and social development more sustainable [63,64,65,66].
In order to improve the comprehensive benefits of ER in different landforms, it is necessary to strengthen the control of grassland and shrub in the LHG region, strengthen the control of forests in the RM region, strengthen the control of cultivated land in the TP region and the LPG region, and establish a management system to avoid repeated changes or destruction of land use. In addition, the work of the “Grain for Green” project in different landforms requires a scientific assessment of the losses of landless farmers and the implementation of compensation for farmers. Xie et al. once suggested that China should increase its investment in ecological compensation, enrich and diversify ecological compensation tools, and establish and improve the institutional system of ecological compensation [48].
It should be noted that there are still some shortcomings to this research, detailed as follows. (1) This paper uses the average grain output and average grain market price of the Beiluo River Basin in 2015 to calculate the value of the unit equivalent factor. The ESV in 1975, 1990, 2000, and 2010 was found to be on the high side owing to the influence of currency depreciation and the rising output per unit of cultivated land. (2) Similar to many other studies, this paper assumes that the ESV of construction land is zero [67,68,69]. However, it is noteworthy that, today, many cities and villages are increasingly prioritizing green environments and human settlement experiences. Hence, this assumption may no longer accurately reflect the actual situation. For instance, the construction land ecosystem also serves the functions of absorbing carbon dioxide, purifying the air, and providing entertainment opportunities, to some extent [70,71,72,73]. (3) As this study focuses solely on LUCC analysis, it does not consider the impact of hidden land-use changes on ESs, such as quality, property rights, management modes, input, output, and function [74]. Hence, it is impossible to comprehensively analyze the changes in ESs. Consequently, exploring the influence of hidden LUTs on ESs constitutes a valuable future research direction.

5. Conclusions

In this study, the spatio-temporal characteristics of LUTs in the Beiluo River Basin from 1975 to 2015 were analyzed using the GT method, the ESV was assessed using the revised benefit transfer method, and the experience of ER measures applied in four typical geomorphic regions of the Loess Plateau was summarized.
The results indicate that, from 1975 to 2015, the proportion of forestland in the Beiluo River Basin increased by 18.27%, while the areas of shrub, grassland, cultivated land, and water decreased by 1.03%, 0.16%, 18.23%, and 0.26%, respectively. In the past 40 years, the overall ESV of the basin increased by USD 3.209 billion (54.16%).
In the Tupu pattern of middle transition and anaphase transition types, the transformations of “cultivated land → forestland, shrub, and grassland” and “shrub and grassland → forestland” (44433, 44443, 44441, 33311, 33331, 33332) are key to enhancing the main services of the four typical geomorphic regions. The transition of “cultivated land → grassland” enhanced the water and soil conservation services in the LHG region. The transition of “grassland/shrub → forestland” improved the regulating and support services in the LPG region and RM region. Since 2000, a large amount of cultivated land has been converted to forestland, shrub, or grassland, which has significantly enhanced the regulating and support services of the ecosystem, but has resulted in losses in the supplying services. However, in the TP region and LPG region, the value of the supplying service showed a slight increase, owing to the increase in grain yield per unit area.
The emergence of repeated transition and continuous transition Tupu patterns, such as “grassland → forestland → grassland” and “cultivated land → forestland → grassland”, indicates that there was a discontinuity between policy formulation and implementation, and there were game problems between farmers and policy. To achieve sustainable development, it is necessary to strengthen the ecological protection of the areas that have completed ER, put ecological compensation schemes in place, prevent repeated damage, evaluate the unrepaired areas, and identify reasonable areas that need ecological restoration to promote targeted precise ecological restoration.

Author Contributions

Conceptualization, J.X. and J.Z.; Data curation, J.X. and J.Z.; Formal analysis, J.X. and J.Z.; Funding acquisition, J.Z.; Investigation, J.X. and J.Z.; Methodology, J.Z.; Project administration, J.Z.; Resources, J.Z.; Software, J.X., J.W. and S.N.; Supervision, J.Z.; Validation, J.Z.; Visualization, J.X.; Writing—original draft, J.X.; Writing—review and editing, J.X., M.Q., M.L. and J.Z. All authors have read and agreed to the published version of the manuscript.

Funding

This research was funded by the China University of Geosciences (Beijing) University Student Innovation and Entrepreneurship Training Program, grant number S202311415124; the Inner Mongolia Science and Technology Major Project, grant number 2020ZD0020; and the National Natural Science Foundation of China, grant number 41701207.

Data Availability Statement

The data presented in this study are available upon request from the corresponding author.

Acknowledgments

We would like to express our respect and gratitude to the anonymous reviewers and editors for their professional comments and suggestions.

Conflicts of Interest

The authors declare no conflict of interest.

References

  1. Gann, G.D.; McDonald, T.; Walder, B.; Aronson, J.; Nelson, C.R.; Jonson, J.; Hallett, J.G.; Eisenberg, C.; Guariguata, M.R.; Liu, J.; et al. International principles and standards for the practice of ecological restoration. Restor. Ecol. 2019, 27, S1–S46. [Google Scholar] [CrossRef]
  2. Harris, J.; Hobbs, R.; Higgs, E.; Aronson, J. Ecological Restoration and Global Climate Change. Restor. Ecol. 2006, 14, 170–172. [Google Scholar] [CrossRef]
  3. Nations, U. United Nations Decade on Ecosystem Restoration (2021~2030) [EB/OL]. Available online: https://undocs.org/A/RES/73/284 (accessed on 10 July 2023).
  4. Congress, I.W.C. The Marseille Manifesto [EB/OL]. Available online: https://www.iucncongress2020.org/programme/marseille-manifesto (accessed on 10 July 2023).
  5. Benayas, J.M.R.; Newton, A.C.; Diaz, A.; Bullock, J.M. Enhancement of Biodiversity and Ecosystem Services by Ecological Restoration: A Meta-Analysis. Sci. Rep. 2009, 325, 1121–1124. [Google Scholar] [CrossRef] [PubMed]
  6. Feng, X.; Fu, B.; Lu, N.; Zeng, Y.; Wu, B. How ecological restoration alters ecosystem services: An analysis of carbon sequestration in China’s Loess Plateau. Sci. Rep. 2013, 3, 2846. [Google Scholar] [CrossRef] [PubMed]
  7. Carlucci, M.B.; Brancalion, P.H.S.; Rodrigues, R.R.; Loyola, R.; Cianciaruso, M.V. Functional traits and ecosystem services in ecological restoration. Restor. Ecol. 2020, 28, 1372–1383. [Google Scholar] [CrossRef]
  8. Lawler, J.J.; Lewis, D.J.; Nelson, E.; Plantinga, A.J.; Polasky, S.; Withey, J.C.; Helmers, D.P.; Martinuzzi, S.; Pennington, D.; Radeloff, V.C. Projected land-use change impacts on ecosystem services in the United States. Proc. Natl. Acad. Sci. USA 2014, 111, 7492–7497. [Google Scholar] [CrossRef]
  9. Kalogirou, S. Expert systems and GIS: An application of land suitability evaluation. Comput. Environ. Urban Syst. 2002, 26, 89–112. [Google Scholar] [CrossRef]
  10. Seppelt, R.; Lautenbach, S.; Volk, M. Identifying trade-offs between ecosystem services, land use, and biodiversity: A plea for combining scenario analysis and optimization on different spatial scales. Curr. Opin. Environ. Sustain. 2013, 5, 458–463. [Google Scholar] [CrossRef]
  11. Jia, X.; Fu, B.; Feng, X.; Hou, G.; Liu, Y.; Wang, X. The tradeoff and synergy between ecosystem services in the Grain-for-Green areas in Northern Shaanxi, China. Ecol. Indic. 2014, 43, 103–113. [Google Scholar] [CrossRef]
  12. Zhang, J.; Gao, G.; Fu, B.-J.; Gupta, H. Investigation of the relationship between precipitation extremes and sediment discharge production under extensive land cover change in the Chinese Loess Plateau. Geomorphology 2020, 361, 107176. [Google Scholar] [CrossRef]
  13. Liu, L.; Zhang, H.; Li, F.; Chen, X. Research progress and prospect of soil and water conservation measures in the Loess Plateau. In Proceedings of the 5th International Conference on Traffic Engineering and Transportation System, ICTETS 2021, Chongqing, China, 24–26 September 2021; Academic Exchange Information Center (AEIC): Guangzhou, China, 2021. [Google Scholar]
  14. Ning, Z.; Gao, G.Y.; Fu, B.J. Changes in streamflow and sediment load in the catchments of the Loess Plateau, China: A review. Acta Ecol. Sin. 2020, 40, 2–9. [Google Scholar] [CrossRef]
  15. Lü, Y.; Fu, B.; Feng, X.; Zeng, Y.; Liu, Y.; Chang, R.; Sun, G.; Wu, B. A Policy-Driven Large Scale Ecological Restoration: Quantifying Ecosystem Services Changes in the Loess Plateau of China. PLoS ONE 2012, 7, e31782. [Google Scholar] [CrossRef] [PubMed]
  16. Chen, Y.; Bai, L.; Jiao, J.; Wang, N.; Li, J.; Xu, Q.; Yan, X.; Tang, B. Recognition of suitable small watersheds for check dam construction on the Loess Plateau. Land Degrad. Dev. 2023, 34, 4441–4455. [Google Scholar] [CrossRef]
  17. Li, Y.; Li, Y.; Fang, B.; Wang, Q.; Chen, Z. Impacts of ecological programs on land use and ecosystem services since the 1980s: A case-study of a typical catchment on the Loess Plateau, China. Land Degrad. Dev. 2022, 33, 3271–3282. [Google Scholar] [CrossRef]
  18. Liu, B.; Jia, X.; Shao, M.a.; Jia, Y. Assessing soil water recovery after converting planted shrubs and grass to natural grass in the northern Loess Plateau of China. Agric. Water Manag. 2022, 264, 0378–3774. [Google Scholar] [CrossRef]
  19. Yunlong, W.D.C. Evaluation of Ecological Restoration Effects in China: A Review. Prog. Geogr. 2009, 28, 622–628. [Google Scholar]
  20. Zexing, S.; Wenyi, L.; Jiamin, L. Evaluation of comprehensive benefit for ecological restoration in Shannxi Province. Acta Ecol. Sin. 2022, 42, 2718–2729. [Google Scholar]
  21. Niu, L.; Shao, Q.; Ning, J.; Yang, X.; Liu, S.; Liu, G.; Zhang, X.; Huang, H. Evaluation on the degree and potential of ecological restoration in Loess Plateau. J. Nat. Resour. 2023, 38, 779–794. [Google Scholar] [CrossRef]
  22. Fan, C.Z.; Liang, H.E.; Haijie, Y.I.; Xiaoming, X.U.; Zou, Y.; He, J.; Lu, D.; Zhang, X. Hydrologic and sediment responses to ecological restoration in different geomorphological and vegetation type areas in past 70 years. Acta Ecol. Sin. 2023, 43, 3247–3260. [Google Scholar]
  23. Wang, Z.Z.; Wang, H.; Feng, X.M.; Wang, X.; Zhang, L.; Fu, B. Evaluation index system of comprehensive benefits of ecological restoration in key ecologically vulnerable regions. Acta Ecol. Sin. 2019, 39, 7356–7366. [Google Scholar] [CrossRef]
  24. Zhao, Y.-H.; Zhang, L.-L.; Wang, X.-F. Assessment and spatiotemporal difference of ecosystem services value in Shaanxi Province. Minist. Educ. Key Lab. 2011, 22, 2662–2672. [Google Scholar]
  25. Tian, Q.L.; Xu, X.M.; Lyu, D.; Wang, H.J.; Lei, S.Y.; Yi, H.J.; He, J.; He, L.; Xue, F.; Zhou, Y.D. Relationship between geographical pattern of plant diversity and environmental factors in Beiluo River Basin. China Environ. Sci. 2021, 41, 4378–4387. [Google Scholar] [CrossRef]
  26. Ran, D.C. Water and Sediment Variation and Ecological Protection Measures in the Middle Reach of the Yellow River. Resour. Sci. 2006, 28, 93–101. [Google Scholar]
  27. Qin, W.; Zhu, Q.-K.; Liu, G.-Q.; Zhang, Y. Regulation effects of runoff and sediment of ecological conservation in the upper reaches of Beiluo River. Shuili Xuebao/J. Hydraul. Eng. 2010, 41, 1325–1332. [Google Scholar]
  28. Zhang, J.; Gao, G.; Li, Z.; Fu, B.; Gupta, H.V. Identification of climate variables dominating streamflow generation and quantification of streamflow decline in the Loess Plateau, China. Sci. Total Environ. 2020, 722, 137935. [Google Scholar] [CrossRef] [PubMed]
  29. Xue, F.; Zhang, X.; Zhang, L.; Liu, B.; Yang, Q.; Yi, H.; He, L.; Zou, Y.; He, J.; Xu, X.; et al. Attribution recognition of streamflow and sediment changes based on the Budyko hypothesis and fractal theory: A case study in the Beiluo River Basin. Dili Xuebao/Acta Geogr. Sin. 2022, 77, 79–92. [Google Scholar] [CrossRef]
  30. Yan, R.; Zhang, X.-P.; Yan, S.-J.; Zhao, W.-H. Topographical distribution characteristics of vegetation restoration in the Beiluo River Basin from 1995 to 2014. Dongbei Daxue Xuebao/J. Northeast. Univ. 2016, 37, 1598–1603. [Google Scholar] [CrossRef]
  31. Liu, C. Research Theory and Practice in Hydology and Water Resources; Science Press: Beijing, China, 2004; p. 716. [Google Scholar]
  32. Chen, N.; Ma, T.; Zhang, X. Responses of soil erosion processes to land cover changes in the Loess Plateau of China: A case study on the Beiluo River basin. Catena 2016, 136, 118–127. [Google Scholar] [CrossRef]
  33. Zhang, J.; Zhang, X.; Li, R.; Chen, L.; Lin, P. Did streamflow or suspended sediment concentration changes reduce sediment load in the middle reaches of the Yellow River? J. Hydrol. 2017, 546, 357–369. [Google Scholar] [CrossRef]
  34. Liu, J.; Kuang, W.; Zhang, Z.; Xu, X.; Qin, Y.; Ning, J.; Zhou, W.; Zhang, S.; Li, R.; Yan, C. Spatiotemporal characteristics, patterns, and causes of land-use changes in China since the late 1980s. J. Geogr. Sci. 2014, 24, 195–210. [Google Scholar] [CrossRef]
  35. Liu, J.Y.; Deng, X.Z.; Liu, M.L.; Zhang, S.W. Study on the spatial patterns of land-use change and analyses of driving forces in northeastern China during 1990–2000. Chin. Geogr. Sci. 2002, 12, 299–308. [Google Scholar] [CrossRef]
  36. Liu, J.; Zhang, Z.; Xu, X.; Kuang, W.; Zhou, W.; Zhang, S.; Li, R.; Yan, C.; Yu, D.; Wu, S.; et al. Spatial patterns and driving forces of land use change in China during the early 21st century. J. Geogr. Sci. 2010, 20, 483–494. [Google Scholar] [CrossRef]
  37. Ning, J.; Liu, J.; Kuang, W.; Xu, X.; Zhang, S.; Yan, C.; Li, R.; Wu, S.; Hu, Y.; Du, G.; et al. Spatiotemporal patterns and characteristics of land-use change in China during 2010–2015. J. Geogr. Sci. 2018, 28, 547–562. [Google Scholar] [CrossRef]
  38. Chen, P.F. Monthly NPP Dataset Covering China’s Terrestrial Ecosystems at North of 18° N (1985–2015). J. Glob. Chang. Data Discov. 2019, 3, 34–41. [Google Scholar] [CrossRef]
  39. Zhu, S.H.; Yan, Y.; Shao, H.; Li, C.F. The Responses of the Net Primary Productivity of the Dryland Ecosystems in Central Asia to the CO2 and Climate Changes during the Past 35 Years. J. Nat. Resour. 2017, 32, 1844–1856. [Google Scholar] [CrossRef]
  40. Donghai, L.; Bin, A.; Xia, L.; Qiusheng, W.; Xiaoguang, X. Influence of land-use changes on soil erosion based on geo-information Tupu theory in Zhujiang Delta. In Proceedings of the Geoinformatics 2008 and Joint Conference on GIS and Built Environment: Monitoring and Assessment of Natural Resources and Environments, Guangzhou, China, 28–29 June 2008. [Google Scholar]
  41. Yu, H.; Li, J.; Zhang, C.; Yuan, X.; Huang, Y.; Liu, X. Analysis on spatial and temporal change of land use based on geo-information Tupu. Sci. Soil Water Conserv. 2022, 20, 109–117. [Google Scholar] [CrossRef]
  42. Wang, J.; Shao, J.; Li, Y. Geo-Spectrum Based Analysis of Crop and Forest Land Use Change in the Recent 20 Years in the Three Gorges Reservoir Area. J. Nat. Resour. 2015, 30, 235–247. [Google Scholar] [CrossRef]
  43. King, R.T. Wildlife and Man. NY Conserv. 1966, 20, 8–11. [Google Scholar]
  44. Costanza, R.; d’Arge, R.; De Groot, R.; Farber, S.; Grasso, M.; Hannon, B.; Limburg, K.; Naeem, S.; O’neill, R.V.; Paruelo, J.; et al. The value of the world’s ecosystem services and natural capital. Nature 1997, 387, 253–260. [Google Scholar] [CrossRef]
  45. Xie, G.D.; Lu, C.X.; Leng, Y.F.; Zheng, D.U.; Li, S.C. Ecological assets valuation of the Tibetan Plateau. J. Nat. Resour. 2003, 18, 189–196. [Google Scholar]
  46. Vihervaara, P.; Kumpula, T.; Tanskanen, A.; Burkhard, B. Ecosystem services–A tool for sustainable management of human–environment systems. Case study Finnish Forest Lapland. Ecol. Complex. 2010, 7, 410–420. [Google Scholar] [CrossRef]
  47. Zeng, C.; Li, Y.; Duan, X.; Xu, Y. Assessment and Driving Force Analysis of Ecosystem Service 2022.04.014Value in the Urban Agglomeration Along the Middle Reaches of the Yangtze River. Res. Soil Water Conserv. 2022, 29, 362–371. [Google Scholar] [CrossRef]
  48. Ord, J.K.; Getis, A. Local spatial autocorrelation statistics: Distributional issues and an application. Geogr. Anal. 1995, 27, 286–306. [Google Scholar] [CrossRef]
  49. Wu, Z.; Zhao, S.; Luo, Z.; Chai, B.; Wang, W.; Nie, K. Land Use Change and Its Ecosystem Service Value in Zunyi City. Saf. Environ. Eng. 2023, 30, 252–260. [Google Scholar] [CrossRef]
  50. Zhao, G.; Mu, X.; Wen, Z.; Wang, F.; Gao, P. Soil erosion, conservation, and eco-environment changes in the loess plateau of china. Land Degrad. Dev. 2013, 24, 499–510. [Google Scholar] [CrossRef]
  51. Liu, C.; Jia, X.; Ren, L.; Duan, G.; Shao, M.a. A preliminary investigation of water storage in check-dams across China’s Loess Plateau using electrical resistivity tomography. Hydrol. Process. 2023, 37, 14826. [Google Scholar] [CrossRef]
  52. Dong, H.; Song, Y.; Chen, L.; Liu, H.; Fu, X.; Xie, M. Soil erosion and human activities over the last 60 years revealed by magnetism, particle size and minerals of check dams sediments on the Chinese Loess Plateau. Environ. Earth Sci. 2022, 81, 162. [Google Scholar] [CrossRef]
  53. Li, Z.S.; Yang, L.; Wang, G.L.; Hou, J.; Xin, Z.; Liu, G.; Fu, B. The management of soil and water conservation in the Loess Plateau of China: Present situations, problems, and counter-solutions. Acta Ecol. Sin. 2019, 39, 7398–7409. [Google Scholar] [CrossRef]
  54. Gao, P.; Lei, T. Dynamic process simulation model for soil erosion of small-scale watershed system. Nongye Gongcheng Xuebao/Trans. Chin. Soc. Agric. Eng. 2010, 26, 45–50. [Google Scholar] [CrossRef]
  55. National Forestry and Grassland Administration. Circular of the National Forestry and Grassland Administration on issuing the Technical regulations on the Design of the Operation of grain for green and the measures for Archives Management of grain for green. Natl. Land Resour. Inf. 2020, 40–45, 47. [Google Scholar] [CrossRef]
  56. Yang, K.; Liu, G.; Wu, F.; Sun, B. Hydrological and environmental responses to comprehensive control of soil loss in a typical watershed of hill and gully region of the Loess Plateau. Acta Ecol. Sin. 2008, 28, 2042–2051. [Google Scholar]
  57. Yuan, H.D.; Xin, Z.B.H.J. Models of soil and water conservation in the loess hilly region of China. Acta Ecol. Sin. 2021, 41, 6398–6416. [Google Scholar] [CrossRef]
  58. Zhang, K.; Lv, Y.; Fu, B. Ecosystem service evolution in ecological restoration: Trend, process, and evaluation. Acta Ecol. Sin. 2016, 36, 6337–6344. [Google Scholar]
  59. Seppelt, R.; Dormann, C.F.; Eppink, F.V.; Lautenbach, S.; Schmidt, S. A quantitative review of ecosystem service studies: Approaches, shortcomings and the road ahead. J. Appl. Ecol. 2011, 48, 630–636. [Google Scholar] [CrossRef]
  60. Zhang, J.; Zhang, X.; Hao, M.; Lei, Y.; Liu, J.; Liu, E.; Sun, Y. Potentiality Analysis of Grrain Productivity and Its Security in Changwu County in the Loess Plateau Gully Region against the Background of “Grain for Green” Projection. J. Soil Water Conserv. 2011, 25, 231–235. [Google Scholar]
  61. Liu, X.; Qin, Z.; Li, F. Spatiotemporal changes of the sustainability of grain production system in the Loess Plateau based on Grain for Green Project. Trans. Chin. Soc. Agric. Eng. 2022, 38, 249–257. [Google Scholar]
  62. Goldstein, J.H.; Caldarone, G.; Duarte, T.K.; Ennaanay, D.; Hannahs, N.; Mendoza, G.; Polasky, S.; Wolny, S.; Daily, G.C. Integrating ecosystem-service tradeoffs into land-use decisions. Proc. Natl. Acad. Sci. USA 2012, 109, 7565–7570. [Google Scholar] [CrossRef]
  63. Bateman, I.J.; Harwood, A.R.; Mace, G.M.; Watson, R.T.; Abson, D.J.; Andrews, B.; Binner, A.; Crowe, A.; Day, B.H.; Dugdale, S.; et al. Bringing Ecosystem Services into Economic Decision-Making: Land Use in the United Kingdom. Science 2013, 341, 45–50. [Google Scholar] [CrossRef]
  64. Schmidt, J.P.; Moore, R.; Alber, M. Integrating ecosystem services and local government finances into land use planning: A case study from coastal Georgia. Landsc. Urban Plan. 2014, 122, 56–67. [Google Scholar] [CrossRef]
  65. Chen, W.X.; Chi, G.Q.; Li, J.F. The spatial association of ecosystem services with land use and land cover change at the county level in China, 1995–2015. Sci. Total Environ. 2019, 669, 459–470. [Google Scholar] [CrossRef]
  66. Gaodi, X.; Shuyan, C.; Chunxia, L.; Changshun, Z.; Yu, X. Current status and future trends for eco-compensation in China. J. Resour. Ecol. 2015, 6, 355–362. [Google Scholar] [CrossRef]
  67. Wang, W.; Guo, H.; Chuai, X.; Dai, C.; Lai, L.; Zhang, M. The impact of land use change on the temporospatial variations of ecosystems services value in China and an optimized land use solution. Environ. Sci. Policy 2014, 44, 62–72. [Google Scholar] [CrossRef]
  68. Yue, S.; Zhang, S.; Yan, Y. Impacts of Land Use Change on Ecosystem Services Value in the Northeast China Transect (NECT). Acta Geogr. Sin. 2007, 62, 879–886. [Google Scholar] [CrossRef]
  69. Wang, Z.; Zhang, B.; Zhang, S.; Song, K.; Duan, H. Estimates of loss in ecosystem service values of Songnen plain from 1980 to 2000. J. Geogr. Sci. 2005, 15, 80–86. [Google Scholar] [CrossRef]
  70. Chuai, X.; Huang, X.; Wu, C.; Li, J.; Lu, Q.; Qi, X.; Zhang, M.; Zuo, T.; Lu, J. Land use and ecosystems services value changes and ecological land management in coastal Jiangsu, China. Habitat Int. 2016, 57, 164–174. [Google Scholar] [CrossRef]
  71. Kienast, F.; Bolliger, J.; Potschin, M.; De Groot, R.S.; Verburg, P.H.; Heller, I.; Wascher, D.; Haines-Young, R. Assessing Landscape Functions with Broad-Scale Environmental Data: Insights Gained from a Prototype Development for Europe. Environ. Manag. 2009, 44, 1099–1120. [Google Scholar] [CrossRef]
  72. Yi, H.; Güneralp, B.; Filippi, A.M.; Kreuter, U.P.; Güneralp, İ. Impacts of Land Change on Ecosystem Services in the San Antonio River Basin, Texas, from 1984 to 2010. Ecol. Econ. 2017, 135, 125–135. [Google Scholar] [CrossRef]
  73. Costanza, R.; de Groot, R.; Sutton, P.; van der Ploeg, S.; Anderson, S.J.; Kubiszewski, I.; Farber, S.; Turner, R.K. Changes in the global value of ecosystem services. Glob. Environ. Chang. Part A Hum. Policy Dimens. 2014, 26, 152–158. [Google Scholar] [CrossRef]
  74. Long, H. Explanation of Land Use Transitions. China Land Sci. 2022, 36, 1–7. [Google Scholar]
Figure 1. Location of the Beiluo River Basin. Note: The LHG region is developed from the high and flat loess land in the course of long-term soil erosion. There is a large amount of vegetation cover in the RM region, and the problem of soil erosion is not significant. The soil texture of the LPG region is the same as that of the LHG region, and there is still some flat land that has not completely eroded into gullies. The classification of the four landforms is based on data from Research Theory and practice in Hydrology and Water Resources by Changming LIU [31], which has been used many times by other people studying the Beiluo River Basin [32,33].
Forests 14 01753 g001
Figure 2. Areas of different land-use types in the Beiluo River Basin between 1975 and 2015.
Forests 14 01753 g002
Figure 3. The direction of LUTs in the Beiluo River Basin between 1975 and 2015.
Forests 14 01753 g003
Figure 4. Spatial distribution of LUT features after classification in the Beiluo River Basin. Note: This figure is grouped according to the LUT features in four stages in the Beiluo River Basin, in which “Re–forestation” includes (21, 31, 31, 41, 51, 52, 61, 62, 71, 72, 73); “De–forestation” includes (14, 17); “Degradation” includes (12, 13, 16, 23, 26, 27, 36, 37, 46, 47, 57, 63, 67); “Urbanisation” includes (15, 25, 35, 45, 65, 75); “Land rehabilitation” includes (24, 34, 54, 64, 74); and “Land abandonment” includes (42, 43, 53).
Forests 14 01753 g004
Figure 5. Degree of spatial separation of LUTs in the Beiluo River Basin from 1975 to 2015. Note: The unit of spatial separation is “100%”; because most of the data exceeded 100%, in order to simplify the picture, we simplified 100%, 200%, and so on, to 1, 2, and so on.
Forests 14 01753 g005
Figure 6. Land-use change Tupu patterns in the Beiluo River Basin from 1975 to 2015.
Forests 14 01753 g006
Figure 7. Changes in the ESV in the Beiluo River Basin from 1975 to 2015.
Forests 14 01753 g007
Figure 8. ESV of secondary services in various geomorphological types of the Beiluo River Basin from 1975 to 2015.
Forests 14 01753 g008
Figure 9. Ecosystem service value transfer matrix. Note: The abbreviations of “Qlgh, Gygh, Tssl, and Jdpy” in the figure are the abbreviations for the LHG region, the LPG region, the RM region, and the TP region, respectively. The numbers 1, 2, 3, 4, 5, 6, and 7 are the codes for forestland, shrub, grassland, cultivated land, construction land, water areas, and desert, respectively. P1, P2, P3, and P4 represent the four periods, in chronological order. The vertical axis represents the initial land-use type, the horizontal axis represents the land-use type at the telophase of the study period for the different regions, and the number corresponding to the horizontal and vertical coordinates is the change in ESV. For example, (Qlgh-4,P3-1) means that, after the grassland in the LHG region was turned into forestland in 2010, the ESV decreased by USD 3280.
Forests 14 01753 g009
Figure 10. Moran’s I and its LISA cluster map and LISA significance map of ESV changes.
Forests 14 01753 g010
Table 1. Pattern classification of land-use change Tupu.
Tupu PatternDefinitionExamplesMeaning
Prophase transition typeOnly one change took place between 1975 and 2000.12222, 22444Reflects the LUTs for the time scale.
Middle transition typeOnly changed between 2000 and 2010.22233, 5522
Anaphase transition typeOnly changed between 2010 and 2015.11112, 44443
Repeated transition typeThere have been two or more changes, involving only two types of land use.22112, 22121, 22122, 22212After at least two changes, the early land-use types reappeared in the later stage, highlighting the contradiction between the two land-use types.
Continuous transition typeThere have been more than two changes, involving three or more land-use types.11213, 11231, 14211, 14241The frequency of prominent change is high, and the type of change is diverse.
Table 3. Top 90% of land-use Tupu patterns in each region.
Prophase Transition TypeMiddle Transition TypeAnaphase Transition TypeRepeated Transition TypeContinuous Transition Type
LHG region44333 (0.90%)44433 (23.51%)
33311 (2.21%)
44443 (27.51%)
33332 (6.83%)
33331 (5.88%)
11113 (3.60%)
44442 (2.58%)
44441 (1.62%)
33313 (5.75%)
33433 (2.04%)
44343 (1.03%)
44413 (2.24%)
44431 (2.14%)
44432 (1.80%)
33312 (0.95%)
LPG region——33311 (18.53%)
22211 (10.01%)
44433 (4.10%)
44422 (0.84%)
44443 (10.13%)
33331 (7.23%)
44441 (5.90%)
11113 (3.19%)
33332 (2.37%)
22221 (2.02%)
44442 (1.84%)
11112 (1.27%)
44445 (0.97%)
66663 (0.82%)
33313 (10.08%)
22212 (1.78%)
33312 (5.50%)
22213 (2.79%)
44431 (1.10%)
RM region——33311 (22.56%)
22211 (22.55%)
44433 (1.56%)
11112 (5.96%)
11113 (4.86%)
44443 (4.36%)
44441 (2.39%)
33331 (1.94%)
33313 (7.64%)
22212 (5.50%)
33312 (9.00%)
22213 (2.61%)
TP region——44433 (8.69%)
33311 (5.60%)
44455 (1.67%)
22211 (1.39%)
44443 (29.98%)
44445 (9.25%)
44441 (5.01%)
11113 (4.72%)
33331 (3.76%)
66663 (1.79%)
44446 (1.08%)
33332 (0.88%)
33335 (0.88%)
44442 (0.74%)
33313 (8.69%)
33433 (1.58%)
55455 (0.83%)
44343 (0.75%)
44344 (0.63%)
33312 (1.46%)
44413 (0.69%)
Disclaimer/Publisher’s Note: The statements, opinions and data contained in all publications are solely those of the individual author(s) and contributor(s) and not of MDPI and/or the editor(s). MDPI and/or the editor(s) disclaim responsibility for any injury to people or property resulting from any ideas, methods, instructions or products referred to in the content.

