Article

Extraction of Pine Wilt Disease Regions Using UAV RGB Imagery and Improved Mask R-CNN Models Fused with ConvNeXt

College of Computer and Information Engineering, Central South University of Forestry and Technology, Changsha 410018, China
*
Author to whom correspondence should be addressed.
Forests 2023, 14(8), 1672; https://doi.org/10.3390/f14081672
Submission received: 9 June 2023 / Revised: 19 July 2023 / Accepted: 14 August 2023 / Published: 18 August 2023

Abstract

:
Pine wilt disease (PWD) is one of the most concerning diseases in forestry and poses a considerable threat to forests. Since the deep learning approach can interpret the raw images acquired by UAVs, it provides an effective means for forest health detection. However, the fact that only PWD can be detected but not the degree of infection can be evaluated hinders forest management, so it is necessary to establish an effective method to accurately detect PWD and extract regions infected by PWD. Therefore, a Mask R-CNN-based PWD detection and extraction algorithm is proposed in this paper. Firstly, the extraction of image features is improved by using the advanced ConvNeXt network. Then, it is proposed to change the original multi-scale structure to PA-FPN and normalize it by using GN and WS methods, which effectively enhances the data exchange between the bottom and top layers under low Batch-size training. Finally, a branch is added to the Mask module to improve the ability to extract objects using fusion. In addition, a PWD region extraction module is proposed in this paper for evaluating the damage caused by PWD. The experimental results show that the improved method proposed in this paper can achieve 91.9% recognition precision, 90.2% mapping precision, and 89.3% recognition rate of the affected regions on the PWD dataset. It can effectively identify the distribution of diseased pine trees and calculate the damage proportion in a relatively accurate way to facilitate the management of forests.

1. Introduction

As one of the important tree species in forests, pine trees are extremely vulnerable to pests and diseases during their growth, especially the parasitic attack of pine wood nematode (Bursaphelenchus xylophilus, PWN), which is also the main killer of pine tree wilting [1]. Pine trees affected by pine wood nematode attack are called Pine Wilt Disease (PWD) [2]. PWNs can naturally infect at least 17 species in China, e.g., Pinus armandii, P. bungeana, P. densiflora, P. elliottii, P. kesiya, P. koraiensis, P. luchuensis, P. massoniana. Statistics show that during the 35 years from 1982 to 2017, due to the increase in China’s international trade, PWD has also increased year by year [3], resulting in the death of nearly 50 million pine trees. The death of pine trees has caused economic losses of tens of billions of dollars, and PWD has caused significant damage to China’s forest resources and ecological environment [4]. The initial onset site of PWD is hidden, highly pathogenic, and spreads rapidly. Once a pine tree is infected with PWD, it will die within a few months, and if not managed in time, the entire pine forest will be severely damaged within 3–5 years [5]. Recognized as the main worldwide quarantine target, PWD has caused irreparable damage to the economy and forests [6]. Therefore, the question of how to effectively isolate and accurately diagnose PWD has always been the top priority of forestry workers and researchers.
Currently, PWD’s prevention and control methods are mainly divided into two categories. The first category is defense. For example, customs and border defense conduct random inspections on imported wood to determine whether they carry alien species or pathogenic sources. The second category is governance. When PWD is found, the diseased pine trees are cut down and burned to prevent the PWD disease from infecting other pine trees [7]. Since there is no practical method to control PWD, it can only be prevented and controlled by the timely discovery of PWD and then cutting and burning the infected trees. The premise of governance is to find PWD. The earlier the diseased pine trees are detected, the sooner the larger-scale spread can be prevented, and the loss can be reduced. Therefore, a large number of studies have focused on PWD detection.
Pine trees are evergreen in healthy conditions, but if diseased, the leaves will change color [8]. Therefore, traditional PWD detection mainly relies on field surveys by pest experts, visual observation, or collecting samples of suspected diseased trees for microscope detection. After pine trees are infected with diseases, the yellowing symptoms first appear at the top, and the withering speed is breakneck. It is difficult to identify the diseased pine trees by observing from the bottom up in field investigation. Due to mountainous constraints, the fieldwork approach is time-consuming and inefficient, which delays early detection and response to the PWD pandemic [7,9]. With the development of resource satellites, the difficulties of field inspections have been eased. Because of their wide field of view and the ability to be digitized, resource satellites are used by researchers to obtain remote sensing data for detecting PWD. After pine trees are attacked by pine wood nematode disease, the chlorophyll and water content in the body will be abnormal, resulting in the peak of the reflected wave in the green band. And the absorption valley in the red band is reduced, so using the green-red difference index is found to be effective in detecting diseased pine in multispectral data [10,11]. Due to the diversity of forest species, different plants will also produce similar spectra, which will lead to misidentification in the detection process of the green–red difference index method. To solve the problem wherein different objects have similar reflections, a spatial-temporal variation-based index method is proposed to improve the accuracy of identifying sick pines [12]. This kind of color index method has certain significance for the detection of diseased pines. However, it has the shortcomings of low automation and poor generalization performance.
With the development of technology and the improvement of forestry demand, higher requirements are put forward for the detection of PWD. Although satellite remote sensing images have a certain effect on large-scale forest disease surveys [13], satellite remote sensing images are expensive to collect, have a long revisit cycle, and are easily affected by weather. As a result, the way satellites acquire images is not suitable for accurate monitoring of small forest areas and canopy diseases than drones. Therefore, UAVs are considered to have great potential in exploring complex woodlands due to their good maneuverability, low cost, and ability to carry a variety of sensors, and have gradually become the major means of obtaining PWD monitoring data [14]. At the same time, in order to improve the degree of automation, traditional machine learning methods are used for the detection of PWD. Traditional machine learning methods first need to extract features from images, such as using methods like Scale-invariant Feature Transform (SIFT) [15] and Histogram of Oriented Gradient (HOG) [16]. Then, they identify PWD by using classification algorithms which include Logistic Regression (LR), K-Nearest Neighbors (KNN), Random Forest (RF), Support Vector Machine (SVM), etc. [17,18,19,20]. Traditional machine learning proves that they can effectively improve the efficiency and accuracy of PWD detection [21,22], but this requires manual participation in the design of feature factors, which means this method is not more robustness.
In recent years, deep learning models combine low-level features into abstract high-level features through complex neuron structures or multiple processing layers composed of multiple nonlinear transformations. At the same time, they can overcome the defects of manual feature extraction and have been widely concerned and used [23]. The deep learning models are mainly used in the three major fields of object classification, object detection, and image segmentation. Now the use of deep learning methods for PWD detection mainly focuses on object classification and detection [24,25]. Faster R-CNN and YOLO series algorithms, as representatives of deep learning models, show better detection results than traditional machine learning when used to detect diseased pine in multispectral images obtained by drones. In terms of PWD detection accuracy, Faster R-CNN is higher than Yolo. In terms of PWD detection speed, the Yolo algorithm is faster than Faster R-CNN [26,27,28]. Since the deep learning model for PWD detection has not been thoroughly developed, more researchers have begun to make improvements. The SCA-Net network proposes to retain part of the spatial information in the multispectral image to improve the identification of diseased pine trees [29], but this 2D-CNN cannot completely extract spectral and spatial information at the same time. To solve this shortcoming, the 3D-CNN model is proposed to combine spectral information with spatial information to improve the PWD detection effect of multispectral images [30,31]. The proposals of these methods have effectively proved that deep learning can effectively process multispectral images, but multispectral images need to process many data bands and a lot of information, which increases the calculation of deep learning models.
Compared with multispectral cameras, China’s forestry management is currently focusing on drones equipped with digital cameras. When acquiring data of the same area, the amount of data generated by taking pictures with a digital camera is less than that generated by taking images with a multispectral camera, and the imaging time is greatly reduced. Therefore, more studies focus on the use of visible light data for PWD identification, and at the same time prove that visible light can be effectively used for PWD detection. Considering that the original network has too many parameters, adding CBAM attention to the MobileNet network can reduce the parameters and improve the feature extraction ability, which is beneficial to improve the detection speed [32]. The scales between each species in the forest are diverse. The problem of multiple scales occurs when convolutional networks detect visible image data, leading to poor recognition of small-scale diseased pines. Therefore, in order to improve the detection accuracy at different scales, a multi-level fusion residual feature pyramid structure is proposed to solve this problem, which also leads to an increase in the required hardware resource consumption [33]. The attention mechanism mimics human vision to focus on hot information and ignore irrelevant information, which is widely used in detection networks. Among them, the MSSCN algorithm proposed by adding a multi-scale spatial attention module to the full convolutional machine network is proven to be effective for obtaining improved detection accuracy of PWD at different scales [34]. To balance the scale and speed problems, the DDyoloV5 algorithm proposes the use of hybrid dilation convolution (HDC) with efficient channel attention (ECA) for capturing contextual information of targets at different scales to improve the PWD detection accuracy and detection speed effectively [35]. The existing methods to classify and locate PWD can improve the forestry department’s ability to locate diseased pine trees. However, they cannot extract and calculate the areas affected by PWD, which hinders the forestry department’s evaluation and management of PWD. To be able to evaluate the affected area while detecting PWD, we propose a multi-scale PWD detection and evaluation algorithm. The algorithm is based on Mask R-CNN to improve the basic framework and make the following contributions:
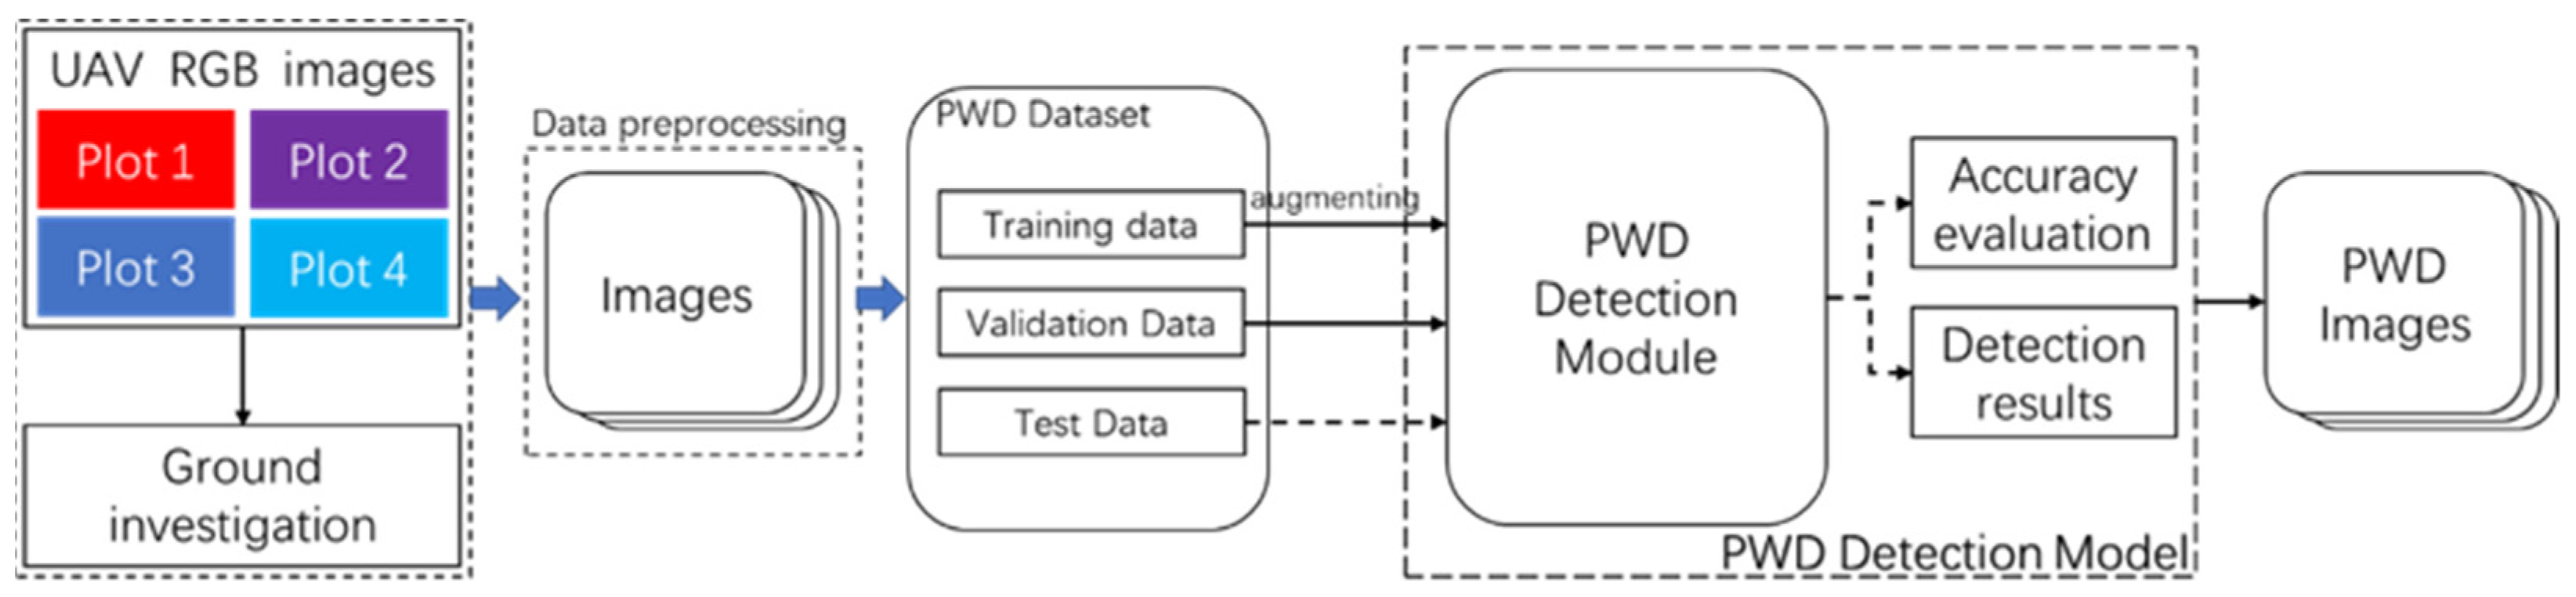
  • A UAV is used to take RGB images of the diseased area and make a PWD dataset.
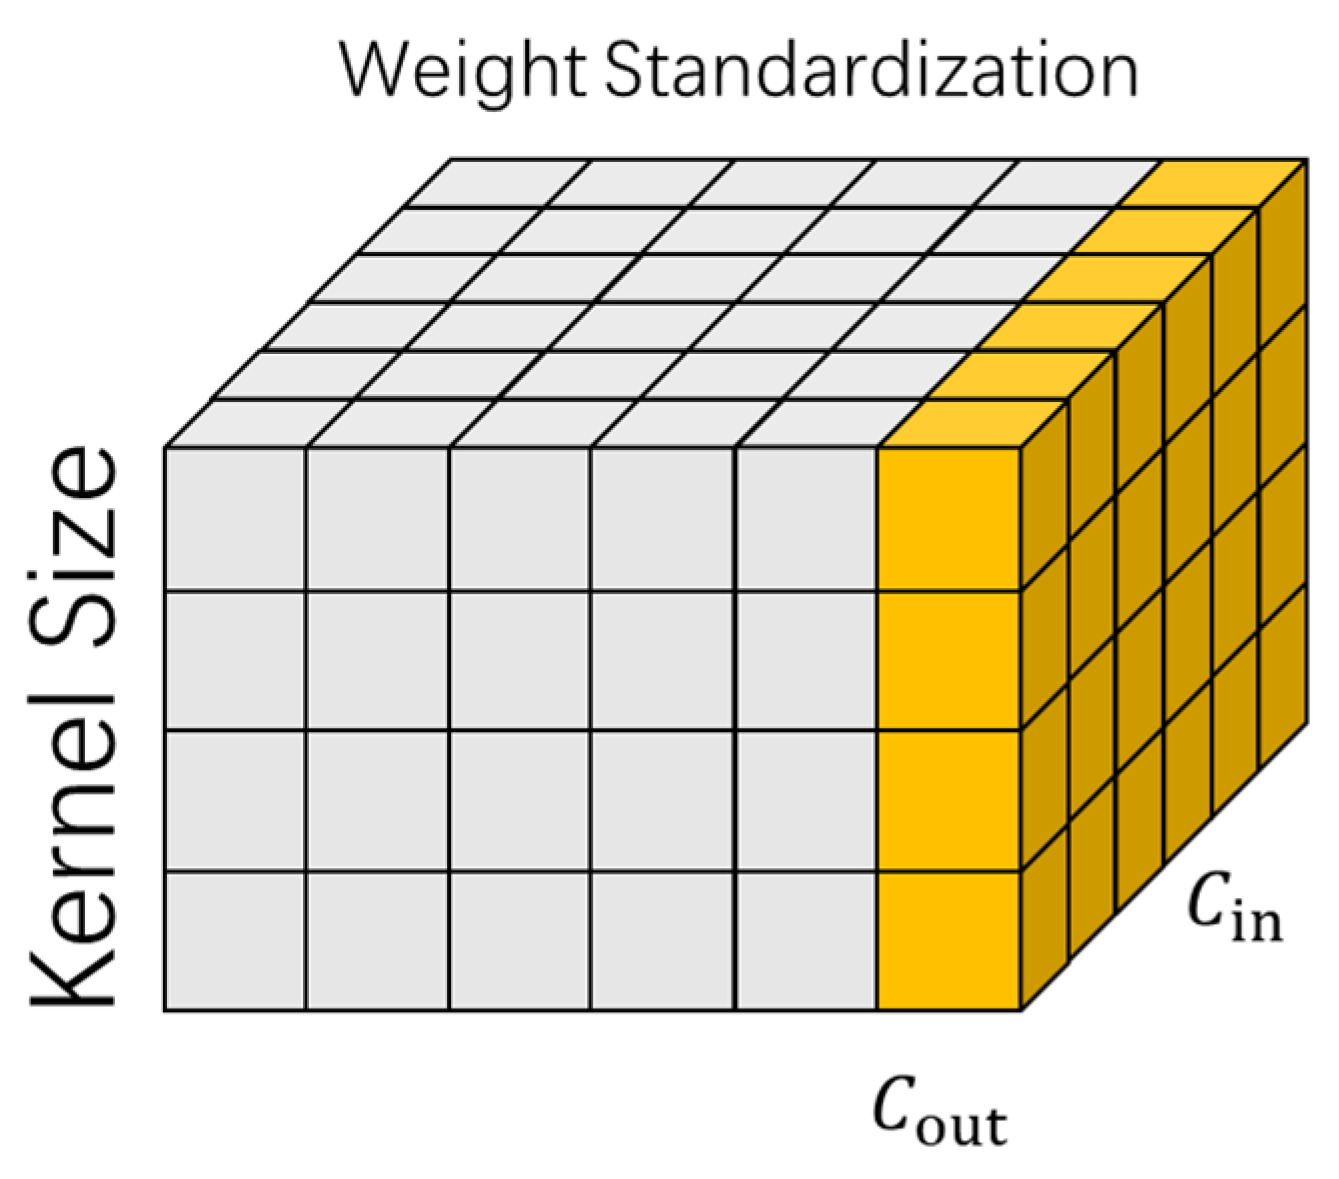
  • Aiming at the problem that the original FPN has an extensive information exchange span, the PA-FPN structure is introduced. At the same time, the GN and WS methods are proposed for normalization operations to achieve effective feature extraction with low resource consumption.
  • For the problem of PWD area extraction, the mask module is improved, and a branch is added to improve the fineness of PWD area extraction.
  • A contour pixel extraction module is proposed to extract and evaluate PWD regions.

2. Materials

2.1. Study Area

The study site is located in Hunan Province, China (24°38′–30°08′ N, 108°47′–114°15′ E, shown in Figure 1a), which is rich in forest vegetation types, mostly mixed broadleaf-coniferous forests. To ensure the generalization ability, we selected four areas suffering from pine wilt disease as the sample areas for data collection (as shown in Figure 1b), including Changsha (CS), Xiangtan (XT), Yiyang (YY), and Huaihua (HH) cities; there are various types of pine trees in these areas, and the masson pine is the main one. The experimental site has a humid subtropical monsoon climate with mild climate, four distinct seasons, concentrated rainfall, and abundant heat and light resources, with an average annual temperature of about 17 °C.

2.2. Data Acquisition and Preprocessing

2.2.1. UAV Images Collection

In this paper, a UAV (DJI Matrice M300 RTK) equipped with a visible light camera (DJI Zenmuse H20T) is used to collect image data, and the main parameters are shown in Table 1. Due to the limited data available for a single region, four regions were selected as data collection points to improve the model’s generalization capability. From 20 October to 25 October 2020, we chose sunny, no wind or light wind for data collection. Before the flight, the flight parameters were set using the flight control software DJI pilot, in which the frontal and lateral overlaps were set to 80% and 70%, respectively, and the flight altitude and photo acquisition information of each acquisition point was recorded in Table 2. During the flight, the GPS carried by the UAV was used for positioning, and detailed information on the location and flight altitude of each image was recorded. Finally, the 565 RGB images in JPG format acquired throughout the flight were stitched together using Photoscan software (Version number is v1.2.5) to generate an orthophoto image (DOM) of each acquisition point. Geometric correction of the DOM was also performed on the ground with handheld GPS to facilitate subsequent dataset production.

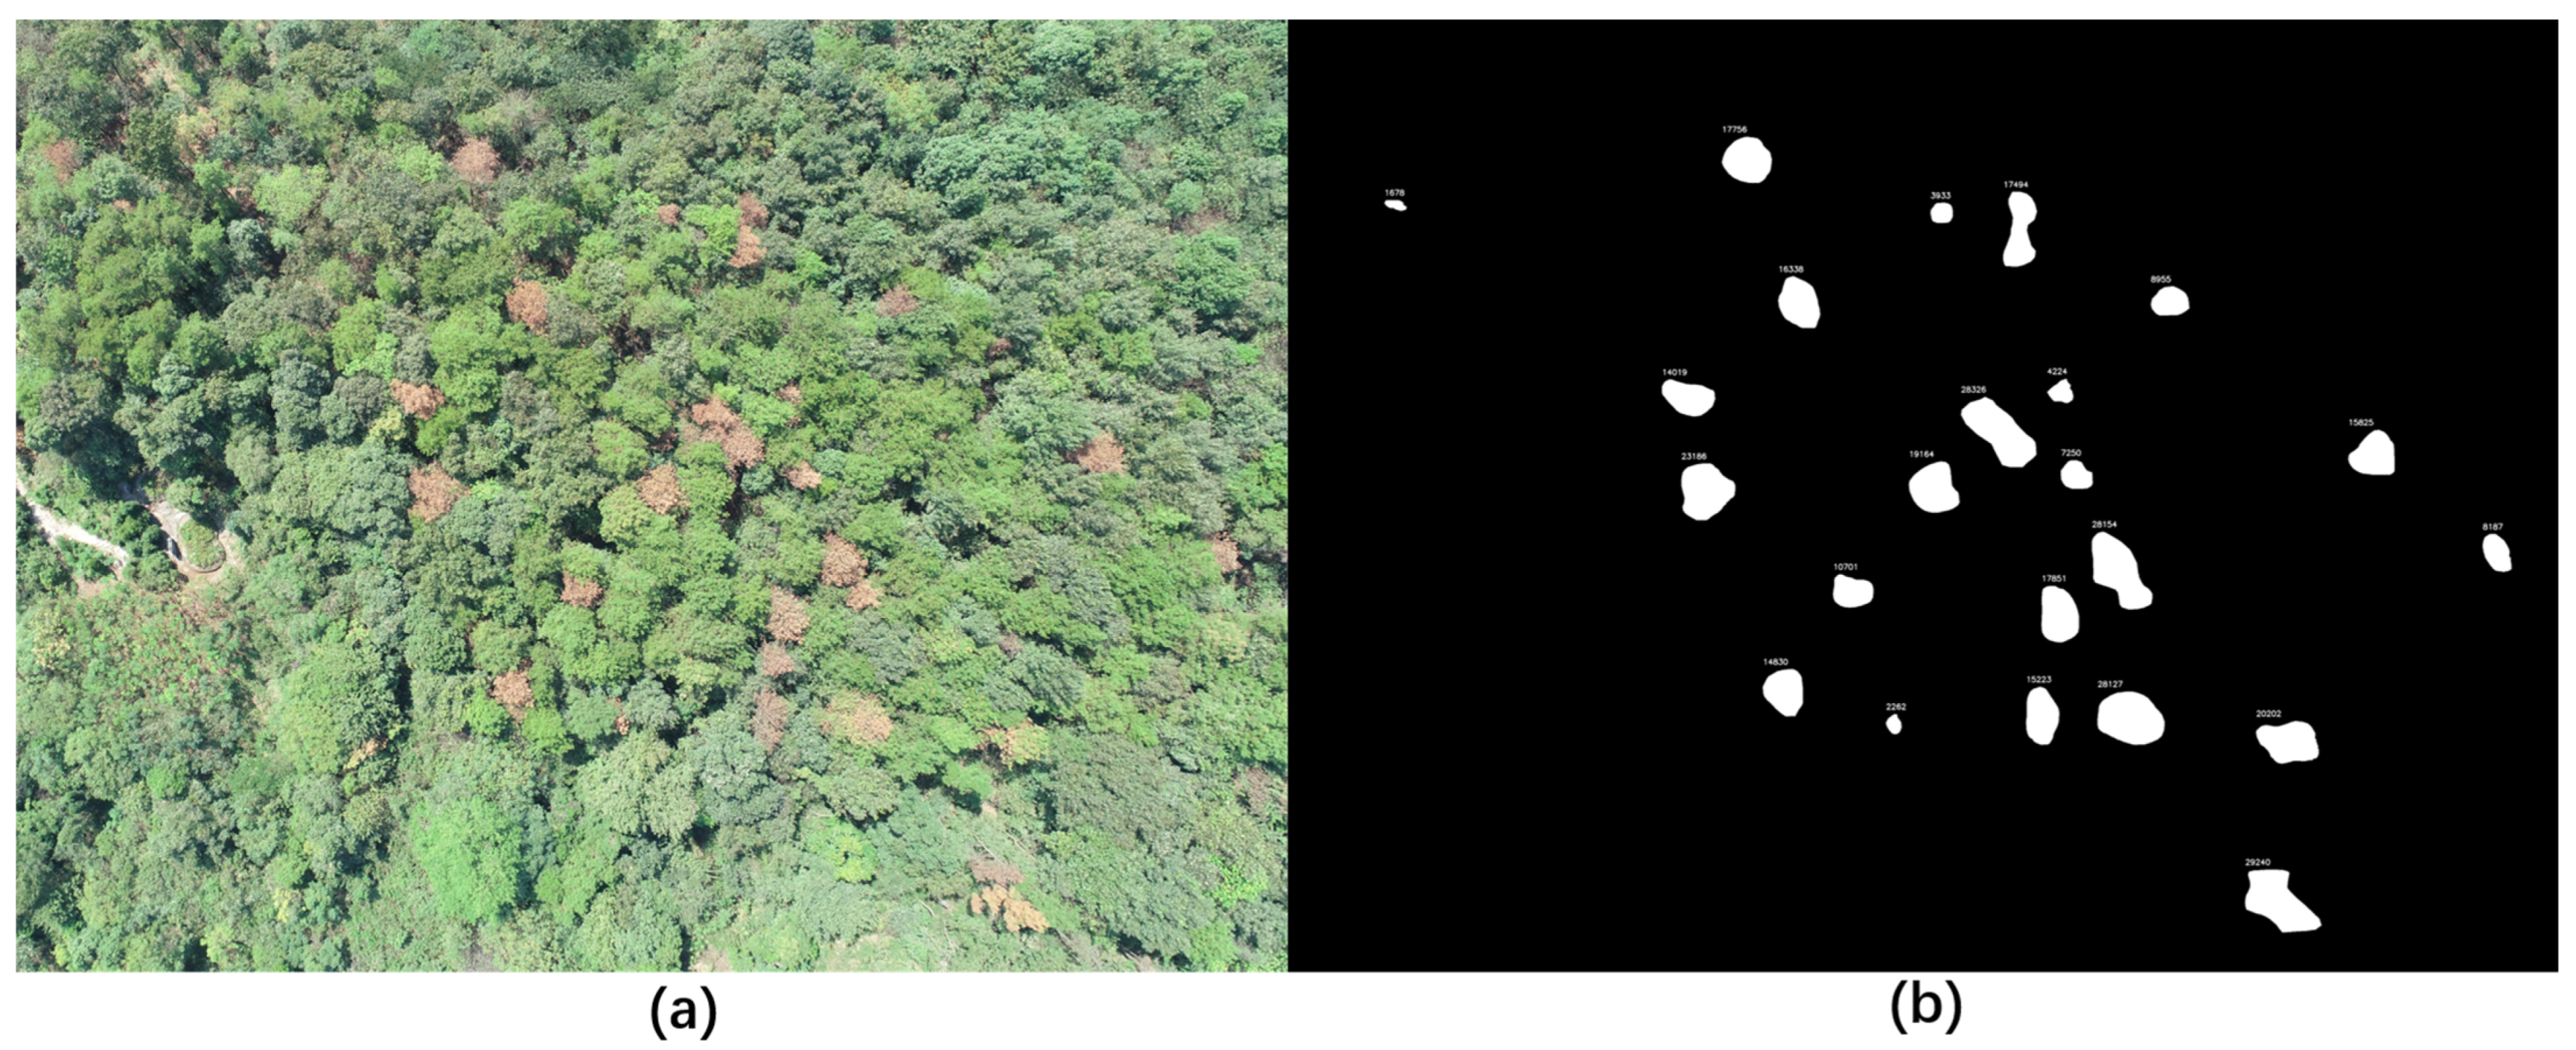
2.2.2. Data Processing and PWD Dataset

We cropped the stitched magnitude images for better model training. Image copping produces many background images that do not contain PWD, which were unsuitable for training the model. Therefore, according to whether the pine trees contain PWD or not, a forester with more than ten years of experience visually decoded the cropped images, as shown in Table 3, and filtered out 1172 images containing PWD, with a size of 1024 × 1024 and the format of jpg. To verify the accuracy of the visual interpretation, we randomly selected 100 images at four locations. Then, we used GPS coordinate points for field detection to determine the presence of PWD by visual observation of needle color and sap secretion, etc. At the same time, branches were cut for retention sample analysis. Finally, 99 of the 100 randomly selected images contained diseased pine trees, and the success rate of the visual inspection was up to 99%. This also shows that visual recognition has high accuracy and can be used in the production of data sets.
We randomly divided the screened images from the acquisition points into 70% training set, 10% validation set, and 20% test set. Due to the small amount of filtered training data, the model can be easily overfitted during training. Therefore, in this paper, horizontal flipping, vertical flipping, random rotation, and random cropping were used to enhance the images of the training set [36].

3. Methods

3.1. Overall Workflow

Pine trees go through three stages from disease to death: early, middle, and late. Early diseased pines will only have a slight discoloration at the top, mid-stage diseased pines will have extensive yellowing, and late diseased pines will be wholly wilted and discolored. Through visible light in the monitoring of the early diseased pine trees will be a largely missed identification, and the time to mid-stage diseased pine trees is very short [37], so the detection of this paper will focus on the detection and extraction of the affected area in the middle and late stages. To improve the accuracy of detection with lower resource consumption, this paper deals with three aspects from data acquisition and processing: PWD production and detection model, respectively. The overall flow of our experiments is shown in Figure 2. First, UAVs were used to acquire data in four experimental areas selected to be attacked by PWD and actual sampling probes were conducted simultaneously on the ground. Then, the acquired data were cleaned, cropped, and manually tagged as JSON data type using ‘Lableme’ software (Version number is v3.16.5), and the PWD dataset was produced. Finally, the existing segmentation model was improved to enhance the recognition of PWD by the algorithm and the evaluation of the images was output by the model with the detection effect.

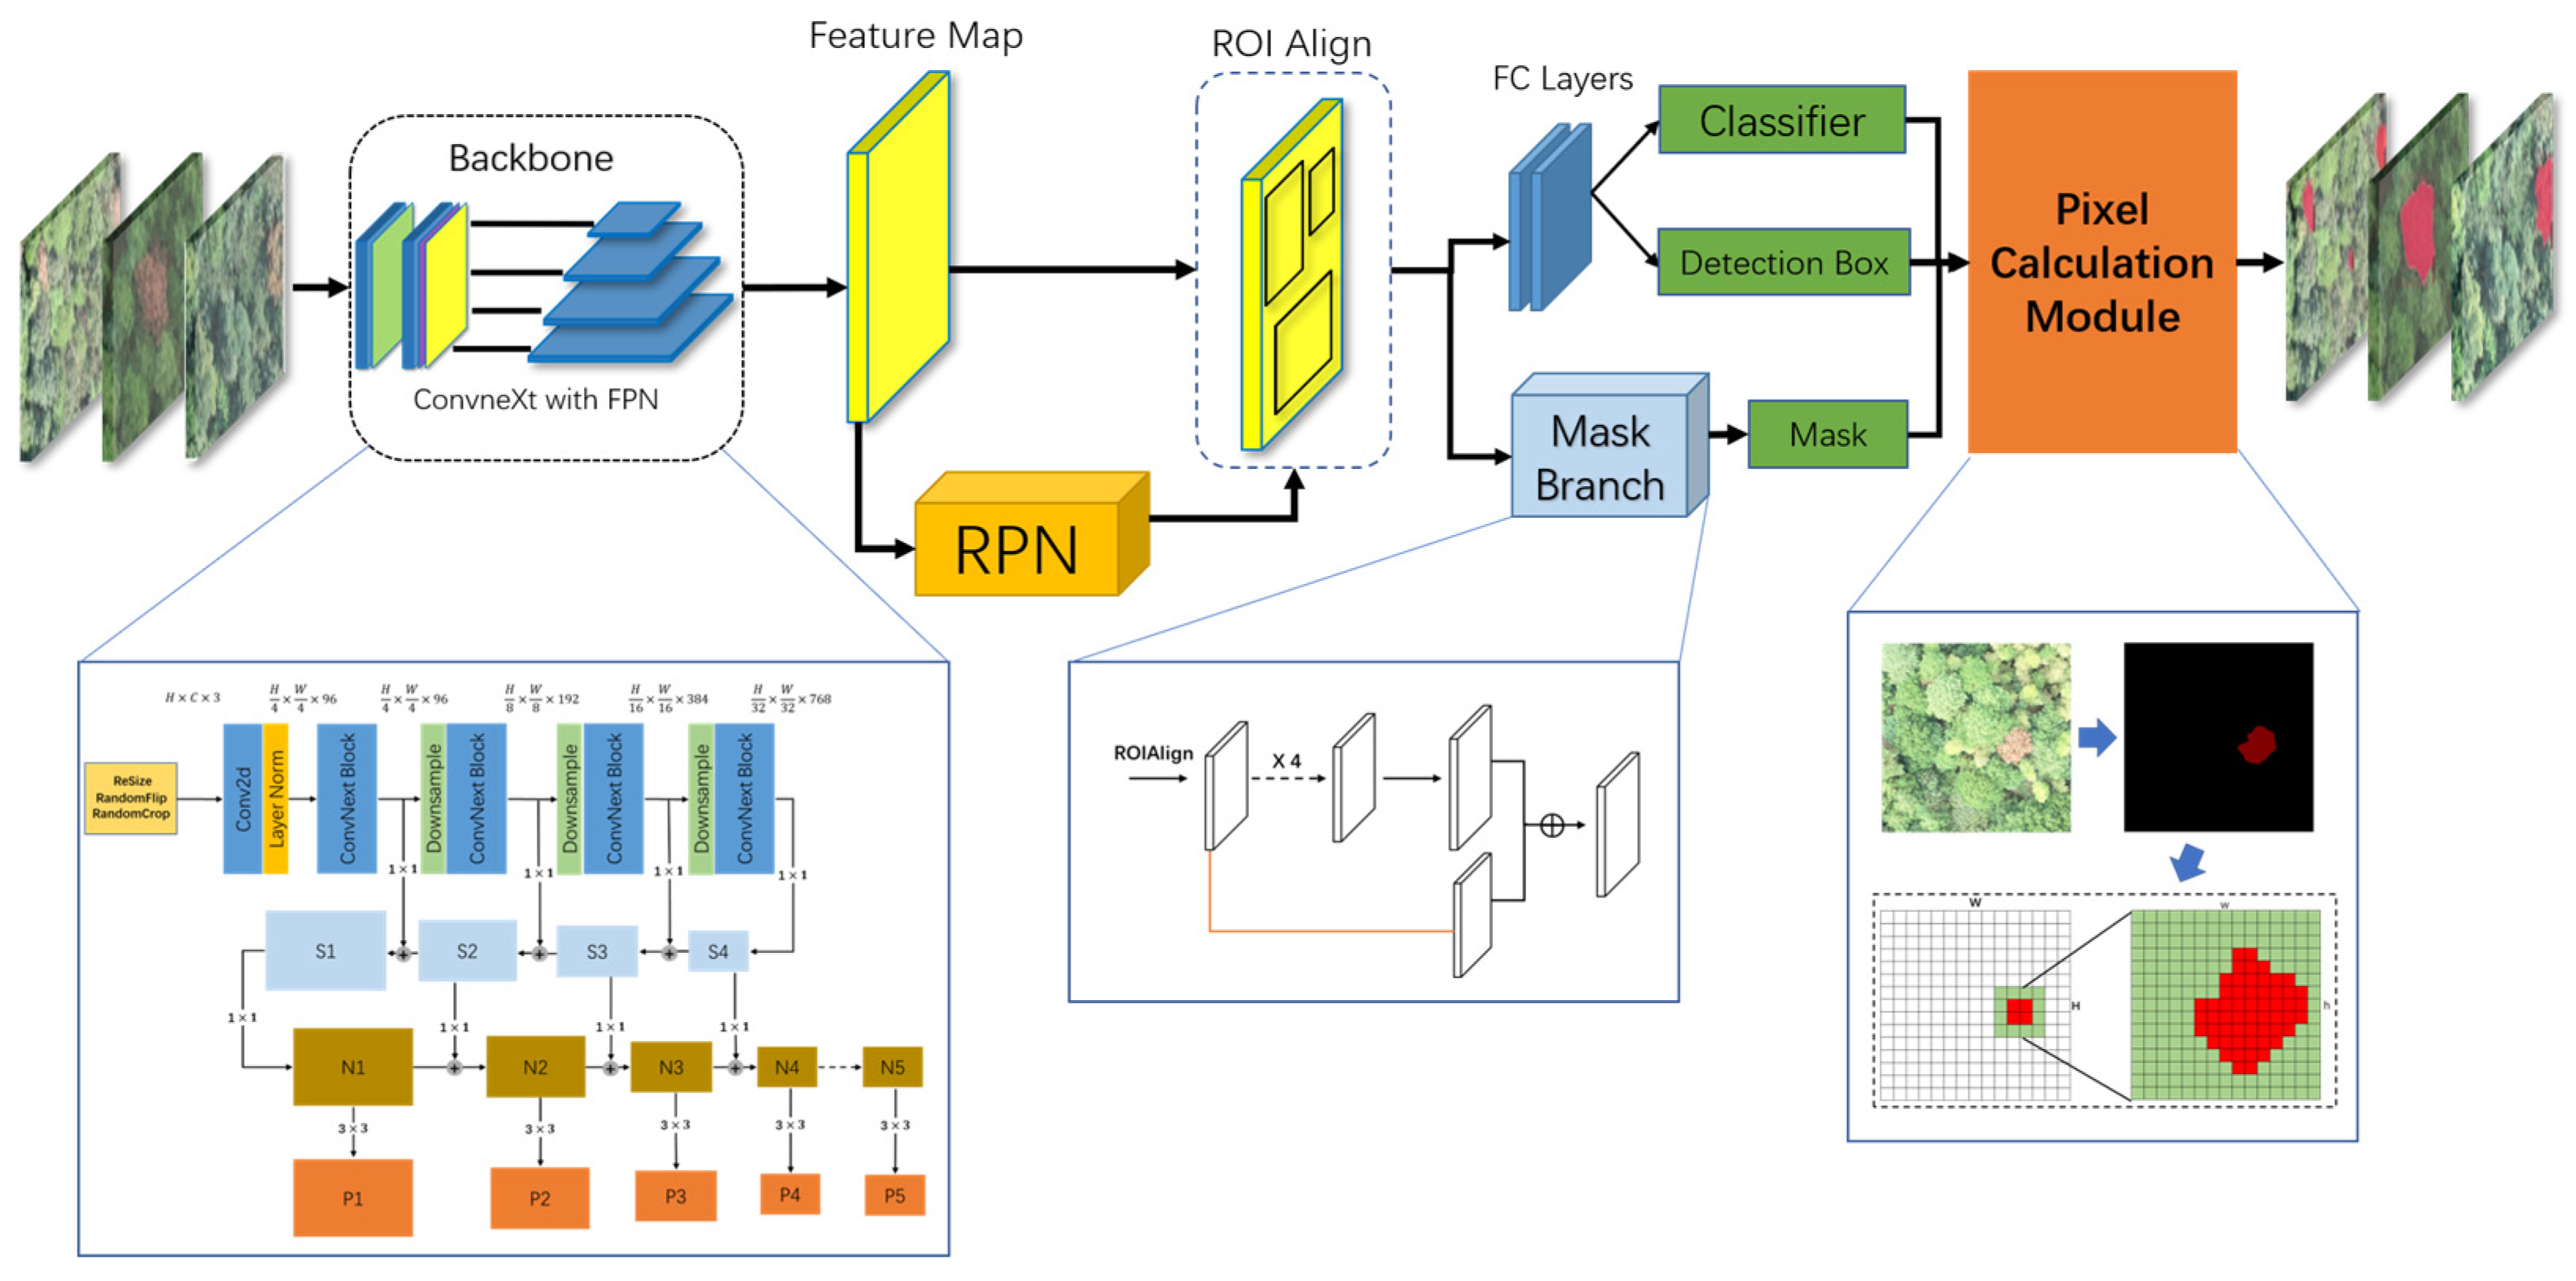
3.2. Improved PWD Detection Model

The basic framework used in this paper is Mask R-CNN, an advanced two-stage image instance segmentation algorithm that can segment objects while recognizing them and is used in several research fields [38]. Through experiments on Mask R-CNN, it was found that the combination of Resnet and feature pyramid structure to extract the features of diseased pine trees is ineffective, and the drawing of diseased pine areas was not good. To effectively improve the recognition and extraction area of diseased pine trees by Mask R-CNN, we propose an improved method based on Mask R-CNN for identifying diseased pine trees and drawing the affected area in UAV images. The overall structure is shown in Figure 3.

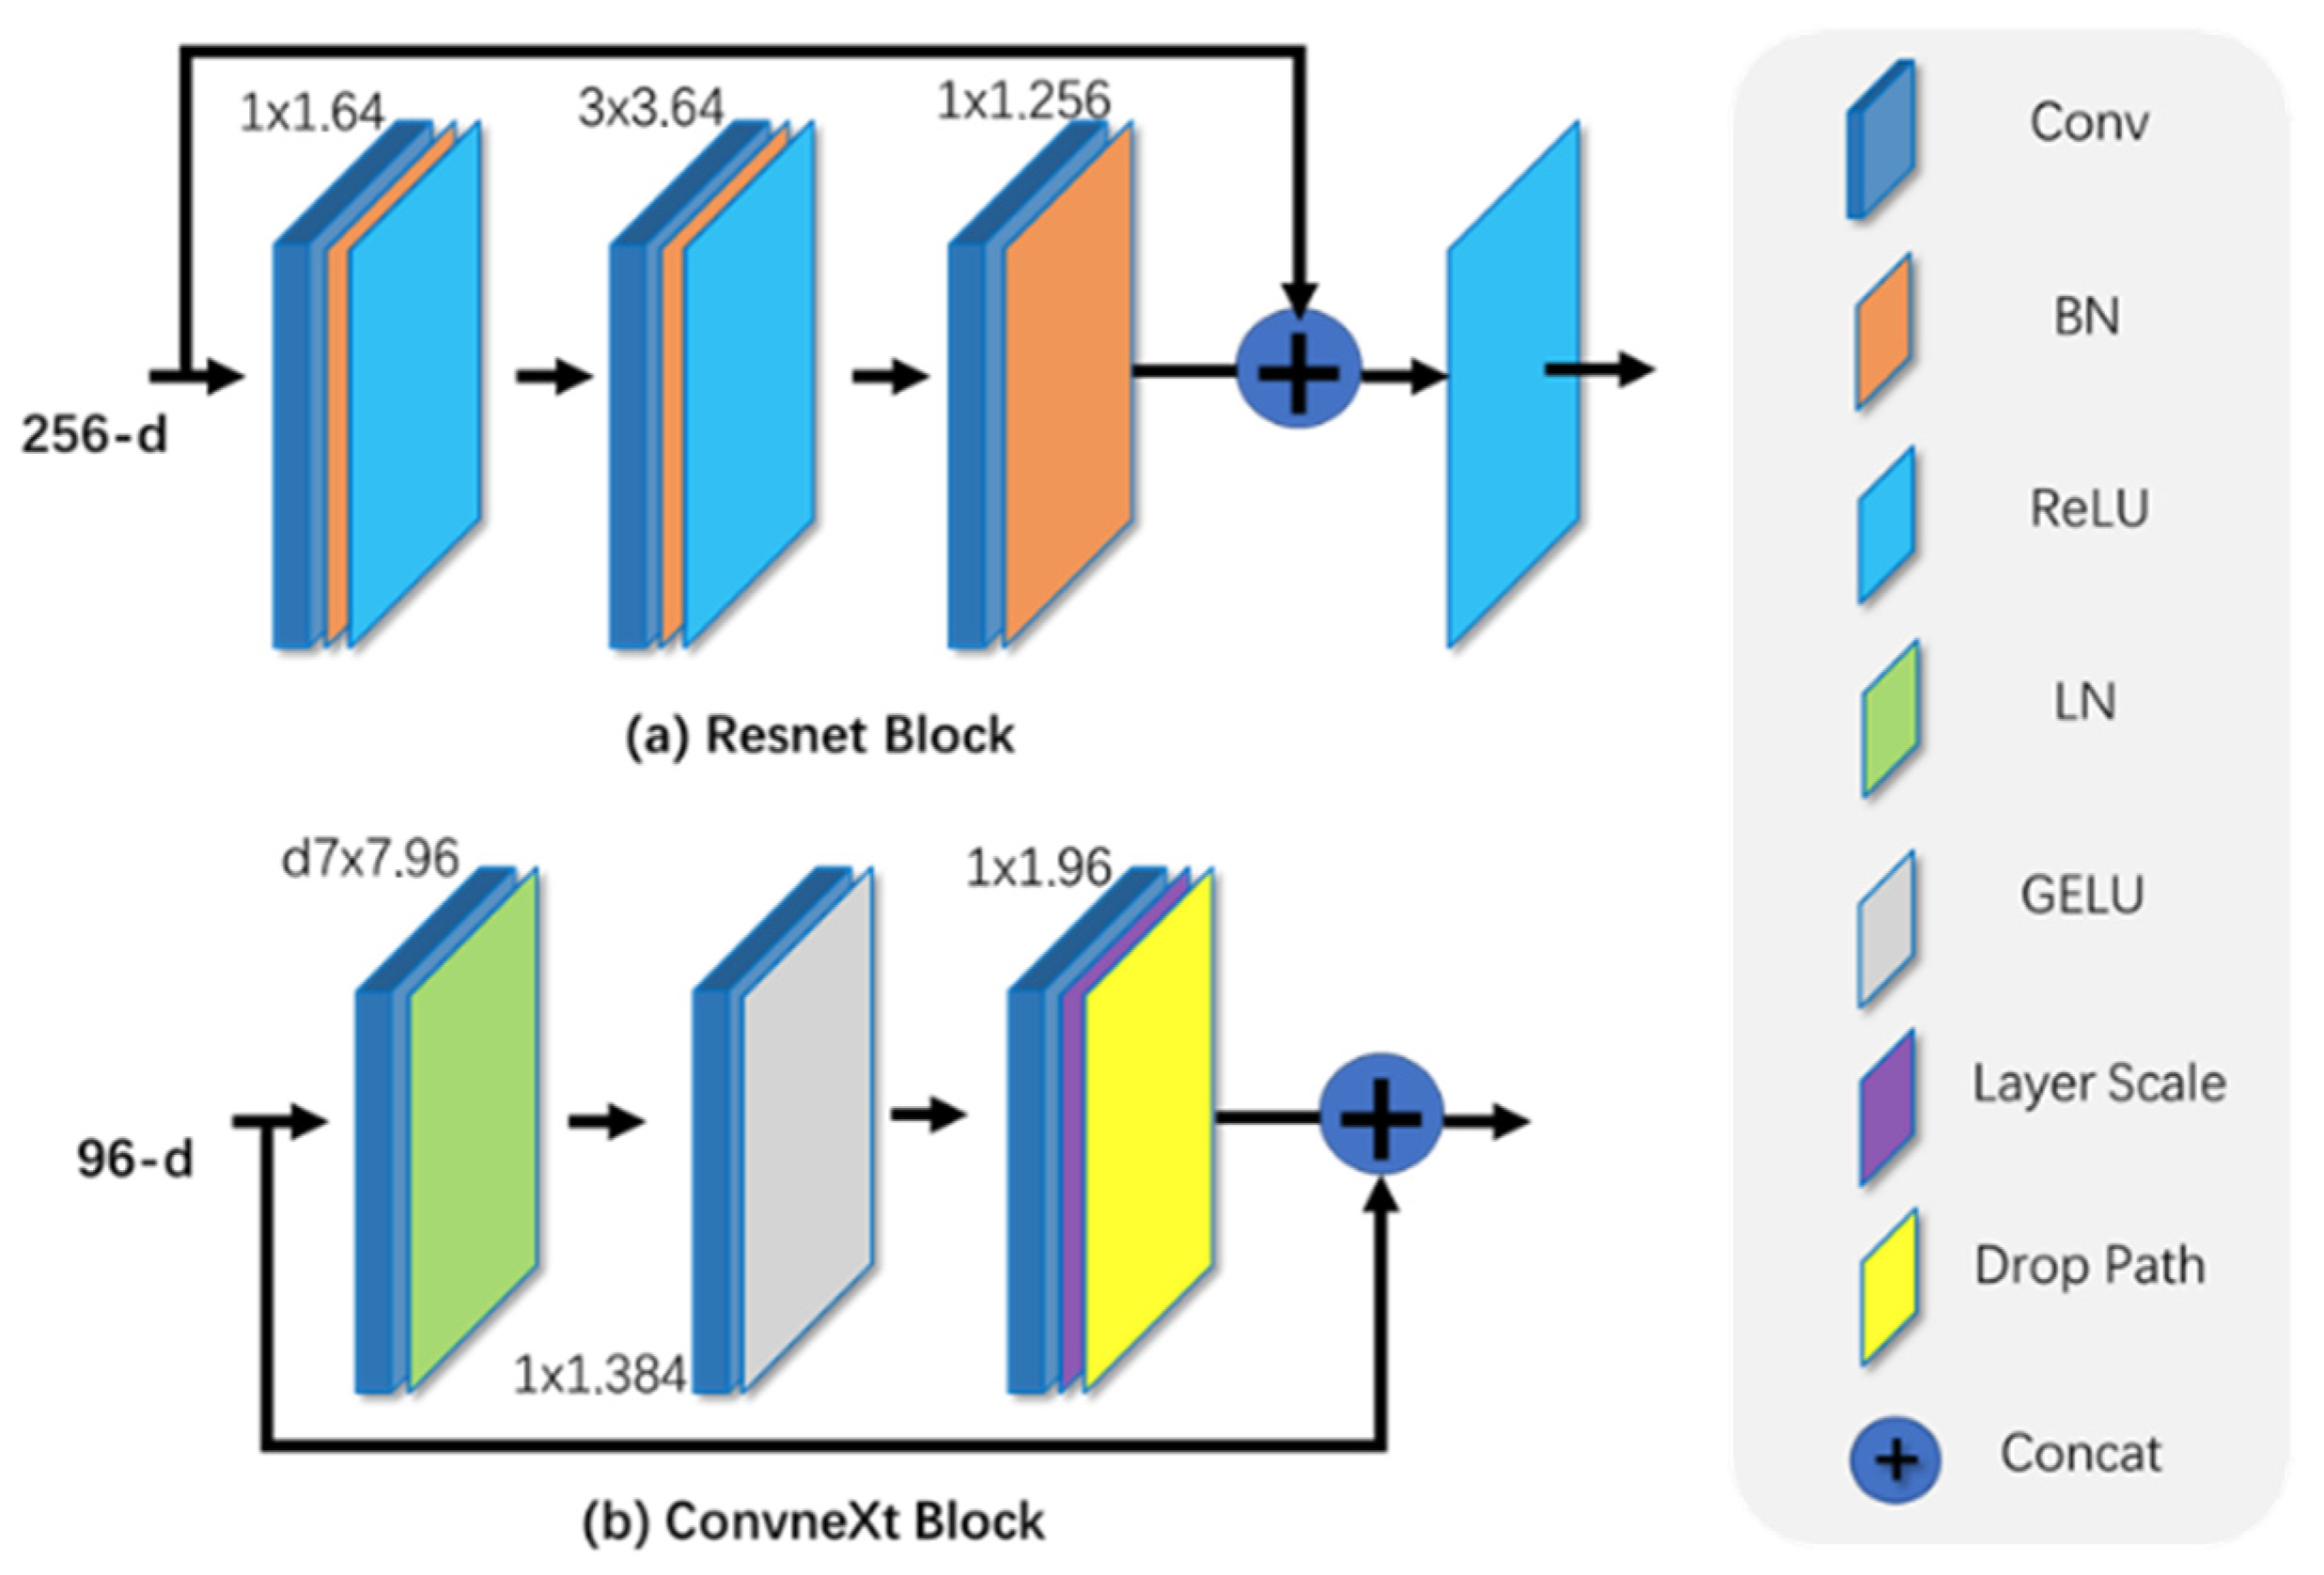
3.2.1. Feature Extraction

The original Mask R-CNN uses Resnet to extract features, but as Transformer dominates in images, the original residual network is gradually replaced or improved by the attention mechanism. Some researchers used the original ResNet and improved it by borrowing the design of Swin-Transformer to generate a ConvNeXt network [39]. The adjustment content of the ConvNeXt network includes stage compute ratio, activation function, data processing method, and network structure. As shown in Figure 3, this paper uses ConvNeXt to extract features, and the specific ConvNeXt Block is shown in Figure 4b. The proposal of the ConvNeXt network has greatly improved the Resnet network and surpassed the Swin-Transformer. Compared with Resnet’s standard convolution calculation, ConvNeXt uses depth-separable convolution, which has the advantages of a smaller number of parameters and a smaller computational workload. At the same time, the reverse bottleneck structure can partially reduce the model’s parameter scale and improve the model’s overall performance while slightly improving the accuracy rate.

3.2.2. Multi-Scale Structure

Unlike multispectral data that use the spectral index method to map the disaster area, this paper uses a deep learning segmentation algorithm to extract the disaster area. Accurate segmentation of the PWD area using deep learning requires more accurate feature information. Because low-level feature maps have high resolution and weak semantic information, high-level feature maps have low resolution and reliable semantic information. Therefore, the original Mask R-CNN uses a feature pyramid structure to solve the problem of different advantages of feature maps at different levels. Although the feature pyramid structure utilizes the information of different feature layers to achieve better feature extraction capabilities, the semantic information extraction is still insufficient for small objects in the forest. In order to obtain better features and improve the prediction ability of the model, the FPN was replaced with PAFPN in this paper. As shown in Figure 5, the PAFPN has an additional bottom-up structure compared to the FPN, and the entire feature hierarchy is augmented with the precise localization signals in the lower layers through bottom-up path enhancement. Moreover, this structure can shorten the information path between the lower and top layer features can be shortened to further improve the segment instances of the model. Due to hardware limitations, only a smaller Batch-size could be used during training. To further enhance the effect, this paper replaced the Batch Normalization (BN) used in PA-FPN with a combination of Group Normalization (GN) and Weight Standardization (WS). The training process is shown in Figure 6. The improved overall structure is called GWP.
Group Normalization (GN): As shown in Figure 7, this is a schematic diagram of BN and GN. Because the calculation result of the BN layer depends on the current Batch-size, when the Batch-size is small, the mean and variance of the batch data are less representative, so it has a greater impact on the final result. Group Normalization can perform normalization in the same group of the same feature map, so that the normalization operation has nothing to do with the Batch-size. The normalized formula of GN is shown in Equations (1) and (2). where xi are the coordinates of the four dimensions, and x is the feature computed by a layer,   i = i N , i C , i H , i W .
  x ^ i = 1 σ i x i μ i
  y i = γ x ^ i + β
where
  μ i = 1 m k S i x k
σ i = 1 m k S i x k μ i 2 + ϵ
  S i = K N = i N , k C C G = i C C G
Here, k C and i C both denote channels, S i denotes the set of points for calculating the mean and standard deviation, k denotes the four-dimensional point coordinates in the case k C = i C , and G is a hyperparameter (G = 32 by default). C G is the number of channels per group.
Figure 7. Batch normalization and Group Normalization.
Forests 14 01672 g007
Weight Standardization: Figure 8 shows a schematic diagram of Weight Standardization. The original normalization is normalized after the convolution process and before the activation function. The Weight Standardization directly processes the weight in the convolution, which can better solve the dependence on the Batch-size during training. As shown in Equations (6) and (7), assuming there are X convolution kernels, X channels will be generated, and the Weight Standardization will perform X operations at this time.
  W ^ = W ^ i , j W ^ i , j = W i , j μ W i , · σ w i , ·
  y = w ^ x
where
  μ W i , · = 1 I j = 1 I W i , j
σ W i , · = 1 I j = 1 I W i , j 2 μ w i , · 2 + ϵ
where, W ^ R O × I represents the weight in the layer, and * represents the convolution operation. For W ^ R O × I , O is the number of output channels ( C o u t in Figure 9), I = C i n × K e r n e l _ s i z e . In Weight Standardization, instead of directly optimizing the loss on the original weights W ^ , we reparametrize the weights W ^ as a function of W.

3.2.3. Mask Branch

The original Mask R-CNN uses classification confidence to evaluate the segmentation quality score, which will lead to poor segmentation quality. To improve the effect of segmentation, we improved the Mask Branch to enhance the accuracy of segmentation. The improved structure is shown in Figure 9. A yellow branch was added to perform the Concat operation with the original feature layer, and then a new mask was generated. At the same time, Batch Normalization (BN) is replaced by a combination of Group Normalization (GN) and Weight Standardization (WS), which can improve the segmentation accuracy in the case of low Batch-size training.

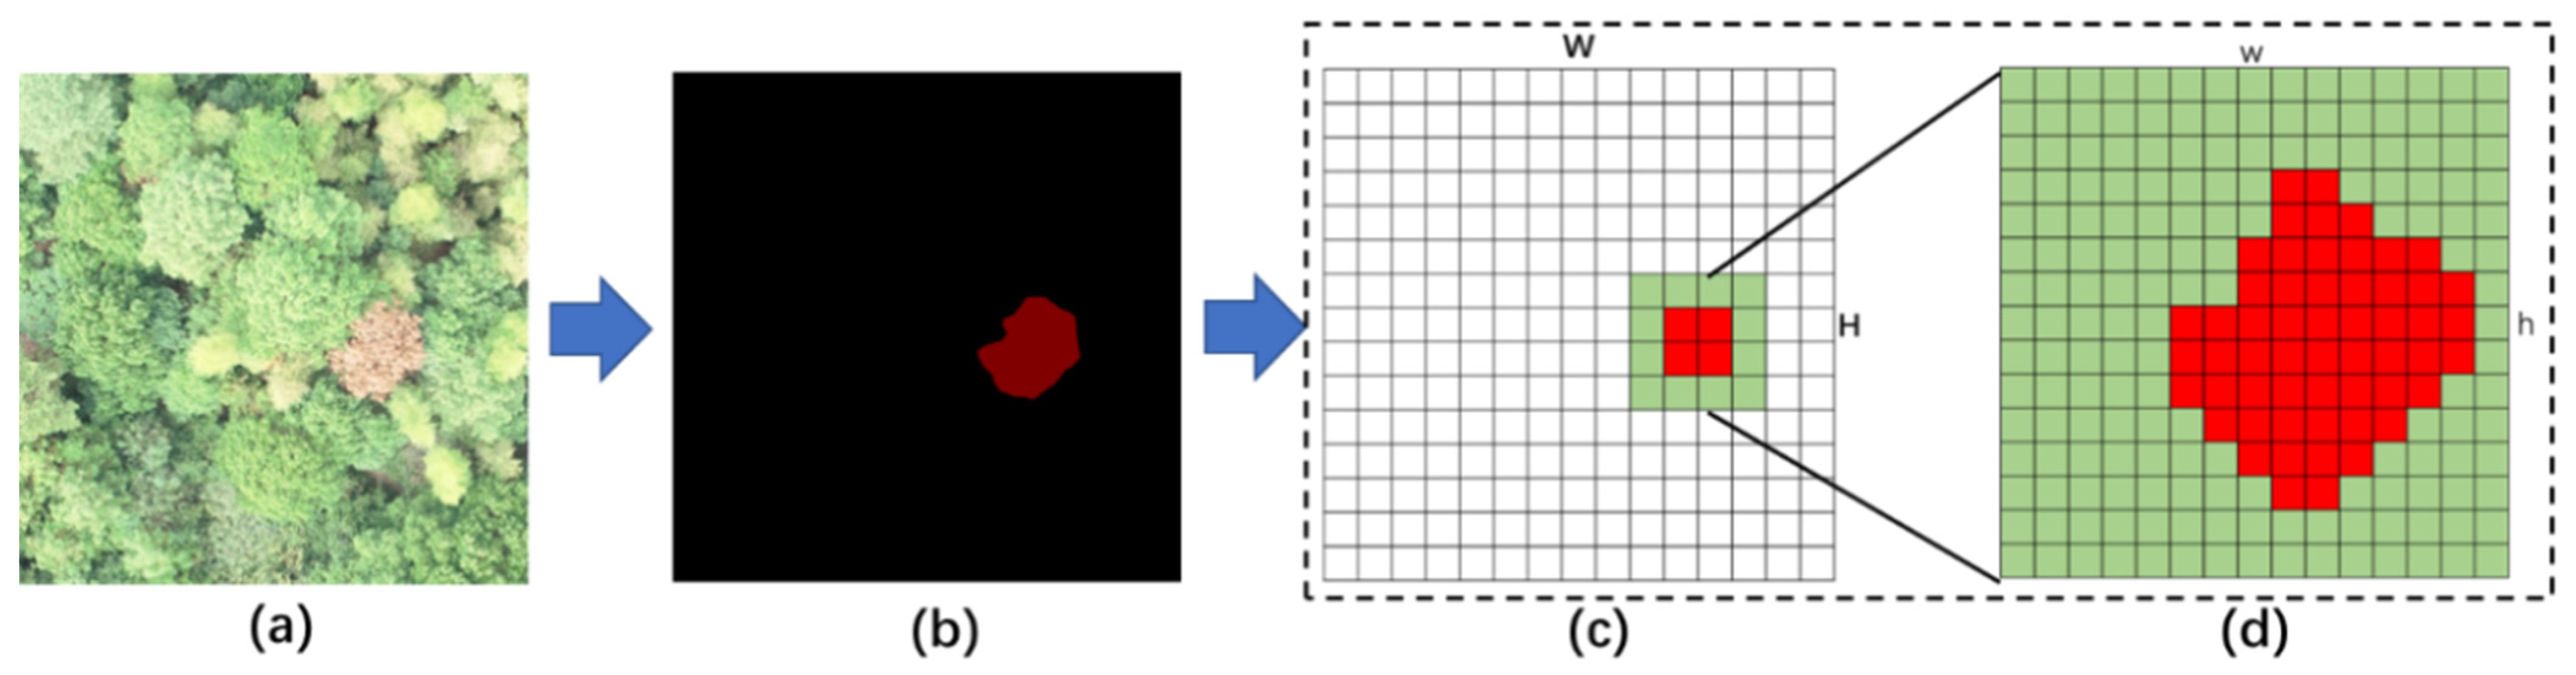
3.2.4. Pixel Calculation Module

The function of this module is to extract the segmented disaster region and calculate the pixels. Here we used pixel blocks to calculate the pixels of each infected pine tree in a single image, and then add them up to the total pixels of infected pine trees in a single image, and finally calculate the damage ratio of a single image and draw the affected area of a single image. At the same time, by stitching together the single images, the disaster area in the complete aerial image can be mapped. In order to facilitate the calculation and output of the position information of the diseased pine trees, we kept the GPS of the center point of each picture in the image. As shown in Figure 10, this is the process of extracting each diseased pine pixel after identifying the diseased pine. First, we extracted the pixel blocks of the PWD mask from the segmentation information, then we counted the number of pixel blocks, and finally we calculated the proportion in the image. After the information of each small image was extracted, we stitched the individual image together, and then we could integrate the area of the entire flight region to obtain the proportion and location of the disaster in the entire region.

4. Results

4.1. Evaluation Metrics

In this paper, the four conventional metrics, precision, recall, F1-score, and AP, were used to evaluate the model’s performance. Precision is mainly used to evaluate the classifier’s ability to mark samples as positive and negative. Recall is the ability to evaluate the classifier to find all positive samples. F1-score is the harmonic mean of precision and recall. The AP formula was calculated by the recall and the precision. The indicators are calculated as follows.
Recall = T P T P + F N
Precision = T P T P + F P
F 1 = 2 · P r e c i s i o n   ×   R e c a l l R e c a l l   +   P r e c i s i o n
A P = 0 1 P R d R
where, TP indicates true positive (positive label is correctly predicted as positive), FP indicates false positive (negative label is incorrectly predicted as positive), and FN indicates false negative (positive label is incorrectly predicted as negative).

4.2. Experimental Environment

The CPU used in this paper is Intel(R) Xeon(R) E5-2680 v4, the GPU is NVIDIA GeForce RTX 3060, and the Computing Platform is CUDA11.3. First, we fed the Image-1k dataset into the model for pre-training, and the pre-training loss and accuracy are shown in Figure 11. Then, the PWD dataset was trained with the pre-trained weights, and the details of the two pieces of training are recorded in Table 4. Finally, when the verification loss function had not changed for 20 iterations, the training was stopped in time.

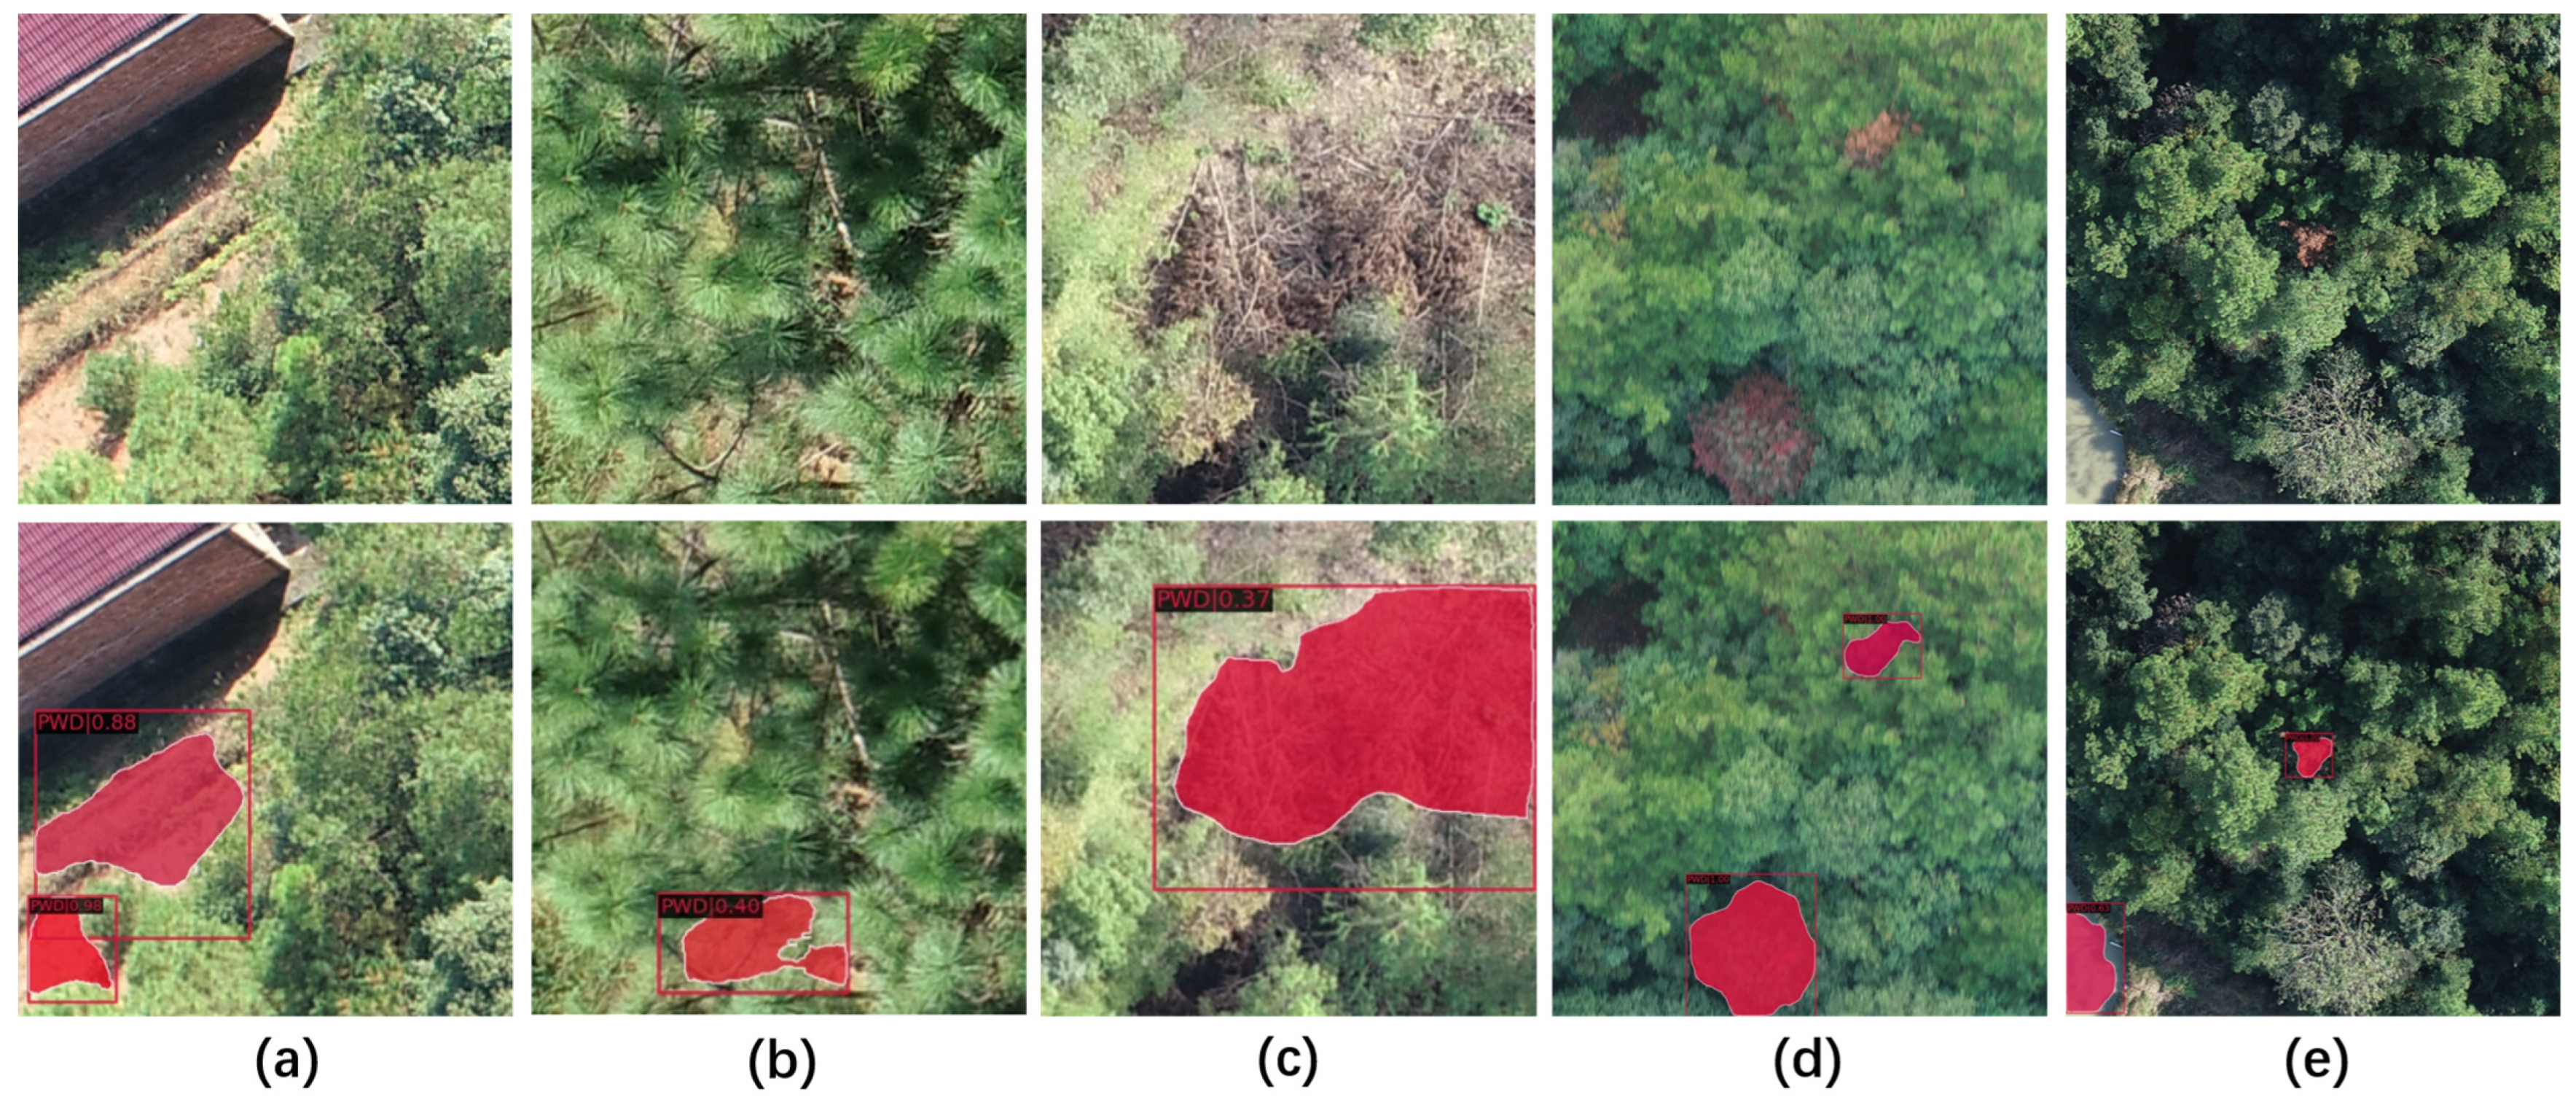
4.3. Test Results of the Improved Model

As shown in Table 5, the F1-score of 88.5% and the PWD Extraction Accuracy of 89.3% were obtained after training the PWD dataset with this algorithm. As shown in Figure 12, this is the loss function and precision change during model training, where the loss part includes box regression, category, mask, and overall loss function.
A visualization of the PWD regions detected by the model is shown in Figure 13. Among them, Figure 13a is the image taken by the UAV, Figure 13b is the actual effect image containing the PWD identified by the model, where each detection box has the confidence level of the identification, and Figure 13c is the black and white image of PWD extracted by the model. In the black-and-white image, the white area is the identified high-weight PWD area, and the black area is the identified high-weight healthy forest land. The model can stitch the identified single image into an overall affected region image, as shown in Figure 14. Figure 14a is the original image, and Figure 14b is the affected area containing PWD discriminated by the model. The actual size of this region is 1.73 h m 2 , and the model detects 23 suspected high-weight diseased pine areas in this region, containing a total of 3,352,925-pixel blocks. The actual area of PWD detected by the model is 0.0458 h m 2 , and the actual area of marked PWD in this area is 0.0503 h m 2 . Compared with the actual affected area, the affected area extracted by our algorithm is smaller due to the forest environment’s complexity and the influence of light, causing some withered parts to be hidden in other healthy areas, thus appearing in this situation.
The model also has some recognition errors. In Figure 15a, the model identified the loess as diseased pine tree because under the condition of light, the loess has texture, and the color is very similar to diseased pine. Figure 15b shows that the loess was identified as diseased pine tree because there are gaps between the branches and leaves of the pine trees in the picture. The background of the gaps is the loess land, and the target area is small, which caused the model to misidentify such a scene as PWD. Figure 15c is a result of the branches falling on the loess. Figure 15d misidentifies the discolored broad-leaved tree as a diseased pine tree because the texture of the discolored broad-leaved tree is not clear, which is very similar to the texture of diseased pine tree. Figure 15e is misidentified due to the shadow of pine trees in the lake. The above five situations are misidentifications that occurred during the identification process of this model. Missing recognition occurs more frequently in this algorithm because small targets are hidden in healthy trees, and the early diseased pine features in visible light images are not obvious, resulting in this situation.

4.4. Ablation Experiment

In order to test the effectiveness of each module in the improved algorithm, we conducted the ablation experiments shown in Table 6 and obtained the corresponding results. The experimental results show that compared with the Baseline (Mask R-CNN before improvement), our improved algorithm had improved the precision of detection by 11.4%, the recall by 1.8%, and the segmentation precision by 5.8%. There are obvious improvements for all indicators.
The original Mask R-CNN uses the structure of Resnet + FPN for object detection and segmentation. The precision of detection and segmentation was improved by replacing the Resnet network with the ConvNeXt network. In particular, the recognition accuracy of detection has increased by 4.8%. It effectively proves that ConvNeXt results in significant improvement in PWD detection. FPN is a pyramid structure from top to bottom. In order to improve the utilization rate of information exchange and features, we propose GWP based on FPN. It can be seen from the experimental results that GWP effectively improves the precision of detection, and it also proves that this improvement can effectively obtain better results under low Batch-size training. The Mask branch is the part that outlines the target. It can draw the mask of the object based on the detected target. Its drawing effect determines the accuracy of the subsequent calculation of the proportion of diseased pine and disaster. Through ablation experiments, it can be seen that the improved Mask can effectively improve the Precision of segmentation.

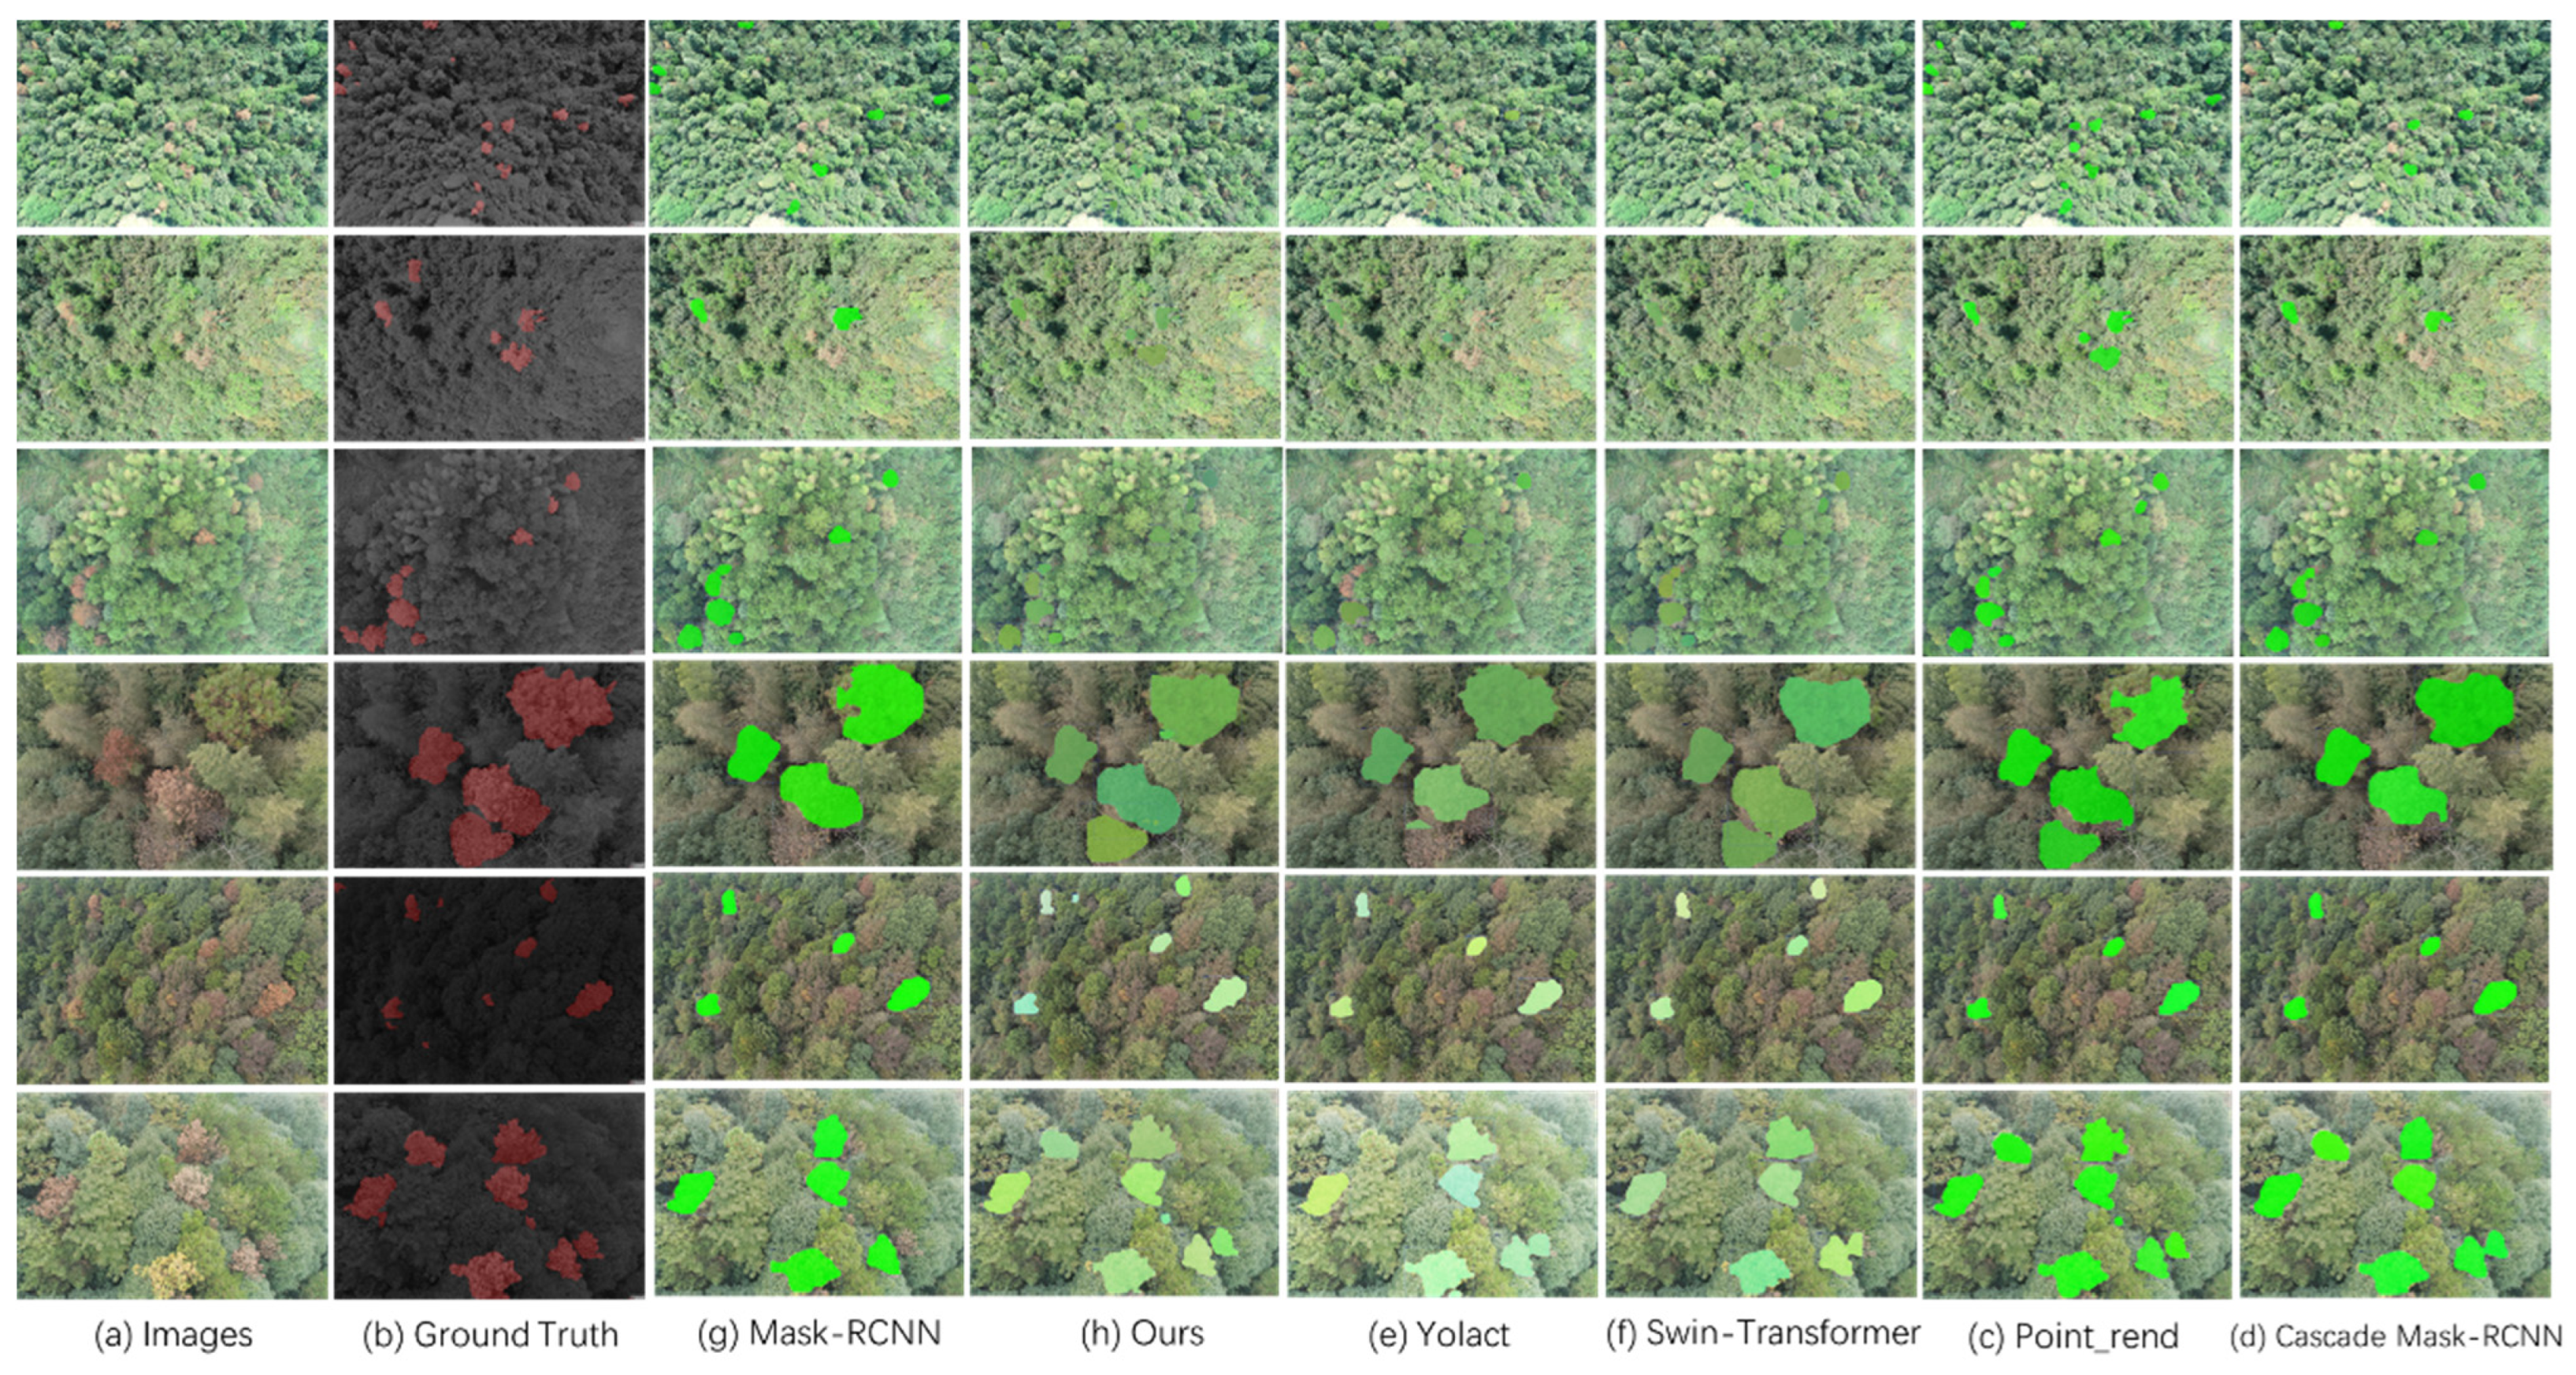
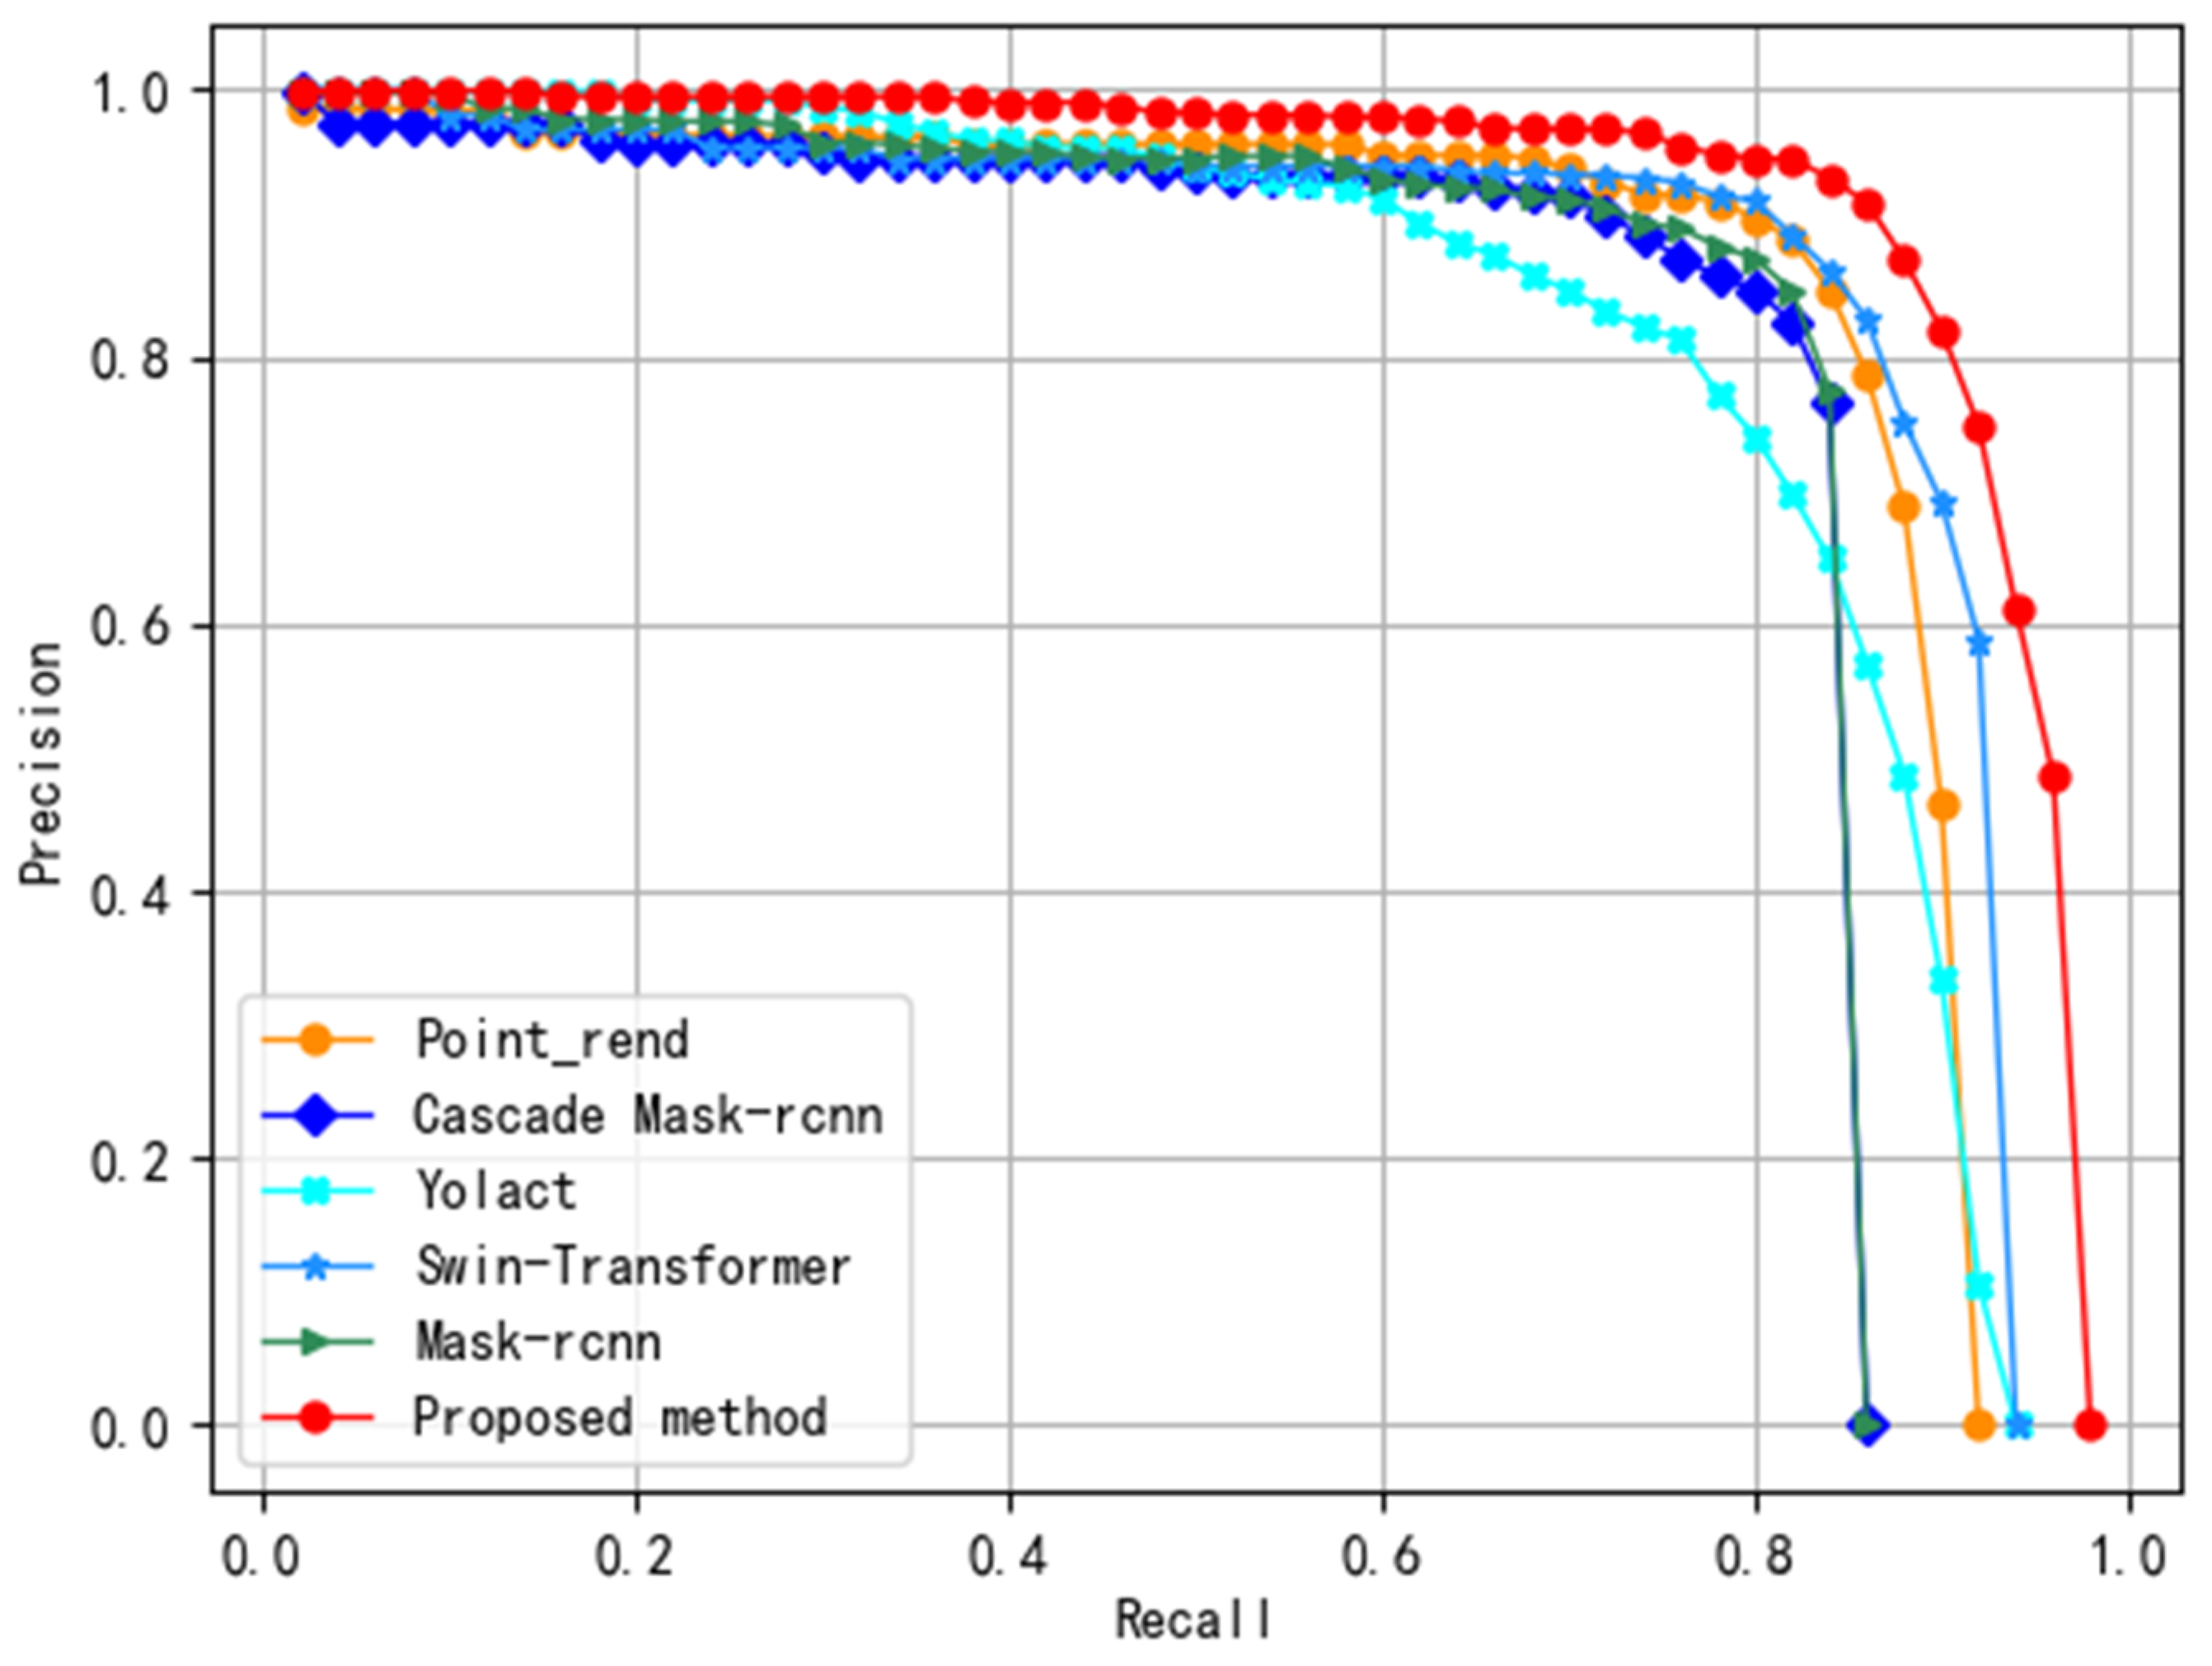
4.5. Algorithm Comparison on the PWD Dataset

Instance segmentation can identify the content and location of the image and can also distinguish different individuals under the same category to achieve more accurate target information. In order to compare the detection effects and region extraction capabilities of different advanced algorithms on the PWD dataset, we selected four instance segmentation algorithms with better detection effects at this stage. Using pre-trained weights, the experimental environment and parameter settings are the same for each algorithm.
Table 7 shows the evaluation results of the ability to detect PWD. At the same time, Figure 16 shows the visualization of PWD detected by each algorithm. Mask R-CNN is used as the baseline, the precision detected on the PWD dataset was 80.5%, and the recall was 83.7%. Compared with other algorithms, the recognition accuracy of Mask R-CNN is average. The first step in segmentation is to find the target. Accurate object recognition can segment objects more effectively. However, the detection process is easily disturbed by noise, resulting in inaccurate detection and positioning. Cascade Mask R-CNN [40] is used to solve such problems, which utilizes different IOU thresholds and trains multiple cascaded detectors to learn features. However, Cascade Mask R-CNN was tested on the PWD dataset and found to be ineffective, with a precision of only 79.6% and a recall of 82.9%. The proposal of Point_rend [41] solves the problem that the edge is not fine enough in the instance segmentation task, and refines the points selected from the target contour area in an iterative manner, thereby improving the quality of the target contour segmentation. The precision tested on the PWD dataset was 84.6%, and the recall was 84.1%, which is greatly improved compared to Mask R-CNN. These three algorithms are all RCNN types. In order to fill the lack of single-stage instance segmentation algorithms, Yolact [42] is used for single-stage instance segmentation. Yolact adds a mask branch to the single-stage detector without adding a feature localization step, achieving faster detection speed and fine mask segmentation. Yolact has 81.7% for precision and 76.2% for recall in detecting the PWD dataset. Finally, we choose the Swin-Transformer algorithm [43], a Transformer-type algorithm with better target recognition and disaster-affected area extraction. Unlike other instance segmentation methods, the Swin-Transformer algorithm divides the picture into multiple small blocks, and then uses SW-MSA to extract feature. Compared with the traditional Transformer, Swinformer has a smaller amount of calculation. The detection precision was 84.4%, and the recall was 83% in the PWD dataset.
As shown in Figure 17, we have drawn the PR curves of each comparison algorithm. The abscissa of the PR curve is recall, and the ordinate is precision. The larger the area is under the curve, the more advanced the algorithm will be.
In order to test the accuracy of extracting the disaster-affected ratio, we carry out related calculations. The entire test images contain 119.8 × 106 pixel blocks, and the pixel block containing the PWD area was 9.72 × 10⁶. We recorded the evaluation results of the extracted disaster area in Table 8 and record the pictures of PWD masks extracted by each algorithm in Figure 18. By calculation, Mask R-CNN extracted 7.21 × 106 pixel blocks, and the segmentation accuracy rate was 74.2%. The improved algorithm proposed in this paper extracted 8.68 × 106 pixel blocks, and the accuracy of segmenting the affected pixels was 89.3%. The algorithm proposed in this paper improves the segmentation accuracy by 15.1% compared with Mask R-CNN. Yolact had the worst segmentation effect among the comparison algorithms, and the PWD extraction accuracy was only 69.7%. Compared with other algorithms, the PWD extraction accuracy of this paper also has obvious advantages. It can be seen from the mask extraction map that the details of the segmentation of the affected area are better.

5. Discussion

5.1. Performance of Faster R-CNN and YOLO V3 on the PWD Dataset

Some existing studies used Faster R-CNN and Yolo series algorithms to detect diseased pine trees [44,45]. Compared with segmentation algorithms, target detection algorithms can only identify and locate targets, but cannot draw the actual area of diseased pine trees. Among them, Faster R-CNN focuses on recognition accuracy, and the Yolo series focuses on recognition speed. As shown in Table 9, we used these two algorithms to train and test the PWD dataset. Among them, Faster R-CNN adopts the FPN structure and ROI align, and the optimization function is SGD. Through experiments, it can be found that the recognition speed of Yolo v3 is significantly higher than that of Faster-RCNN. At the same time, the recognition precision of Faster R-CNN is higher than that of YOLO V3. At the same time, we used Darknet [45] and MobileNet [46] as the backbone network of YOLO V3, respectively. The number of parameters of YOLO V3 with MobileNet as the backbone network was greatly reduced to only 3.67 M. Therefore, YOLO V3 with MobileNet as the backbone network can help drones detect diseases in real-time.

5.2. Image Segmentation and Object Detection

In the past, PWD detection mainly focused on classifying and locating PWD. Although the management efficiency of PWD in the forestry department has improved, only classification and localization methods ignore assessing the area size of disaster. The quantitative index of the area size of disaster damage plays an essential role in managing PWD by the forestry department and formulating corresponding treatment methods. Although the area size can be assessed by using the spectral index method, this method does not have accurate location information, making it impossible to implement specific measures. With the development of convolutional neural networks, the instance segmentation network can draw object outlines while obtaining positioning information, which is widely used in various scenarios and has become a research hotspot [47].
In the current stage of PWD detection, because the development of the segmentation algorithm has the characteristics of high hardware requirements and complexity, the segmentation algorithm has not been thoroughly developed in the detection of diseased pine trees, and only a small number of studies have explored the segmentation method of PWD detection. FCN, DeepLabv3+, and Unet, as representatives of semantic segmentation networks, are developed for PWD detection [48,49]. Due to the different sizes of PWD, to improve the recognition of small targets, MA-Unet proposes to add a multi-scale attention module, so that PWD of different scales has a better recognition effect [50]. Although there are few studies on the use of segmentation algorithms for PWD, existing studies have proved the applicability of segmentation algorithms for PWD research [51,52].

5.3. Performance of Semantic Segmentation Algorithm on PWD Dataset

FCN, DeepLab, and U-net are commonly used semantic segmentation models [53,54,55]. The FCN (Fully Convolutional Networks) network is the first semantic segmentation network which establishes a general network model framework for image semantic segmentation.
The FCN network replaces the fully connected layer after the CNN layer with a convolutional layer and adds a skip-level structure to combine the prediction of global information and local information, and segment images while improving the detection effect of details. The precision of the FCN network in the detection of the PWD dataset was 87.3%. The DeepLab series of networks has undergone several iterations and has now developed to DeepLab V3+. Compared with the previous DeepLab network, DeepLap V3 + adopts the structure of an Encoder and Decoder. The main body of the Encoder is DCNN with hole convolution and ASPP with hole convolution. The Decoder will first convolve the input shallow feature map and then perform Concat with the up-sampled ASPP feature map. Finally, after convolution and up-sampling operations, the segmentation map of the original size is output to achieve end-to-end fine-grained semantic segmentation. The Precision recognized on the PWD dataset was 81.6%. The U-net algorithm is similar to U-shape, adopts Encoder and Decoder structures, and was first used in medical image processing. At this stage, many researchers have applied the U-net algorithm to various aspects. Therefore, we also use this algorithm to test the PWD dataset. The precision of U-net recognition can reach 84.6%.
As shown in Table 10, this is the specific detection result of the three algorithms on the PWD dataset, and the FCN network has a relatively good performance.

5.4. Comparison of the Improved Algorithm in HSV and RGB

Color space transformation techniques can be applied in many areas of UAV remote sensing to extract more information from color band features, including HSV color space and RGB color space. As shown in Figure 19, HSV, as a color space different from RGB, consists of H, S, and V, representing hue, saturation, and lightness, respectively. The color threshold model is an algorithm that relies on color features to detect PWD. Experiments have found that the detection effect of the HSV color space is better than that of the RGB color space [56]. When using traditional machine learning methods to detect PWD in RGB and HSV color spaces, we find that most algorithms are better at recognizing PWD in RGB than in HSV [17]. Different detection results emerged for the two types of algorithms. At the same time, we also used the proposed improved algorithm to conduct comparative experiments on the HSV type PWD dataset and the visible light PWD dataset. The experimental results are shown in Table 11. The detection effect of the RGB type is better than that of the HSV type, but the recognition speed of the RGB type is worse than that of the HSV type. Figure 19b,d show the scatter diagrams of HSV and RGB, where the color bands of HSV are more concentrated than the RGB color bands, which weakens the color discrimination and causes the texture details of objects to become weaker. We find that the color thresholding model uses only color features, while the other uses multiple features, including color and texture, which may be one of the reasons why color thresholding and the other two methods show very different results.

6. Conclusions

In this paper, we collected remote sensing images of four regions by UAV, and made a PWD dataset of visible light type. Due to the high hardware requirements of the segmentation algorithm, to effectively improve the effect of recognizing multi-scale PWD under low Batch-size training, we improved the Mask R-CNN network and proposed a PWD extraction algorithm. The improved algorithm can not only detect PWD and extract the PWD regions, but also evaluate the disaster situation. The experimental results show that the precision of the method proposed in this paper was 11.4% higher than that of the baseline algorithm, and the accuracy of the disaster area extraction is also 15.1% higher. Compared with other methods, the method of this paper also has certain advantages. It can help improve the interpretation of PWD in forestry, enrich the ways of managing diseased pine trees in forestry departments, and provide a basis for subsequent work in this field.

Author Contributions

Methodology, Z.W. and X.J.; formal analysis, Z.W.; investigation, Z.W.; writing—original draft preparation, Z.W.; writing the original draft, X.J.; funding acquisition, X.J. All authors have read and agreed to the published version of the manuscript.

Funding

This research was funded by the National Key Research & Development Program of China, grant number is 2022YFD2200505 and 2018YFB0703900.

Institutional Review Board Statement

Not applicable.

Informed Consent Statement

Not applicable.

Data Availability Statement

Not applicable.

Conflicts of Interest

The authors declare no conflict of interest.

References

  1. Ikegami, M.; Jenkins, T.A.R. Estimate global risks of a forest disease under current and future climates using species distribution model and simple thermal model—Pine Wilt disease as a model case. For. Ecol. Manag. 2018, 409, 343–352. [Google Scholar] [CrossRef]
  2. Mota, M.M.; Vieira, P.R. Pine wilt disease: A worldwide threat to forest ecosystems. Nematology 2009, 11, 315–316. [Google Scholar] [CrossRef]
  3. Hirata, A.; Nakamura, K.; Nakao, K.; Kominami, Y.; Tanaka, N.; Ohashi, H. Potential distribution of pine wilt disease under future climate change scenarios. PLoS ONE 2017, 12, e0182837. [Google Scholar] [CrossRef]
  4. Proenca, D.N.; Grass, G.; Morais, P.V. Understanding pine wilt disease: Roles of the pine endophytic bacteria and of the bacteria carried by the disease-causing pinewood nematode. Microbiologyopen 2017, 6, e00415. [Google Scholar] [CrossRef] [PubMed]
  5. Kenichi, Y.; Takuma, T.; Natsumi, K. Pine wilt disease causes cavitation around the resin canals and irrecoverable xylem conduit dysfunction. J. Exp. Bot. 2018, 69, 589–602. [Google Scholar] [CrossRef]
  6. Tang, X.; Yuan, Y.; Li, X.; Zhang, J. Maximum Entropy Modeling to Predict the Impact of Climate Change on Pine Wilt Disease in China. Front. Plant Sci. 2021, 12, 652500. [Google Scholar] [CrossRef] [PubMed]
  7. Kim, S.R.; Lee, W.K.; Lim, C.H.; Kim, M.; Kafatos, M.C.; Lee, S.H.; Lee, S.S. Hyperspectral Analysis of Pine Wilt Disease to Determine an Optimal Detection Index. Forests 2018, 9, 115. [Google Scholar] [CrossRef]
  8. Tao, H.; Li, C.; Zhao, D.; Deng, S.; Hu, H.; Xu, X.; Jing, W. Deep learning-based dead pine tree detection from unmanned aerial vehicle images. Int. J. Remote Sens. 2020, 41, 8238–8255. [Google Scholar] [CrossRef]
  9. Wulder, M.A.; Dymond, C.C.; White, J.C.; Leckie, D.G.; Carroll, A.L. Surveying Mountain pine beetle damage of forests: A review of remote sensing opportunities. For. Ecol. Manag. 2006, 221, 27–41. [Google Scholar] [CrossRef]
  10. Zang, Z.; Wang, G.; Lin, H.; Luo, P. Developing a spectral angle based vegetation index for detecting the early dying process of Chinese fir trees. ISPRS J. Photogramm. Remote Sens. 2021, 171, 253–265. [Google Scholar] [CrossRef]
  11. White, J.C.; Coops, N.C.; Hilker, T.; Wulder, M.A.; Carroll, A.L. Detecting mountain pine beetle red attack damage with EO-1 Hyperion moisture indices. Int. J. Remote Sens. 2007, 28, 2111–2121. [Google Scholar] [CrossRef]
  12. Zhang, B.; Ye, H.; Lu, W.; Huang, W.; Wu, B.; Hao, Z.; Sun, H. A Spatiotemporal Change Detection Method for Monitoring Pine Wilt Disease in a Complex Landscape Using High-Resolution Remote Sensing Imagery. Remote Sens. 2021, 13, 2083. [Google Scholar] [CrossRef]
  13. Anees, A.; Aryal, J. Near-Real Time Detection of Beetle Infestation in Pine Forests Using MODIS Data. IEEE J. Sel. Top. Appl. Earth Obs. Remote Sens. 2014, 7, 3713–3723. [Google Scholar] [CrossRef]
  14. Diez, Y.; Kentsch, S.; Fukuda, M.; Caceres, M.L.L.; Moritake, K.; Cabezas, M. Deep Learning in Forestry Using UAV-Acquired RGB Data: A Practical Review. Remote Sens. 2021, 13, 2837. [Google Scholar] [CrossRef]
  15. Lowe, D.G. Distinctive image features from scale-invariant keypoints. Int. J. Comput. Vis. 2004, 60, 91–110. [Google Scholar] [CrossRef]
  16. Dalal, N.; Triggs, B. Histograms of oriented gradients for human detection. In Proceedings of the 2005 IEEE Computer Society Conference on Computer Vision and Pattern Recognition (CVPR’05), SanDiego, CA, USA, 20–25 June 2005; Volume 1, pp. 886–893. [Google Scholar] [CrossRef]
  17. Oide, A.H.; Nagasaka, Y.; Tanaka, K. Performance of machine learning algorithms for detecting pine wilt disease infection using visible color imagery by UAV remote sensing. Remote Sens. Appl. Soc. Environ. 2022, 28, 100869. [Google Scholar] [CrossRef]
  18. Abdel-Rahman, E.M.; Mutanga, O.; Adam, E.; Ismail, R. Detecting Sirex noctilio grey-attacked and lightning-struck pine trees using airborne hyperspectral data, random forest and support vector machines classifiers. ISPRS J. Photogramm. Remote Sens. 2014, 88, 48–59. [Google Scholar] [CrossRef]
  19. Iordache, M.-D.; Mantas, V.; Baltazar, E.; Pauly, K.; Lewyckyj, N. A Machine Learning Approach to Detecting Pine Wilt Disease Using Airborne Spectral Imagery. Remote Sens. 2020, 12, 2280. [Google Scholar] [CrossRef]
  20. Syifa, M.; Park, S.J.; Lee, C.W. Detection of the Pine Wilt Disease Tree Candidates for Drone Remote Sensing Using Artificial Intelligence Techniques. Engineering 2020, 6, 919–926. [Google Scholar] [CrossRef]
  21. Run, Y.; Luo, Y.; Zhou, Q.; Zhang, X.; Wu, D.; Ren, L. A machine learning algorithm to detect pine wilt disease using UAV-based hyperspectral imagery and LiDAR data at the tree level. Int. J. Appl. Earth Obs. Geoinf. 2021, 101, 102363. [Google Scholar] [CrossRef]
  22. Zhang, S.; Huang, H.; Huang, Y.; Cheng, D.; Huang, J. A GA and SVM Classification Model for Pine Wilt Disease Detection Using UAV-Based Hyperspectral Imagery. Appl. Sci. 2022, 12, 6676. [Google Scholar] [CrossRef]
  23. LeCun, Y.; Bengio, Y.; Hinton, G. Deep learning. Nature 2015, 521, 436–444. [Google Scholar] [CrossRef] [PubMed]
  24. You, J.; Zhang, R.; Lee, J. A Deep Learning-Based Generalized System for Detecting Pine Wilt Disease Using RGB-Based UAV Images. Remote Sens. 2022, 14, 150. [Google Scholar] [CrossRef]
  25. Huang, J.; Lu, X.; Chen, L.; Sun, H.; Wang, S.; Fang, G. Accurate Identification of Pine Wood Nematode Disease with a Deep Convolution Neural Network. Remote Sens. 2022, 14, 913. [Google Scholar] [CrossRef]
  26. Wu, B.; Liang, A.; Zhang, H.; Zhu, T.; Zou, Z.; Yang, D.; Tang, W.; Li, J.; Su, J. Application of conventional UAV-based high-throughput object detection to the early diagnosis of pine wilt disease by deep learning. For. Ecol. Manag. 2021, 486, 118986. [Google Scholar] [CrossRef]
  27. Yu, R.; Luo, Y.; Zhou, Q.; Zhang, X.; Wu, W.; Ren, L. Early detection of pine wilt disease using deep learning algorithms and UAV-based multispectral imagery. For. Ecol. Manag. 2021, 497, 119493. [Google Scholar] [CrossRef]
  28. Hu, G.; Zhu, Y.; Wan, M.; Bao, W.; Zhang, Y.; Liang, D.; Yin, C. Detection of diseased pine trees in unmanned aerial vehicle images by using deep convolutional neural networks. Geocarto Int. 2021, 37, 3520–3539. [Google Scholar] [CrossRef]
  29. Qin, J.; Wang, B.; Wu, Y.; Lu, Q.; Zhu, H. Identifying Pine Wood Nematode Disease Using UAV Images and Deep Learning Algorithms. Remote Sens. 2021, 13, 162. [Google Scholar] [CrossRef]
  30. Yu, R.; Luo, Y.; Li, H.; Yang, L.; Huang, H.; Yu, L.; Ren, L. Three-Dimensional Convolutional Neural Network Model for Early Detection of Pine Wilt Disease Using UAV Based Hyperspectral Images. Remote Sens. 2021, 13, 4065. [Google Scholar] [CrossRef]
  31. Li, J.; Wang, X.; Zhao, H.; Hu, X.; Zhong, Y. Detecting pine wilt disease at the pixel level from high spatial and spectral resolution UAV-borne imagery in complex forest landscapes using deep one-class classification. Int. J. Appl. Earth Obs. Geoinf. 2022, 112, 1569–8432. [Google Scholar] [CrossRef]
  32. Sun, Z.; Ibrayim, M.; Hamdulla, A. Detection of Pine Wilt Nematode from Drone Images Using UAV. Sensors 2022, 22, 4704. [Google Scholar] [CrossRef] [PubMed]
  33. Hu, G.; Wang, T.; Wan, M.; Bao, W.; Zeng, W. UAV remote sensing monitoring of pine forest diseases based on improved Mask R-CNN. Int. J. Remote Sens. 2022, 43, 1274–1305. [Google Scholar] [CrossRef]
  34. Han, Z.; Hu, W.; Peng, S.; Lin, H.; Zhang, J.; Zhou, J.; Wang, P.; Dian, Y. Detection of Standing Dead Trees after Pine Wilt Disease Outbreak with Airborne Remote Sensing Imagery by Multi-Scale Spatial Attention Deep Learning and Gaussian Kernel Approach. Remote Sens. 2022, 14, 3075. [Google Scholar] [CrossRef]
  35. Hu, G.; Yao, P.; Wan, M.; Bao, W.; Zeng, W. Detection and classification of diseased pine trees with different levels of severity from UAV remote sensing images. Ecol. Inform. 2022, 72, 1574–9541. [Google Scholar] [CrossRef]
  36. Perez, L.; Wang, J. The effectiveness of data augmentation in image classification using deep learning. arXiv 2017, arXiv:1712.04621. [Google Scholar] [CrossRef]
  37. Carnegie, A.J.; Venn, T.; Lawson, S.; Nagel, M.; Wardlaw, T.; Cameron, N.; Last, I. An analysis of pest risk and potential economic impact of pine wilt disease to Pinus plantations in Australia. Aust. For. 2018, 81, 24–36. [Google Scholar] [CrossRef]
  38. He, K.; Gkioxari, G.; Dollár, P. Mask-rcnn. In Proceedings of the IEEE International Conference on Computer Vision, Venice, Italy, 22–29 October 2017; pp. 2961–2969. [Google Scholar]
  39. Liu, Z.; Mao, H.; Wu, C.Y.; Feichtenhofer, C.; Darrell, T.; Xie, S. A ConvNet for the 2020s. In Proceedings of the 2022 IEEE/CVF Conference on Computer Vision and Pattern Recognition (CVPR), New Orleans, LA, USA, 18–24 June 2022. [Google Scholar] [CrossRef]
  40. Cai, Z.; Vasconcelos, N. Cascade R-CNN: Delving into high quality object detection. In Proceedings of the 2018 IEEE Conference on Computer Vision and Pattern Recognition (CVPR 2018), Salt Lake City, UT, USA, 18–23 June 2018; pp. 6154–6162. [Google Scholar] [CrossRef]
  41. Kirillov, A.; Wu, Y.; He, K.; Girshick, R. PointRend: Image Segmentation as Rendering. In Proceedings of the2020 IEEE/CVF Conference on Computer Vision and Pattern Recognition (CVPR), Seattle, WA, USA, 13–19 June 2020. [Google Scholar] [CrossRef]
  42. Bolya, D.; Zhou, C.; Xiao, F.; Lee, Y.J. YOLACT: Real-time Instance Segmentation. In Proceedings of the 2019 IEEE/CVF In-ternational Conference on Computer Vision (ICCV), Seoul, Republic of Korea, 27 October–2 November 2019. [Google Scholar] [CrossRef]
  43. Liu, Z.; Lin, Y.; Cao, Y.; Hu, H.; Wei, Y.; Zhang, Z.; Lin, S.; Guo, B. Swin Transformer: Hierarchical Vision Transformer Using Shifted Windows. arXiv 2021, arXiv:2103.14030. [Google Scholar] [CrossRef]
  44. Ren, S.; He, K.; Girshick, R.; Sun, J. Faster R-CNN: Towards Real-Time Object Detection with Region Proposal Networks. IEEE Trans. Pattern Anal. Mach. Intell. 2015, 39, 1137–1149. [Google Scholar] [CrossRef]
  45. Redmon, J.; Divvala, S.; Girshick, R.; Farhadi, A. You Only Look Once: Unified, Real-Time Object Detection. In Proceedings of the 2016 IEEE Conference on Computer Vision and Pattern Recognition (CVPR), Las Vegas, NV, USA, 27–30 June 2016; pp. 4510–4520. [Google Scholar] [CrossRef]
  46. Sandler, M.; Howard, A.; Zhu, M.; Zhmoginov, A.; Chen, L.C. ‘MobileNetV2: Inverted residuals and linear bottlenecks. In Proceedings of the 2018 IEEE/CVF Conference on Computer Vision and Pattern Recognition, Salt Lake City, UT, USA, 18–23 June 2018; pp. 4510–4520. [Google Scholar]
  47. Mo, Y.; Wu, Y.; Yang, X.; Liu, F.; Liao, Y. Review the state-of-the-art technologies of semantic segmentation based on deep learning. Neurocomputing 2022, 493, 626–646. [Google Scholar] [CrossRef]
  48. Xia, L.; Zhang, R.; Chen, L.; Li, L.; Yi, T.; Wen, Y.; Ding, C.; Xie, C. Evaluation of Deep Learning Segmentation Models for Detection of Pine Wilt Disease in Unmanned Aerial Vehicle Images. Remote Sens. 2021, 13, 3594. [Google Scholar] [CrossRef]
  49. Wang, J.; Zhao, J.; Sun, H.; Lu, X.; Huang, J.; Wang, S.; Fang, G. Satellite Remote Sensing Identification of Discolored Standing Trees for Pine Wilt Disease Based on Semi-Supervised Deep Learning. Remote Sens. 2022, 14, 5936. [Google Scholar] [CrossRef]
  50. Ye, W.; Lao, J.; Liu, Y.; Chang, C.C.; Zhang, Z.; Li, H.; Zhou, H. Pine pest detection using remote sensing satellite images combined with a multi-scale attention-UNet model. Ecol. Inform. 2022, 72, 101906. [Google Scholar] [CrossRef]
  51. Sun, Z.; Wang, Y.; Pan, L.; Xie, Y.; Zhang, B.; Liang, R.; Sun, Y. Pine wilt disease detection in high-resolution UAV images using object-oriented classification. J. For. Res. 2022, 33, 1377–1389. [Google Scholar] [CrossRef]
  52. Li, G.; Han, W.; Huang, S.; Ma, W.; Ma, Q.; Cui, X. Extraction of Sunflower Lodging Information Based on UAV Multi-Spectral Remote Sensing and Deep Learning. Remote Sens. 2021, 13, 2721. [Google Scholar] [CrossRef]
  53. Long, J.; Shelhamer, E.; Darrell, T. Fully Convolutional Networks for Semantic Segmentation. IEEE Trans. Pattern Anal. Mach. Intell. 2017, 39, 640–651. [Google Scholar] [CrossRef]
  54. Chen, L.C.; Zhu, Y.; Papandreou, G.; Schroff, F.; Adam, H. Encoder-Decoder with Atrous Separable Convolution for Semantic Image Segmentation. In Proceedings of the European Conference on Computer Vision (ECCV) 2018, Munich, Germany, 8–14 September 2018. [Google Scholar] [CrossRef]
  55. Ronneberger, O.; Fischer, P.; Brox, T. U-Net: Convolutional Networks for Biomedical Image Segmentation. arXiv 2018. [Google Scholar] [CrossRef]
  56. Tao, H.; Li, C.; Xie, C.; Zhou, J.; Huai, H.; Jiang, L.; Li, F. Recognition of red-attack pine trees from UAV imagery based on the HSV threshold method. J. Nanjing For. Univ. (Nat. Sci. Ed.) 2019, 43, 99–106. [Google Scholar] [CrossRef]
Figure 1. (a) The study area is located in Hunan Province, the People’s Republic of China, where four different colors represent the four collection sites. (b) Images collected by UAV. (c,d) Low-altitude acquisition of trees in sample plots by UAV (including PWD).
Forests 14 01672 g001
Figure 2. The overall workflow of the experiment.
Forests 14 01672 g002
Figure 3. The overall framework diagram of the improved algorithm.
Forests 14 01672 g003
Figure 4. (a) Resnet Block. (b) ConvNeXt Block.
Forests 14 01672 g004
Figure 5. (a) FPN. (b) PAFPN has more structures than FPN.
Forests 14 01672 g005
Figure 6. The training process uses Group Normalization and Weight Standardization.
Forests 14 01672 g006
Figure 8. Weight Standardization.
Forests 14 01672 g008
Figure 9. Improved Mask.
Forests 14 01672 g009
Figure 10. Mask extraction process. (a) Original image. (b) Mask image after recognition. (c) Pixel image with mask. (d) Pixel image of the target.
Forests 14 01672 g010
Figure 11. Loss and accuracy curves on the ImageNet-1K dataset.
Forests 14 01672 g011
Figure 12. Loss and precision curves on the PWD dataset.
Forests 14 01672 g012
Figure 13. Extraction of PWD area and PWD in a single image. (a) Original image taken by drone. (b) the actual effect image containing the PWD identified by the model. (c) the black and white image of PWD extracted by the model.
Forests 14 01672 g013
Figure 14. Overall damage situation. (a) Original images. (b) Extraction of PWD-affected images.
Forests 14 01672 g014
Figure 15. Identification of problematic places, where the red box is PWD is detected (a) Loess. (b) Branches and loess. (c) Scattered branches. (d) Discolored broad-leaved trees. (e) Lake surface.
Forests 14 01672 g015
Figure 16. Detection effect diagram of each algorithm.
Forests 14 01672 g016
Figure 17. PR Curve of each algorithm.
Forests 14 01672 g017
Figure 18. PWD extraction diagram of each algorithm.
Forests 14 01672 g018
Figure 19. (a) RGB image. (b) Color scatter diagram of an RGB image. (c) HSV image. (d) Color scatter diagram of an HSV image.
Forests 14 01672 g019
Table 1. Parameters for Data Acquisition Equipment (provided by the manufacturer).
NameParametersValues
DJI Matrice
M300 RTK
Dimensions (L × W × H)/mm430 × 420 × 430
Weight/KG6.3
Flight Time/min55
DJI Zenmuse
H20T
Sensor1/2.3″ CMOS
Photo resolution4056 × 3040
Table 2. Data collection parameters.
Plot 1 (YY)Plot 2 (CS)Plot 3 (XT)Plot 4 (HH)
Number12415037254
High100 m ± 20 m
Size4056 × 3040
Table 3. The number of pictures for each collection point after cropping.
Plot 1 (YY)Plot 2 (CS)Plot 3 (XT)Plot 4 (HH)
After cropping153918394473120
After Select39037450358
Size1024 × 1024
Table 4. Train Parameters.
ModelDatasetBatch-SizeLearning RateOptimizerWarmup
Pre Mask R-CNNImageNet-1K40.0001AdamWLinear
OursPWD40.0001AdamWLinear
Table 5. Test result.
Precision/%Recall/%F1-Score/%FPS/SParams/MExtraction Accuracy/%
91.985.588.58.367.4789.3
Table 6. Results of ablation experiments.
ConvNeXtFPNGWPMDetection
Precision/%
Recall/%F1-Score/%Segmentation
Precision/%
Baseline (Resnet + FPN)80.583.782.0784.4
85.384.184.6985.9
91.184.987.887.7
86.182.584.386.5
91.985.588.590.2
Table 7. Precision of identifying objects.
Point_RendCascade Mask R-CNNYolactSwin-
Transformer
Mask
R-CNN
Ours
Precision/%84.679.681.784.480.591.9
Recall/%84.182.976.28383.785.5
F1-Score/%84.381.278.983.78288.5
FPS/s7.66.610.68.48.68.3
Table 8. The accuracy of different algorithms to extract PWD.
Point_RendCascade Mask R-CNNYolactSwin-
Transformer
Mask
R-CNN
Ours
Detected Pixels/×1067.847.356.778.247.218.68
PWD Extraction Accuracy/%80.675.669.784.874.289.3
Table 9. The accuracy of different algorithms to extract PWD.
ModelsBackbonePrecision/%Recall/%F1-Score/%FPS/sParams/M
Faster R-CNNResnet81.678.680.114.941.1
YOLO V3Darknet78.173.775.837.561.5
MobileNet v275.473.774.538.33.67
Table 10. Precision of identifying objects.
ModelsPrecision/%Recall/%F1-Score/%mIOU
FCN87.375.981.280.31
DeepLab V3+81.665.3672.5877.45
U-Net84.671.577.574.87
Table 11. Test result.
ColorDetection
Precision/%
Recall/%F1-Score/%Segmentation Precision/%FPS/S
RGB91.985.588.589.28.3
HSV88.281.384.687.18.9
Disclaimer/Publisher’s Note: The statements, opinions and data contained in all publications are solely those of the individual author(s) and contributor(s) and not of MDPI and/or the editor(s). MDPI and/or the editor(s) disclaim responsibility for any injury to people or property resulting from any ideas, methods, instructions or products referred to in the content.

