1. Introduction
Scots pine (
Pinus sylvestris L.) is among the most important tree species in the Boreal region, both economically and ecologically. Given the ecological and economic importance of Scots pine, many experiments have been conducted in forests of this species. This has included several long-term observations, primarily in the form of efforts to investigate the effects of thinning on tree parameter growth [
1,
2,
3,
4,
5,
6].
It has been shown that thinning not only redistributes available resources to tree growth, i.e., increases the viability and growth of the remaining trees, but can also improve the quality and value of the timber and the health of the trees and stands. It has been shown that the average diameter increment grows significantly with increasing thinning intensity, while the height increment slightly decreases with rising thinning intensity [
3]. Ebel et al. [
7] showed that moderate to heavy thinning is more profitable in pine forests as it increases the yield of larger logs and the value of the remaining stand. However, excessive thinning can cause biotic and abiotic damage and adversely affect timber quality [
8,
9].
Changes in environmental conditions associated with climate change are expected to have a major impact on ecosystem processes, particularly in forests with hotter climates. The results obtained by Mensah et al. [
10] show that current trees are becoming taller and leaner. Mäkinen et al. [
11] showed that current stands are maintaining a higher stand density than in the past, i.e., natural mortality is lower. Some studies show that stands are becoming more fertile, especially in the Boreal region [
12,
13]. The observed changes in growth can be attributed to environmental changes such as growing seasonal temperatures [
14,
15,
16], nitrogen deposition, and increased CO
2 levels in the air [
17,
18,
19].
In modern forestry, one way to mitigate the effects of climate change could be to reduce stand density through thinning [
20,
21,
22]. It is known that thinning can have a positive effect on tree vitality [
23,
24] and reduce water consumption due to lower stand transpiration [
24,
25]. However, this effect is temporary, and its duration depends on the intensity of the thinnings and the environmental and local conditions. More effective measures could include the planting of drought-tolerant species and increasing the diversity of tree species in stands [
21]. However, we lack information on how climate change will affect the response of stands to different thinning intensities, so long-term monitoring studies remain of great importance.
The aim of this study is to relate initial stand density and thinning intensity to tree diameter, height, and volume increment based on 30 continuous years of observations in thinning experimental stands of Scots pine. This study is a continuation of previously published studies [
5,
26], which were based on two experiments performed in two different regions of Lithuania. Five objects with different initial stand densities were assigned diverse thinning regimes and intensities. This allowed a comparison of young saplings’ responses to thinning over a 40-year stand growth period.
2. Materials and Methods
2.1. Establishment of the Experiment
A detailed description of the establishment of the analyzed experiments is presented by Kuliešis and Saladis [
26] and by Kuliešis et al. [
5]. Thus, only the most important details will be described here. The thinning experiments were established in 1990 and 1992 at the most suitable sites for growing Scots pine ‘Vacciniomyrtillosa.’ For each of the two trials, areas of 3 to 5 hectares populated by Scots pine that were 4 to 8 years old during establishment were selected.
The plantation of object 201 was performed in 1982 by manually planting one-year-old seedlings in rows every 0.5 m, or 10.000 seedlings per hectare. Before planting, the experimental area was plowed in rows every 2.0 m. During the establishment of the object, there were 5–6 thousand pine trees per hectare. The plantation was established on former agricultural land.
Object 206 was established in the formal forest area after the clear-cutting of the pine stand had been performed. The site was plowed every 2.0 m, and in 1988, one-year-old pine seedlings were planted manually 0.7 m apart, or 7140 seedlings per hectare. Since the seedling survival rate was 95%, the stand was supplemented with one-year-old seedlings by planting an additional 2000 seedlings per hectare. Therefore, before the establishment of the experiment, the density of trees was 8–8.3 thousand trees per hectare.
The experimental thinning model is comprised in each trial of five density variants: the control, as well as four variants with tree densities up to 3.0–4.4, 2.0–2.4, 1.0–1.2, and 0.5–0.6 thousand trees per hectare after the initial thinning. Thinning was performed from below by targeting the weakest trees. Each stand density variant was replicated and consisted of two 0.15–0.20 ha area sections. Buffer zones, about 5–10 m, were left around each section and maintained using a respective thinning treatment.
Since the establishment of the plantation, only the dead trees have been removed from the control plots. The second, third, and fourth density variants were thinned according to a predefined thinning plan, presented in
Table 1. The third of the four planned thinnings was performed in 2015, when the trees were 27 years old in object 206 and 34 years old in object 201. Depending on the thinning variant, the density in the thinned plots was reduced to 800–1000 trees per hectare.
The last measurements in experimental trials were taken in the autumn of 2020. Since the measurements were performed exactly every five years, this was the sixth remeasurement for objects 201 and 206 since their establishment.
During the first measurements that followed the establishment of the experiments, the coordinates of all trees were mapped. Accordingly, the tree diameters at 1.3 m were measured. The height was measured for each tenth tree and every fifth tree in the last density variant with a 5 m long ruler at an accuracy of 0.1 m. In the subsequent remeasurements, when the trees were higher than 5 m, they were measured using a clinometer with an accuracy of 0.5 m.
2.2. Estimation of the Mean Growth and Yield Values
The following yield parameters were analyzed for each thinning variant and experiment: number of trees per hectare (N), stand-level competition index (CI), quadratic mean diameters (Dq), mean heights (Hq), standing volume (V), gross volume yield (GY), periodic annual increment in diameter (id), and periodic annual volume increment (PAIv).
N was calculated by dividing the number of trees in a trial plot by the plot size. The
CI is estimated by dividing mean stand height (
Hq) by tree growth area (
q)—Equation (1) [
26].
where
CI is the stand-level competition index;
Hq is the mean stand height in m; and
N is the number of growing trees per ha. The
Dq for each trial plot, year, and the experiment was estimated using Equation (2) as the quadratic mean diameter of all growing trees.
where
Dq is a quadratic mean diameter in cm;
DBH is the tree diameter at the breast height in cm; and
K is the number of trees per plot. The measured
DBH for every tree and the measured height of every tenth tree were used to model the heights of other trees. Missing tree heights were modeled using Lorey’s height formula applied by Kuliešis [
27].
where
Hq is the mean height in m;
bai is the basal area of the sample trees in m
2; and
hi is the measured or modeled height of the trees in m. The volume of each tree was estimated from its
DBH, height, and form factor. Form factors were taken from Kuliešis [
27].
where
fs is a form factor;
h is the tree height in m; and
DBH is the tree diameter at the breast height in cm. Standing volume (
V) per hectare was calculated by summing up the volumes of all trees growing in the trial plot and dividing them by the size of the plot.
Gross volume yield (
GY) was calculated as a sum of the volume of the remaining stand in the current inventory (
V(
t)) and the removed stand (Vremoved) in the last and previous inventory periods (Equation (5)).
where
GY is the gross volume yield in the current inventory [m
3];
V is the volume of the remaining stand in the current inventory [m
3/ha];
Vremoved is the volume of removed stand in the second, third, fourth, fifth, and sixth inventories [m
3/ha]; and
inv is the number of inventories. A periodic annual increment in diameter (id) at a certain period was estimated as the mean difference of trees’ diameters that combined stood at the beginning and the end of the estimation period.
Periodic annual volume increment (PAIv) expresses volume growth produced in a stand from the time of establishment to the present day and is estimated by dividing GY by age.
2.3. Analysis of Differences between Pairs of Mean Diameters and Mean Heights
ANOVA, together with the Duncan multiple range test, was used to evaluate if there were statistically significant differences in tree heights and diameters. Analysis was carried out separately for objects 201 and 206, considering different density variants and inventory years at a 95% confidence level, by the SAS 9.4 (SAS Institute Inc., Cary, NC, USA) program.
3. Results
The dynamics of forest stand growth are important for monitoring different parameters. In this study, stand measurements were conducted seven times every five years, including the initial measurements, meaning we analyzed a 30-year measurement period. Objects were created to monitor thinning effects on stand parameters and compare the results with those of a naturally growing control plot. We have found significant differences in tree numbers per period, tree volume, volume increment, diameter increment, competition index, productivity, and the primary parameters of tree height (H) and tree
quadratic diameter (Dq). Results are shown in
Table 2 and
Table 3 and
Figure 1,
Figure 2,
Figure 3,
Figure 4,
Figure 5 and
Figure 6.
At the beginning of the experiment, the highest trees were recorded in the plots with the lowest stand density (“V”). However, after a period of five years, the highest trees were found in the “IV” thinning variant plots. In the year 2000, the tallest trees were registered in the “II”/”III” plots in object 201 and the “IV”/”II” plots in object 206. Up until the last measuring period in 2020, the trees of the highest height were found in the “II” plots in object 201. The last measurements of object 206 showed no significant differences between the “II,” ”III,” and ”IV” plots. A different case of tree height dynamics was observed in object 201. In the year 2005, the highest trees were found in the “II” plots, and after that period, all thinning program plots, with some exceptions, had a non-significant average tree height. Even the control plot reached the same height during the last measuring period in 2020. Even though there were significant differences between average height parameter values using the ANOVA Duncan multiple range test, they only reached 4.4%–6.7% between the highest and the lowest values. The dynamics of growing trees’ height could be explained by differences in tree competition for sunlight and nutrients.
From the beginning of the experiment until the last measuring period in 2020, the highest Dq was recorded in the V plots of both experimental objects. After 5 years in object 201 and 10 years in object 206, the average Dq had a significant difference between all plots except for the II/III plots in object 201 during the 2015 period. It is evident from
Table 2 that different spaces between trees highly impact the tree diameter at breast height. During the last measuring period, the difference between the control plots and the “V” plots was recorded at 32% in object 201 and 33% in object 206.
In object 201, tree mortality in the control (“I”) plot was quite even, resulting in an average loss of 630 trees/ha every 5 years. More tree mortality was detected in young stands, with the highest mortality rate at 852 trees/ha. Conversely, during the last measurement period, when the stand was 40 years old, the mortality rate reached 473 trees/ha. These tendencies did not correspond to object 206, where the highest mortality rate was observed in the control plot right after the experiment’s establishment. During the first measurements after a 5-year period, the stand reached a loss rate of 3070 trees/ha. Over the next ten years, small losses of around 390 trees/ha were recorded. The last measurement showed a mortality rate of 600 trees/ha. During the last measuring period, the difference between the number of trees per hectare in the naturally growing stand (“I”) and the lowest intensity thinning stand (“II”) was 54% in object 201 and 57% in object 206. The other important stand parameter is the competition index (
Figure 2), which shows the competition between trees in the stand.
Prior to reaching 25–27 years of age, the stand control plot’s (“I”) competition index was increasing by 0.8–1.2 every 5 years until hitting its peak at 3.7. In object 201, the competition index reaches its maximum point and remains steady for 10 years before starting to decrease. However, in the object’s 206 control plot, the decrease in the competition index starts immediately after reaching the maximum point of 3.7. In other plots, the competition index was controlled by thinning treatments of different intensities. During the last measuring period, an almost equal competition index was observed in all thinning treatment plots of object 201. This could have contributed to the differences in tree diameter at breast height in the plots mentioned. The difference in competition index between the control plot and the lowest intensity thinning plot (“V”) during the last measuring period was 53% and 43% in objects 201 and 206, respectively.
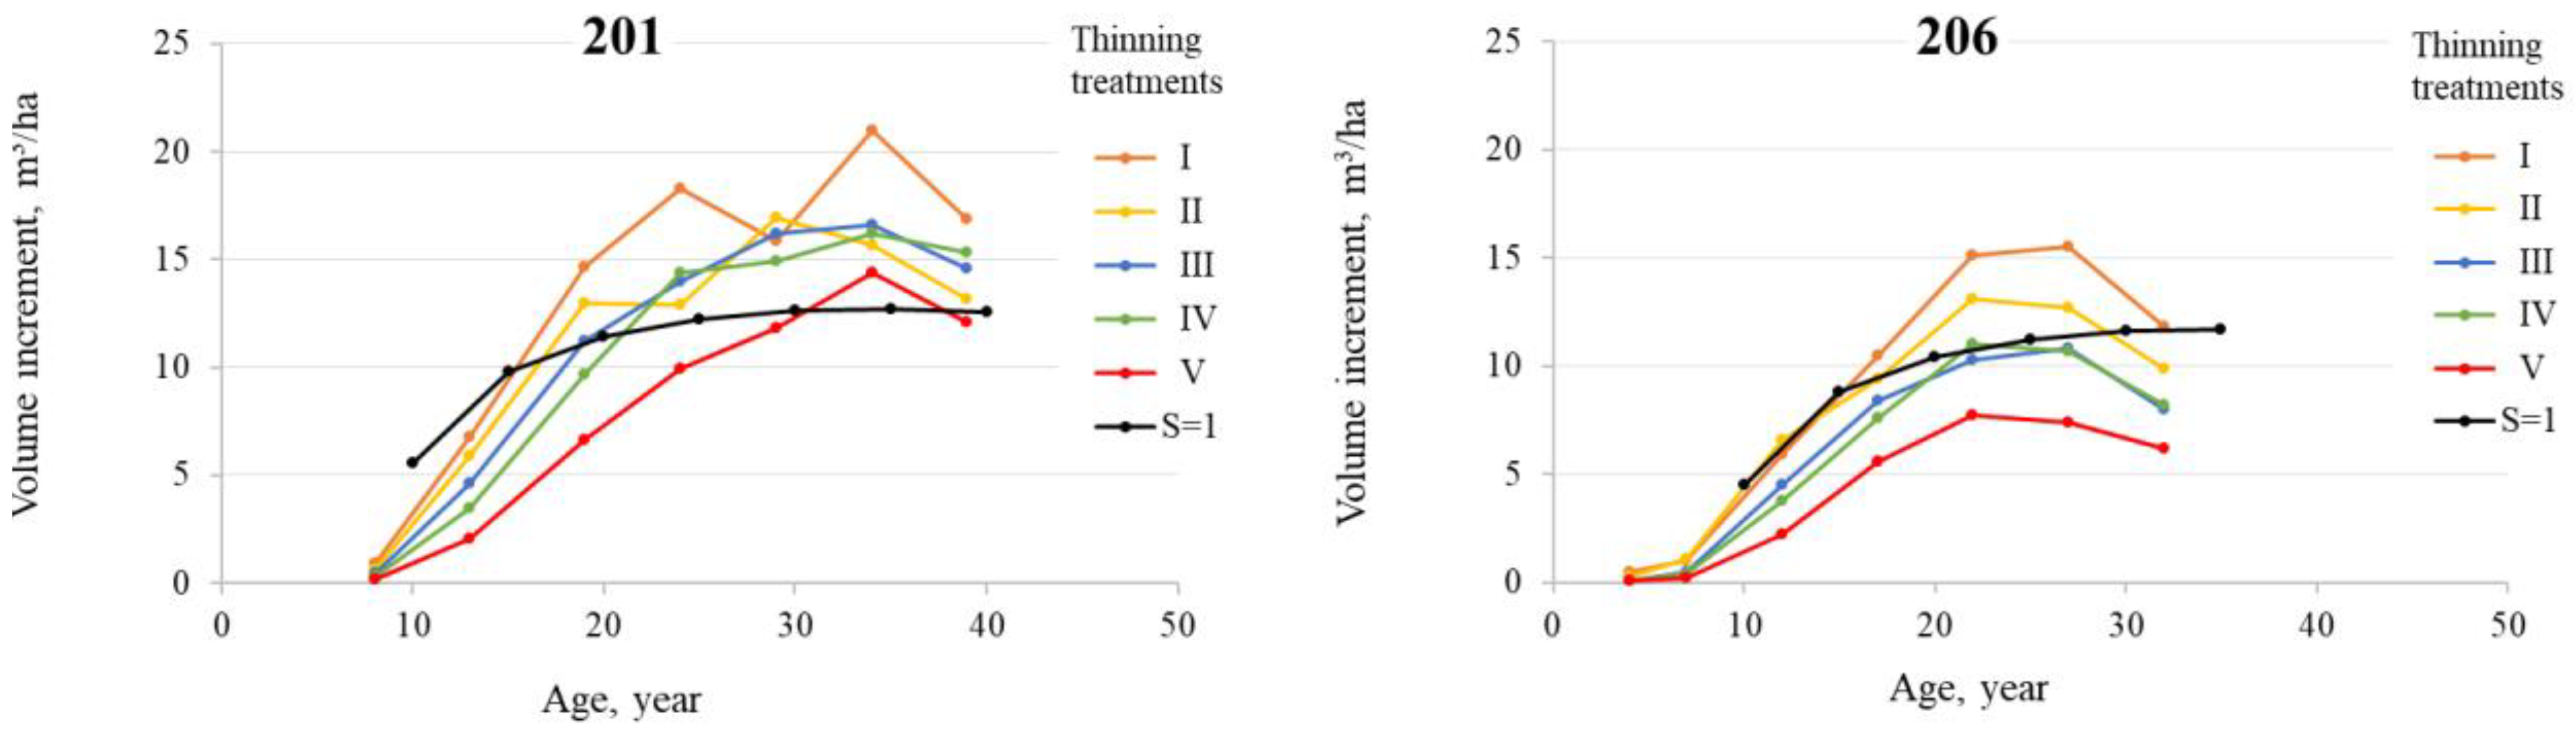
In both pine objects, the volume increment starts to decline after reaching its peak in 2015. Compared to a modal curve of 100% stocking level, all (except “V”) plots in object 201 had a higher increment in volume. A different scenario is observed in object 206, where the plots had a lower increment in volume compared to the modal curve. The highest volume increment is found in the control plots of both objects.
The peak of the diameter increment was registered 15 years after the establishment of this experiment. In both objects, the highest increment in diameter was found in the highest-intensity thinning treatment plots (“V”). During the last measuring period, the increment in diameter was equal in all thinning treatment plots and reached an average of 0.3 cm per year.
A significant difference in gross volume was found between the control plot and different thinning treatment plots. This was because the control plot had the highest number of trees. There was a 30% difference in the gross volume values between the control plot and the highest-intensity thinning treatment plot (“V”) in object 201 and 47% in object 206. In the control plot of object 201, the volume was 413 m3/ha at age 40, and in object 206, the volume was 272 m3/ha at age 33.
As is evident from
Figure 6, there is an obvious difference between the two established objects if we compare object 201 at the same age as object 206. The control plot in object 206, which has the highest volume, has generated the same volume as the thinning treatment plot “IV” in object 201. This could have occurred for several reasons. Mainly, object 206 was established on forest land as a next-generation planted forest, whereas object 201 was planted as a new forest on former agricultural land. Subsequently, some additional soil nutrients could be left over after agricultural activities and fertilization. The nutrient-rich soil could result in a higher rate of tree growth. Despite the differences between objects, there are also differences between plots. In object 201, a 40% difference in productivity was observed between plots “I” and “V” during the last period. Similarly, there was a 49% difference in productivity between plots “I” and “V” in object 206.
Although the control plots had the lowest average DBH and the highest competition between trees, they generated the largest amount of gross volume and had the highest productivity. This tendency resulted from the high number of trees found in the control plots. However, these plots also had high mortality rates.
4. Discussion
The question of whether it is possible to increase the natural growth of forest stands by removing some of the trees has inspired generations of foresters to test many different thinning methods [
28]. Lithuania is no exception in this regard. This study presents the results obtained from the thinning experiments that supplement previously published papers by Kuliešis and Saladis [
26] and Kuliešis et al. [
5].
Río et al. [
9] highlight the importance of long-term experimental plots. They state that these experiments provide the best means to test the long-term effects of thinning on ecosystem services as well as contribute in unique ways to forest ecosystem monitoring.
Indeed, thinning experiments in Lithuania that lasted for more than thirty years have provided valuable knowledge and contributed to understanding the influence of stand density on the volume, diameter, and height increment of Scots pines. These experiments are carried out by manipulating the initial densities of trees as well as the number and intensity of subsequent thinnings.
Kuliešis and Saladis [
26] claimed that intensive thinning at a younger age is the precondition for a higher yield level. This statement was made at a very early stage of this experiment when pines were 11–17 years old. Additionally, the formulated conclusions represented a rather common belief among Lithuanian scientists at the time and were not supported by experimental data. However, in the next paper, Kuliešis et al. [
5] concluded that the total productivity of thinned stands at various densities comprised 45–85% of the control stands’ productivity at the age of 17–24 years. These findings are in line with the results of Scandinavian thinning experiments. For example, Mäkinen and Isomäki [
3] concluded that the total stem volume and merchantable timber volume produced were the highest in the unthinned plots. Similarly, the same conclusion that all Scots pine thinning treatments reduced the gross stem volume production compared to the unthinned control plot was made by Nilsson et al. [
29] in the paper that summarized the results of Swedish thinning experiments.
The results of this study, taken when pines were 33–39 years old, did not differ from the results of Kuliešis et al. [
5], as the highest standing volume and total production were found in unthinned stands. Furthermore, the periodic annual volume increment obtained showed decreasing patterns compared with the last inventories that were made in 2015 for all thinning treatments. This was a rather unexpected result because periodic annual volume increments in heavily thinned variants should culminate much later compared to the unthinned variants [
30]. It is important to note that no thinning treatment plots have been damaged by winds or bark beetle attacks since the beginning of the Scots pine experiments.
Regarding the diameter increment of trees and the mean diameter increment, Kuliešis and Saladis [
26] stated that the latter increases by 1.4 to 2.4 times in thinned stands. The same findings were confirmed in the subsequent work of Kuliešis et al. [
5]. Generally, these findings are in line with those of many other studies. For example, Río et al. [
9] state that heavy thinning from below increases quadratic mean diameter, even though the authors acknowledge that some part of this increase comes because of the removal of smaller trees. The same effect of thinning on the diameter increment was found by Pukkala et al. [
31], Montero et al. [
1], Mäkinen and Isomäki [
3], Nilsson et al. [
29], and others.
According to Mäkinen and Isomäki [
3], contradictory results exist on the effect of thinning on the height increment. According to the author, the impact of stand density on the height increment was found to be of small consequence. Kuliešis and Saladis [
26], while analyzing the very first results of this experiment after 11–17 years of growth, concluded that the height increment is insignificant in most cases. Further studies performed by Kuliešis et al. [
5] showed that the tree heights of different trials and different density treatments decreased on average by 0.3–0.6 at each density level. The results of this study (
Table 2) showed that a slight decrease in stand density increases the mean height but that heavy thinning leads to lowered mean heights of Scots pine. The negative effect of high densities on the height of trees was also reported by Burkhard and Tome [
32].
Even though the experiments used in this study are rare in their extent and duration, there are several important limitations that need to be highlighted. For example, the accumulation of volume in object 201 follows the trends of site index 30, and in object 206, the accumulation of volume is in line with site index 28. Keeping in mind that the range of site indices in Lithuania for pine varies from 15 (least fertile soils) to 36 (most fertile soils), only a very small proportion of soil types are covered by this experiment. We are presently working on experiments to cover 35–40 years of pine growth. However, the harvesting age for pine in Lithuania is 101 years in commercial forests. So, only one-third of the total Scots pine rotation is covered in Lithuania. Additionally, the long duration of experiments causes technical problems that become more noticeable over time [
8]. For example, different tools used for measuring heights or different technical co-workers could be the source of additional systematic errors. Furthermore, it is possible that original research plans will not be followed in the future.
Based on the experiment’s results, the following practical recommendations were formulated: For the intensive growth of pines, plots with a site index of 28 or higher should be selected. If the goal is to produce medium-sized timber, a rotation of Scots pines of 60–70 years should be chosen until the stand reaches a 26–28 cm mean diameter. For this purpose, object 201 could be used as a prototype, along with its “IV” thinning treatment. In this case, until the age of 65 years, the periodic annual volume increment of 12 m3/ha could be reached, from which 10 m3/ha would be accumulated for final felling. During the rotation, 600 m3/ha would be produced. Timber of larger dimensions could be produced by prolonging the rotation length up to 100–110 years. In this case, mean diameters of 40–45 cm could be reached. As a prototype, we would recommend establishing the same object as 201 and its thinning treatments, “I”–”V.” A possible periodic annual increment of 9–11 m3/ha could be reached, from which 9 m3/ha would be accumulated in the stands for final felling. Yet, the mentioned goals and forecasted results could be easily disrupted by natural disturbances like windthrows, diseases, or bark beetles.
The review of thinning experiments conducted by Río et al. [
9] revealed the scarcity of studies implemented regarding biodiversity and social functions, as well as the large number of ecosystem services and trade-offs between them. These include trade-offs between wood quality, structural diversity, carbon sequestration, adaptation and mitigation of climate change, and thinning interventions. The scientific findings based on established Scots pine thinning experiments in Lithuania have the potential to increase our understanding of the mentioned questions due to the availability of the necessary research infrastructure and the most important experimental materials, processing, and data that already cover 40 years of Scots pine growth.

 ,
, 


