Article

The Influence of Seismic Lines on Wildfire Potential in the Boreal Region of Northern Alberta, Canada

by
Lelia Weiland
1,*,
Tori Green-Harrison
1 and
Scott Ketcheson
1,2
1
Department of Geography, Faculty of Arts, Main Campus, University of Calgary, Calgary, AB T2N 1N4, Canada
2
Athabasca River Basin Research Institute, Faculty of Science and Technology, Main Campus, Athabasca University, Athabasca, AB T9S 3A3, Canada
*
Author to whom correspondence should be addressed.
Forests 2023, 14(8), 1574; https://doi.org/10.3390/f14081574
Submission received: 27 June 2023 / Revised: 26 July 2023 / Accepted: 28 July 2023 / Published: 1 August 2023

Abstract

:
Seismic lines are cleared corridors for the location mapping of subsurface bitumen. After use, the lines can be left to regenerate naturally with varying success. Wildfires, another prominent disturbance in the Boreal region, are propagated by continuous fuel distribution (coarse/fine), meteorological variables (e.g., wind speed, temperature, and precipitation), and the moisture content of the fuel and soil. However, little is known about seismic lines and the potential risk and severity of wildfires. This work presents a case study of wildfire variables on two paired (seismic line and adjacent natural area) sites near Fort McMurray, Alberta, Canada. Wind speed was increased on seismic lines, and the dominant wind direction changed. Higher precipitation, air temperature, and soil moisture and reduced water table depths were observed on seismic lines. Coarse fuel distribution was not continuous on seismic lines; however, fine fuels were. Although the Fire Weather Index (FWI) indicated an enhanced wildfire potential on one line (NS orientation), peat smouldering and ignition models (Hcomb/Hign) showed increased smouldering potential on both seismic lines compared to adjacent natural areas. Future work should focus on expanding the diversity of seismic line characterization, working towards the landscape-scale modelling of these variables.

1. Introduction

Seismic lines are linear features created by the oil and gas industry to locate optimal sites for resource extraction [1]. Natural areas are cleared of their woody vegetation cover in a linear fashion to enable access for heavy machinery, which generates seismic waves and allows for the imaging of the subsurface and locating of bitumen deposits [1]. After exploration is complete, the disturbed areas are often left alone to allow for vegetation to grow back. However, this removal of vegetation and use of heavy machinery results in soil compaction [2] and creates a challenging environment for natural vegetation regrowth. As such, there are millions of kilometres of abandoned lines in the Boreal region of Northern Alberta [1] that are characterised by poor natural recolonization of the vegetative cover [3]. This is especially true in peatlands where soil compaction is enhanced [4,5] and microtopography can be reduced [6]. The resultant landscape is overlain by a gridded network of narrow open corridors within natural ecosystems, which have negative impacts on wildlife (e.g., enhanced caribou predation by wolves) [7] and alter carbon dynamics (e.g., increased methane emissions from peatlands) [5]. Woodland caribou live in treed peatlands, so the construction of seismic lines contributes to the fragmentation of their habitat [7]. Wolves then use these corridors as accessible paths with which to hunt ungulates, including woodland caribou, disturbing species dynamics [7]. Additionally, seismic lines cause increases in the release of carbon, especially in peatlands where carbon storage is extensive [5].
While seismic lines are a prevalent human disturbance across the Boreal region and peatlands in Northern Alberta, wildfires are a disturbance that is a part of the natural ecosystem cycle; however, they are increasing in size, frequency, and intensity as climate change continues [8,9]. The ease of ignition, behaviour, and danger of wildland fires are strongly influenced by the type, amount, and moisture content of fire fuel, which is influenced by the landscape and dominant forest type [10,11]. Within the Boreal Plains, fire fuels are not only present as above-ground vegetation but also as organic forest debris and thick deposits of organic soils (i.e., peat) that accumulate within peatlands, including forested peatlands [12]. Over 50% of the Boreal Plains Ecozone is covered by peatlands where the organic soils are over 40 cm thick [12]. When thick deposits of organic soils and overlying moss are burned, smouldering combustion can occur, where fuels burn without flame and are propagated by high oxygen contents in porous fuels. Smouldering can propagate downwards through the peat profile and sustain itself for extended periods of time, even in typically unfavourable fire weather conditions [11]. Not only is this type of fire difficult to detect, it creates long-term challenges regarding fire suppression efforts and increases the costs of fire suppression efforts, releases harmful emissions, and releases many decades of stored carbon into the atmosphere [12,13].
In the case of seismic lines where woody vegetation has been removed, organic soils have been compressed, and moisture conditions have been altered [2], the type, physical characteristics, quantity, and moisture of the fire fuel present is changed by the construction of the line and associated disturbance to the state of the natural environment [2]. It remains unknown how seismic lines influence fire behaviour and spread but is believed to have both positive (enhanced wildfire potential) and negative (suppressed wildfire potential) effects [14]. For example, when wildfires interact with seismic lines, it has been found that organic soils burn deeper in the soil profile in the surrounding ecosystem than on seismic lines [15]. Additionally, the compression of organic soils on seismic lines increases the amount of moisture in the peat and decreases the smouldering potential by nearly 50% for certain moss types, which has the potential to decrease fire spread [16]. An increase in soil moisture content and site wetness documented on seismic lines that cross peatlands [5] will naturally lead to a decrease in wildfire potential. The greater the moisture content, the more energy that is required to transform liquid water to water vapour; therefore, there is less potential for the fire to propagate to an adjacent unburned area [13,17]. A decreased depth-to-water table has the potential to increase bulk density. The increased bulk density of soils can increase water table fluctuations by lowering specific yield and can also increase burn severity [18]. With an increase in bulk density, there is more fuel within a given volume of soil [16]. However, the moisture retention also increases and the ability for vegetation to take root and grow decreases, reducing wildfire potential [16]. In general, previous studies have shown that an increase in bulk density likely increases wildfire potential [19]. Previous studies have also found that an increased depth-to-water table decreases the moisture in the soil and increases the potential for wildfire burning [19].
The decrease in vegetation on seismic lines disrupts coarse fuel continuity; however, the herbaceous vegetation on seismic lines may counteract this since it supports high rates of fire spread [20,21]. Other studies have shown that when canopy cover is reduced or eliminated, more incoming radiation reaches the ground surface, increasing soil temperatures and the amount of energy available for evaporation, thereby creating dry conditions that are favourable for fires [22]. Previous studies have found that increased wind speeds, such as those that may occur on an open seismic line relative to the adjacent intact ecosite, will increase fire propagation potential [23,24]. Wind has a large impact on the movement of a fire front, whereby increased wind speeds up to 6 m/s will increase the length of the flame [23] and fire front speeds are 50% greater with winds between 2 and 6 m/s [24].
An increased propagation of wildfires on seismic lines is not inherently negative, as wildfires have been found to stimulate recovery by increasing woody vegetation regrowth [3]. When seismic line exploration is complete, the goal of many companies is to restore these seismic lines back to their original state, with a few of the key goals including reduced wolf movement, restored carbon dynamics, and re-established tree cover [25]. Additionally, the interaction of the seismic line and a wildfire can negatively influence the natural recovery of the adjacent ecosystem, where wildfire recovery is reduced in areas near to seismic lines [26]. These findings highlight the complexities associated with wildfire disturbance intensity and subsequent recovery and indicate that in-depth research is still needed to identify the most important influencing variables and determine how they change under varying levels of disturbance and recovery. As the proportion of disturbance due to seismic line construction and wildland fires is continuing to increase, it has become increasingly more important to understand the influence that seismic lines have on wildfire spread and behaviour while also recognizing the impact seismic lines have on post-fire recovery. The alteration of fire fuel, vegetation growth, canopy cover, and moisture regimes on seismic lines is important to consider when creating and restoring seismic lines and managing wildfire risk.

2. Objectives

The objectives of this study are as follows: (a) to compare the fuel conditions and meteorological variables that control wildfire potential and behaviour on seismic lines and in adjacent ecosystems and (b) to use the Fire Weather Index [10] to determine if the conditions present on our studied seismic lines increase or reduce the potential of wildfire ignition and propagation.

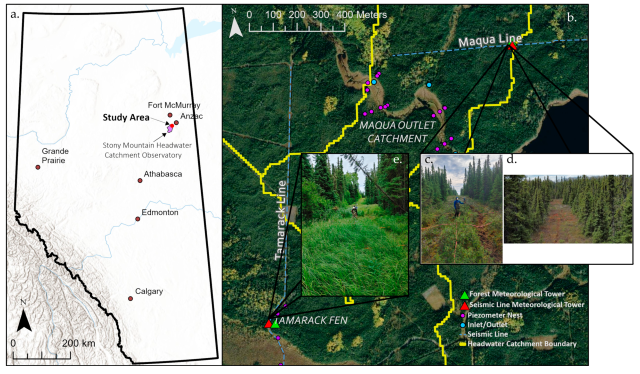
3. Materials and Methods
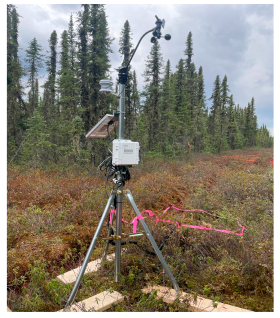
For this study, two main sites were identified to measure a suite of meteorological variables on seismic lines and in adjacent ecosystems in the Boreal region of Northern Alberta, Canada (Figure 1a). The first site was a seismic line oriented in an East–West direction (called EW, Figure 1b). This seismic line intersects a moderate–rich fen peatland consisting of more than 40 cm of accrued organic material. The primary vegetation at this site predominantly consists of Picea mariana (black spruce) with some Larix laricina (tamarack) trees (average height ~3 m), along with an Ericaceous shrub layer (dominated by Ledum groenlandicum/Labrador tea) and a ground layer of Sphagnum moss. The tree cover within the natural area has a basal area of 56.9 square meters per hectare and contains 24,666 trees per hectare [27]. The seismic line at this site was cut in 1998, is 7 m wide, and has recovered a few black spruce trees with an average height of 40 cm (Figure 1c,d).
The second site was located on a North–South-oriented seismic line (called NS, Figure 1b). This seismic line crosses a transitional zone between a forested upland and a moderate–rich fen peatland with less than 40 cm of organic material present in most locations. The primary vegetation present at this site consists of graminoids on the seismic line and a mixed wood forested area dominated by black spruce and tamarack trees (average height ~5 m), with some Betula pumila (dwarf birch) present in the natural area. The basal area in the surrounding natural ecosystem is 119.8 square meters per hectare, and there are 25,000 trees per hectare. The seismic line present at the site was cut in 1998, is 7 m wide, and has not recovered any tree cover (Figure 1e).

3.1. Meteorology

To analyse the meteorological variables governing the variation in wildfire potential on seismic lines, two Hobo U30 USB [28] meteorological stations were deployed (Figure 2). These stations recorded data hourly in paired locations, with one station located in the centre of the seismic line and the other 25 m into the adjacent natural area. These paired stations were deployed at both the EW and NS seismic lines for approximately 6-week intervals, being relocated from one site to the other after a sufficient range of environmental conditions were met. Each meteorological station logged 15 min measurements of wind speed and direction (Onset S-WCF-M003, Davis Instruments Corporation, Hayward, CA, USA), air temperature and relative humidity (Onset S-THC-M002, Onset HOBO Data Loggers, Pocasset, MA, USA), precipitation (Onset S-RGF-M002, Davis Instruments Corporation, Hayward, CA, USA), soil water content (Onset S-SMC-M005, Onset HOBO Data Loggers, Pocasset, MA, USA; 3 depths; 5 cm, 15 cm and 25 cm), and soil temperature (Onset S-TMB-M006, Onset HOBO Data Loggers, Pocasset, MA, USA; 2 depths; 5 cm and 25 cm).

3.2. Water Table

Transects of wells were used to monitor water table position weekly. This involved using a “bubble stick”, a tube with measuring tape attached along the side. Air is blown through the tube down the well, until bubbles are heard, indicating the water surface. The value on the attached measuring tape is recorded.

3.3. Fire Fuel Properties

Measurements of fire fuel properties such as the depth of organic soil and moisture content were taken at 1 m increments along a transect, resulting in 37 total samples, 5 on one side of the seismic line, 7 across the seismic line, and 25 in the natural area on the other side of the seismic line. Samples were taken once a month at each site location while the tower was present. Organic soil was measured using a thin stick with markings indicating depth. The stick was poked through the peat surface until it reached the mineral layer, which was indicated by a gritty, less permeable texture. If the mineral surface could not be found with the probe at a depth of 150 cm, it was recorded as greater than 150 cm. The soil moisture content was measured using a Delta-T WET2 sensor [29]. The probe was placed gently into the ground vertically and values were recorded in triplicate, providing an average soil moisture measurement within the upper 0–5 cm.
Surface microtopography was measured in 37 m transects at each site. For this, an altimeter [30] which measures the relative elevation changes between two points (±0.254 cm) was used. The altimeter was zeroed at the beginning of the transect, and surface elevation values were recorded every 1 m. A vegetation survey was also conducted, measuring the heights of the tallest vegetation and species as well as percent cover of mosses, shrubs, grasses, and lichen.
Soil sampling was performed using rings with a volume of 250 cm3, height of 50 mm, and inner diameter of 80 mm. These samples were taken along the transect at the surface (0–5 cm) and 10 to 15 cm depth at the centre of the seismic line, the edge of the seismic line, and 25 m into the adjacent natural area to determine the bulk density and saturated hydraulic conductivity of the organic and mineral materials in the lab. The samples were saturated from below then weighed to obtain saturated weight values. The samples were dried in an oven at 80 °F for a minimum of 24 h until a constant weight was achieved. Once removed, the samples were weighed again to obtain a dried weight value. Bulk density was then calculated using the following Equation (1):
B u l k   D e n s i t y ( g c m 3 ) = D r i e d   W e i g h t ( g ) S o i l   V o l u m e ( c m 3 ) ,

3.4. Smouldering Potential

Combustion and Ignition Ratios were calculated [31]. The smouldering potential is calculated as the ratio of the energy released during the combustion of the surface of the soil (Hcomb) and the energy needed to ignite the adjacent fuel (deeper soil) (Hign). If Hcomb/Hign ≥ 1, then there is potential for smouldering. First, the gravimetric water content was calculated from the measured volumetric content as:
m = V W C 100 ρ b W D
where m is the unitless gravimetric water content, VWC is the volumetric water content in %, ρb is the bulk density of the surface soil in kg/m3, and WD is the water density, being 1000 kg/m3. Then, Hcomb is calculated as:
H c o m b = ρ b x E c o m b
where x is the thickness of the organic soil layer in meters and Ecomb is the heat of combustion per unit mass of fuel of sphagnum peat (14.2 J/kg). The ignition energy required to ignite adjacent fuel is calculated as:
H i g n = h ρ b x
where h is the heat of ignition in J/kg, calculated by:
h = 2585 m + 588

3.5. Fire Weather Index

Calculations were completed for the fire weather index (FWI) [32]. The FWI was created by the Canadian Forestry Service to model fire potential in pine stands. It takes into account three moisture codes and three indices using noon-time weather variables and 24 h cumulative precipitation, resulting in one final fire weather index [10]. The Fine Fuel Moisture Code (FFMC) takes into account moisture in the litter and surface moss. The Duff Moisture Code (DMC) accounts for moisture within the decomposing organic soil layer. The Drought Code (DC) accounts for moisture in highly compacted organic material. These moisture codes are then transformed into three indices. The first is the Initial Spread Index (ISI), combining the FFMC and wind speed to explain the rate of spread in the first layer of fuel. The Build Up Index (BUI) combines the DMC and DC to explain how much fuel there is to spread the fire. Finally, the FWI combines the BUI and ISI to explain rate of spread of the fire alongside fuel matter.
During time periods when precipitation was absent (28 May–17 June for EW; 31 July–9 August for NS seismic line), tipping bucket rainfall gauges from nearby research meteorological stations were used to fill the missing precipitation data (0.7 km from EW site; 0.02 km from NS site).
For calculations at the NS and EW sites, starting values for the FFMC, DMC, and DC were applied to each station using the previous day’s value, calculated with data from the nearby Surmont weather station (data accessed from Canadian Forest Service [33], location: 56.2236, −110.9590).
The severity of fire weather was then rated using danger classes ranging from low to extreme (based on the Canadian Forest Fire Weather Index System) [10].

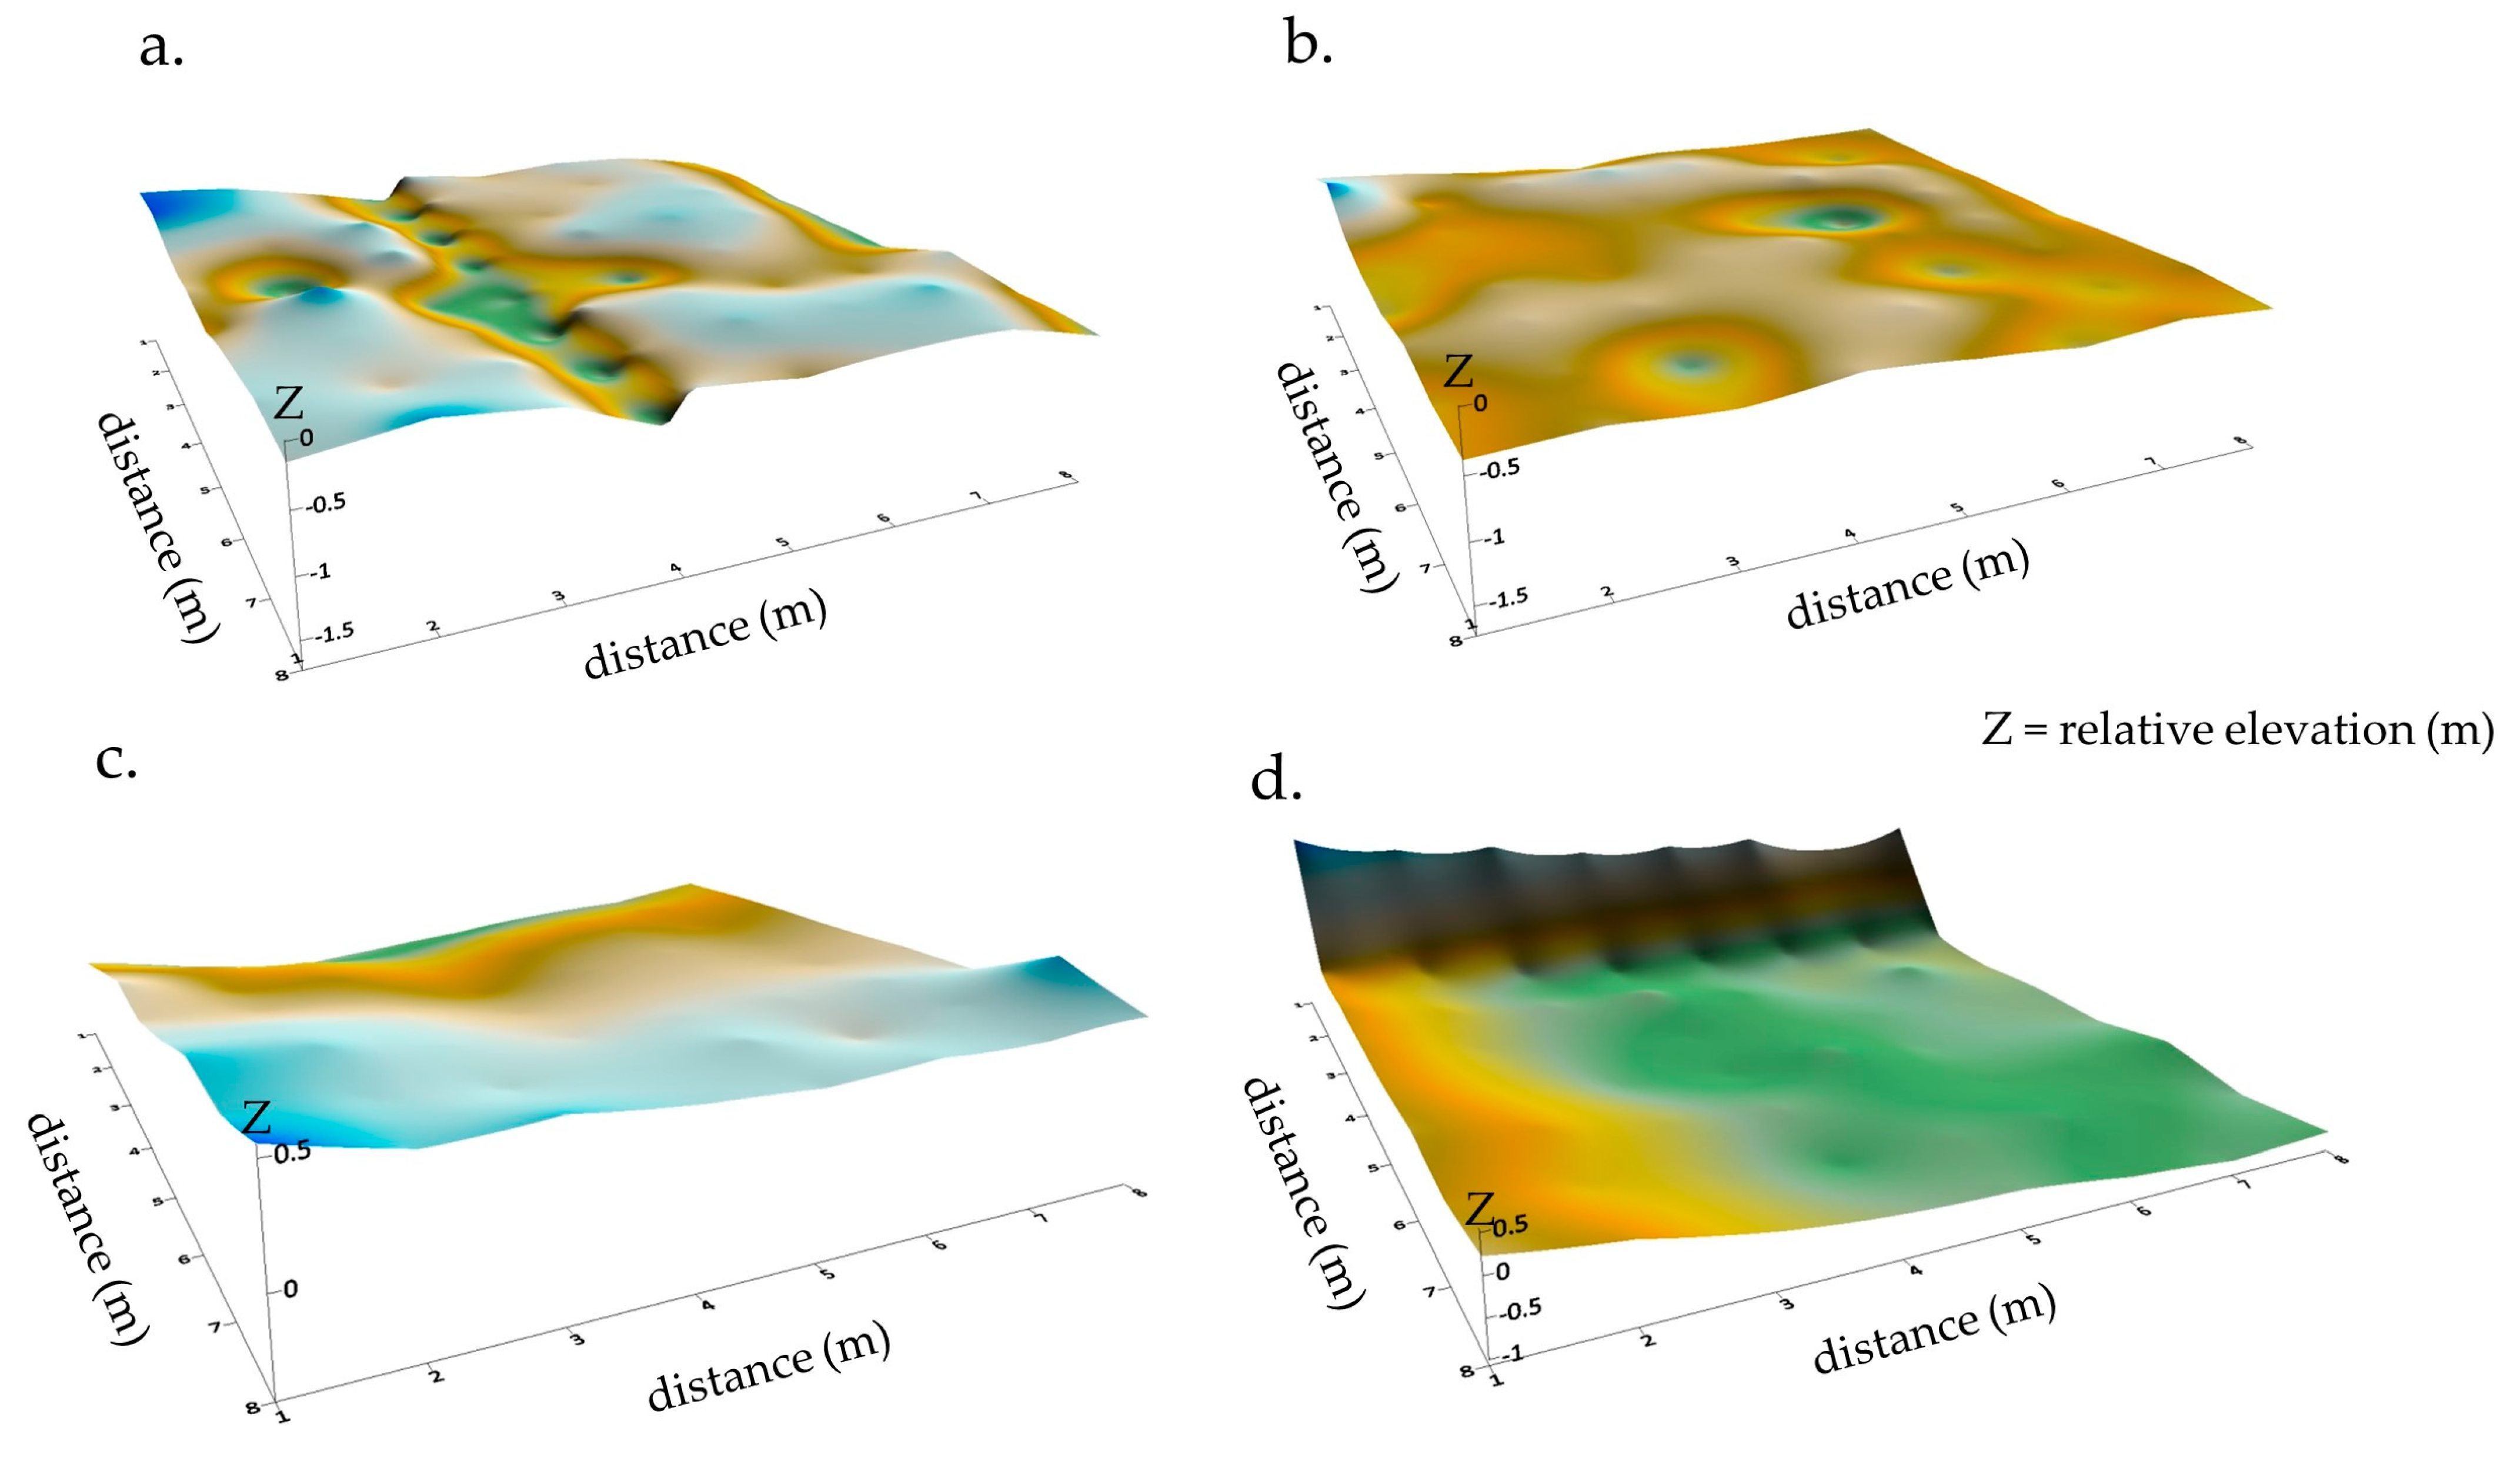
3.6. Surface Microtopography

Surface topography was also measured along a 7 m × 7 m belt plot paired on the line and in the natural area. These values were then input into Surfer (version 25.3.290) [34] software to plot the surface of these belt plots using Kriging. The variance was calculated automatically from this function and recorded. The depth/mineral ratio was also recorded at each point in the belt plot, and this was used to determine the volume of organic material present on the line. Both the upper surface and the mineral surface were plotted on the same grid, and then the volume between them was calculated. The trapezoidal rule was applied in Surfer to calculate the volumes. The surface area of the upper surface was calculated during this step and recorded.

3.7. Statistics and Analysis

Data were analysed using a combination of R (version 4.1.1) [35] and Microsoft Excel. Plots comparing the seismic line values to the natural area for both the peatland EW line and the transition NS line were made. t-tests were completed in R to compare variables on the seismic line to the natural area using the t.test() function. To set up the function, two datasets were used—the seismic line and the natural area—and a non-paired two sample t-test was run.

4. Results

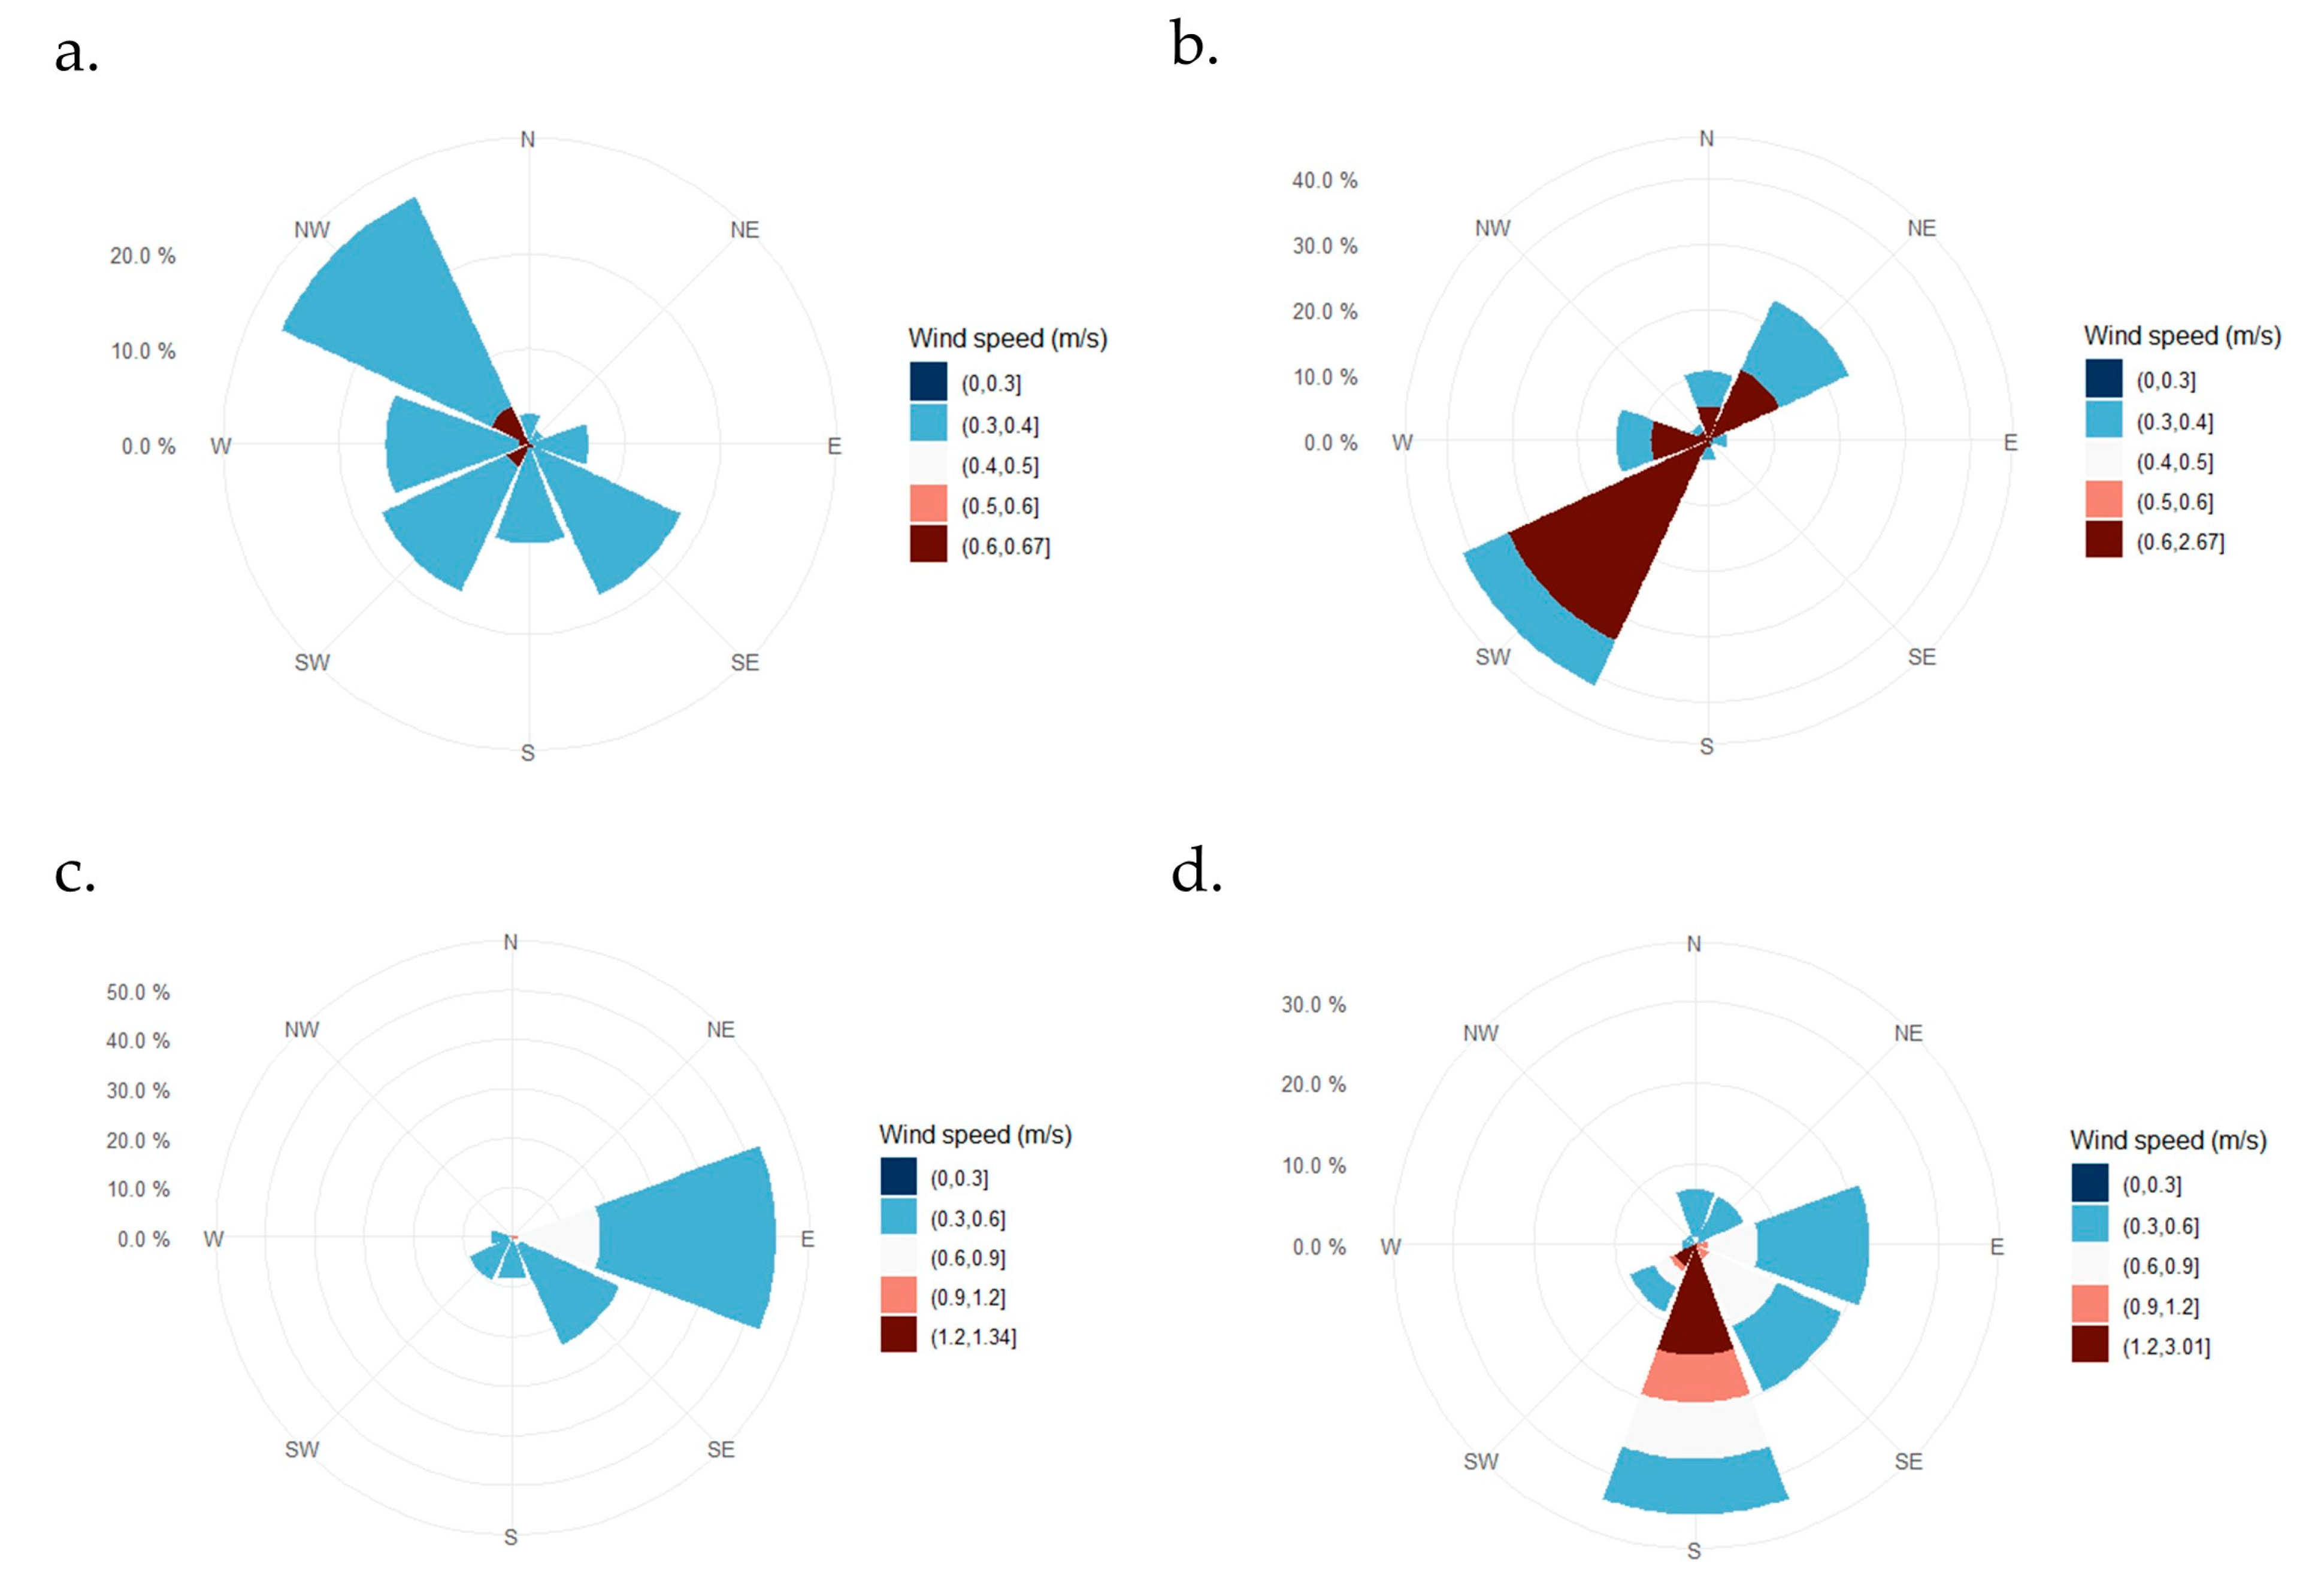
4.1. Wind Speed and Direction
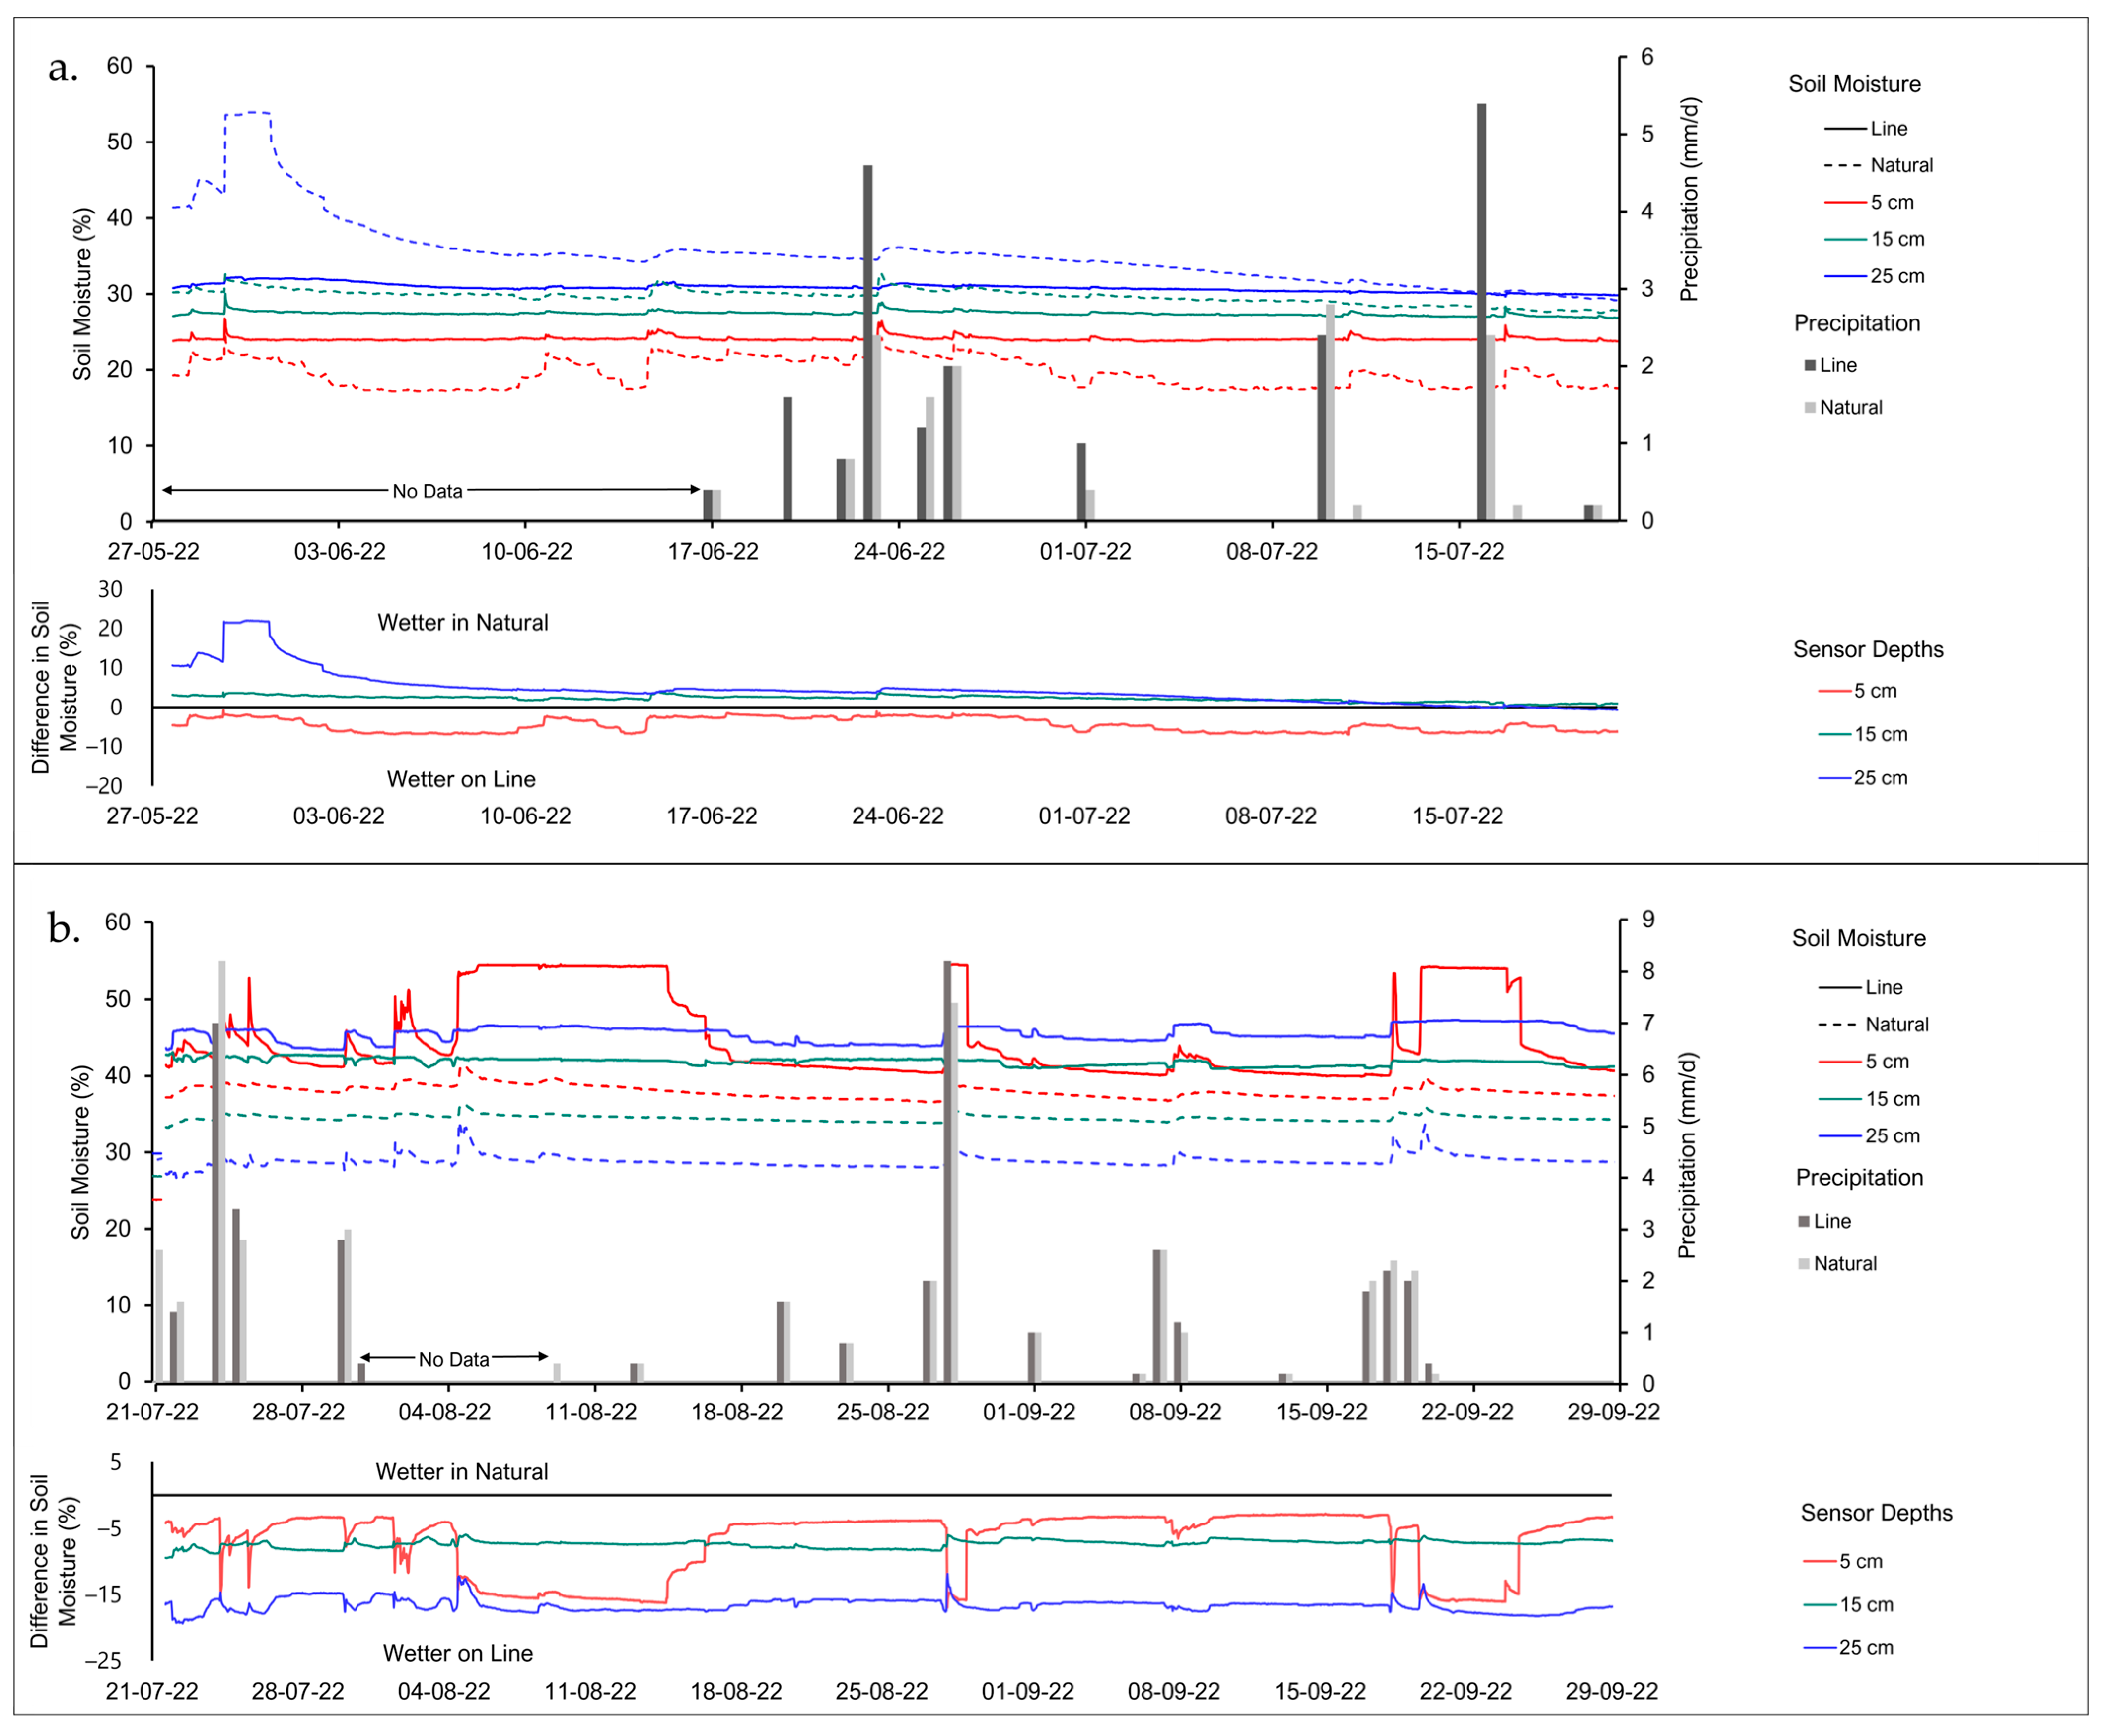
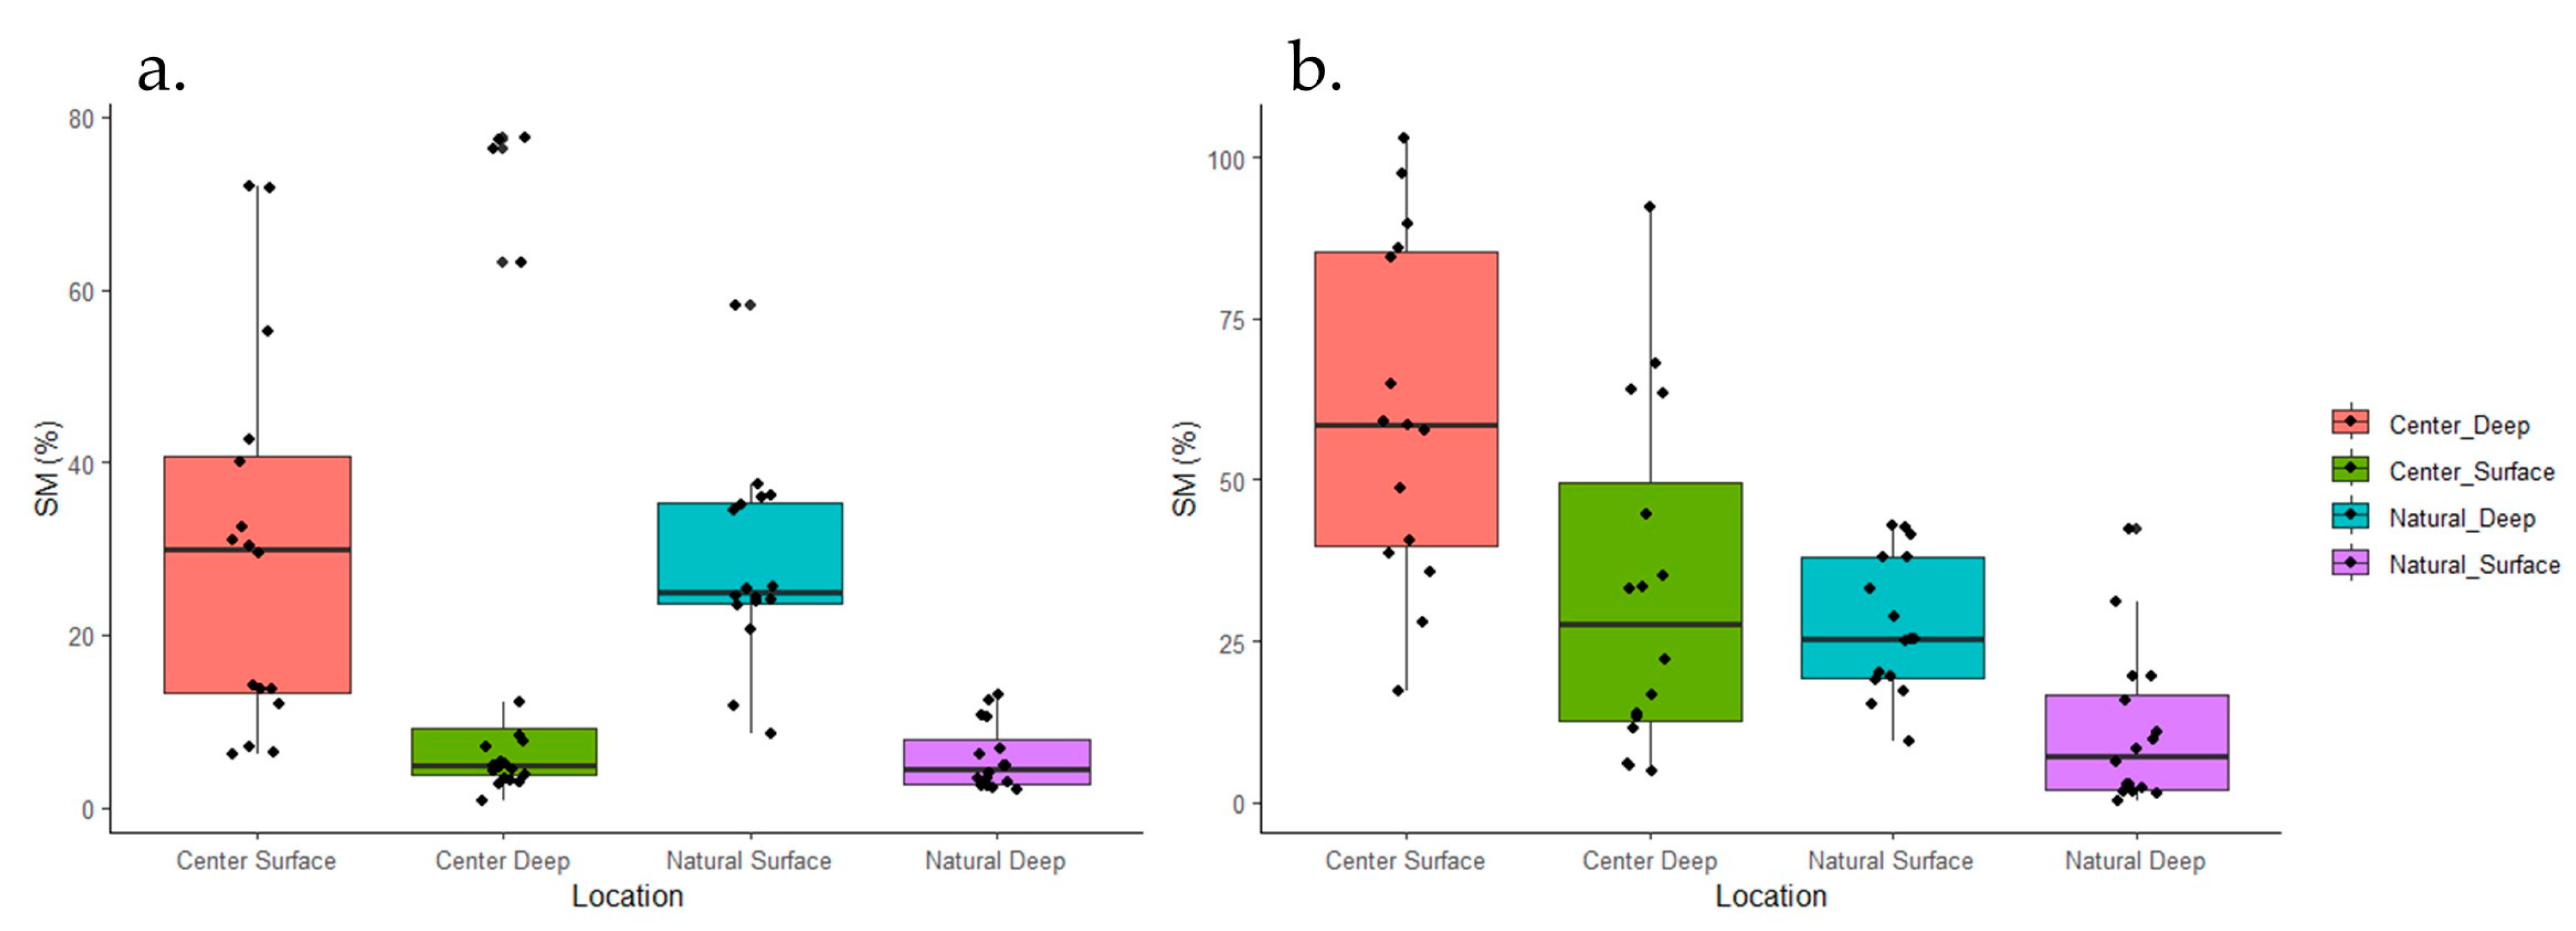
The wind speed and direction recorded on the EW seismic line and adjacent natural area differed. In the natural area (Figure 3a), wind speeds remained quite low (average of 0.08 m/s; maximum 0.67 m/s), with the predominant direction oriented in the NW–SE direction. The wind speeds on the seismic line were significantly higher (p < 0.001), with an average six times greater than in the adjacent area (0.49 m/s) reaching a maximum of 2.67 m/s (Figure 3b). The predominant wind direction was also different than in the adjacent area, with the main direction oriented NE–SW.
On the NS seismic line, similar variations in wind speed and direction were observed. In the natural area, wind speeds reached a maximum of 1.34 m/s (Figure 3c) and were predominantly from the eastward direction (average wind speed 0.11 m/s). On the seismic line, significantly greater wind speeds, up to 3 m/s, were measured (average 0.42 m/s; p < 0.001), with the dominant wind direction coming from the southward direction (Figure 3d).

4.2. Soil Moisture

On the EW seismic line, the soil moisture at the surface (5 cm) was greater on the seismic line than the natural area; however, at greater depths (25 cm), the moisture was higher in the natural area (Figure 4a). At both depths, there was a reduced response to rainfall events on the seismic line, with a precipitation event (23 June) driving an increase in soil moisture in the natural area, while the seismic line did not vary as substantially (Figure 4a. For example, the near-surface soil moisture (5 cm) in the natural area varied from 17% to 26%, whereas it remained between 23% and 27% at the same depth on the seismic line. Similarly, the soil moisture range at 25 cm depth exhibited much less variation on the seismic line than in the adjacent area (Figure 4a).
The NS seismic line remained wetter on the line consistently over the natural area at all depths (Figure 4b). The seismic line responded rapidly to precipitation, and the near-surface (5 cm) reached saturation on three occasions over the study period, while the soil moisture at both 15 and 25 cm depth remained at saturation for nearly the entire study period. The natural area also had an apparent and quick response to precipitation, but the near-surface (5 cm) soil moisture in the natural area (36%–41%) did not vary to the same extent as the seismic line (39%–55%; Figure 4b).
The manual soil moisture measurements were more spatially distributed than the hourly logging soil moisture values above. As shown in Figure 5a, the soil moisture at the surface of the EW seismic line varied more than the natural area and reached greater moisture percentages (centre: 0.88%–77.56%; natural: 2.13%–12.99%). The deeper measurements of soil moisture did not vary greatly between the seismic line and the natural area.
By comparison, the NS seismic line had the greatest soil moisture on the surface of the seismic line, as well as the greatest variability. The deeper soil moisture values were also greater on the seismic line than in the natural area (Figure 5b).

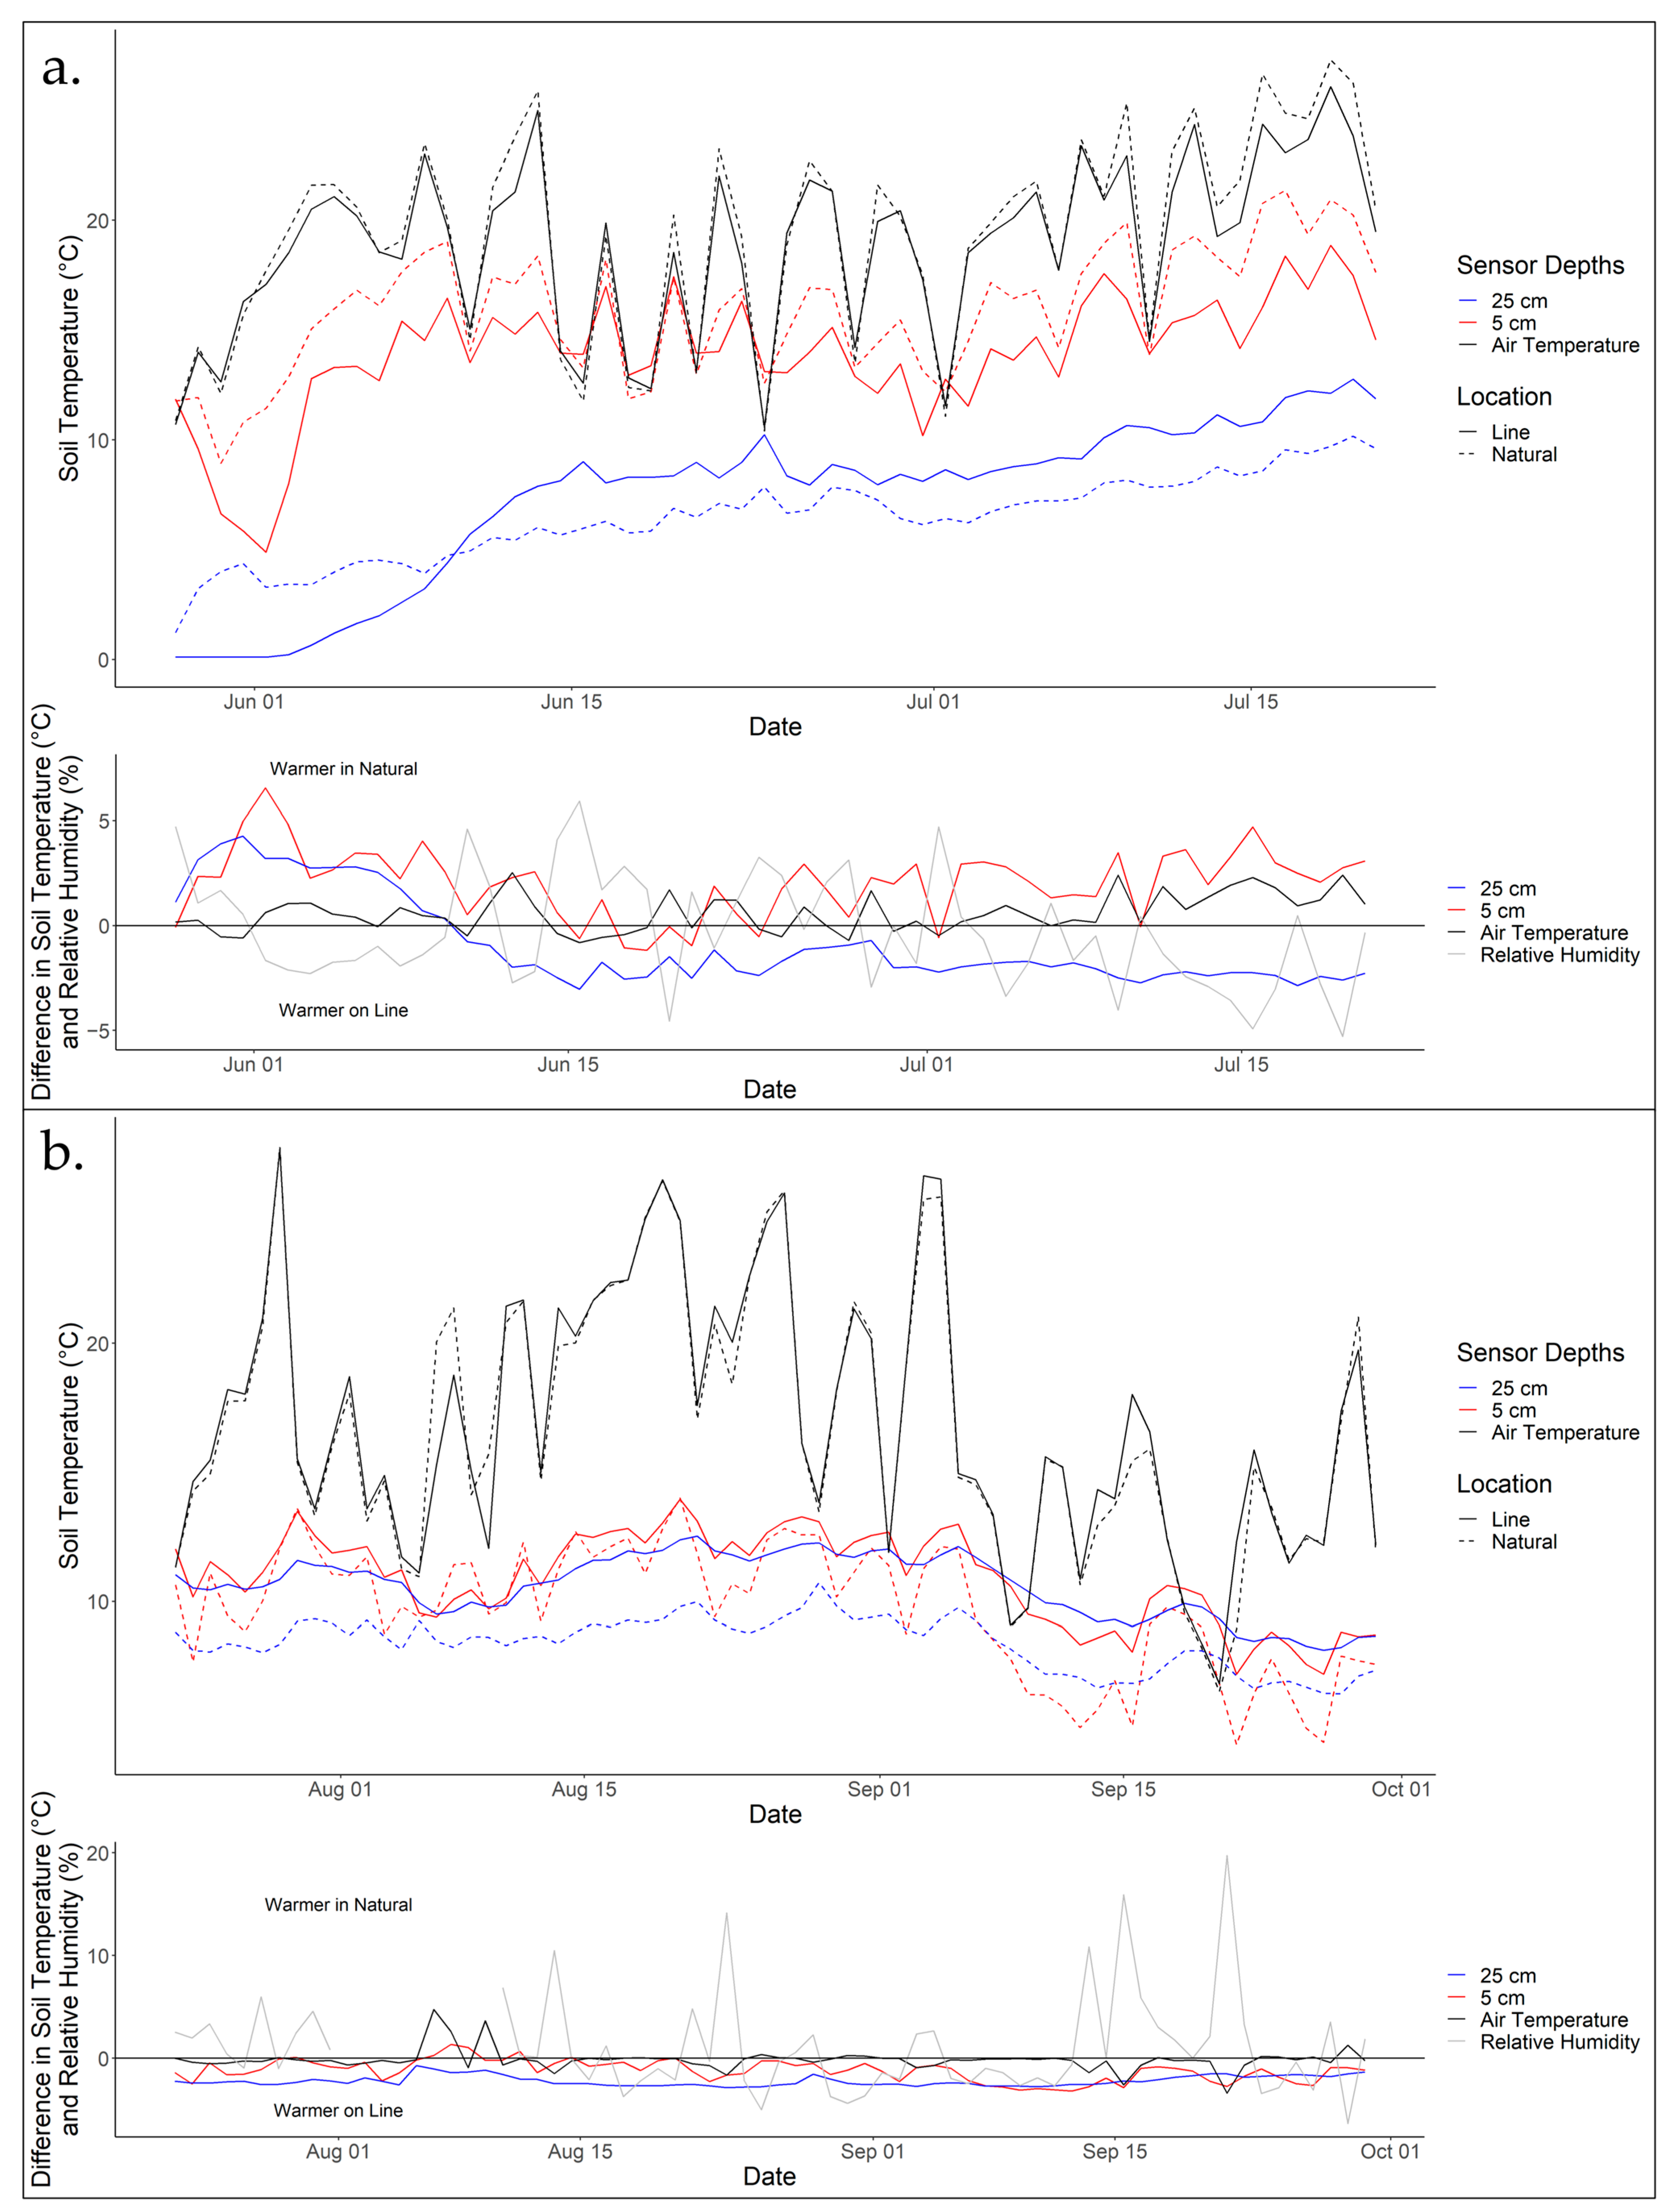
4.3. Soil Temperature

The soil temperature at the surface (5 cm) of the EW study site was consistently and significantly (p < 0.001) higher in the natural area (0.4–39.1 °C) than on the seismic line (1.5–28.0 °C). At 25 cm depth, the seismic line exhibits greater warming than the natural area over the study period, with consistently and significantly (p < 0.001) warmer soil temperature at 25 cm depth on the seismic line generated on 9 June (Figure 6a).
The NS study site was nearly always warmer on the seismic line (5 cm = 7.2–17.1 °C; 25 cm = 8.0–12.8 °C; p < 0.001) than in the natural area (5 cm = 4.4–16.9 °C; 25 cm = 6.3–10.8 °C; p < 0.001) at both depths over the measurement period (Figure 6b).

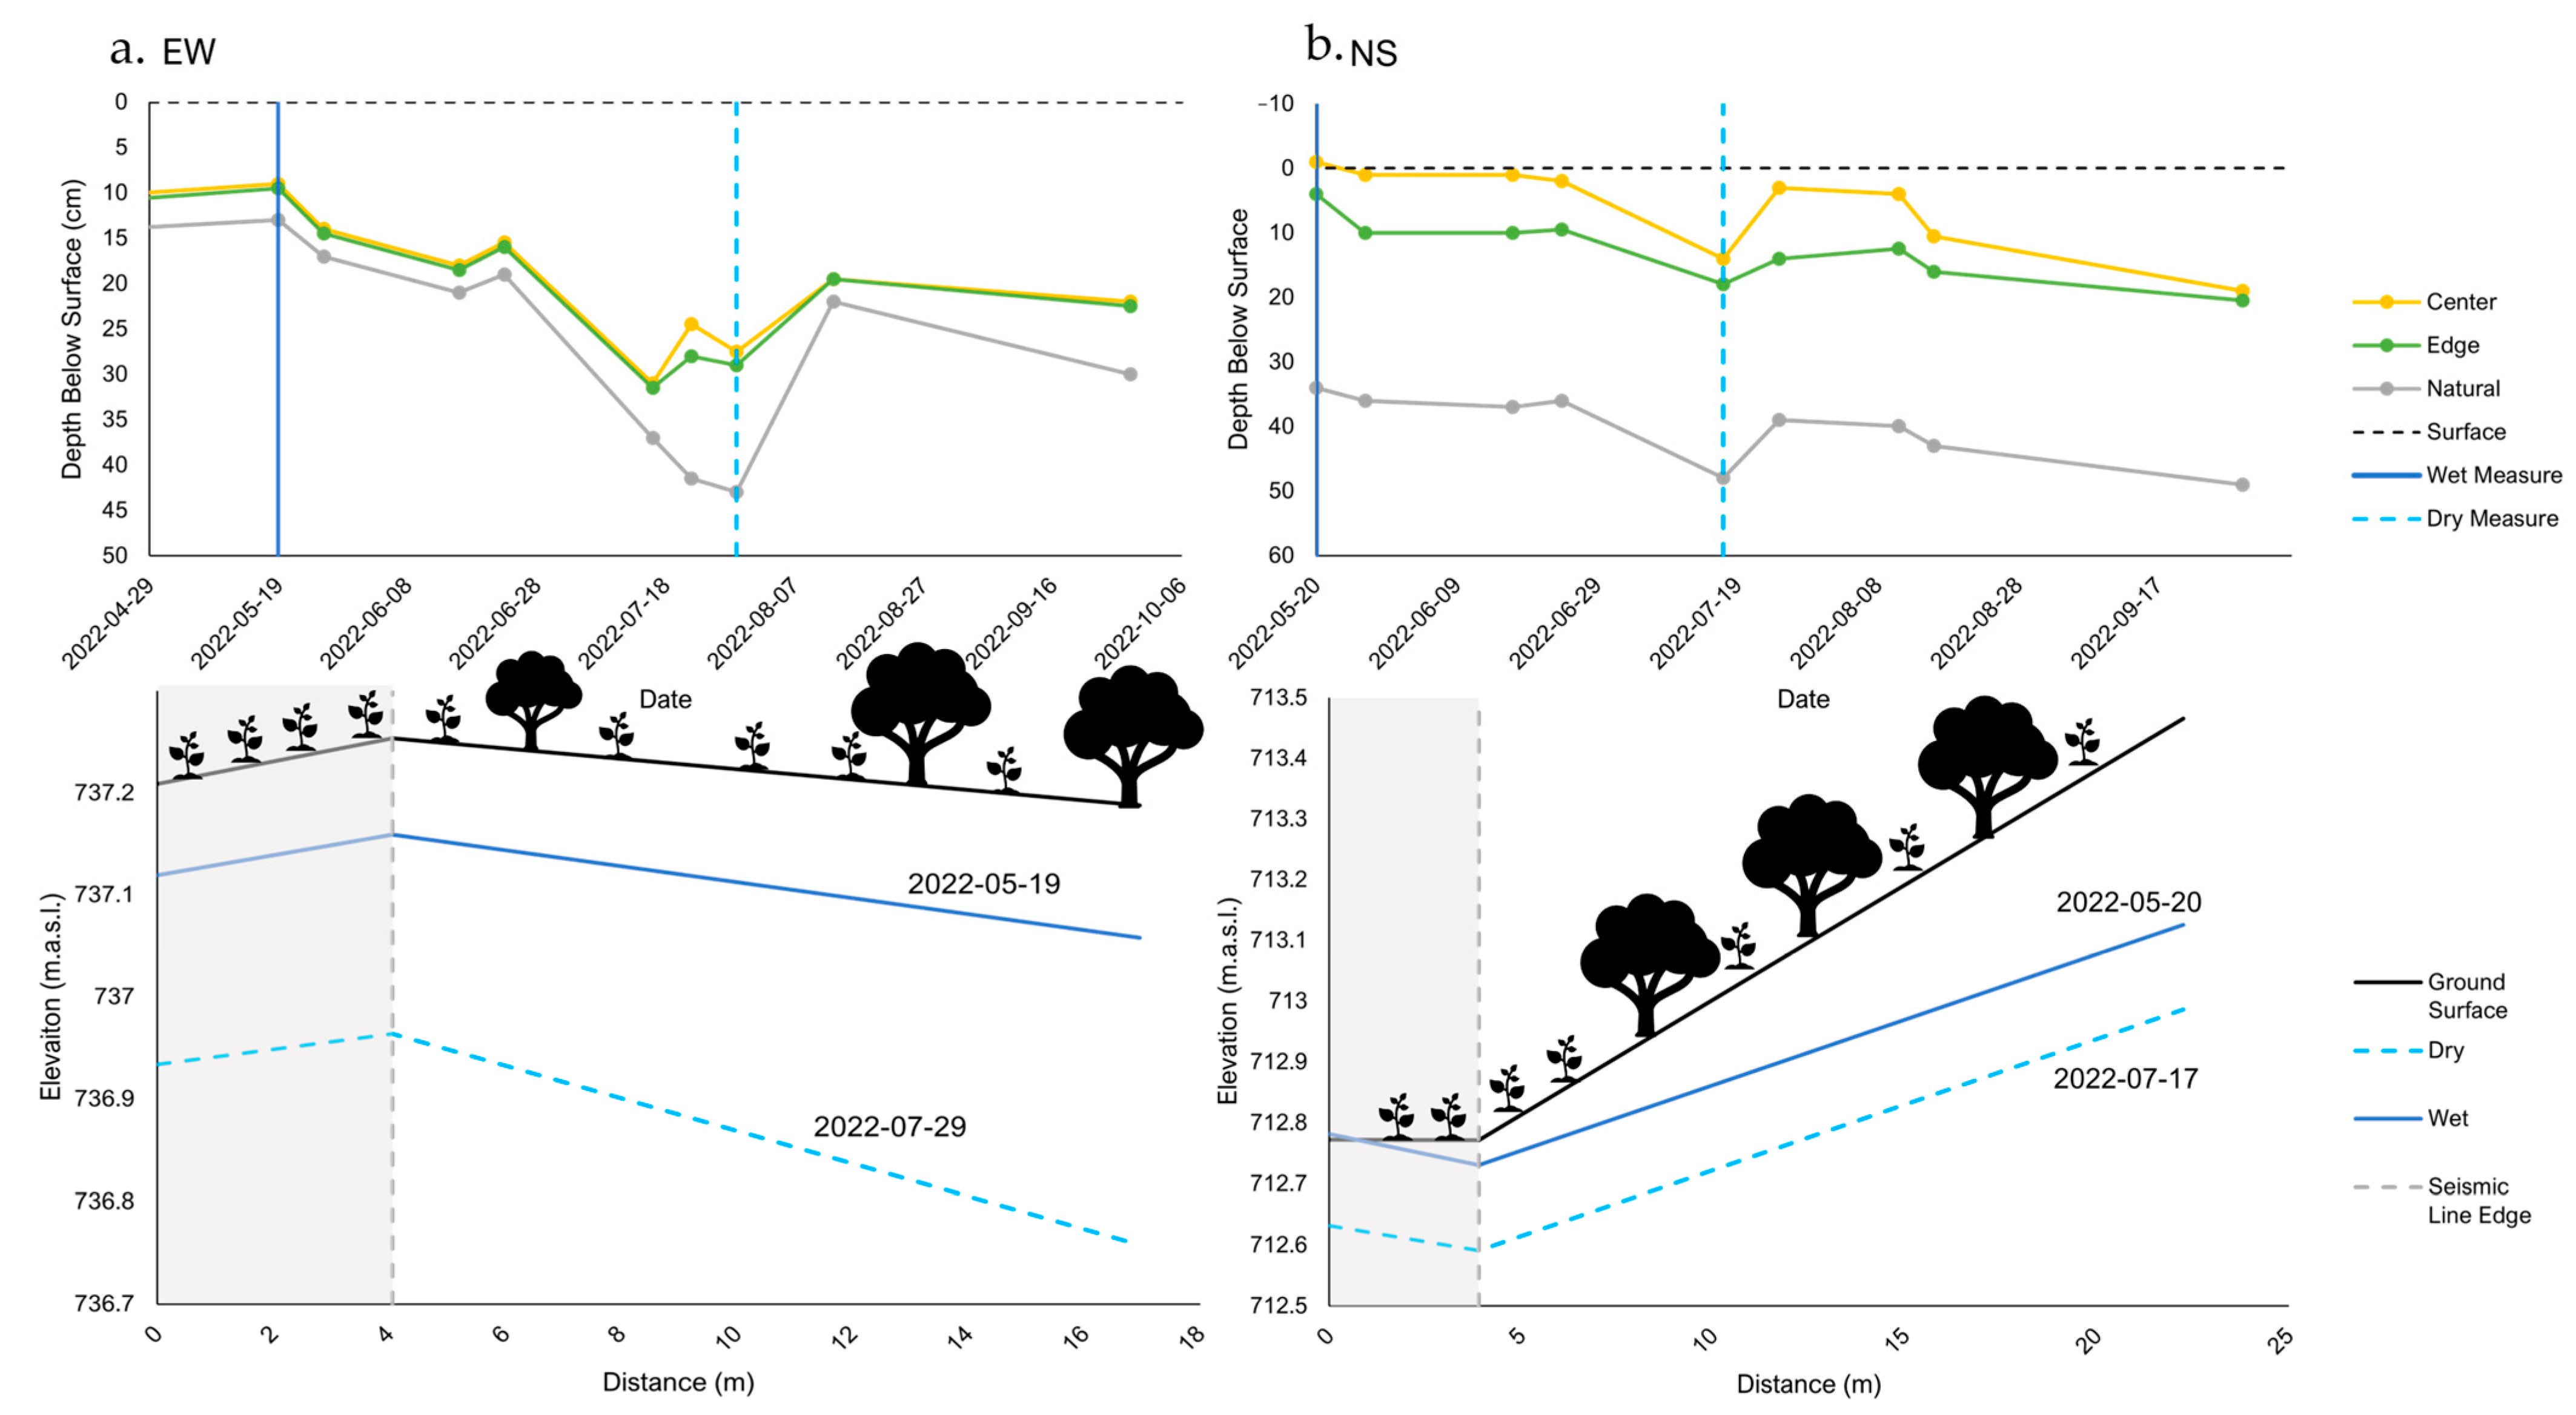
4.4. Groundwater Level and Local Topography

The average water table depth was 6 cm below ground surface (bgs) on the seismic line at the NS study site (range = −1–19 cm bgs), while in the adjacent natural area, the average water table depth was 40 cm (range = 34–49 cm bgs), indicating consistently wetter conditions on the seismic line than in the adjacent area (Figure 7b). Similar water table conditions were observed at the EW study site, where the average water table depth was 20 and 27 cm bgs on the seismic line and in the adjacent natural area, respectively (Figure 7a). The differences in water table depth between the seismic line and natural area were emphasised under dry conditions (difference in water table depth between the seismic line and natural area = 15.5 cm) than under wet conditions (difference in water table depth between seismic line and natural area = 4 cm).
The EW seismic line had a greater presence of organic material than the nearby natural area (Figure 8a). This is also reflected in the volume of organic material present on the seismic line, which was about double that in the natural area. This area also slopes down slightly from the seismic line to the natural area, and the underlying mineral approaches the surface in the natural area (Figure 8a), naturally impacting the depth of organic material. The NS line, however, had much greater organic material present in the adjacent area (Figure 8b). The volume of organic material present was greater in the adjacent area. The underlying mineral layer follows the trend of the organic layer, as the ground slope upwards in the natural area (Figure 8b).

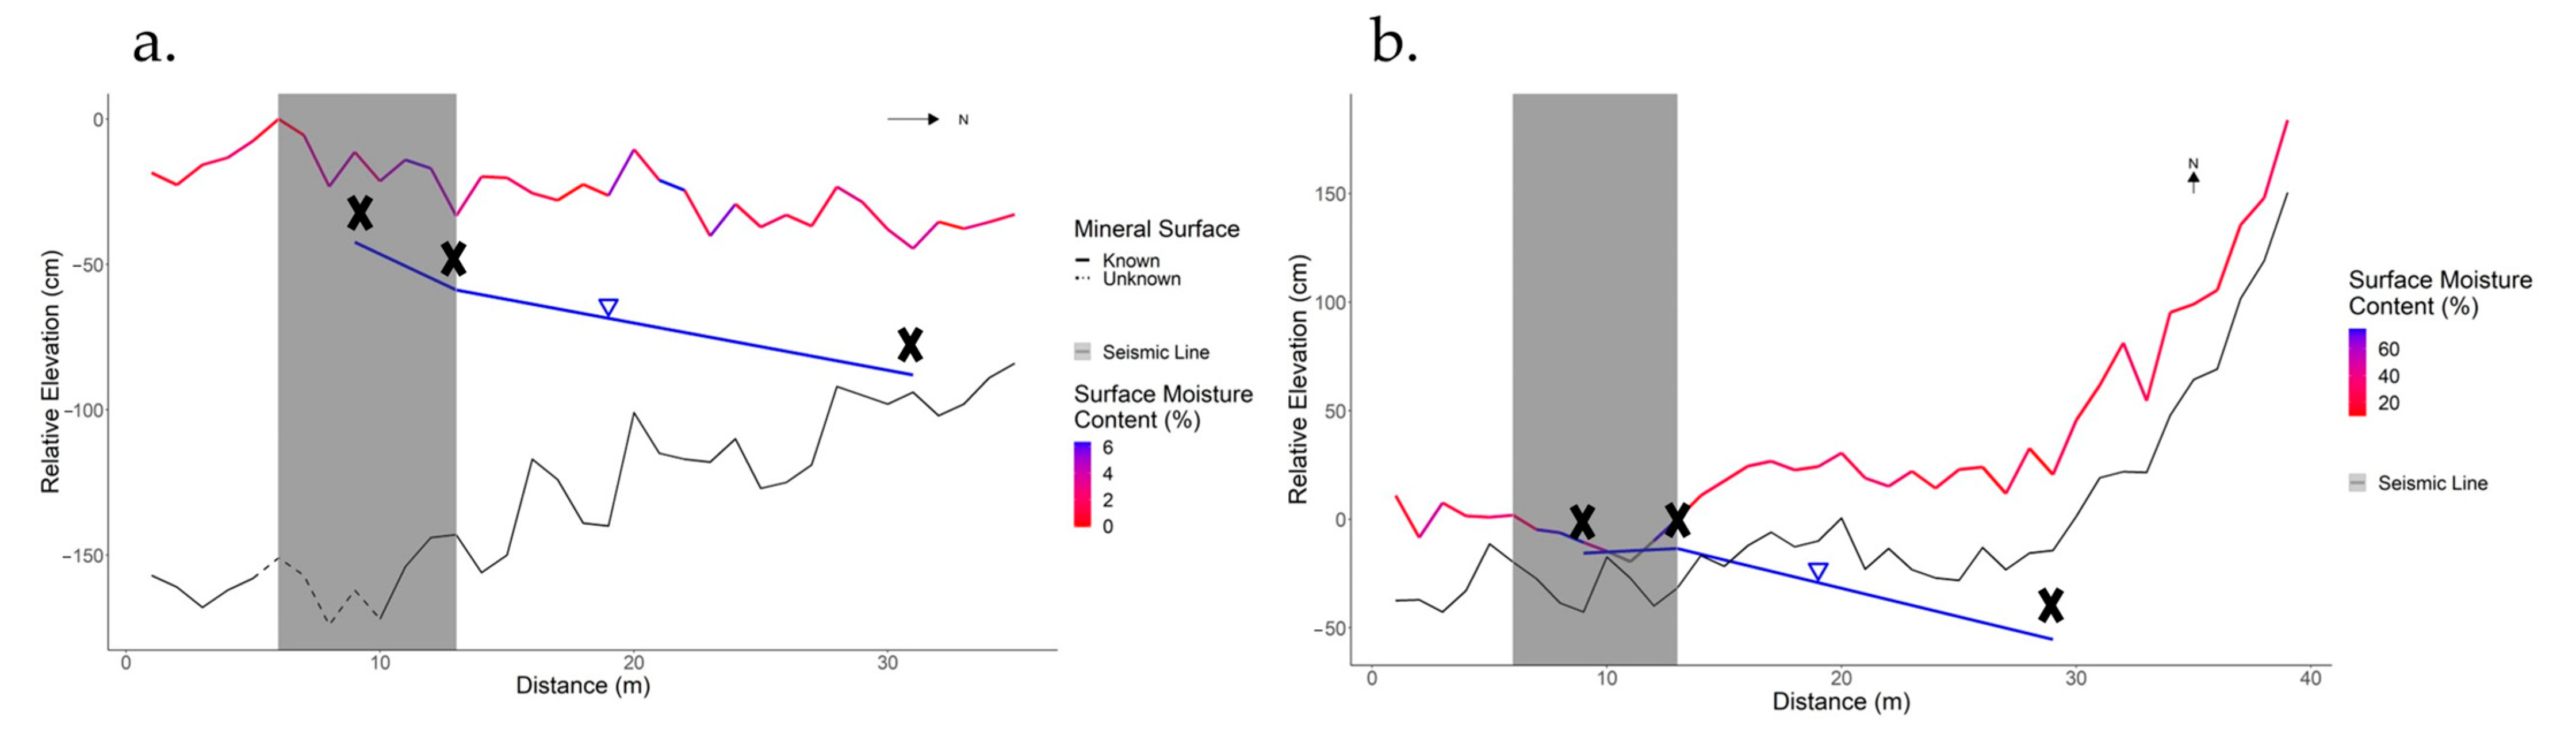
4.5. Microtopographic Variation

Variability, calculated by the variance within the surface microtopographic dataset, was greater on the EW line than the natural area (Table 1). In addition, the seismic line sat at a higher average relative elevation than the natural area (Table 1). The surface area, which can be a proxy for microtopographic variability, was greater on the line than in the natural area for the same size belt plot (Table 1). However, the opposite was true for the NS study site. This site had a greater change in microtopography in the natural area (Table 1). The variability in microtopography on the seismic line was within a small range. The seismic line sat at a slightly lower average relative elevation than the natural area (Table 1). The surface area of the line was slightly less than that of the natural area (Table 1).
The surface of the EW seismic line was more varied than that of the natural area (Figure 9b), with the pathway that was walked to get across the site potentially influencing this result (Figure 9a). The NS seismic line, which was dominated by graminoids, did not vary as much as the Sphagnum-dominated EW seismic line; however, there was greater surface variability in the natural area (Figure 9d) than on the seismic line (Figure 9c).

4.6. Duff Properties

The bulk density of soils at the surface of the EW seismic line was greater than those in the natural area. Additionally, the bulk density of soils at 10–15 cm below the surface was greater on the seismic line than in the natural area (Table 2). The NS seismic line had a greater bulk density on the seismic line, both at the surface and 10–15 cm below the surface. The greatest bulk density occurred at 10–15 cm below the surface of the seismic line (Table 2).
The EW site resulted in Hcomb/Hign values greater than 1, with the values being greatest on the seismic line. By comparison, the NS seismic line resulted in no smouldering potential (Hcomb/Hign < 1). The potential for propagating smouldering on the NS seismic line, though low, was greater than in the natural area. The absolute values in the natural area on the NS seismic line had the lowest combustion/ignition ratio (Table 2).

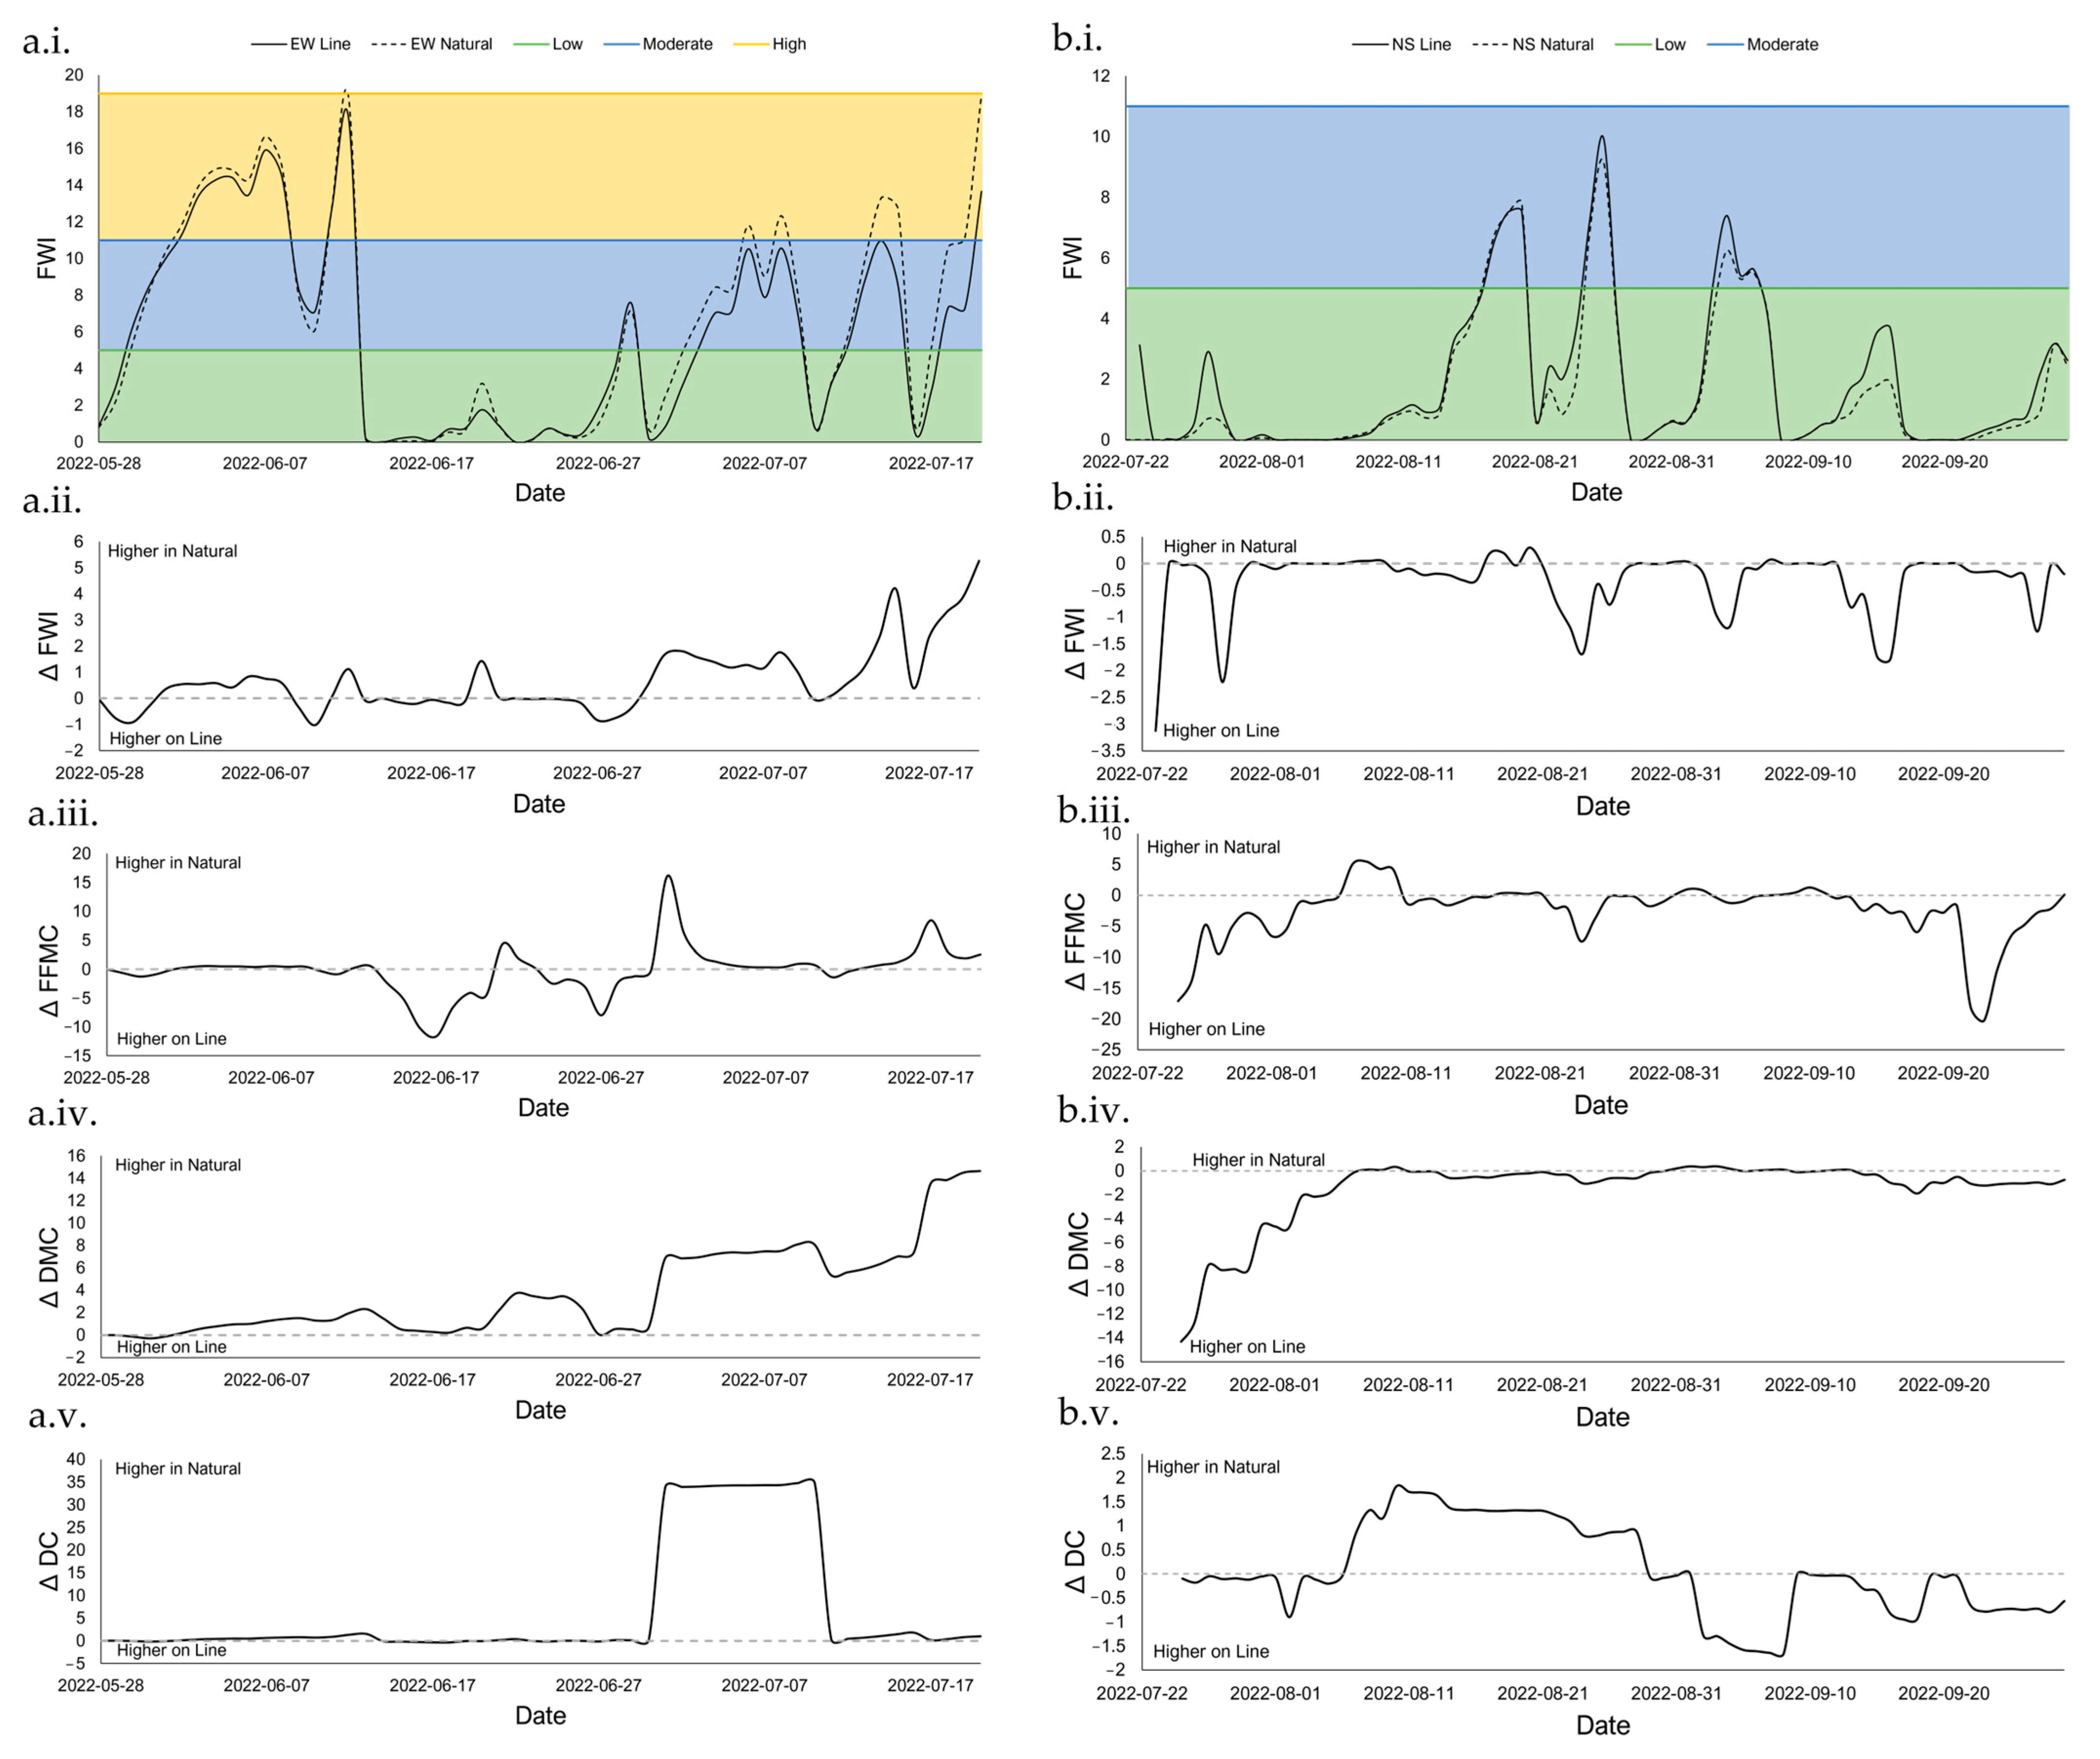
4.7. Fire Weather Index
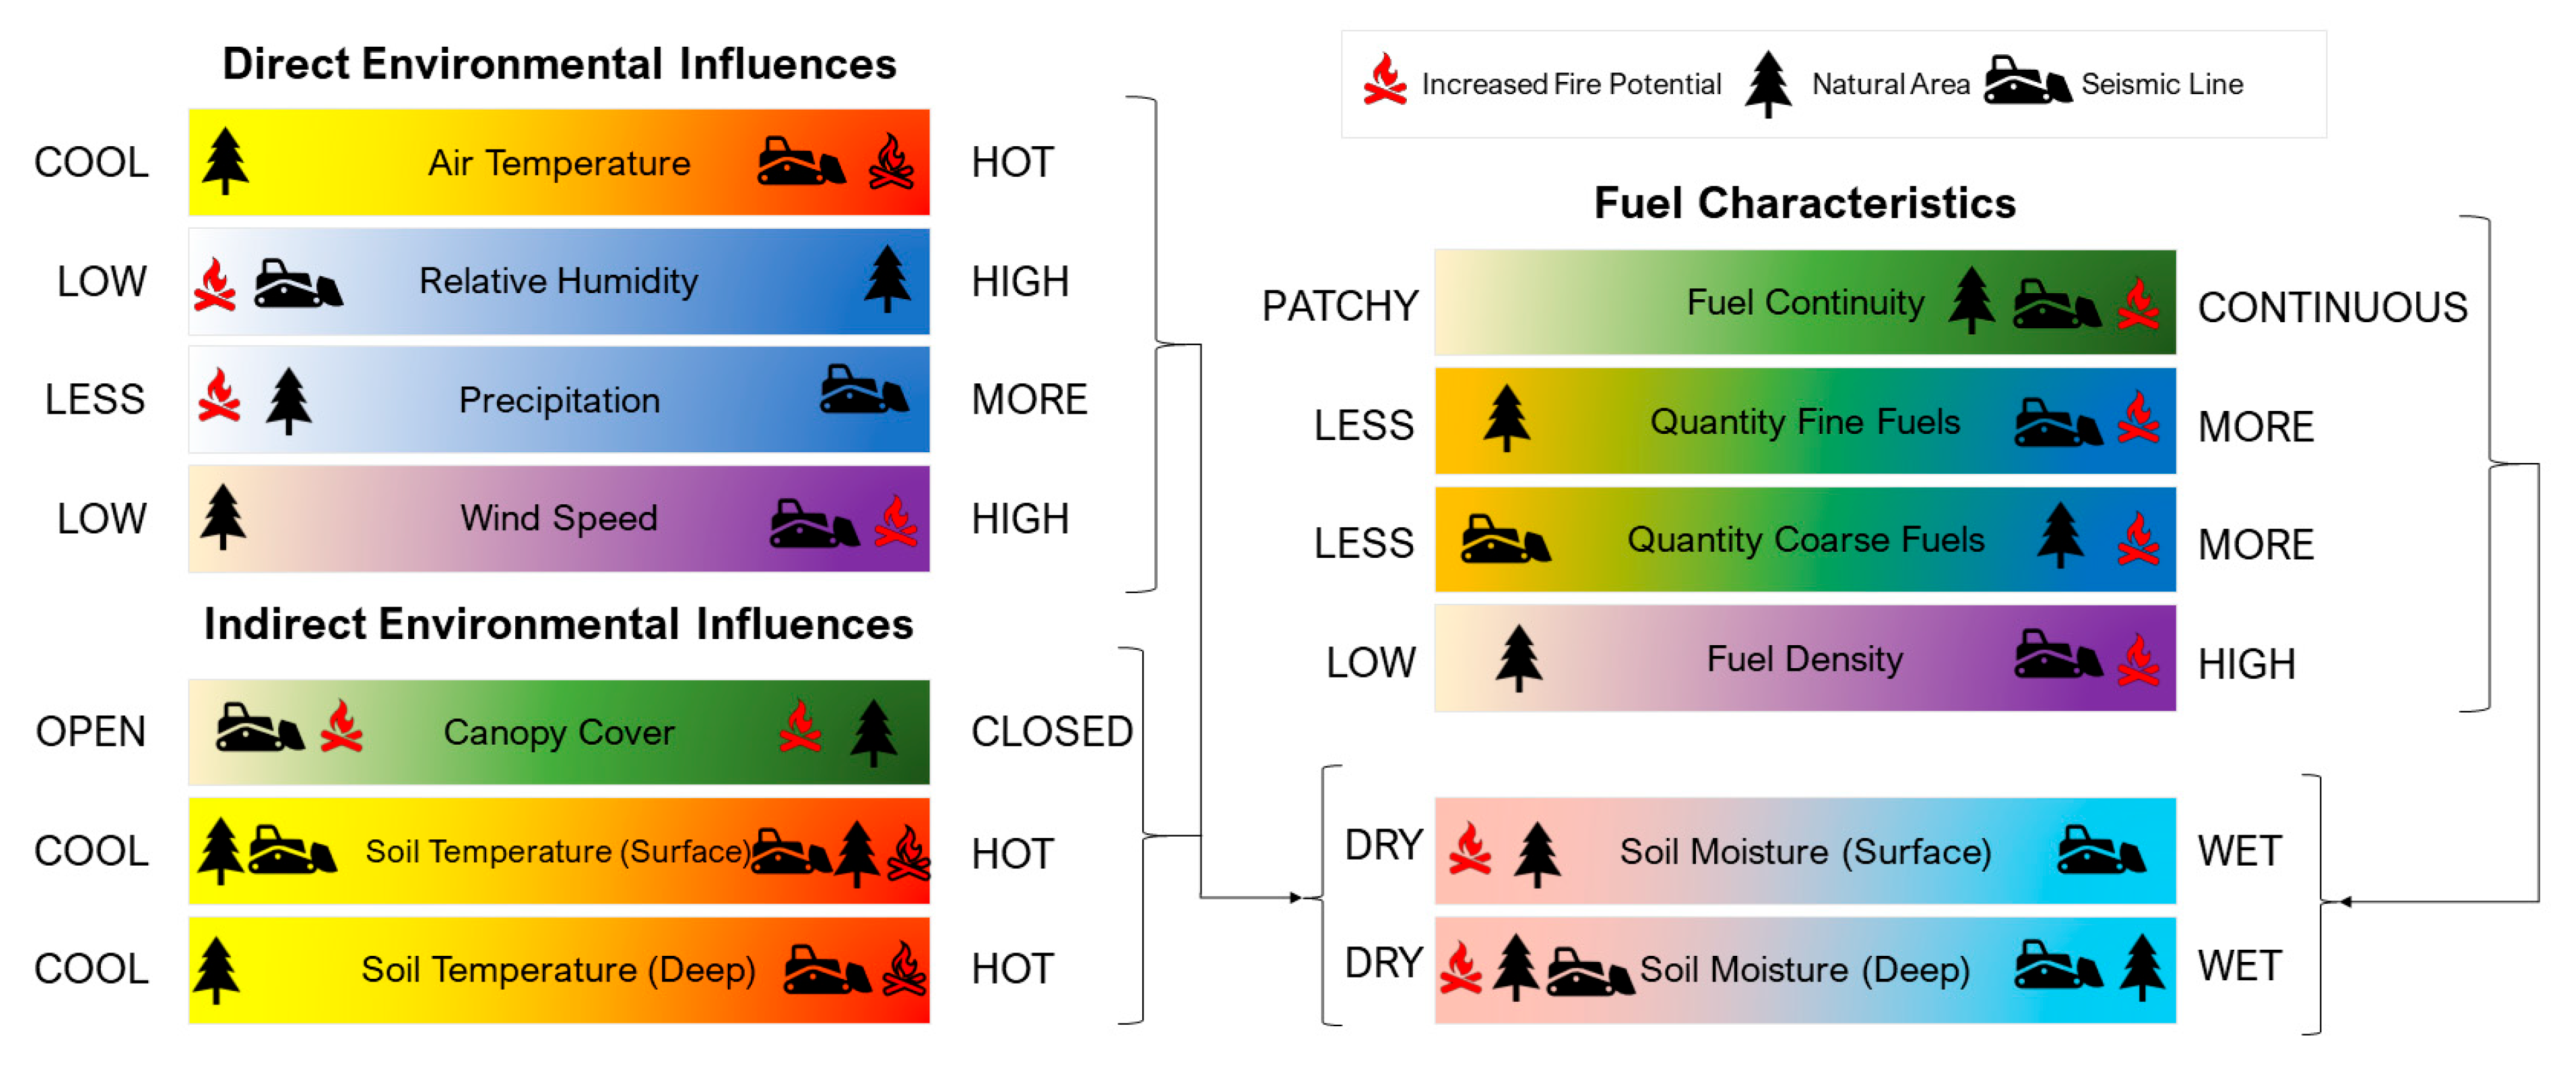
Using the calculations outlined by the Canadian Fire Weather Index (FWI) [32], the FWI was calculated for each site, both on the seismic line and in the natural area. The EW site resulted in slightly higher FWI in the natural area than on the seismic line (Figure 10a.i.,a.ii.). Occasionally, this resulted in an increased severity class in the natural area (14 July and 20 July). The intermediate indices for all sites are also shown here. The FFMC varied between an increase on the seismic line and in the natural area (Figure 10a.iii.). The DMC was consistently greater in the natural area (Figure 10a.iv.). The DC was somewhat greater in the natural area, with notable figures for 1 July–10 July, where DC was noticeably greater in the natural area due to significantly higher precipitation on the seismic line (>2.8 compared to the natural area, which was <2.8; Figure 10a.v.).
The FWI on the NS site was consistently higher on the seismic line than in the natural area (Figure 10b.i.,b.ii.). The FFMC was more consistently greater on the seismic line than at the EW site (Figure 10b.iii.). The DMC was also consistently greater on the seismic line (Figure 10b.iv.), and the DC varied, with periods of time greater both in the natural area and on the seismic line (Figure 10b.v.).

5. Discussion

Seismic lines have mixed effects on susceptibility to wildfire propagation, with increased wildfire potential for some variables and decreased potential for others (Figure 11). For example, if all other conditions remain the same, an increase in air temperature will lead to an increase in wildfire spread [36]. An increase in temperature makes the drying of moist fuels easier, which allows for faster ignition. Air temperature is higher on seismic lines (Figure 6), and this is likely due to the decreased canopy cover. An increase in incoming solar radiation will heat the air more than an area with shade from surrounding trees. However, a high temperature with much higher humidity will not propagate fires as quickly as a lower temperature with much lower humidity. As such, a decrease in relative humidity will increase wildfire potential [36], and this lack of moisture in the air is seen on seismic lines (Figure 6). Moisture can also be accounted for by observing precipitation patterns. An increase in precipitation can drive a reduction in wildfire potential due to an increase in moisture [36]. Precipitation is augmented on seismic lines (Figure 4), likely due to decreased interception from a lack of canopy cover. This indicates a lowered potential for wildfire propagation on seismic lines. Additionally, seismic lines had generally higher soil moisture than the adjacent natural area, likely driven in part by increased direct rainfall (Figure 5).
Increased wind speed will enhance the speed of wildfires propagating from one area to the next. Specifically, wind speeds between 2 and 6 m/s increase the rate of spread of a fire front by 50% [24]. Not only is this the case for crown fires but smouldering fires also have a greater potential to propagate and transition to flame under high wind speeds [13,37]. The wind speeds measured on the seismic lines were greater than those of the natural area and, in both cases, they reached the 2 m/s threshold (see above), whereas the natural area did not (Figure 3). Wind has a greater chance to pick up speed on these clear-cut lines than it does in the natural area, which has many wind breaks (trees).
The canopy cover is reduced on seismic lines, and on both study sites, canopy cover was non-existent on the seismic lines. The effect of canopy cover on wildfires is two-fold: a lack of trees decreases the amount of fuel present to burn and increases direct precipitation; however, a lack of trees also allows for increased wind speed, air temperature, and soil temperature.
Soil temperature was greater at the surface of the NS seismic line (Figure 6b), but at the EW site, the opposite was found, as surface soil temperature was greater in the natural area (Figure 6a). The soil temperature further down (25 cm bgs) was greater on the seismic line in both cases. This is likely due to soil types, where mineral soil is present higher up in the profile at the NS site, as well as local microtopography and shading on the EW site. Soil temperature influences fire potential by reducing moisture content in warmer conditions, leading to an increase in ignition potential [22].
The continuous distribution of fuels to propagate a wildfire should be considered, as a discontinuous fuel would be more likely to halt combustion and flame [38]. Coarse fuel such as trees are greatly reduced on the seismic line compared to the adjacent natural area; however, fine fuel sources (e.g., mosses and sedges) are continuous on both the seismic line and in the natural area. Since the type of continuous fuel is different for the seismic line and the natural area, different types of fires are more likely to propagate in the two areas. The seismic line contains a continuous surface of fine fuels, such as mosses and sedges, both at the EW and NS sites. However, the NS site contains very little organic material in the form of moss but does contain a high proportion of grasses and sedges (Figure 1e). This type of fuel is more likely to spread fires upwards towards the tops of trees [38]. The natural area for both sites not only contains this layer of organic material, which would promote smouldering but also has a high density of coarse fuels such as trees, which are likely to propagate crown fires.
As some fuels are continuous at both sites, fuel density should also be discussed as an important factor for wildfire propagation and severity. The amount of organic material present allows for wildfires to smoulder vertically within the soil profile. If the soil is more dense (with a higher bulk density) the fire may also more easily increase in depth [19]. The organic material present on the EW seismic line was greater than in the natural area (Figure 8a), and the bulk density of the organic soil was greater both at the surface and deeper in the profile (10–15 cm; Table 2. At the NS site, organic material was decreased on the seismic line compared to the natural area (Figure 8b), and bulk density was increased (Table 2). However, it is important to note that mineral soil was present at 10–15 cm on the NS seismic line. It is likely that greater landscape scale conditions impacted these results. For example, the EW site slopes down towards the natural area and reduces organic depth topographically (Figure 8a). As the NS site is a transitional ecosite type, the depth/mineral ratio is much less than at the EW site (Figure 8b). Much of this organic matter cover is reduced on the seismic line, decreasing depth/mineral ratio and organic depth and increasing bulk density as a function of soil type. In general, seismic lines have higher bulk densities than adjacent natural areas [2], which could both increase burn depth and increase water retention [16]. Although local topographic variations are important in predicting wildfire spread [39], they will not be discussed further here; nevertheless, they should be noted as an important confounding factor.
Finally, soil moisture controls wildfire potential, as greater moisture content will decrease the ease with which a fire can ignite by increasing the energy required to propagate heat [13,40]. Soil moisture deeper within the profile should also be considered, as this factor can help determine how deep a fire will smoulder within the profile. The EW site had greater moisture content at the surface of the seismic line but greater moisture content deeper in the profile (15 and 25 cm depth) in the natural area (Figure 4a). The NS site had greater moisture content at all depths on the seismic line and responded rapidly to incoming precipitation, frequently reaching and maintaining saturation (Figure 4b). Regarding the water table depth, at both the EW and NS sites, the water table depth was closer to the surface on the seismic line than in the natural area over the entire measurement period (Figure 7). The moisture levels on the seismic lines result in varying conclusions: the NS seismic line is consistently wetter than the natural area and would likely reduce wildfire propagation from this aspect. The EW seismic line, however, is wetter than the natural area at the surface, but the moisture content is decreased at depth. This may be counteracted by the presence of a higher water table depth on the seismic line.
In addition, surface microtopography will likely have indirect effects on wildfire propagation. Lawns have been found to be the driest microtopographic feature, while hollows are seemingly the wettest features [41]. Although a seismic line will have reduced microtopography due to flattening from heavy machinery, it is unlikely that the presence of one “lawn” on the seismic line would result in a drier site. The compression of the seismic line brings the surface closer to the water table and is more likely to result in a wetter site, reducing smouldering potential [16]. The seismic lines studied here appear to have interactions that are antithetical to what one would expect for seismic lines. The EW site has increased microtopographic variability on the seismic line compared to the natural area; however, this is most likely due to the presence of the foot path used to walk across the site (Figure 9a,b). The NS site has greater microtopographic variability in the natural area compared to the seismic line, which may be due to increased surface elevation at the eastern end of the natural plot (Figure 9c,d). In general, little can be said about these specific samples of microtopographic variation at both sites. The effect of seismic lines on microtopography can be generalised by referring to previous studies that have found reduced microtopography and wetter conditions [16].
Clearly, the interrelationships between important controlling variables influenced by seismic lines are complex. The Fire Weather Index can be applied to help elucidate some of these confounding factors since it uses relative humidity, precipitation, and air temperature to calculate a value that indicates a level of wildfire potential for a given day at a given location. As shown in Figure 10, the FWI was calculated for the EW and NS sites, both on the seismic line and in the natural area. The potential for wildfires was found to be greater in the natural area at the EW site, but the opposite was found at the NS site, where FWI was greater on the seismic line. The instances where FWI is greater in one area than another are primarily due to an increase in air temperature. It is important to note that the FWI does not take into account hydrologic or soil hydrophysical properties and, as such, is limited in its ability to predict wildfire susceptibility. However, it is a good means of understanding how varying climatologic factors might interact in a given area to promote wildfire spread. Additionally, the intermediate indices indicate important differences between the natural area and the seismic line. At the EW site, the DMC was consistently higher in the natural area, indicating dryer conditions (Figure 10a.iv.). Additionally, the DC for the EW site was consistently higher in the natural area as well, also indicating dryer conditions (Figure 10a.v.). These values likely drive the increase in FWI in the natural area, as less rainfall and higher temperatures result in higher DMC and DC values. However, the NS site had dryer conditions on the seismic line, as indicated by a greater FFMC (Figure 10b.iii.), DMC (Figure 10b.iv.), and, occasionally, a greater DC (Figure 10b.v.).
Accordingly, the Hcomb/Hign ratios can provide important information to understand how smouldering might be propagated differently on seismic lines. Since these values are an indicator of the likelihood of a soil combusting and then igniting its surroundings, the calculations include soil moisture and bulk density. The Hcomb/Hign ratio on the EW seismic line was found to be highly conducive to smouldering and greater than that in the natural area (Table 2), which differs from the FWI results. The greatest Hcomb/Hign ratio was found on the EW seismic line, while the lowest was found in the NS natural area. These differences in values between the EW and NS site are likely due to ecosite type, where the greater volume of peat on the EW line is likely to propagate smouldering and the thinner organic layer at the NS site is less likely to propagate smouldering. The results from this indicate a difference in calculating smouldering and crown fire potential. Since Hcomb/Hign ratios perform best with fine fuels, they are likely more effective at predicting smouldering on seismic lines crossing peatlands than the FWI. By comparison, the FWI is likely to be considered more useful in upland regions where fine fuels are limited (such as at the NS site). Additionally, Hcomb/Hign ratios are calculated based on a single value of volumetric water content, limiting the implications to a single time period. In drought conditions, these results would likely be exaggerated, with dry areas becoming drier and wet areas potentially retaining water for longer into the drought. Decreased rainfall and increased solar radiation via increased light intensity on seismic lines [42] will likely enhance smouldering potential. Although not explicitly addressed in this paper, the changes to the environmental and meteorological variables documented at the scale in the current study (i.e., individual seismic line) are likely to influence wildfire behaviour at landscape scale (Figure 11). Our results demonstrate significant differences in the important variables that control wildfire behaviour and risk. Considering the effects that these documented changes could have at landscape scale, it is important to understand the extent of seismic line presence in the Boreal forest. With densities reaching up to 40 km/km2 [43], increased smouldering potential, as indicated by the Hcomb/Hign ratios (Table 2), could greatly increase wildfire spread in peatlands. Additionally, the increase in FWI in the upland seismic lines could indicate that wildfire propagation may increase due to seismic line presence (Figure 10). Future research focusing on fire behaviour and burn probability modelling would help to better understand the landscape-scale implications of the changes to environmental variables presented in this study.

6. Conclusions

This study aims to quantify the meteorological and soil hydrophysical properties of two seismic lines and their respective adjacent natural areas to determine which of the seismic lines increase or decrease the potential of wildfire spread in the Boreal region of Alberta, Canada. Since there are many confounding factors at both sites, it is difficult to conclude whether or not seismic lines will promote wildfire propagation or halt it. Some meteorological factors, such as air temperature, wind speed, soil temperature, and the bulk densities of fine fuels, increase the potential of wildfire spread on seismic lines. However, other factors, such as relative humidity, precipitation, soil moisture, and water table depth, result in the seismic line being less susceptible to wildfire propagation compared to the natural area. As such, the authors of this study consulted two indices to quantify the potential of wildfire spread using measured variables. The FWI indicates that the EW seismic line would not promote wildfires as easily as the natural area, while the NS seismic line has greater potential for wildfire spread than the associated natural area. Alternatively, the Hcomb/Hign ratios indicated that the EW seismic line would promote smouldering more than the natural area, as would the NS seismic line. To gain a better understanding of these relationships, future research should aim to sample a greater number of seismic lines, quantifying wildfire variables in order to gain a stronger statistical sense of how seismic lines influence wildfire behaviour.

Author Contributions

Conceptualization, L.W., T.G.-H. and S.K.; methodology, L.W., T.G.-H. and S.K.; software, L.W.; validation, L.W.; formal analysis, L.W.; investigation, L.W. and T.G.-H.; resources, S.K.; data curation, L.W.; writing—original draft preparation, L.W.; writing—review and editing, S.K., T.G.-H. and L.W.; visualization, L.W. and T.G.-H.; supervision, S.K.; project administration, S.K.; funding acquisition, S.K. All authors have read and agreed to the published version of the manuscript.

Funding

This research was funded by Athabasca University Academic Research Fund, grant number ARF-7004; awarded to S.K., L.W. and T.G., Natural Sciences and Engineering Research Council Discovery Grant, grant number RGPIN-2019-06470 and the Canada Research Chairs Program.

Data Availability Statement

The data presented in this study are available upon request from the corresponding author.

Acknowledgments

We would like to acknowledge that data were retrieved from the Alberta Climate Information Service, found at https://acis.alberta.ca (accessed on 21 June 2023). Additionally, we would like to acknowledge Jennifer Attema, Hannah Ponsonby, and Samantha Jang for contributing to the field component of this study as well as Greg McDermid for hosting us as students at the University of Calgary.

Conflicts of Interest

The authors declare no conflict of interest.

References

  1. Dabros, A.; Pyper, M.; Castilla, G. Seismic lines in the boreal and arctic ecosystems of North America: Environmental impacts, challenges, and opportunities. Environ. Rev. 2018, 26, 214–229. [Google Scholar] [CrossRef] [Green Version]
  2. Davidson, S.J.; Goud, E.M.; Franklin, C.; Nielsen, S.E.; Strack, M. Seismic Line Disturbance Alters Soil Physical and Chemical Properties Across Boreal Forest and Peatland Soils. Front. Earth Sci. 2020, 8, 281. [Google Scholar] [CrossRef]
  3. Filicetti, A.T.; Nielsen, S.E. Fire and forest recovery on seismic lines in sandy upland jack pine (Pinus banksiana) forests. For. Ecol. Manag. 2018, 421, 32–39. [Google Scholar] [CrossRef]
  4. Stevenson, C.; Filicetti, A.; Nielsen, S. High Precision Altimeter Demonstrates Simplification and Depression of Microtopography on Seismic Lines in Treed Peatlands. Forests 2021, 10, 295. [Google Scholar] [CrossRef]
  5. Strack, M.; Hayne, S.; Lovitt, J.; McDermid, G.J.; Rahman, M.M.; Saraswati, S.; Xu, B. Petroleum exploration increases methane emissions from northern peatlands. Nat. Commun. 2019, 10, 2804. [Google Scholar] [CrossRef] [PubMed] [Green Version]
  6. Filicetti, A.T.; Nielsen, S.E. Tree regeneration on industrial linear disturbances in treed peatlands is hastened by wildfire and delayed by loss of microtopography1. Can. J. For. Res. 2020, 50, 936–945. [Google Scholar] [CrossRef]
  7. James, A.R.C.; Stuart-Smith, A.K. Distribution of Caribou and Wolves in Relation to Linear Corridors. J. Wildl. Manag. 2000, 64, 154–159. [Google Scholar] [CrossRef]
  8. Flannigan, M.D.; Logan, K.A.; Amiro, B.D.; Skinner, W.R.; Stocks, B.J. Future Area Burned in Canada. Clim. Chang. 2005, 72, 1–16. [Google Scholar] [CrossRef]
  9. Xi, D.D.Z.; Taylor, S.W.; Woolford, D.G.; Dean, C.B. Statistical Models of Key Components of Wildfire Risk. Annu. Rev. Stat. Its Appl. 2019, 6, 197–222. [Google Scholar] [CrossRef]
  10. Van Wagner, C.E. Development and Structure of the Canadian Forest Fire Weather Index System; Forestry Technical Report; Minister of Supply and Services Canada: Ottawa, ON, Canada, 1987; ISBN 978-0-662-15198-2. [Google Scholar]
  11. Wotton, B.M.; Martell, D.L. A lightning fire occurrence model for Ontario. Can. J. For. Res. 2005, 35, 1389–1401. [Google Scholar] [CrossRef]
  12. Wilkinson, S.L.; Moore, P.A.; Thompson, D.K.; Wotton, B.M.; Hvenegaard, S.; Schroeder, D.; Waddington, J.M. The effects of black spruce fuel management on surface fuel condition and peat burn severity in an experimental fire. Can. J. For. Res. 2018, 48, 1433–1440. [Google Scholar] [CrossRef]
  13. Rein, G.; Cleaver, N.; Ashton, C.; Pironi, P.; Torero, J.L. The severity of smouldering peat fires and damage to the forest soil. CATENA 2008, 74, 304–309. [Google Scholar] [CrossRef] [Green Version]
  14. Arienti, M.C.; Cumming, S.G.; Boutin, S. Empirical models of forest fire initial attack success probabilities: The effects of fuels, anthropogenic linear features, fire weather, and management. Can. J. For. Res. 2006, 36, 3155–3166. [Google Scholar] [CrossRef]
  15. Riva, F.; Pinzon, J.; Acorn, J.H.; Nielsen, S.E. Composite Effects of Cutlines and Wildfire Result in Fire Refuges for Plants and Butterflies in Boreal Treed Peatlands. Ecosystems 2020, 23, 485–497. [Google Scholar] [CrossRef]
  16. Deane, P.J.; Wilkinson, S.L.; Moore, P.A.; Waddington, J.M. Seismic Lines in Treed Boreal Peatlands as Analogs for Wildfire Fuel Modification Treatments. Fire 2020, 3, 21. [Google Scholar] [CrossRef]
  17. Johnson, E.A.; Johnson, E.A. Fire and Vegetation Dynamics: Studies from the North American Boreal Forest; Cambridge University Press: Cambridge, UK, 1996; ISBN 978-0-521-34943-7. [Google Scholar]
  18. Benscoter, B.W.; Thompson, D.K.; Waddington, J.M.; Flannigan, M.D.; Wotton, B.M.; De Groot, W.J.; Turetsky, M.R. Interactive effects of vegetation, soil moisture and bulk density on depth of burning of thick organic soils. Int. J. Wildland Fire 2011, 20, 418. [Google Scholar] [CrossRef] [Green Version]
  19. Lukenbach, M.C.; Hokanson, K.J.; Moore, P.A.; Devito, K.J.; Kettridge, N.; Thompson, D.K.; Wotton, B.M.; Petrone, R.M.; Waddington, J.M. Hydrological controls on deep burning in a northern forested peatland. Hydrol. Process. 2015, 29, 4114–4124. [Google Scholar] [CrossRef]
  20. Kiil, A.D. An Assessment of Fire Hazard on Seismic Lines in Alberta. In Canadian Forestry Service Department of Fisheries and Forestry; Forest Research Laboratory: Edmonton, AB, Canada, 1970. [Google Scholar]
  21. Miller, C.; Urban, D.L. Connectivity of forest fuels and surface fire regimes. Landsc. Ecol. 2000, 15, 145–154. [Google Scholar] [CrossRef]
  22. Thompson, D.K.; Baisley, A.S.; Waddington, J.M. Seasonal variation in albedo and radiation exchange between a burned and unburned forested peatland: Implications for peatland evaporation. Hydrol. Process. 2015, 29, 3227–3235. [Google Scholar] [CrossRef]
  23. Morvan, D. A numerical study of flame geometry and potential for crown fire initiation for a wildfire propagating through shrub fuel. Int. J. Wildland Fire 2007, 16, 511–518. [Google Scholar] [CrossRef]
  24. Beer, T. The interaction of wind and fire. Bound.-Layer Meteorol. 1991, 54, 287–308. [Google Scholar] [CrossRef]
  25. Government of Alberta. Provincial Restoration and Establishment Framework for Legacy Seismic Lines in Alberta; Government of Alberta: Vermilion, AL, Canada, 2017. [Google Scholar]
  26. Pinzon, J.; Dabros, A.; Riva, F.; Glasier, J.R.N. Short-term effects of wildfire in boreal peatlands: Does fire mitigate the linear footprint of oil and gas exploration? Ecol. Appl. 2021, 31, e02281. [Google Scholar] [CrossRef] [PubMed]
  27. Martin, J. Wisconsin Woodlands: Estimating Stocking Conditions in Your Timber Stand; Extension Natural Resources Institute: Madison, WI, USA, 1996. [Google Scholar]
  28. HOBO. Onset Computer Corporation HOBO U30 USB Station (U30-NRC) Manual; HOBO Data Logger: Melbourne, Australia, 2020. [Google Scholar]
  29. Delta-T Devices Ltd. User Manual for the WET Sensor; Delta-T Devices Ltd.: Cambridge, UK, 2018. [Google Scholar]
  30. Smart Level Smart Level LLC|Precision Construction Altimeter|1-800-472-3741. Available online: https://www.smartlevel.us/ (accessed on 1 June 2023).
  31. Deane, P.J.; Wilkinson, S.L.; Verkaik, G.J.; Moore, P.A.; Schroeder, D.; Waddington, J.M. Peat surface compression reduces smouldering fire potential as a novel fuel treatment for boreal peatlands. Can. J. For. Res. 2022, 52, 396–405. [Google Scholar] [CrossRef]
  32. Van Wagner, C.E.; Pickett, T.L. Equations and FORTRAN Program for the Canadian Forest Fire Weather Index System; Canadian Forestry Service Government of Canada: Ottawa, ON, Canada, 1985. [Google Scholar]
  33. Agriculture and Irrigation Alberta, Climate Information Service (ACIS). Available online: https://acis.alberta.ca (accessed on 22 June 2023).
  34. Golden Software. Surfer; Golden Software LLC: Golden, CO, USA, 2022. [Google Scholar]
  35. R Core Team. R: A Language and Environment for Statistical Computing; R Foundation for Statistical Computing: Vienna, Austria, 2021; Available online: https://www.R-project.org/ (accessed on 14 October 2022).
  36. Chandler, C.; Cheney, P.; Thomas, P.; Trabaud, L.; Williams, D. Volume 1. Forest Fire Behavior and Effects. Volume 2. Forest Fire Management and Organization. Fire in Forestry Volume 1 Forest Fire Behavior and Effects Volume 2 Forest Fire Management and Organization. 1983. Available online: https://www.cabdirect.org/cabdirect/abstract/19850699124 (accessed on 15 June 2023).
  37. Christensen, E.G.; Hu, Y.; Purnomo, D.M.J.; Rein, G. Influence of wind and slope on multidimensional smouldering peat fires. Proc. Combust. Inst. 2021, 38, 5033–5041. [Google Scholar] [CrossRef]
  38. Drury, S. Fuel Continuity. In Encyclopedia of Wildfires and Wildland-Urban Interface (WUI) Fires; Manzello, S.L., Ed.; Springer International Publishing: Cham, Switzerland, 2020; pp. 1–3. ISBN 978-3-319-51727-8. [Google Scholar]
  39. Lukenbach, M.C.; Hokanson, K.J.; Devito, K.J.; Kettridge, N.; Petrone, R.M.; Mendoza, C.A.; Granath, G.; Waddington, J.M. Post-fire ecohydrological conditions at peatland margins in different hydrogeological settings of the Boreal Plain. J. Hydrol. 2017, 548, 741–753. [Google Scholar] [CrossRef]
  40. Frandsen, W.H. Ignition probability of organic soils. Can. J. For. Res. 1997, 27, 1471–1477. [Google Scholar] [CrossRef]
  41. Prat-Guitart, N.; Belcher, C.M.; Thompson, D.K.; Burns, P.; Yearsley, J.M. Fine-scale distribution of moisture in the surface of a degraded blanket bog and its effects on the potential spread of smouldering fire. Ecohydrology 2017, 10, e1898. [Google Scholar] [CrossRef]
  42. Franklin, C.M.A.; Filicetti, A.T.; Nielsen, S.E. Seismic line width and orientation influence microclimatic forest edge gradients and tree regeneration. For. Ecol. Manag. 2021, 492, 119216. [Google Scholar] [CrossRef]
  43. Echiverri, L.F.I.; Macdonald, S.E.; Nielsen, S.E. Disturbing to restore? Effects of mounding on understory communities on seismic lines in treed peatlands. Can. J. For. Res. 2020, 50, 1340–1351. [Google Scholar] [CrossRef]
Figure 1. (a) The study area located 40 km south of Fort McMurray, Alberta, Canada. (b) A detailed study site map with two sites: EW (Maqua Line) and NS (Tamarack Line). The green triangles indicate the position of the natural site for the meteorological tower, and the red triangles indicate the position of the meteorological tower on the seismic line. (c) A photo of the EW study site from the ground and (d) from above. (e) A photo of the NS study site from the ground.
Forests 14 01574 g001
Figure 2. The meteorologic station set up on the EW seismic line. The tower includes an anemometer, relative humidity and temperature sensor, soil moisture and soil temperature sensors, and a tipping bucket rain gauge.
Forests 14 01574 g002
Figure 3. Windrose diagrams showing the variation in wind speed and direction for (a) the natural area at the EW site, (b) the seismic line at the EW site, (c) the natural area at the NS site, and (d) the seismic line at the NS site. Values are shown in the same intervals until the lower maximum (EW 0.67 m/s; NS 1.34 m/s), which occurs in the natural area.
Forests 14 01574 g003
Figure 4. (a) Soil moisture on the seismic line (solid) and in the natural area (dashed) on the EW seismic line. The bottom panel shows the difference in soil moisture over time between the natural and the seismic line, where a positive value indicates greater moisture in the natural area. (b) Soil moisture on the seismic line (solid) and in the natural area (dashed) on the NS seismic line. Precipitation data are shown in bars for both on the line (dark grey) and in the natural area (light grey). The bottom panel shows the difference in soil moisture over time between the natural area and the seismic line, where a positive value indicates greater moisture in the natural area.
Forests 14 01574 g004
Figure 5. (a) A boxplot of soil moisture at the EW site taken with a manual soil moisture probe at two depths (0–5 cm and 10–15 cm) on the seismic line and in the natural area. (b) Soil moisture taken with a manual soil moisture probe at the NS site at two depths (0–5 cm and 10–15 cm) on the seismic line and in the natural area.
Forests 14 01574 g005
Figure 6. (a) (Top): soil temperature at two depths and air temperature on the line (solid) and in the natural area (dashed) at noon at the EW site. (Bottom): the difference in soil temperature and air temperature in degrees Celsius and relative humidity (as a percentage) between the natural area and the seismic line at the EW site (negative values indicate higher temperatures on the seismic line). (b) (Top): a figure of soil temperature at two depths and air temperature on the line (solid) and in the natural area (dashed) at noon at the NS site. (Bottom): the difference in soil temperature and air temperature in degrees Celsius and relative humidity (as a percentage) between the natural area and the seismic line (negative values indicate higher temperatures on the seismic line).
Forests 14 01574 g006
Figure 7. (a) (Top): water table depth below surface (dashed line) over time on the seismic line (yellow), at the edge (green), and in the natural area (grey) at the EW site. (Bottom): water table depth below surface (black line) across the transect for a wet period (dark blue solid) and dry period (light blue dashed) at the EW site. (b) (Top): water table depth below surface (dashed line) over time on the seismic line (yellow), at the edge (green), and in the natural area (grey) at the NS site. (Bottom): water table depth below surface (black line) across the transect for a wet period (dark blue solid) and dry period (light blue dashed) at the NS site.
Forests 14 01574 g007
Figure 8. (a) A cross sectional diagram of the EW site from south (left) to north (right) as it crosses the seismic line (grey), including water table depth below surface (blue line with hydrat) as measured at three locations indicated by an X (centre, edge, natural), depth/mineral ratio (black line), and the soil moisture on the seismic line for 29 July 2022. (b) A cross-sectional diagram of the NS site from west (left) to east (right) as it crosses the seismic line (grey), for 9 August 2022 (same symbology as in (a)).
Forests 14 01574 g008
Figure 9. (a) The surface of a belt plot measured on the EW site seismic line. (b) The surface of a belt plot measured in the adjacent natural area to the EW seismic line. (c) The surface of a belt plot measured on the NS site seismic line. (d) The surface of a belt plot of the adjacent area to the NS seismic line.
Forests 14 01574 g009
Figure 10. (a.i.) The Fire Weather Index (FWI) for the EW seismic line (solid) and natural area (dashed) over the measurement period. This is overlain by the classes for fire danger severity according to the Canadian Forest Fire Danger Rating System (CFFDRS), where green indicates low severity, blue—moderate, and yellow—high [10]. (a.ii.) The difference (Δ) between FWI for the EW seismic line and the natural area. (a.iii.) The difference in FFMC for the EW seismic line and the natural area. (a.iv.) The difference in DMC for the EW seismic line and the natural area. (a.v.) The difference in DC for the EW seismic line and the natural area. (b.i.) The Fire Weather Index (FWI) for the NS seismic line (solid) and natural area (dashed) over the measurement period. This is overlain by the classes for fire danger severity according to the Canadian Forest Fire Danger Rating System (CFFDRS), where green indicates low severity and blue indicates moderate severity [10]. (b.ii.) The difference between FWI for the NS seismic line and the natural area. (b.iii.) The difference in FFMC for the NS seismic line and the natural area. (b.iv.) The difference in DMC for the NS seismic line and the natural area. (b.v.) The difference in DC for the NS seismic line and the natural area. In all difference plots, a positive value indicates a higher value for the natural area than the seismic line.
Forests 14 01574 g010
Figure 11. A conceptual diagram of the effects of seismic lines on wildfire potential. Effects include both direct and indirect environmental influences, as well as fuel characteristics. Increased wildfire potential is depicted by the red fire symbol, the seismic line is depicted by a bulldozer, and the natural area is depicted by a tree.
Forests 14 01574 g011
Table 1. Surface microtopography variance values.
Site NameLocationAverage Relative Surface Elevation (cm)Range Surface Elevation Change (cm)Surface Area (m2)Variance
EWSeismic line−20.6−43–1.250.910.006
EWNatural area−34.5−57.6–(−2.8)49.440.002
NSSeismic line19.5−19.5–55.249.350.020
NSNatural area−34.6−107.2–183.949.550.210
Table 2. Fine fuel properties for each site.
Site NameLocationBulk Density (0–5) (g/cm3)Bulk Density (10–15) (g/cm3)Hcomb/Hign
EWSeismic Line0.150.134.445
EWNatural Area0.050.092.226
NSSeismic Line0.161.240.849
NSNatural Area0.040.050.686
Disclaimer/Publisher’s Note: The statements, opinions and data contained in all publications are solely those of the individual author(s) and contributor(s) and not of MDPI and/or the editor(s). MDPI and/or the editor(s) disclaim responsibility for any injury to people or property resulting from any ideas, methods, instructions or products referred to in the content.

