Article

Evaluation of the 20-Year Restoration Process in an Air-Pollution-Damaged Forest near the Ulsan Industrial Complex, Korea

1
Department of Bio & Environmental Technology, Seoul Women’s University, Seoul 01797, Republic of Korea
2
National Institute of Ecology, Seocheon 33657, Republic of Korea
3
National Institute of Environmental Research, Incheon 22689, Republic of Korea
*
Author to whom correspondence should be addressed.
Forests 2023, 14(8), 1565; https://doi.org/10.3390/f14081565
Submission received: 30 June 2023 / Revised: 15 July 2023 / Accepted: 27 July 2023 / Published: 31 July 2023
(This article belongs to the Special Issue Ecological Restoration and Soil Amelioration in Forest Ecosystem)

Abstract

:
A study was conducted to evaluate the effects of restoration practices in a forest ecosystem near the Ulsan Industrial Complex in southeastern Korea. The calcium and magnesium contents in the soil, as well as the soil pH, increased after the application of a soil ameliorator but decreased again after 20 years. Meanwhile, the aluminum content presented the opposite trend. After restoration, the species composition and diversity of vegetation tended to differ from that of the non-restored site over time while continuously becoming more similar to that of the reference site. The ratio of exotic plant species was lower than that at the non-restored site but higher than that at the reference site. The frequency distribution for the diameter class of oaks established through restoration presented a reverse J-shaped pattern, and thus, they can be maintained continuously; similar results were obtained for the reference site. In sum, the forest ecosystem near the industrial park—which had been severely degraded due to air pollution and soil acidification—was restored to a forest close to natural conditions through restorative treatments, including the neutralization of acidic soil and the introduction of tolerant species.

1. Introduction

Significant material and energy resources are used in human activities, especially in industry. As a result, such activities tend to generate a significant amount of pollutants, often exceeding the limit of the buffering capacity of the location where the activity takes place and causing damage to the vegetation and soil of the area [1,2,3]. If the imbalance between the pollution source and the buffering capacity worsens, the vegetation will decline, and if it worsens further, desertification may finally occur. Such a phenomenon has been observed in the forests near the Ulsan Industrial Complex, where this study was conducted [2]. If such conditions are left unaddressed, their impacts may lead to significant damage to other biological communities (e.g., animal and micro-organism communities) and may spread to a wider area [4,5,6]. In addition, the function of carbon-absorption sources (which absorb and remove the carbon dioxide (CO2) emitted by industrial activities) may deteriorate, resulting in exaggerated differences between the emission and absorption of carbon [7]. Therefore, it is necessary to restore damaged ecosystems in order to prevent the spread of such damages [1,5,8].
Ecological restoration is an ecological technology that aims to restore the disrupted ecological balance by healing the damage caused to nature and restoring its natural buffering function. One process through which a disturbed ecosystem recovers by itself is succession. Ecological restoration is a process that promotes succession through human aid, imitating an intact natural system and thus providing habitats for various organisms. In such a way, ecological restoration seeks to secure the future environment for humankind [9,10,11].
Ecological restoration is carried out through a series of procedures, including diagnostic evaluation, the collection of reference information, the preparation of a restoration plan (based on both types of information), restoration practice, the monitoring of the restoration process, the analysis of monitoring results, adaptive management based on the results, and the evaluation of the restoration effect [10,11,12]. The implementation of restoration is the starting point, while the process of ultimately checking the performance of the restoration execution—including the processes that proceed thereafter—allows for evaluation of the restoration effect(s) [10,11,13]. Restoration is a type of work that seeks to shorten the period of succession—the process of restoring the natural state damaged by disturbances from nature itself—which usually takes a long time. Numerous restoration projects have been promoted; however, the evaluation of the restoration effect is often neglected [14,15,16]. If a project is not evaluated, information on its performance cannot be obtained. Projects cannot evolve without help from past knowledge regarding what has and has not worked and how these achievements differ depending on the project. Small investments into systematic monitoring, information delivery, and evidence-based evaluations will greatly help in the planning of future projects, thereby significantly improving them. For example, policy-making tools have developed with accurate information, cost, and spatial dependencies regarding the likelihood that successful restoration can help to determine which restoration activities to prioritize [17]. Such investments into evaluation also contribute to increasing the relevance of restoration and ecological research, as well as improving the applicability of the results [18,19]. In this respect, evaluating the effects of restoration is an essential task for the development of ecological restoration.
Evaluating the effect of restoration is not simple, and there have been extensive debates on the characteristics of a successful restoration and how to measure them [20]. Ecological restoration is carried out with the aim of restoring the damaged structure and function of nature, thus further securing a system that can be self-maintained. As such, the restoration effect can be evaluated by comparing the structure and function of the restored system with reference information obtained from an ecosystem or landscape with an intact natural system [13].
The Society for Ecological Restoration (SER) Primer is a valuable contribution to the discipline, providing a practical overview of ecological restoration and outlining nine key attributes for judging restoration success [12]. These attributes encompass three general ecological outcomes, vegetation structure, species diversity, and abundance, which are commonly used as indicators of ecosystem conditions [21,22,23]. The “recovery wheel” proposed by McDonald [10] is a system for evaluating the progress of a restored ecosystem along its recovery trajectory. It covers three general ecological outcomes: vegetation structure, species diversity and abundance, and ecological processes [24]. These indicators are frequently utilized in the literature to assess ecosystem conditions [21,22,23].
This paper focuses on evaluating the effects of an ecological restoration practice conducted to enhance the overall system functions of a forest near the Ulsan Industrial Complex in southeastern Korea. The aim was to restore the forest, which was degraded significantly due to severe air pollution and soil acidification, to a self-sustaining ecosystem. The restorative treatment involved soil amelioration and the introduction of tolerant plant species. The implementation of the restoration took place in 1998, and its effects were evaluated in the year of restoration, the 4th and 20th years after the restoration.

2. Materials and Methods

2.1. The Study Area

Ulsan is located on the southeastern coast of the Korean Peninsula and faces the East Sea (126°46′15″ to 127°11′15″ E longitude, 37°25′50″ to 37°41′45″ N latitude; Figure 1). The topography of Ulsan is a concave plain surrounded by high mountains to the west and east. The elevation of the study area, Mt. Dotjil, ranges from 20 to 89 m above sea level. The parent rock of Ulsan is usually composed of sedimentary rock, and the flat land beside rivers and streams consists of alluvium. The soil in these areas was classified into the Eutrudepts great group of the Udepts suborder in the Inceptisols order, which developed on sedimentary bedrock. Based on the soil texture, the soil was silty loam. Due to the poor development of vegetation, the thickness of the litter layer was thin, within 1 cm.
The climate of Ulsan is continental, with warm and moist summers and cold and dry winters. From 1991 to 2020, the mean annual temperature was 13.95 °C, and the mean annual precipitation was 127.0 cm [25].
The Ulsan Industrial Complex serves as a representative example of industrial complexes in Korea. The construction of the complex began in the late 1960s and continues to expand. The industrial activities in this complex primarily consist of heavy and chemical industries, including the petrochemical industry, which emits approximately 60,000 tons of sulfur dioxide (SO2) per year. These emissions have led to a mean concentration of 0.03 ppm of SO2 in the local atmosphere, with a maximum daily average of 0.10 ppm [26]. Such severe air pollution and the resulting soil acidification have severely degraded the surrounding vegetation, forming a wide range of grasslands covered with Miscanthus sinensis mats and, in severe cases, bare ground (i.e., not covered with vegetation) (Figure 1). The mean soil pH was 4.1, lower than the pH of 4.8 in non-polluted areas 20 km to the south [27,28]. As a result, the physico-chemical properties of the soil differed greatly from those of the reference area. In particular, the pH and the Ca2+ and Mg2+ contents in the soil (which are essential ions) were lower than those in the reference area, while the Al3+ content was higher [27,28].
Mt. Dotjil, selected as a restoration target site for this study, is the area that has suffered the most ecological damage in the Ulsan Industrial Complex. This mountain is an isolated island surrounded by industrial facilities and urban areas. As a result, it has suffered from severe environmental pollution since the operation of industrial facilities began in the late 1960s. Vegetation patches are interspersed with bare soil, consisting of grassland and several tree plantations (Figure 2). Our restoration focused on improving the acidified soil in this area and introducing plants that are tolerant to polluted environments in order to achieve an integrated forest ecosystem. Land with vegetation coverage below 20% was categorized as bare ground (hereafter BG) and divided into two groups: one dominated by the grass M. sinensis, and the other by the forb Pueraria thunbergiana. Grassland was also divided into two types: one dominated by grass, M. sinensis (hereafter GG), and the other by forb, P. thunbergiana (grassland forb, hereafter GF). M. sinensis maintains dense coverage, inhibiting other plants from entering and establishing in the area. On the other hand, in the plots with a vegetation coverage of less than 20%, the plots with a vegetation coverage increased to more than 20%, which was expressed as a former bare ground (hereafter FB). Natural reference sites were selected in an unpolluted area located more than 20 km south of the Ulsan Industrial Complex (Figure 1). The concentration of SO2 in the air in this area was less than half of that in the polluted area [2]. The reference area exhibited better environmental conditions compared to the polluted areas, including the physicochemical properties of the soil mentioned earlier. The vegetation of the reference site is dominated by oaks, including Quercus serrata, but a number of Pinus thunbergii have also been established because it is located on the coastal area. The trees that dominate the forest are about 15 m high and more than 20 cm in diameter and thus form a mature forest. In addition, afforestation species such as Alnus firma, Robinia pseudoacia, and Pinus rigida have also invaded under the influence of afforestation created around them.

2.2. Restoration Practice

The planting bed soil was improved by applying a 1:1 v/v mixture of dolomite and sludge at a rate of 1000 kg ha−1, following the method described by Kim et al. [27]. For experimental restoration, we installed five 5 m × 20 m plots. The restoration was carried out by planting three-year-old seedlings (nine each for Quercus serrata, Alnus firma, and Ligustrum japonicum for a subplot with a size of 5 m × 5 m) on both grassland and bare ground in 1998. Seedlings were planted at 0.5–1.0 m intervals. To restore this area, which was close to bare ground, plant species comprising tree, understory tree, and shrub layers were introduced as plants with high tolerance levels [28]. Q. serrata, A. firma, and L. japonicum were introduced as the plant species that would form the tree, sub-tree, and shrub layers, respectively, after restoration. Furthermore, the inclusion of A. firma was based on its ability to fix atmospheric nitrogen through a symbiotic relationship with actinomycetic fungi [2].

2.3. Soil Analysis

Soil samples were collected from each plot, with five points sampled per plot. These individual samples were then combined to create a composite sample. The soil pH, as well as the contents of Ca2+, Mg2+, and Al3+, were measured since they serve as sensitive indicators of soil acidification. The pH measurement was conducted using a pH meter. To do this, a soil sample was mixed with distilled water at a ratio of 1:5 (weight per volume). The mixture was then filtered through filter paper. The levels of exchangeable Ca2+, Mg2+, and Al3+ were measured using an inductively coupled plasma (ICP) atomic absorption spectrophotometer (Shimadzu ICPQ-1000, Tokyo, Japan). Extraction of the ions was performed using 1N ammonium acetate solution, with a pH of 7.0 for Ca2+ and Mg2+ and a pH of 4.0 for Al3+. The extraction method used was described by Allen et al. [29].

2.4. Vegetation Analysis

To compare the restored plots at Mt. Dotjil with relatively undisturbed areas, five reference plots measuring 20 m × 20 m were established in a forest located approximately 20 km south of Mt. Dotjil (Figure 1). No soil amelioration or planting activities were conducted in the reference plots.
Vegetation data were collected three times at the restored stands in Mt. Dotjil, in 1998, 2002, and 2018. For the reference plots, data collection occurred only in 2002. Sixteen plots for bare ground; ten plots for GF, GG, and FB; and five plots for the restored and the reference plots were surveyed.
All plant species were identified following Lee [30] and the Korea Plant Name Index [31]. The cover of each species was assessed using the cover class system of Braun-Blanquet [32]. The ordinal scales were then converted to the median value within each cover class to quantify the percent coverage range. The importance value of each species was determined based on its relative coverage. The relative coverage was calculated by dividing the cover fraction of each species by the summed cover of all species in each plot and multiplying the result by 100. An importance value matrix for all species in all plots was constructed and used as data for detrended correspondence analysis (DCA) ordination [31]. To compare species diversity and dominance, a rank abundance curve [32,33,34] was created, and the Shannon–Wiener Diversity Index (H′) was calculated for each stand type.
For woody species in each quadrant, the diameter at breast height (DBH) was measured. Woody plants with a height of less than 2 m were measured for their diameter at ground surface (D10). A diameter class distribution diagram was created based on the frequency distribution within each class, which was divided at 5 cm intervals.

2.5. Evaluation of Restoration Effect Based on Chemical Properties of Soil

The effects of restoration on the chemical properties of the soil were evaluated in terms of how effectively the soil ameliorator treatment helped to recover healthier soil properties. Soil characteristics measured in the year of restoration and the 20th year after restoration were compared with the soil characteristics at the reference site.
A one-way analysis of variance (ANOVA) was performed to compare the differences in soil characteristics (i.e., pH, Ca2+, Mg2+, and Al3+) among the sites. A post hoc analysis was conducted using Scheffe’s test. The data analysis was carried out using SPSS (version 24, SPSS Inc., Chicago, IL, USA) and R software version 4.2.3 (R Project for Statistical Computing).

2.6. Evaluation of Restoration Effect Based on Vegetation Structure

The effects of restoration on vegetation were evaluated based on the changes in species composition and diversity, the ratio of the number of exotic species to total species, and vegetation dynamics. Changes in species composition were analyzed by applying DCA ordination. The species rank—dominance curve and the Shannon–Wiener Diversity Index (H′), were employed to assess changes in species diversity and species dominance [34,35,36]. The effects of restoration on vegetation dynamics were evaluated using the diameter class distribution diagram.

3. Results

3.1. Soil Properties

After treatment with the soil ameliorator, the soil pH, Ca2+, and Mg2+ contents increased but then decreased 20 years after the treatment. The Al3+ content showed the opposite trend—decreasing after treatment but increasing again 20 years after the treatment (Figure 2).

3.2. Species Composition

The DCA ordination analysis of vegetation data surveyed in the year of restoration revealed that the restored sites were positioned between the non-restored sites and the reference sites, indicating a positive restoration effect in terms of species composition. However, the restored sites exhibited distinct species compositions compared to the reference sites (Figure 3).
Similarly, the ordination results based on data collected in the fourth year after restoration displayed a similar trend to the year of restoration. However, it was observed that the restored sites approached the location of the reference sites more closely, and the species composition of the restored sites became more similar to that of the reference sites (Figure 3).
In the DCA ordination analysis using vegetation data surveyed in the 20th year after restoration, the restored sites tended to cluster in nearly the same location as the reference sites (Figure 3).

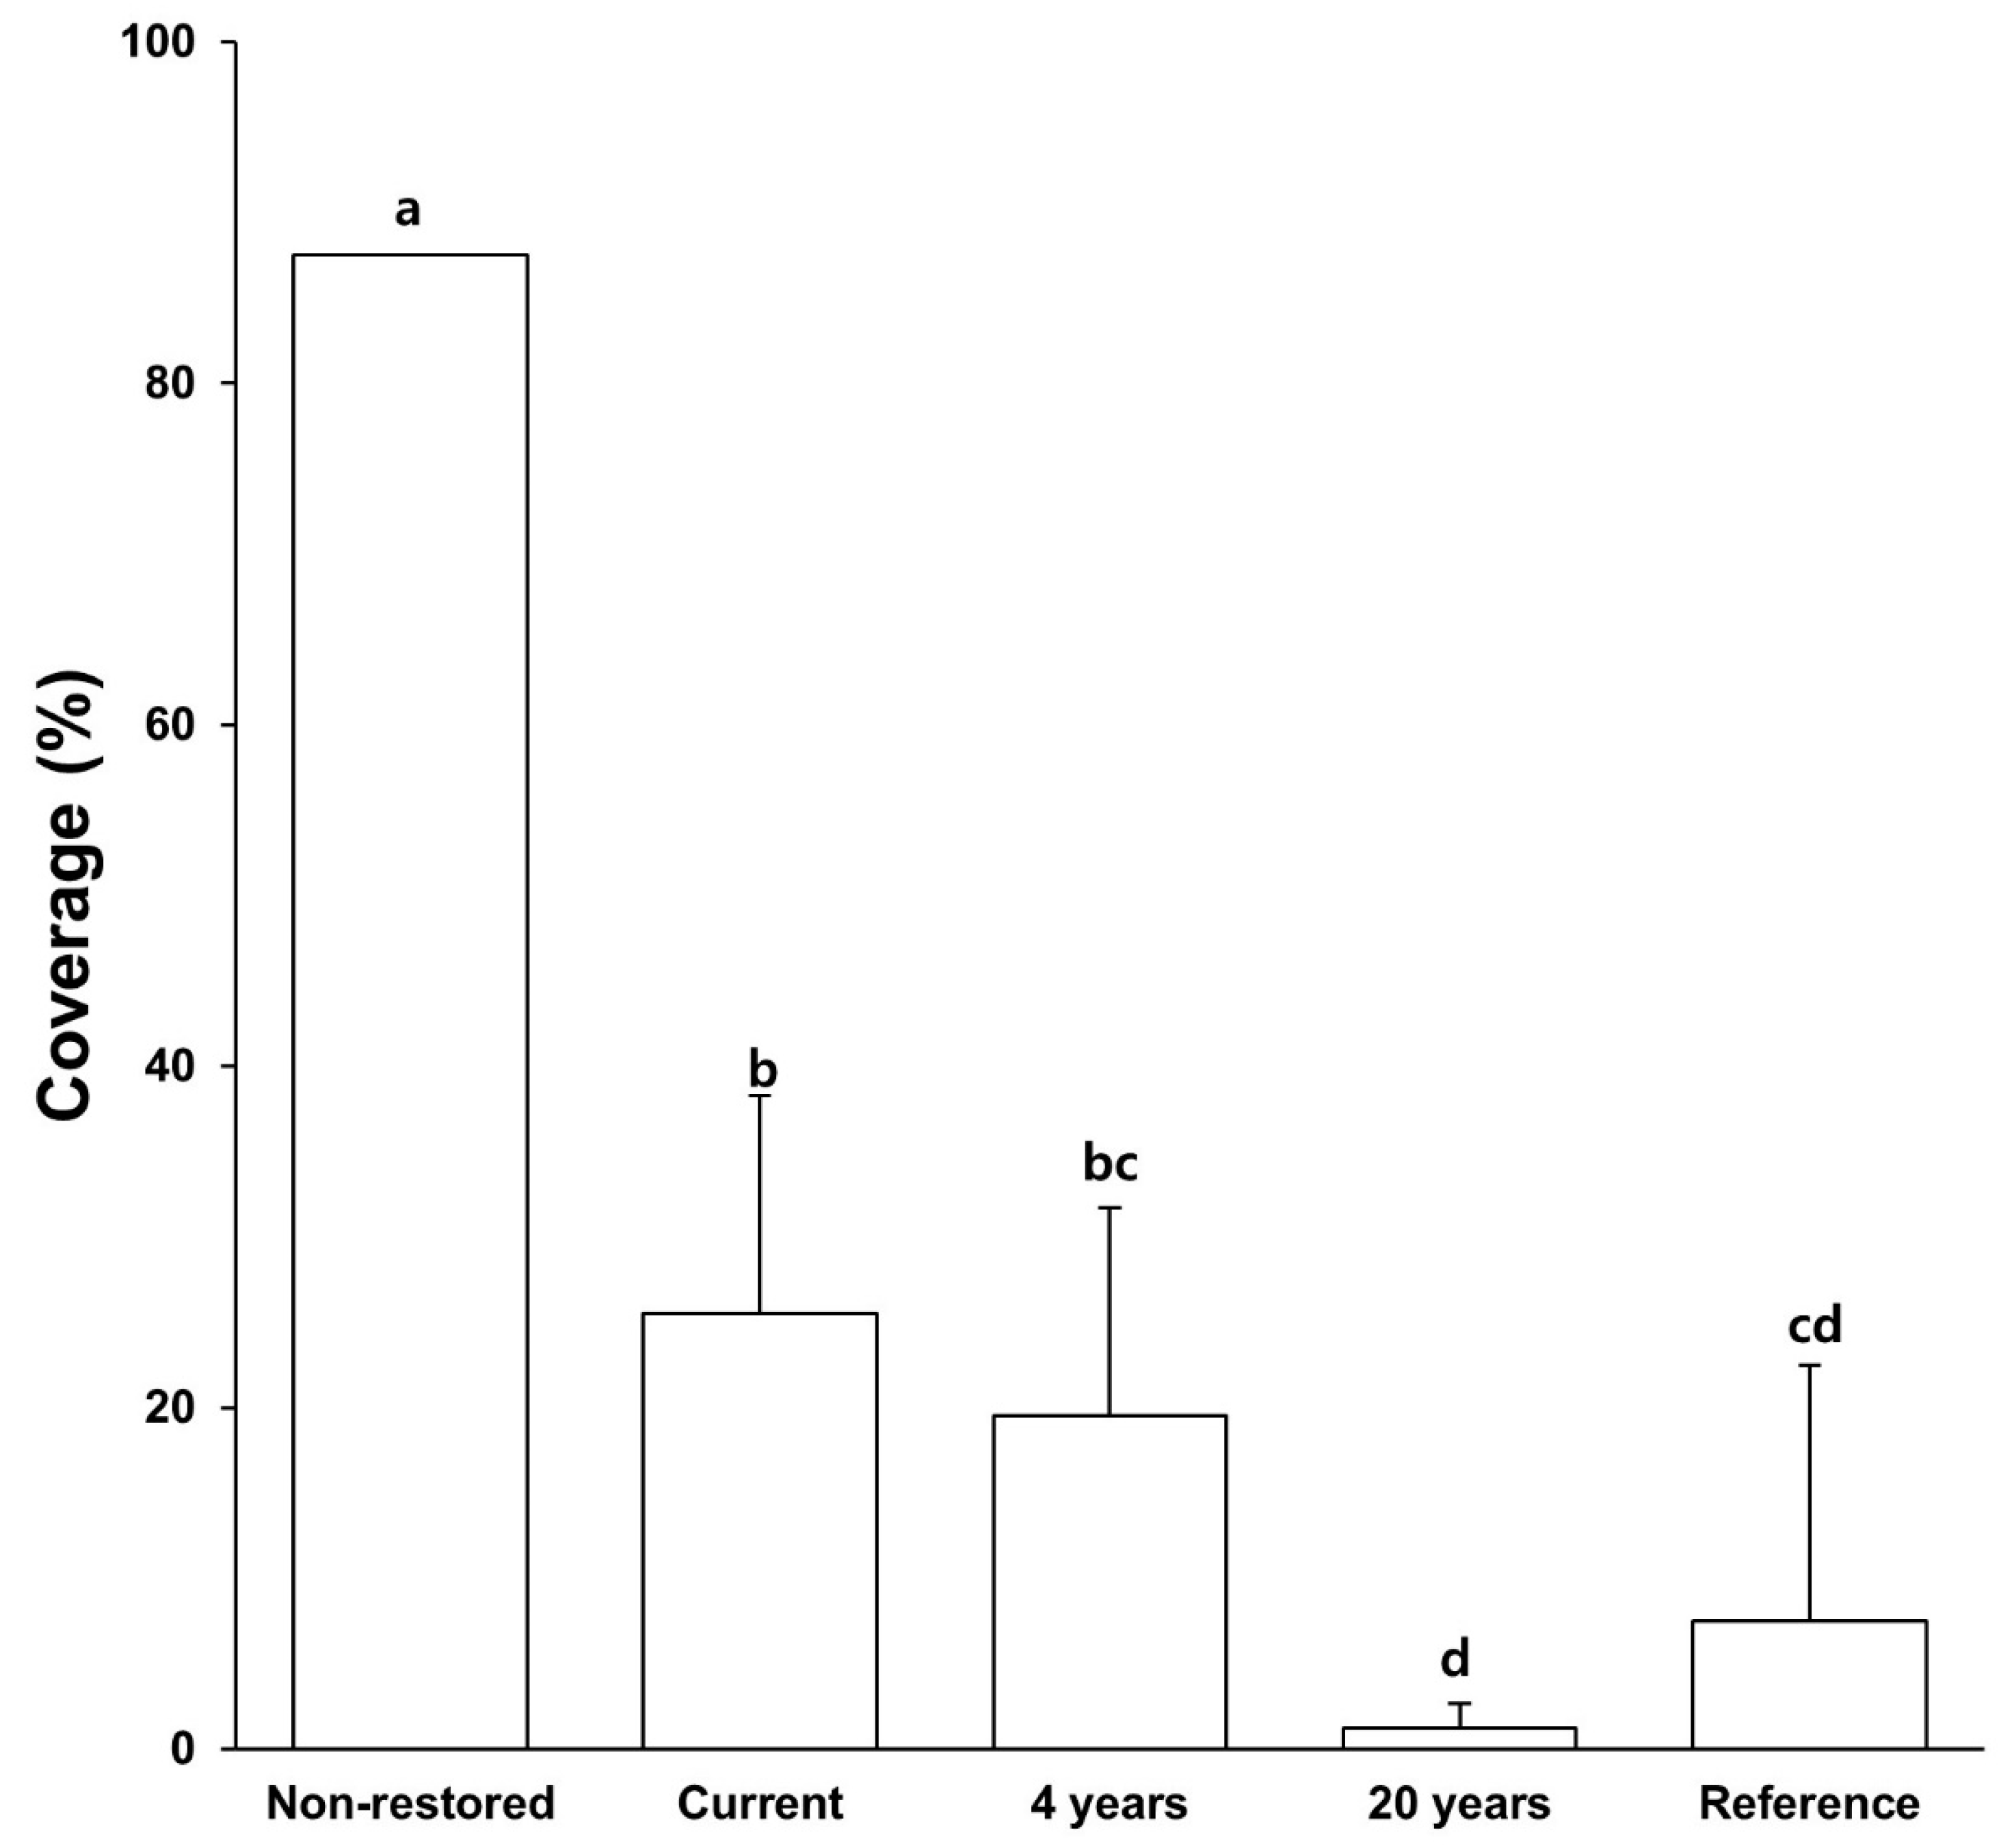
3.3. Coverage of Miscanthus sinensis

The coverage of M. sinensis—which flourishes in destroyed ecosystems (such as the one at the study site) and inhibits the establishment of the other plants—continuously decreased over time after restoration, matching the level at the reference site 20 years after restoration (Figure 4).

3.4. Species Diversity
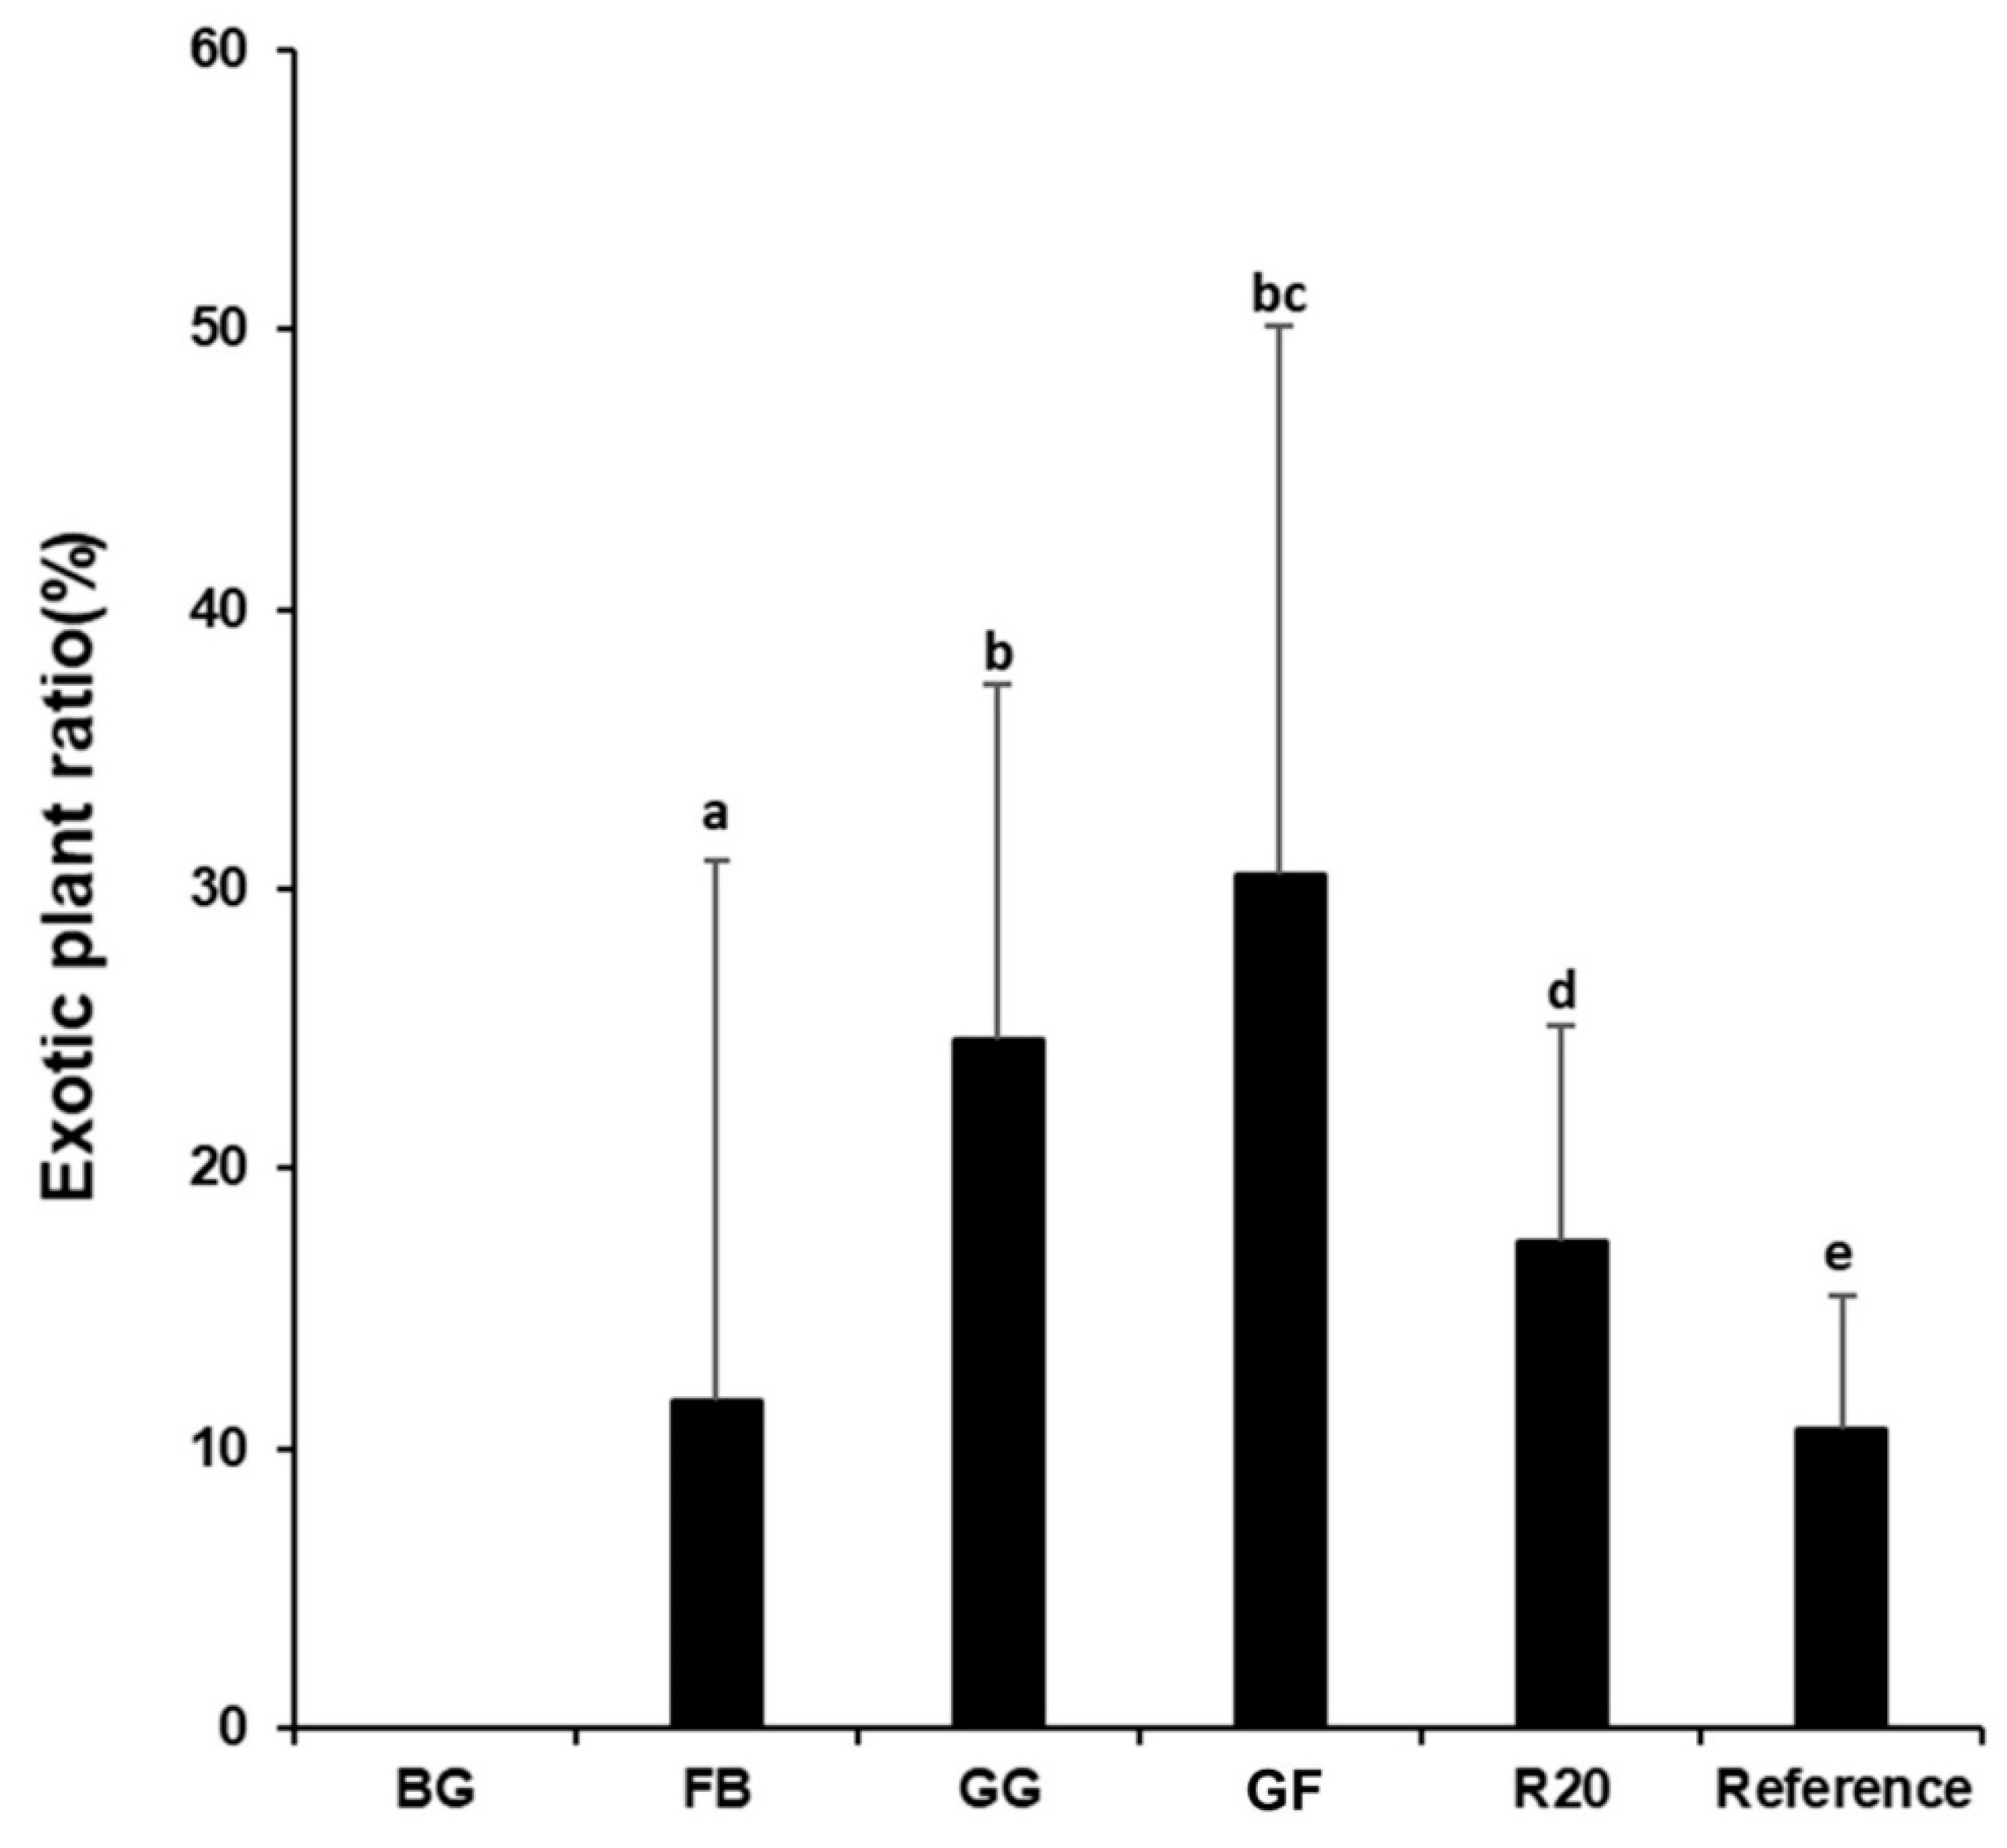
Regarding the change in species diversity, analyzed according to the species rank–dominance curves, the restored sites showed no difference from the non-restored sites in the year of restoration, but the species richness doubled in the 4th year after restoration and was nearly four times higher in the 20th year after restoration (Figure 5).

3.5. Exotic Species

The exotic plant species ratio in the restored stand was lower than that at the non-restored sites but higher than that at the reference site (Figure 6).

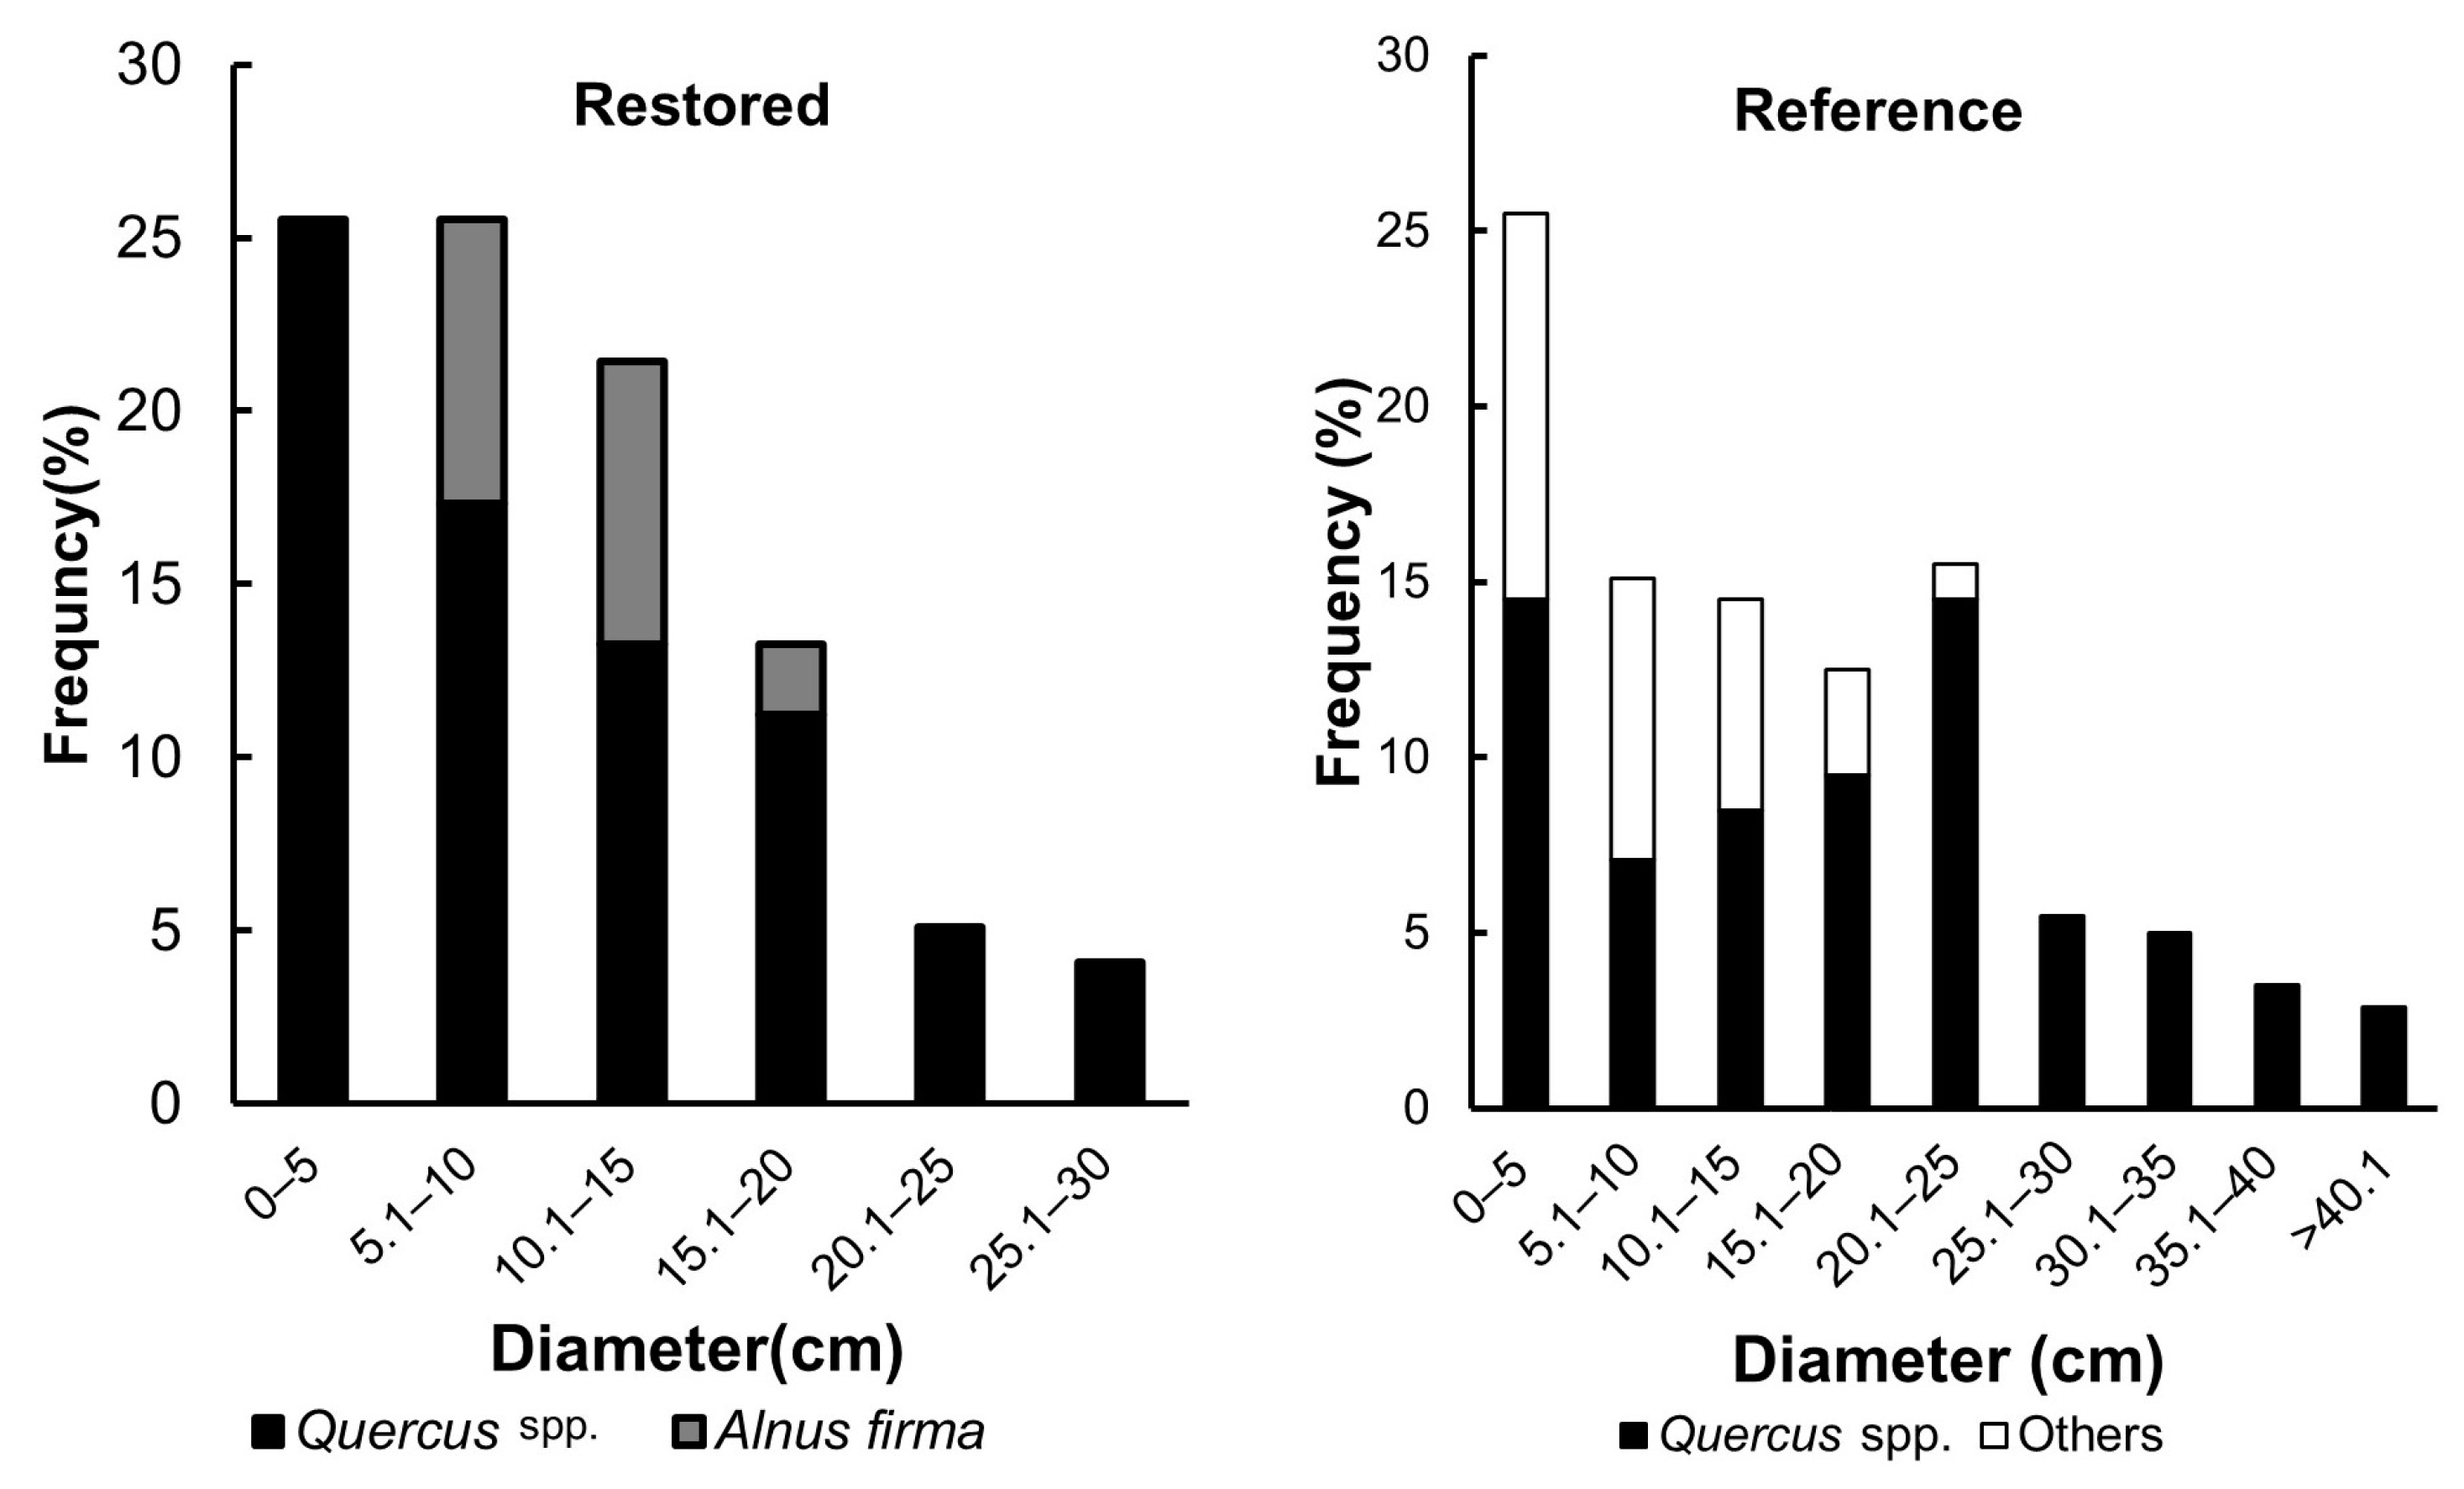
3.6. Vegetation Dynamics

The frequency distribution of the diameter class of oaks—the trees introduced for restoration—presented a reverse J-shaped pattern, while that for the reference site was observed as a pattern in which a reverse J-shaped pattern and normal distribution overlapped (Figure 7).

4. Discussion

4.1. Restoration Effects Confirmed from Soil Physico-Chemical Properties

The application of a soil ameliorator resulted in the neutralization of the acidified soil. Furthermore, it increased the Ca2+ and Mg2+ contents of the soil while reducing the Al3+ content. The neutralization of the acidified soil and increases in Ca2+ and Mg2+ contents can be attributed to the effects of dolomite [2,37,38]; on the other hand, the reduction in Al3+ in the ameliorated plots suggests that the sludge applied as a soil ameliorator functioned as a chelating agent for Al3+ [2,39,40].
Many tree species are sensitive to the Al3+ content in the soil solution [41,42,43]. Aluminum toxicity inhibits root growth by impeding both cell division and elongation [42,44,45]. Consequently, it reduces the volume of the root system, damages the roots, and disrupts the uptake of ions such as calcium and phosphate [46,47,48]. Meanwhile, a lack of soil nutrients such as Ca2+ and Mg2+ restricts root growth and aggravates the issue of inefficient nutrient uptake caused by root damage [45,49,50].
The supply of plant residue compost, urban waste compost, animal manure, and coal-derived organic products to acidified soil often increases soil pH, reduces Al3+ saturation, and improves the soil to conditions suitable for plant growth [51,52,53]. Recycling these wastes for soil amelioration offers environmental and economic benefits as long as they do not contain environmentally harmful substances. These organic materials provide metal-binding and pH-buffering capacities, which play crucial roles in determining the pH of the treated soil [53,54,55]. Although the use of dolomite and sludge mixture contributed to improving the acidified soil, it is important to note that its application raises concerns due to potential groundwater contamination and eutrophication [4,56,57]. By facilitating the mineralization of soil organic matter, dolomitic liming increases nitrate release from the soil, leading to groundwater pollution [40,56,58]. Therefore, we recommend the restricted use of these soil ameliorators.

4.2. Vegetation Development

The results of stand ordination indicated that the species composition of the restored stands differed from that of the non-restored stands and was similar to that of the reference stand. This trend became more pronounced over time, and the species composition of the restored stands 20 years after restoration showed little difference from that of the reference stands (Figure 3). The establishment of Q. serrata, L. japonicum, and A. firma—which were introduced for restoration—reduced the coverage of M. sinensis (Figure 4). The reduction in M. sinensis coverage can create a safe site for other species, encouraging their recruitment and establishment [59].
In the forest of the polluted area, the trees that make up the canopy layer are usually affected first and removed. As the trees that make up the canopy layer decline, plants of the shrub layer are impacted next, followed by the plants of the herb layer. The result of these sequential effects in the vertical layers of vegetation led to a homogeneous M. sinensis mat. This sequential decline in the vertical layer of vegetation is known as the “peeling off” or “layered vegetation” effect [60]. This grass mat also appears during the recovery process of ground made bare due to severe pollution damage [2]. These dense mats are usually composed of pollution-tolerant plants [5], including M. sinensis itself [3]. Such vegetation mats monopolize resources such as light, nutrients, and water, hindering the progression of succession and the establishment of other species [61], as has been demonstrated in the inhibition model of Connell and Slatyer [62]. The decline of such vegetation mats indicates the resumption of succession [63,64,65] and can be considered a positive indicator of successful restoration [1,66,67].
As shown in Figure 3, vegetation development through passive restoration did not progress at all or rarely progressed in the non-restored sites. On the other hand, the restored sites presented a noticeable change toward the reference vegetation, along with increased species diversity (Figure 5).
The species rank–dominance curve (Figure 5) provides insights into species diversity, including species richness and species evenness. In response to the restorative treatment, species richness increased, indicating the addition of more species to the restored sites. The slope of the curve, which represents species evenness, also increased, indicates a more balanced distribution of dominant species across the community. Consequently, both species richness and evenness showed an increasing trend with time after restoration. The Shannon–Wiener index, which reflects species diversity, exhibited a similar pattern of increase over time, supporting the observations from the species rank–dominance relationship (Figure 5).
The size distribution of trees is a valuable indicator of changes in the tree population structure [68,69,70]. Ecologists have long focused on these measurements to understand species coexistence, competition, and forest management [71]. In a plant population’s diameter-class distribution histogram, the pattern of frequency distribution across diameter classes provides insights into the potential changes within the plant community. A reverse J-shaped distribution pattern, with more young individuals and fewer mature individuals, suggests a population that can be maintained continuously [71,72]. On the other hand, a normal distribution pattern, with fewer young individuals than mature individuals, often indicates a population that may be replaced in the future [66]. However, bimodal patterns may occur in populations regenerated by periodic disturbances, deviating from the typical patterns [72,73].
The frequency distribution of the diameter class for the introduced oak population displayed a reverse J-shaped distribution pattern, suggesting the potential for the continuous maintenance of the oak community established through the restoration project [74,75,76]. The diameter class distribution of the oak population from the reference site exhibited a mixture of a normal distribution type and a reverse J-shaped distribution. This indicates ongoing recruitment of young individuals, such as seedlings and saplings, and suggests the possibility of continuously maintaining the oak population [74,75,76].

4.3. Percentage of Exotic Species

The proportion of exotic species at the restored site was lower than that in the non-restored site but was higher than that at the reference site (Figure 6). The introduction and spread of exotic species is a global phenomenon, occurring both intentionally and unintentionally [77,78,79]. These exotic species often expand their habitat range beyond early settlements through favorable life history strategies [78,79]. It is well-known that disturbed sites provide microsites that favor exotic species with opportunistic or ruderal life history strategies [3,78,79]. Although all ecosystems have the potential to be invaded by exotic species, certain ecosystems, such as periodically disturbed areas such as industrial sites, are particularly vulnerable to invasion [80,81]. Additionally, evolutionarily and geographically isolated ecosystems, such as oceanic islands, are also at higher risk. Human disturbances further enhance the vulnerability of ecosystems to invasion [82,83,84]. The invasion of exotic plants begins in places disturbed by human influence, which also leads to their spread. The considered study area is surrounded by an industrial complex and urban areas and, thus, is similar to a real island. Moreover, the area where this study was conducted is in a state where the vegetation has been damaged to the level of grasslands or lowlands due to extreme air pollution and soil pollution, thus providing favorable conditions for the invasion of exotic species. In this respect, it can be seen that it is exposed to the invasion of exotic species in a defenseless state. Under these conditions, ecological restoration serves as a means of lowering the ratio of exotic species and exerting the restoration effect (Figure 6).

4.4. Evaluation of Restoration Effect

Continued population growth and the spread of industrial land uses lead to declines in environmental quality. Furthermore, the natural landscape, which provides various ecosystem services, is rapidly transforming into agricultural, industrial, and urban areas, even degenerating into wasteland. Consequently, the balance between the emission source of environmental stress and its absorption source is being tipped [81,83]. As shown in our results (Figure 3), natural succession was delayed in the study area. Thus, restoration activities to promote natural recovery and passive development along desirable trajectories were required.
Soil ameliorators mixed with dolomite and sewage sludge can be applied to restore degraded ecosystems, particularly those degraded by air and soil pollution [59,85,86,87]. These soil ameliorators were effective in improving the polluted soil, thus achieving successful restoration [59]. However, they may also introduce other issues, including groundwater contamination and eutrophication [4,56,58]. In light of these concerns, we also recommend planting tolerant plants, rather than applying soil ameliorators as the sole restorative treatment, in all cases. The trajectory of a restoration project can be observed by assessing both the structure and function of the ecosystem [88,89]. Similarly, the degradation of an ecosystem involves changes in both dimensions. The ultimate goal of restoration is to bring a habitat or ecosystem back to a state similar to its pre-degraded condition. While complete restoration implies a return to that specific state, partial restoration or alternative trajectories may also occur through the establishment of alternative systems [9,90,91].
To effectively restore degraded areas or protect existing high-quality areas, it is important to define attributes based on the characteristics of “normal” and “healthy” habitats [40,92,93]. One approach to setting such criteria and assessing the restoration effect is to define the biological integrity of the system and then measure the deviation from it. Integrity refers to the state of being non-damaged, complete, or non-fragmented. Biological integrity has been defined as “the ability to support and maintain a balanced, integrated, adaptive biological system with the full range of elements and processes expected in the natural habitat of a region” [94,95]. To assess the restored site in this study, the ecological characteristics of the site were compared with those of an “undisturbed” natural reference site. In our study, we decided to compare the species composition, biodiversity, the control of a plant-inhibiting vegetation development, and the ratio of exotic plant species in a restored sites with those at the reference (natural oak forest) and non-restored sites. In addition, we evaluated the sustainability of the restored vegetation by analyzing the frequency distribution of diameter classes in major plant populations.
The species composition of the restored site resembled that of a natural oak forest (Figure 3), and the diversity increased to the extent that it was close to that at the reference sites (Figure 4). In contrast, the sites without any restorative treatment not only showed different species composition from that at the reference sites (Figure 3) but also had a lower biodiversity (Figure 4). Therefore, the restorative treatment approached the restoration goal by increasing both biological integrity and ecological stability.
Biodiversity was significantly increased at the restored site after restoration (Figure 4). The importance of biodiversity is based on a variety of values involving various ecological functions leading to environmental stability [96,97]. Biodiversity is based on the heterogeneity of habitats (or eco-diversity). High biodiversity also derives from the integrity of the environment, that is, a healthy environment with all its components [98,99,100]. High biodiversity in the restored site resulted from suppressing the M. sinensis by restoring taller woody plants. In addition, this result was also promoted through soil amelioration [101].
On the other hand, the restorative treatment contributed to lowering the dominance of succession-inhibiting plants (Figure 5) and the ratio of exotic species (Figure 6), thus securing the sustainability of the introduced vegetation (Figure 7). Consequently, the restorative treatment increased both biological integrity and ecological stability and thereby met the restoration goal [9,94,95].

5. Conclusions

The forest ecosystem surrounding the Ulsan Industrial Complex (the largest industrial complex in Korea) has been severely damaged by extreme air pollution and subsequent soil acidification. The forest vegetation was gradually destroyed through the “peeling off” effect and was degraded to grasslands; many places were degraded further to bare ground.
This study was conducted in Mt. Dotjil, where the vegetation had been severely damaged and soil acidification had severely progressed. This study was conducted with the aim of restoring a damaged forest ecosystem by ameliorating the acidified soil and introducing plant species that are tolerant to air and soil pollution. The restoration practice was performed in 1998, and its effect was evaluated in the year of restoration, 4 years later, and 20 years later. The restoration effect was evaluated based on the physico-chemical characteristics of the soil and the species composition, species diversity, dynamics, and exotic species ratio of vegetation.
As a result of the evaluation of the restoration effect, the physico-chemical properties of the soil improved significantly after treatment with the soil ameliorator (a mixture of dolomite and sludge), but indicated that they acidified again after 20 years. These results were interpreted to be due to the continued emission of pollutants from industrial facilities, although the environmental condition had improved significantly since the early days of industrial activity in the area. However, the vegetation achieved by introducing tolerant species to pollutants was well-established, and 20 years later, a species composition similar to that at the reference site was achieved and species diversity was also restored to a level similar to that at the reference site. It is believed that the plants introduced for restoration played an important role in pioneering an open habitat by suppressing M. sinensis, which served as an obstacle to the invasion of new vegetation.
Based on the results of this study, it was concluded that the selection and introduction of tolerant species, along with soil amelioration, are important steps toward restoring an ecosystem destroyed by pollutants emitted from industrial facilities. In addition, in order to maintain the establishment and the development of vegetation introduced for restoration, it is important to create a safe site by suppressing aggressive plant species that thrive in the destroyed site. On the other hand, it was judged that soil improvement was important for the establishment of introduced plants in the early stages of restoration but did not have a significant impact after their settlement.

Author Contributions

Conceptualization, D.-U.K. and C.-S.L.; methodology, D.-U.K., B.-S.L. and J.-E.S.; validation, J.-E.S. and B.-S.L.; formal analysis, B.-S.L. and C.-H.L.; investigation, D.-U.K., G.-S.K., J.-S.M., C.-S.L., B.-S.L. and C.-H.L.; data curation, B.-S.L.; writing—original draft preparation, C.-S.L. and D.-U.K.; writing—review and editing, G.-S.K., J.-S.M. and C.-S.L.; visualization, J.-E.S. and B.-S.L.; supervision, C.-S.L.; project administration, C.-S.L. All authors have read and agreed to the published version of the manuscript.

Funding

This work was supported by the Korea Environment Industry & Technology Institute (KEITI) through Wetland Ecosystem Value Evaluation and Carbon Absorption Value Promotion Technology Development Project, funded by the Korea Ministry of Environment (2022003630002).

Data Availability Statement

Climate data in Ulsan is available on KMA Weather Data Service. (https://data.kma.go.kr, accessed on 28 July 2023). Soil data in Ulsan is available on FGIS Forest Geospatial Information System. (https://www.forest.go.kr/newkfsweb/html/HtmlPage.do?pg=/fgis/UI_KFS_5002_020200.html&mn=KFS_02_04_03_04_02, accessed on 28 July 2023).

Conflicts of Interest

The authors declare no conflict of interest.

References

  1. Lee, H.; Lim, B.S.; Kim, D.U.; Kim, A.R.; Seol, J.W.; Lim, C.H.; Kil, J.H.; Moon, J.S.; Lee, C.S. Decline and passive restoration of forest vegetation around the Yeocheon industrial complex of Southern Korea. Forests 2020, 11, 674. [Google Scholar] [CrossRef]
  2. Lee, C.S.; Moon, J.S.; Cho, Y.C. Effects of soil amelioration and tree planting on restoration of an air-pollution damaged forest in south Korea. Water Air Soil Pollut. 2007, 179, 239–254. [Google Scholar] [CrossRef]
  3. Lee, C.S.; Moon, J.S.; Hwangbo, J.K.; You, Y.H. Selection of pollution-tolerant plants and restoration planning to recover the forest ecosystem degraded by air pollution in the industrial complex. Kor. J. Biol. Sci. 2002, 6, 59–64. [Google Scholar] [CrossRef]
  4. Freedman, R.; Hall, M.; Adler, L.E.; Leonard, S. Evidence in postmortem brain tissue for decreased numbers of hippocampal nicotinic receptors in schizophrenia. Biol. Psychiatry 1995, 38, 22–33. [Google Scholar] [CrossRef] [PubMed]
  5. Lee, C.S.; Cho, Y.C.; Shin, H.C.; Lee, S.M.; Oh, W.S.; Park, S.; Seol, E.S.; Lee, C.H.; Eom, A.H.; Cho, H.J. An Evaluation of the Effects of Rehabilitation Practiced in Coal Mining Spoils in Korea: 2. An Evaluation Based on the Physicochemical Properties of Soil. J. Ecol. Environ. 2008, 31, 23–29. [Google Scholar] [CrossRef] [Green Version]
  6. Lee, C.S.; Jung, S.; Lim, B.S.; Kim, A.R.; Lim, C.H.; Lee, H. Forest decline under progress in the urban forest of Seoul, Central Korea. In Forest Degradation Around the World; Nazip Suratman, M., Abd Latif, Z., De Oliveira, G., Brunsell, N., Shimabukuro, Y., Antonio Costa Dos Santos, C., Eds.; IntechOpen: London, UK, 2019. [Google Scholar]
  7. Kim, G.S.; Kim, A.R.; Lim, B.S.; Seol, J.; An, J.H.; Lim, C.H.; Joo, S.J.; Lee, C.S. Assessment of the Carbon Budget of Local Governments in South Korea. Atmosphere 2022, 13, 342. [Google Scholar] [CrossRef]
  8. Gunn, J.; Keller, W.; Negusanti, J.; Potvin, R.; Beckett, P.; Winterhalder, K. Ecosystem recovery after emission reductions: Sudbury, Canada. Water Air Soil Pollut. 1995, 85, 1783–1788. [Google Scholar] [CrossRef]
  9. Aronson, J.; Floret, C.; Le Floc’h, E.; Ovalle, C.; Pontanier, R. Restoration and rehabilitation of degraded ecosystems in arid and semi-arid lands. I. A view from the south. Restor. Ecol. 1993, 1, 8–17. [Google Scholar] [CrossRef]
  10. McDonald, T.; Gann, G.; Jonson, J.; Dixon, K. International Standards for the Practice of Ecological Restoration–Including Principles and Key Concepts; Society for Ecological Restoration: Washington, DC, USA, 2016. [Google Scholar]
  11. Gann, G.D.; McDonald, T.; Walder, B.; Aronson, J.; Nelson, C.R.; Jonson, J.; Hallett, J.G.; Eisenberg, C.; Guariguata, M.R.; Liu, J. International principles and standards for the practice of ecological restoration. Restor. Ecol. 2019, 27, S1–S46. [Google Scholar] [CrossRef] [Green Version]
  12. Society for Ecological Restoration International Science (SERI) and Policy Working Group (PWG). The SER International Primer on Ecological Restoration; Society for Ecological Restoration International: Tucson, AZ, USA, 2004. [Google Scholar]
  13. Lim, C.H.; Kim, G.S.; An, J.H.; You, B.H.; Bae, Y.S.; Byun, H.G.; Lee, C.S. Relationship between biodiversity and landscape structure in the Gyungan stream basin, central Korea. Entomol. Res. 2016, 46, 260–271. [Google Scholar] [CrossRef]
  14. Kondolf, G.M.; Anderson, S.; Lave, R.; Pagano, L.; Merenlender, A.; Bernhardt, E. Two decades of river restoration in California: What can we learn? Restor. Ecol. 2007, 15, 516–523. [Google Scholar] [CrossRef]
  15. Palmer, M.; Allan, J.D.; Meyer, J.; Bernhardt, E.S. River restoration in the twenty-first century: Data and experiential knowledge to inform future efforts. Restor. Ecol. 2007, 15, 472–481. [Google Scholar] [CrossRef] [Green Version]
  16. Tischew, S.; Baasch, A.; Conrad, M.K.; Kirmer, A. Evaluating restoration success of frequently implemented compensation measures: Results and demands for control procedures. Restor. Ecol. 2010, 18, 467–480. [Google Scholar] [CrossRef]
  17. Wilson, K.A.; Lulow, M.; Burger, J.; Fang, Y.C.; Andersen, C.; Olson, D.; O’Connell, M.; McBride, M.F. Optimal restoration: Accounting for space, time and uncertainty. J. Appl. Ecol. 2011, 48, 715–725. [Google Scholar] [CrossRef]
  18. Lindenmayer, D.B.; Likens, G.E.; Franklin, J.F. Rapid responses to facilitate ecological discoveries from major disturbances. Front. Ecol. Environ. 2010, 8, 527–532. [Google Scholar] [CrossRef]
  19. Palmer, M.A.; Filoso, S. Restoration of ecosystem services for environmental markets. Science 2009, 325, 575–576. [Google Scholar] [CrossRef] [Green Version]
  20. Wortley, L.; Hero, J.M.; Howes, M. Evaluating ecological restoration success: A review of the literature. Restor. Ecol. 2013, 21, 537–543. [Google Scholar] [CrossRef]
  21. Noss, R.F. Indicators for Monitoring Biodiversity: A Hierarchical Approach. Conserv. Biol. 1990, 4, 355–364. [Google Scholar] [CrossRef]
  22. Aronson, J.; Le Floc’h, E. Vital Landscape Attributes: Missing Tools for Restoration Ecology. Restor. Ecol. 1996, 4, 377–387. [Google Scholar] [CrossRef]
  23. Ruiz-Jaen, M.C.; Mitchell Aide, T. Restoration success: How is it being measured? Restor. Ecol. 2005, 13, 569–577. [Google Scholar] [CrossRef]
  24. Ruiz-Jaén, M.C.; Aide, T.M. Vegetation structure, species diversity, and ecosystem processes as measures of restoration success. For. Ecol. Manag. 2005, 218, 159–173. [Google Scholar] [CrossRef]
  25. Korea Meteorological Administration. KMA Weather Data Service. Available online: https://data.kma.go.kr (accessed on 29 June 2023).
  26. Lee, J.T.; Shin, D.; Chung, Y. Air pollution and daily mortality in Seoul and Ulsan, Korea. Environmental Health Perspectives 1999, 107, 149–154. [Google Scholar] [CrossRef] [PubMed]
  27. Kim, J.H.; Mun, H.T.; Cho, D.S.; Lee, C.S. Selection and Breeding of Tolerant Species and Bioindicator to Air Pollution and Acid Rain; A research report for development of the advanced technology; Ministry of Environment of Korea: Seoul, Korea, 1996; (In Korean with English summary).
  28. Lee, C.S.; Lee, K.S.; Hwangbo, J.K.; You, Y.H.; Kim, J.H. Selection of Tolerant Plants and Their Arrangement to Restore a Forest Ecosystem Damaged by Air Pollution. Water Air Soil Pollut. 2004, 156, 251–273. [Google Scholar] [CrossRef]
  29. Allen, S.E.; Grimshaw, H.M.; Rowland, A.P. Chemical Analysis. Methods in Plant Ecology; Moore, P.D., Chapman, S.B., Eds.; Blackwell: London, UK, 1986. [Google Scholar]
  30. Lee, T.B. Illustrated Flora of Korea; HyangMoonSa: Seoul, Korea, 1985. [Google Scholar]
  31. Korea National Arboretum. Korean Plant Names Index. Available online: http://www.nature.go.kr/kbi/plant/pilbk/selectPlantPilbkGnrlList.do (accessed on 29 June 2023).
  32. Braun-Blanquet, J. Pflanzengesellschaft und Biozönose. In Pflanzensoziologie; Springer: Vienna, Austria, 1964; pp. 1–6. [Google Scholar] [CrossRef]
  33. Hill, M.O. A Fortran program for detrended correspondence analysis and reciprocal averaging. Vegetatio 1979, 42, 47–58. [Google Scholar] [CrossRef]
  34. Kent, M.; Coker, P. Vegetation Description and Analysis: A Practical Approach; John Wiley & Sons: Chichester, UK, 1992. [Google Scholar]
  35. Lee, C.S.; You, Y.H.; Robinson, G.R. Secondary Succession and Natural Habitat Restoration in Abandoned Rice Fields of Central Korea. Restor. Ecol. 2002, 10, 306–314. [Google Scholar] [CrossRef]
  36. Magurran, A.E. Measuring Biological Diversity; Blackwell: New York, NY, USA, 2004. [Google Scholar]
  37. Shaaban, M.; Peng, Q.; Hu, R.; Wu, Y.; Lin, S.; Zhao, J. Dolomite application to acidic soils: A promising option for mitigating N2O emissions. Environ. Sci. Pollut. Res. 2015, 22, 19961–19970. [Google Scholar] [CrossRef] [PubMed]
  38. Litvinovich, A.; Lavrishchev, A.; Bure, V.; Zhapparova, A.; Kekilbayeva, G.; Saljnikov, E. Impact of dolomite rock waste on soil acidity and absorption of Ca and Mg by barley and wheat. Ciência E Agrotecnologia 2023, 47, e006622. [Google Scholar] [CrossRef]
  39. Singh, A.; Agrawal, M.; Marshall, F.M. The role of organic vs. inorganic fertilizers in reducing phytoavailability of heavy metals in a wastewater-irrigated area. Ecol. Eng. 2010, 36, 1733–1740. [Google Scholar] [CrossRef]
  40. Kim, A.R.; Lim, B.S.; Seol, J.; Lim, C.H.; You, Y.H.; Lee, W.S.; Lee, C.S. Diagnostic Assessment and Restoration Plan for Damaged Forest around the Seokpo Zinc Smelter, Central Eastern Korea. Forests 2021, 12, 663. [Google Scholar] [CrossRef]
  41. Hutchinson, S. Grounded theory. In Nursing Research: A Qualitative Perspective; Munhall, P., Oiler, C., Eds.; Appleton-Century-Crofts: Norwalk, CA, USA, 1986; pp. 111–130. [Google Scholar]
  42. Ma, J.F. Syndrome of aluminum toxicity and diversity of aluminum resistance in higher plants. Int. Rev. Cytol. 2007, 264, 225–252. [Google Scholar]
  43. Nguyen, A.; Nguyen, T.T.; Nguyen, D.K.; Richter, O.; Do, H.T.T. Management of Al3+ Residue in the Soil by Mapping Soil Capability in Retaining and Transporting Al3+ in the Farmland of Trang Bom District, Vietnam. Agronomy 2022, 12, 1243. [Google Scholar] [CrossRef]
  44. IQBAL, T. Effect of Al compounds on soil pH and bioavailability of Al in two acid soils. Turk. J. Agric. For. 2012, 36, 720–728. [Google Scholar] [CrossRef]
  45. Rahman, M.A.; Lee, S.H.; Ji, H.C.; Kabir, A.H.; Jones, C.S.; Lee, K.W. Importance of mineral nutrition for mitigating aluminum toxicity in plants on acidic soils: Current status and opportunities. Int. J. Mol. Sci. 2018, 19, 3073. [Google Scholar] [CrossRef] [Green Version]
  46. Li, X.; Li, Y.; Mai, J.; Tao, L.; Qu, M.; Liu, J.; Shen, R.; Xu, G.; Feng, Y.; Xiao, H. Boron Alleviates Aluminum Toxicity by Promoting Root Alkalization in Transition Zone via Polar Auxin Transport. Plant Physiol. 2018, 177, 1254–1266. [Google Scholar] [CrossRef] [PubMed] [Green Version]
  47. Liu, W.; Xu, F.; Lv, T.; Zhou, W.; Chen, Y.; Jin, C.; Lu, L.; Lin, X. Spatial responses of antioxidative system to aluminum stress in roots of wheat (Triticum aestivum L.) plants. Sci. Total Environ. 2018, 627, 462–469. [Google Scholar] [CrossRef] [PubMed]
  48. Sun, C.; Lv, T.; Huang, L.; Liu, X.; Jin, C.; Lin, X. Melatonin ameliorates aluminum toxicity through enhancing aluminum exclusion and reestablishing redox homeostasis in roots of wheat. J. Pineal Res. 2020, 68, e12642. [Google Scholar] [CrossRef]
  49. Sumner, M.E.; Fey, M.V.; Noble, A.D. Nutrient Status and Toxicity Problems in Acid Soils; Ulrich, B., Sumner, M.E., Eds.; Springer: Berlin, Germany, 1991; pp. 149–182. [Google Scholar] [CrossRef]
  50. Meriño-Gergichevich, C.; Alberdi, M.; Ivanov, A.; Reyes-Díaz, M. Al3+-Ca2+ interaction in plants growing in acid soils: Al-phytotoxicity response to calcareous amendments. J. Soil Sci. Plant Nutr. 2010, 10, 217–243. [Google Scholar]
  51. Hue, N. Correcting soil acidity of a highly weathered Ultisol with chicken manure and sewage sludge. Commun. Soil Sci. Plant Anal. 1992, 23, 241–264. [Google Scholar] [CrossRef]
  52. Chen, D.; Ye, X.; Jiang, Y.; Xiao, W.; Zhang, Q.; Zhao, S.; Shao, S.; Gao, N.; Huang, M.; Hu, J. Continuously applying compost for three years alleviated soil acidity and heavy metal bioavailability in a soil-asparagus lettuce system. Front. Plant Sci. 2022, 13, 972789. [Google Scholar] [CrossRef]
  53. Rodríguez-Espinosa, T.; Navarro-Pedreño, J.; Gómez Lucas, I.; Almendro Candel, M.B.; Pérez Gimeno, A.; Zorpas, A.A. Soluble Elements Released from Organic Wastes to Increase Available Nutrients for Soil and Crops. Appl. Sci. 2023, 13, 1151. [Google Scholar] [CrossRef]
  54. Wong, M.; Swift, R.S. Role of organic matter in alleviating soild acidity. In Handbook of Soil Acidity, 1st ed.; Rengel, Z., Ed.; CRC Press: Boca Raton, FL, USA, 2003; pp. 351–372. [Google Scholar]
  55. Kacprzak, M.; Kupich, I.; Jasinska, A.; Fijalkowski, K. Bio-based waste’substrates for degraded soil improvement—Advantages and challenges in European context. Energies 2022, 15, 385. [Google Scholar] [CrossRef]
  56. Kreutzer, K. Effects of forest liming on soil processes. In Nutrient Uptake and Cycling in Forest Ecosystems: Proceedings of the CEC/IUFRO Symposium Nutrient Uptake and Cycling in Forest Ecosystems, Halmstad, Sweden, 7–10 June 1993; Springer: Berlin/Heidelberg, Germany, 1993; pp. 447–470. [Google Scholar]
  57. Singh, R.P.; Singh, P.; Ibrahim, M.H.; Hashim, R. Land application of sewage sludge: Physicochemical and microbial response. In Reviews of Environmental Contamination and Toxicology; Springer: New York, NY, USA, 2011; pp. 41–61. [Google Scholar] [CrossRef]
  58. Kaupenjohann, M.; Hantschel, R. Die kurzfristige pH-Pufferung von gestörten und ungestörten Waldbodenproben. Z. Für Pflanzenernährung Und Bodenkd. 1987, 150, 156–160. [Google Scholar] [CrossRef]
  59. Winterhalder, B.; Smith, E.A. Analyzing adaptive strategies: Human behavioral ecology at twenty-five. Evol. Anthropol. 2000, 9, 51–72. [Google Scholar] [CrossRef]
  60. Gordon, A.G.; Gorham, E. Ecological aspects of air pollution from an iron-sintering plant at Wawa, Ontario. Can. J. Bot. 1963, 41, 1063–1078. [Google Scholar] [CrossRef]
  61. Woods, C.L.; Maleta, K.; Ortmann, K. Plant–plant interactions change during succession on nurse logs in a northern temperate rainforest. Ecol. Evol. 2021, 11, 9631–9641. [Google Scholar] [CrossRef] [PubMed]
  62. Connell, J.H.; Slatyer, R.O. Mechanisms of succession in natural communities and their role in community stability and organization. Am. Nat. 1977, 111, 1119–1144. [Google Scholar] [CrossRef]
  63. Del Moral, R.; Bliss, L.C. Mechanisms of primary succession: Insights resulting from the eruption of Mount St Helens. In Advances in Ecological Research; Begon, M., Fitter, A.H., Eds.; Academic Press: Cambridge, MA, USA, 1993; Volume 24, pp. 1–66. [Google Scholar]
  64. Walker, L.R.; Shiels, A.B.; Bellingham, P.J.; Sparrow, A.D.; Fetcher, N.; Landau, F.H.; Lodge, D.J. Changes in abiotic influences on seed plants and ferns during 18 years of primary succession on P uerto R ican landslides. J. Ecol. 2013, 101, 650–661. [Google Scholar] [CrossRef] [Green Version]
  65. Strydom, T.; Kraaij, T.; Difford, M.; Cowling, R.M. Fire severity effects on resprouting of subtropical dune thicket of the Cape Floristic Region. PeerJ 2020, 8, e9240. [Google Scholar] [CrossRef]
  66. Puyravaud, J.P. Standardizing the calculation of the annual rate of deforestation. For. Ecol. Manag. 2003, 177, 593–596. [Google Scholar] [CrossRef]
  67. Young, T.P.; Peffer, E. “Recalcitrant understory layers” revisited: Arrested succession and the long life-spans of clonal mid-successional species. Can. J. For. Res. 2010, 40, 1184–1188. [Google Scholar] [CrossRef]
  68. Wright, S.J.; Muller-Landau, H.C.; Condit, R.; Hubbell, S.P. Gap-dependent recruitment, realized vital rates, and size distributions of tropical trees. Ecology 2003, 84, 3174–3185. [Google Scholar] [CrossRef]
  69. White, E.P.; Ernest, S.M.; Kerkhoff, A.J.; Enquist, B.J. Relationships between body size and abundance in ecology. Trends Ecol. Evol. 2007, 22, 323–330. [Google Scholar] [CrossRef] [PubMed]
  70. Deb, P.; Sundriyal, R. Tree regeneration and seedling survival patterns in old-growth lowland tropical rainforest in Namdapha National Park, north-east India. For. Ecol. Manag. 2008, 255, 3995–4006. [Google Scholar] [CrossRef]
  71. Kohira, M.; Ninomiya, I. Detecting tree populations at risk for forest conservation management: Using single-year vs. long-term inventory data. For. Ecol. Manag. 2003, 174, 423–435. [Google Scholar] [CrossRef]
  72. Chew, R.M.; Chew, A.E. The Primary Productivity of a Desert-Shrub (Larrea tridentata) Community. Ecol. Monogr. 1965, 35, 355–375. [Google Scholar] [CrossRef]
  73. Barbour, M.T. Rapid Bioassessment Protocols for Use in Wadeable Streams and Rivers: Periphyton, Benthic Macroinvertebrates and Fish; US Environmental Protection Agency, Office of Water: Washington, DC, USA, 1999.
  74. Lykke, A.M. Assessment of species composition change in savanna vegetation by means of woody plants' size class distributions and local information. Biodivers. Conserv. 1998, 7, 1261–1275. [Google Scholar] [CrossRef]
  75. Bin, Y.; Lin, G.; Li, B.; Wu, L.; Shen, Y.; Ye, W. Seedling recruitment patterns in a 20 ha subtropical forest plot: Hints for niche-based processes and negative density dependence. Eur. J. For. Res. 2012, 131, 453–461. [Google Scholar] [CrossRef]
  76. Dyakov, N.; Zhelev, P. Alien species invasion and diversity of riparian forest according to environmental gradients and disturbance regime. Appl. Ecol. Environ. Res. 2013, 11, 249–272. [Google Scholar] [CrossRef]
  77. Cronk, Q.C.; Fuller, J.L. Plant Invaders: The Threat to Natural Ecosystems; Routledge: England, UK, 2014. [Google Scholar]
  78. Mooney, H.A.; Mack, R.; McNeely, J.A.; Neville, L.E.; Schei, P.J.; Waage, J.K. Invasive Alien Species: A New Synthesis; Island Press: Washington, DC, USA, 2005. [Google Scholar]
  79. Rawlins, J.K.; Roundy, B.A.; Davis, S.M.; Egget, D. Predicting germination in semi-arid wildland seedbeds. I. Thermal germination models. Environ. Exp. Bot. 2012, 76, 60–67. [Google Scholar] [CrossRef]
  80. Kowarik, I. Neophytes in Germany: Quantitative overview, introduction and dispersal pathways, ecological consequences and open questions. Texte Des Umweltbundesamtes Berl. 1999, 18, 12–36. [Google Scholar]
  81. Shiferaw, W.; Demissew, S.; Bekele, T. Invasive alien plant species in Ethiopia: Ecological impacts on biodiversity a review paper. Int. J. Mol. Biol. 2018, 3, 171–178. [Google Scholar] [CrossRef] [Green Version]
  82. Meyer, S.E.; Callaham, M.A.; Stewart, J.E.; Warren, S.D. Invasive species response to natural and anthropogenic disturbance. In Invasive Species in Forests and Rangelands of the United States: A Comprehensive Science Synthesis for the United States Forest Sector; Springer Nature: London, UK, 2021; pp. 85–110. [Google Scholar]
  83. McNeely, J.A. Cities and protected areas: An oxymoron or a partnership? Parks 2001, 11, 1–3. [Google Scholar]
  84. Daly, E.Z.; Chabrerie, O.; Massol, F.; Facon, B.; Hess, M.C.M.; Tasiemski, A.; Grandjean, F.; Chauvat, M.; Viard, F.; Forey, E.; et al. A synthesis of biological invasion hypotheses associated with the introduction–naturalisation–invasion continuum. Oikos 2023, 2023, e09645. [Google Scholar] [CrossRef]
  85. Rietkerk, M.; van de Koppel, J. Alternate stable states and threshold effects in semi-arid grazing systems. Oikos 1997, 79, 69–76. [Google Scholar] [CrossRef] [Green Version]
  86. Edmeades, D.C.; Ridley, A.M. Using lime to ameliorate topsoil and subsoil acidity. In Handbook of Soil Acidity, 1st ed.; Rengel, Z., Ed.; CRC Press: Boca Raton, FL, USA, 2003; pp. 311–350. [Google Scholar]
  87. Lee, C.S.; Kim, J.Y.; You, Y.H. Amelioration of soil acidified by air pollutant around the industrial complexes. Korean J. Ecol. 1998, 21, 313–320. [Google Scholar]
  88. Lake, P.S.; Bond, N.; Reich, P. Linking ecological theory with stream restoration. Freshw. Biol. 2007, 52, 597–615. [Google Scholar] [CrossRef]
  89. Hobbs, R.J.; Cramer, V.A. Restoration ecology: Interventionist approaches for restoring and maintaining ecosystem function in the face of rapid environmental change. Annu. Rev. Environ. Resour. 2008, 33, 39–61. [Google Scholar] [CrossRef]
  90. Bradshaw, A. Ecological principles and land reclamation practice. Landsc. Plan. 1984, 11, 35–48. [Google Scholar] [CrossRef]
  91. Bradshaw, Y.W. Urbanization and underdevelopment: A global study of modernization, urban bias, and economic dependency. Am. Sociol. Rev. 1987, 52, 224–239. [Google Scholar] [CrossRef]
  92. Lüderitz, V.; Zerbe, S.; Jüpner, R.; Arevalo, J.R. Ecosystem restoration and sustainable management of rivers and wetlands–Introduction to the special issue. Wald. Landschaftsforschung Und Naturschutz 2010, 10, 5–6. [Google Scholar]
  93. Lim, B.S.; Seol, J.; Kim, A.R.; An, J.H.; Lim, C.H.; Lee, C.S. Succession of the abandoned rice fields restores the riparian forest. Int. J. Environ. Res. Public Health 2022, 19, 10416. [Google Scholar] [CrossRef] [PubMed]
  94. Karr, J.R. Rivers as sentinels: Using the biology of rivers to guide landscape management. River Ecol. Manag. Lessons Pac. Coast. Ecoregion 1998, 1, 502–528. [Google Scholar]
  95. Karr, J.R. Ecological integrity and ecological health are not the same. Eng. Within Ecol. Constraints 1996, 97, 109. [Google Scholar]
  96. Naess, A. Ecosophy and gestalt ontology. The Trumpeter 1989, 6, 134–137. [Google Scholar]
  97. Naeem, S.; Chazdon, R.; Duffy, J.E.; Prager, C.; Worm, B. Biodiversity and human well-being: An essential link for sustainable development. Proc. R. Soc. B Biol. Sci. 2016, 283, 20162091. [Google Scholar] [CrossRef]
  98. Meffe, G.K.; Carroll, C. Principles of Conservation Biology; Sinauer Associates Inc.: Sunderland, MA, USA, 1997. [Google Scholar]
  99. Primack, R.B. A Primer of Conservation Biology; Sinauer Associates: Sunderland, MA, USA, 2008. [Google Scholar]
  100. Gao, T.; Zhu, L.; Zhang, T.; Song, R.; Zhang, Y.; Qiu, L. Is an environment with high biodiversity the most attractive for human recreation? A case study in Baoji, China. Sustainability 2019, 11, 4086. [Google Scholar] [CrossRef] [Green Version]
  101. Lee, C.S.; Cho, Y.C.; Shin, H.C.; Moon, J.S.; Lee, B.C.; Bae, Y.S.; Byun, H.G.; Yi, H.B. Ecological response of streams in Korea under different management regimes. Water Eng. Res. 2005, 6, 131–147. [Google Scholar]
Figure 1. Maps showing the location and landscape structure of the study area near the Ulsan Industrial Complex, southeastern Korea. The grasslands near the industrial complex originated from the decline of forests in this area due to the severe air and soil pollution. The restoration project was carried out at Mt. Dotjil, located between the industrial complex and the urbanized area. The reference site (denoted by R) was selected in an unpolluted forest outside the industrial complex. The reference site is located approximately 30 km south of the restored site.
Forests 14 01565 g001
Figure 2. Comparison of soil chemical properties following restoration with the application of a soil ameliorator in the industrial area. Each bar represents the mean value, and the error bars indicate the standard error of the mean. Statistical analysis using Scheffe’s test was conducted to identify any significant differences among the treatment types at a significance level of α = 0.05. Parameters that share the same letter above them indicate that their means did not significantly differ from each other. The labels used in the figure are as follows: Ref represents the oak stands designated as reference stands, NR corresponds to the non-restored plot left to undergo natural processes without any restorative treatment, R(C) refers to the restored stands surveyed in the year of restoration, and R(20) indicates the restored stands surveyed 20 years after restoration.
Forests 14 01565 g002
Figure 3. DCA ordination of stands, including degraded (BG, FB, GF, and GG), restored, and reference stands. BG, bare ground; FB, former bare ground; GF, forb grassland dominated by P. thunbergiana; GG, grassland dominated by M. sinensis; R (current), the restored stands surveyed in the year of restoration; R (4 years), the restored stands surveyed in the 4th year after restoration; R (20 years), the restored stands surveyed in the 20th year after restoration; oak (reference), the oak stands designated as reference stands. (ac) indicate the results of stand ordination based on vegetation data collected in the year of restoration, 4th and 20th years after restoration, respectively.
Forests 14 01565 g003
Figure 4. Coverage of M. sinensis, which inhibits the establishment of other plants, among the restored sites at different times, the non-restored site, and the reference site. Each bar represents the mean value, and the error bars indicate the standard error of the mean. Statistical analysis using Scheffe’s test was conducted to identify any significant differences among the treatment types at a significance level of α = 0.05. Parameters that share the same letter above them indicate that their means did not significantly differ from each other. Non-restored, the plot left in a natural process without any restorative treatment; Current, the restored stands surveyed in the year of restoration; R (4 years), the restored stands surveyed in the 4th year after restoration; R (20 years), the restored stands surveyed in the 20th year after restoration; Reference, coverage of M. sinensis in the oak stands designated as reference stands.
Forests 14 01565 g004
Figure 5. Rank–dominance curves and H′ among degraded (BG, FB, GF, and GG), restored (R), and reference stands. The abbreviations are listed in Figure 3.
Forests 14 01565 g005
Figure 6. Exotic plant ratio among degraded (BG, FB, GG, and GF), restored (R), and reference stands. Each bar represents the mean value, and the error bars indicate the standard error of the mean. Statistical analysis using Scheffe’s test was conducted to identify any significant differences among the treatment types at a significance level of α = 0.05. Parameters that share the same letter above them indicate that their means did not significantly differ from each other.
Forests 14 01565 g006
Figure 7. Frequency distribution of the diameter classes of major tree species between the restored and reference stands.
Forests 14 01565 g007
Disclaimer/Publisher’s Note: The statements, opinions and data contained in all publications are solely those of the individual author(s) and contributor(s) and not of MDPI and/or the editor(s). MDPI and/or the editor(s) disclaim responsibility for any injury to people or property resulting from any ideas, methods, instructions or products referred to in the content.

