Article

Afforestation Alters the Molecular Composition of Soil Organic Matter in the Central Loess Plateau of China

1
Key Laboratory of Tree Breeding and Cultivation of State Forestry and Grassland Administration, Research Institute of Forestry, Chinese Academy of Forestry, Beijing 100091, China
2
Co-Innovation Center for Sustaintable Forestry in Southern China, Nanjing Forestry University, Nanjing 210037, China
3
College of Resources and Environmental Sciences, China Agricultural University, Beijing 100193, China
*
Author to whom correspondence should be addressed.
Forests 2023, 14(7), 1502; https://doi.org/10.3390/f14071502
Submission received: 6 June 2023 / Revised: 15 July 2023 / Accepted: 20 July 2023 / Published: 22 July 2023
(This article belongs to the Special Issue Effects of Natural Disturbances and Human Activities on Forest Soils)

Abstract

:
Many studies have been conducted on organic carbon changes under different land use patterns, but studies and data concerning changes in the molecular composition of soil organic matter (SOM) during land use conversion are scarce. In this work, we studied the chemical composition of SOM on two Robinia pseudoacacia L. plantations and their adjacent croplands in the Loess Plateau using biomarker and nuclear magnetic resonance (NMR) techniques. Experimental data on the molecular composition of SOM showed that the soil microbial biomass carbon content initially decreased and then returned to the original level gradually after afforestation, while the SOM content and stocks increased over time. At the initial stage of afforestation, the content of total solvent extracts did not change significantly but changed slowly over time in the plantations without artificial disturbance. With an increase in restoration time, the concentrations of both the microbial- and plant-derived solvent extracts increased. Moreover, the concentrations of plant-derived solvent extracts were consistently lower than those of microbial-derived solvent extracts. Afforestation also significantly increased the lignin-derived phenol content in the surface soil layer (0–10 cm). However, no obvious change was observed in the lignin-derived phenols of the two adjacent croplands. These results indicate that the accumulation of aboveground litter and underground roots has the strongest effects on the lignin-derived phenol content. In contrast to cropland, the two plantations exhibited a high degree of degradation of lignin-derived phenols in the surface soil, but this remained almost unchanged over time. Moreover, in contrast to 20 years after the establishment of the R. pseudoacacia plantation, the low alkyl/O-alkyl carbon ratio of the 8-year R. pseudoacacia plantation indicated that more easily degradable components accumulated during the initial stage of afforestation. Therefore, the proportion of the unstable carbon pool was relatively high and the SOM content may decline in the early stage of afforestation. These results provide evidence illustrating the detailed changes in the chemical composition of SOM during the ecological restoration process.

1. Introduction

Soil organic matter (SOM) forms the largest organic carbon pool in terrestrial ecosystems [1] and has a fundamental role in ecosystem processes by regulating global biogeochemical cycles, plant and microbial growth, and soil function [2,3]. Changes in SOM content have a significant impact not only on soil nutrients and plant growth but also on the concentration of greenhouse gases in the Earth’s atmosphere [4]. The decomposition and sequestration of organic carbon in forest soil is influenced by climate change, the soil type, land management practices, tree species, and their interactions [5]. The most important cause of the loss of SOM is changes in land use patterns and management [6,7]. The accumulation and decomposition of SOM depend not only on the change in inputs but also on the molecular composition of SOM [8]. Understanding the molecular composition of SOM is necessary to clarify the mechanisms involved in changes in SOM, which forms a complex mixture composed of various types of substances [9].
Biomarkers provide important information regarding the sources, preservation, and structural modifications of SOM during environmental changes [10,11]. The biomarkers in soil, mainly free lipids, carbohydrates, and lignin-derived phenols, can be quantified via solvent extraction and copper (II) oxide (CuO) oxidation [10]. In addition, proxies such as the average chain length (ACL), acyclic/cyclic ratio, and ratios of cinnamyls to vanillyls (C/V) and syringyls to vanillyls (S/V) can be used to indicate the source and degradation of SOM [12]. Some previous studies have analyzed the sources of organic matter and attempted to explain the changes in organic matter at the molecular level [13,14]. For instance, Pisani et al. (2013) reported that pine soil had a relatively high value for the acyclic/cyclic ratio in Nebraska, USA [10]. Schäfer et al. (2016) observed that the odd-over-even predominance (OEP) of n-alkanes significantly decreased with soil depth in deciduous forest soil [15]. However, studies and data concerning changes in the molecular composition of SOM during land use conversion are scarce. It is important to study the transformation and preservation of lipids and lignin-derived phenols during the land use conversion process.
Nuclear magnetic resonance (NMR) can be used to determine the chemical composition of a diverse range of decomposing SOM [16]. The carbon contained in different chemical structures can be differentiated based on the chemical shift values [16]. The signal intensities associated with the 0–50 ppm, 50–110 ppm, 110–165 ppm, and 165–215 ppm regions have typically been assigned to alkyl carbon, O-alkyl carbon, aromatic and phenolic carbon, and carboxyl and carbonyl carbon structures, respectively [17,18]. However, NMR can only be used to evaluate the composition of carbon functional groups and is limited in distinguishing the content of individual substances and providing the chemical composition of SOM [19]. Thus, biomarker methods used in tandem with NMR can provide complementary and detailed information to understand the composition and characteristics of SOM at the molecular level.
The Loess Plateau of China is a region that has experienced some of the most severe soil erosion in the world. In 1999, an ecological project known as “Grain for Green” was initiated to control soil erosion in the Loess Plateau region [20,21]. As part of this project, extensive croplands were converted into Robinia pseudoacacia plantations. Previous studies have shown that the “Grain for Green” project significantly changed the concentration and stock of SOM in the Loess Plateau [20,21]. However, detailed information on the composition and decomposition of SOM during land use conversion is still lacking. The objective of this study was to evaluate changes in the molecular composition of SOM during land use conversion by applying both the biomarker and NMR spectroscopy methods. The composition and decomposition of SOM were obtained and analyzed, providing new information that can help researchers to understand the relationship between land use conversion and SOM at the molecular level.

2. Materials and Methods

2.1. Site Description

The study site is located in Gaojiazhuang Village, Fu County, Shaanxi Province, on the central Loess Plateau of China (36°3′41″ N, 109°18′59″ E), where the “Grain for Green” project was implemented. This site features a continental warm temperate monsoon climate. The annual average precipitation is 550.3 mm and the annual average temperature is 9.8 °C. The elevation of this region is 990 m above sea level, and the frost-free period is 175 days. The soil type in the study area is Calcic Cambisol (FAO-UNESCO soil classification system).
To quantify the changes in soil nutrients and the molecular composition of SOM following the afforestation of agricultural land, two R. pseudoacacia plantations (5 km apart) that were established on former cropland either 8 or 20 years ago (as of 2019; hereafter R8 and R20, respectively) were investigated. Meanwhile, two croplands (hereafter R8-CR and R20-CR, respectively) that were next to the R8 and R20 plantations were also sampled for comparison. These two sites had similar soil characteristics before afforestation and a relatively uniform soil profile in terms of texture and structure. The two R. pseudoacacia plantations were planted on previous cropland sites in different periods; no other further anthropogenic disturbances occurred after planting.
In each land use study site, three 300 m2 plots were randomly selected and three 9 m2 subplots were established within each plot. Field survey results of the four treatments are shown in Table 1. In the two croplands, the soil was tilled to a depth of approximately 20 cm before planting. Fertilizer with 162 kg ha−1 N, 90 kg ha−1 P2O5, and 162 kg ha−1 K2O per year was applied in accordance with the traditional practices of local farmers. At harvest, most of the straw was removed, and only a small amount of straw was plowed into the soil. The management practices were identical in the two croplands. During the sampling period, no obvious weeds were observed on the cropland surface.

2.2. Sample Collection

All samples were collected in April 2019. Soil samples were collected using a hand auger (5 cm diameter) at two depths: 0–10 cm and 10–20 cm. In each plot, nine soil cores were collected from three subplots and homogenized to represent a composite sample according to its layers. After collection, the soil samples were returned to the laboratory, where impurities were removed. Then, the soil samples were passed through a 2 mm sieve and divided into three parts, with one used immediately to measure the soil microbial biomass carbon, one air-dried to measure the soil organic carbon (SOC), and one freeze-dried to later measure the molecular composition of SOM.

2.3. Soil Organic Matter Biomarker Extraction and Analysis

Soil microbial biomass carbon (MBC) was determined using the chloroform fumigation–extraction method [22], while organic carbon was measured by the K2Cr2O7-H2SO4 oxidation method [23].
In the biomarker measurements, free lipids and lignin-derived phenols in freeze-dried soil were isolated by solvent extraction and CuO oxidation [10,14]. Dichloromethane (DCM), methanol (MeOH), and DCM:MeOH (1:1 v/v) were used for solvent extraction. Specifically, 5 g soil was mixed with 30 mL DCM, which was sonicated for 15 min, followed by the addition of 30 mL DCM:MeOH (1:1 v/v) and 30 mL methanol (MeOH) in sequence. The air-dried soil residue after solvent extraction was oxidized with copper oxide (CuO). A 250 mg subsample was mixed with 1 g CuO, 100 mg ammonium iron (II) sulfate hexahydrate [Fe(NH4)2(SO4)2·6H2O], and 15 mL of 2 mol·L−1 NaOH in a Teflon vessel. Then, the solvent extraction products and CuO oxidation products were converted to trimethylsilyl (TMS) derivatives. All derivatives were analyzed via gas chromatography–mass spectrometry (Agilent Technologies, Palo Alto, CA, USA). The data were acquired by Agilent Mass Hunter GC–MS Acquisition (version B.07.03.2129) and processed via the Agilent Enhanced ChemStation software (version E.02.02.1431). The process of identifying compounds was completed by comparing the mass spectra with the Wiley Registry (9th edition) plus NIST (2008) mass spectral databases, public mass spectra, and a spectral library of soil compounds.

2.4. Solid-State Nuclear Magnetic Resonance Analysis

Before NMR analysis, a 20 g soil mixture of the same treatment was placed into a polyethylene bottle, and 100 mL of 10% hydrofluoric acid was added to remove minerals and magnetic impurities in the soil [24]. The polyethylene bottles were shaken for 30 min per day. In addition, fresh 10% hydrofluoric acid was used to replace this acid every three days for 45 days. Finally, the soil samples were cleaned with deionized water to a pH near neutral to remove hydrofluoric acid and then freeze-dried [24].
The structure and composition of SOM were determined by a Bruker Avance III 400 MHz nuclear magnetic resonance spectrometer (Bruker BioSpin AG, Fällanden, Switzerland) using the cross-polarization magic angle spin technique. The selected standard substance was trimethylsilane with a chemical shift of 0 ppm. During the operation, the NMR instrument rotated at 5000 Hz, and each soil sample was scanned 1024 times. In the spectra, different functional groups corresponded to the following chemical shift regions: alkyl carbon (0–50 ppm), O-alkyl carbon (50–110 ppm), aromatic and phenolic carbon (110–165 ppm), and carboxyl and carbonyl carbon (165–215 ppm). Finally, we used the Mestrenova 14.0 software to calculate the relative concentrations of different functional groups based on the percentage of the peak area to the total area.

2.5. Biomarker Parameters and Calculations

In this study, the SOC stocks were calculated according to the equivalent soil mass method [25]:
M i = B D i × Z i × 100 ,
SOC i , fixed = Con i × M i × 0.1 ,  
M i , ex = M i M i , equiv ,
  SOC i , equiv = SOC i , fixed ( Con bottom × M i , ex ) / 1000 ,  
where Mi is the dry soil mass (Mg·ha−1), BDi represents the bulk density of the soil at each depth (g·cm−3), Zi represents the thickness of the soil at each depth (cm), Coni represents the SOC concentration in each layer (g·kg−1), Mi,equiv represents the selected equivalent soil mass and is equal to the smallest value of Mi at the same depth, and Conbottom refers to the SOC concentration in the deepest layer.
Otto et al. (2005) proposed to divide the solvent extraction products into plant- and microbial-derived products [14]. The plant-derived solvent extracts included steroids and long-chain n-alkanes, n-alkanols, and n-alkanoic acid (≥C20), while microbial-derived solvent extracts included trehalose and short-chain n-alkanes, n-alkanols, and n-alkanoic acid (<C20). The proxies that could be used to indicate the degradation of free lipids [26] were calculated.
The formulas of the average chain length (ACL) of n-alkanes and n-alkanoic acids, as well as the odd-over-even predominance (OEP) of n-alkanes and even-over-odd predominance (EOP) of n-alkanoic acid, are as follows:
ACL = i n n × C n i n C n ,
OEP = C 23 + C 27 + C 29 + C 31 + C 33 C 18 + C 20 + C 24 + C 26 ,  
EOP = C 12 + C 14 + C 16 + C 18 + C 20 + C 22 + C 24 + C 26 + C 28 C 15 + C 23 + C 27 ,
where n is the number of carbon atoms, and Cn is the concentration of the n-alkanes or n-alkanoic acids with n carbon atoms [15,27].
S/L represents the ratio of short- (<C20) to long-chain (≥C20) n-alkanoic acids, where the ratio of acyclic/cyclic (RAL) represents the ratio of acyclic aliphatic lipids to cyclic lipids, and the formula is shown below [13]:
RAL =   C n a l k a n e s +   C n a l k a n o l s +   C n a l k a n o i c   a c i d s   C s t e r o i d s ,
For the lignin-derived phenols, S/V and C/V represent the ratios of syringyls to vanillyls and cinnamyls to vanillyls, respectively. The ratios of lignin-derived phenolic acids and their corresponding aldehydes (Ad/Al) indicate the level of lignin oxidation. The ratio of syringic acid to syringaldehyde is represented by (Ad/Al)s, and the ratio of vanillic acid to vanillin is represented by (Ad/Al)v [12].

2.6. Statistical Analyses

A two-way analysis of variance (ANOVA) was conducted to test the effect of the interaction between the soil depth and treatment on the SOM molecular composition (free lipids and lignin-derived phenols) using the SPSS 19.0 software. All analyses were performed with a significance level of p = 0.05.

3. Results

3.1. MBC and SOC Concentrations under Four Treatments

The results showed that the MBC in R8-CR was significantly larger than that in R8. During afforestation, the MBC content initially decreased, but then it returned to the original MBC content level of the cropland at R20 (Table 2). Compared with croplands, the SOC content and stocks generally increased after afforestation and increased with the extension of the restoration time (Table 3).

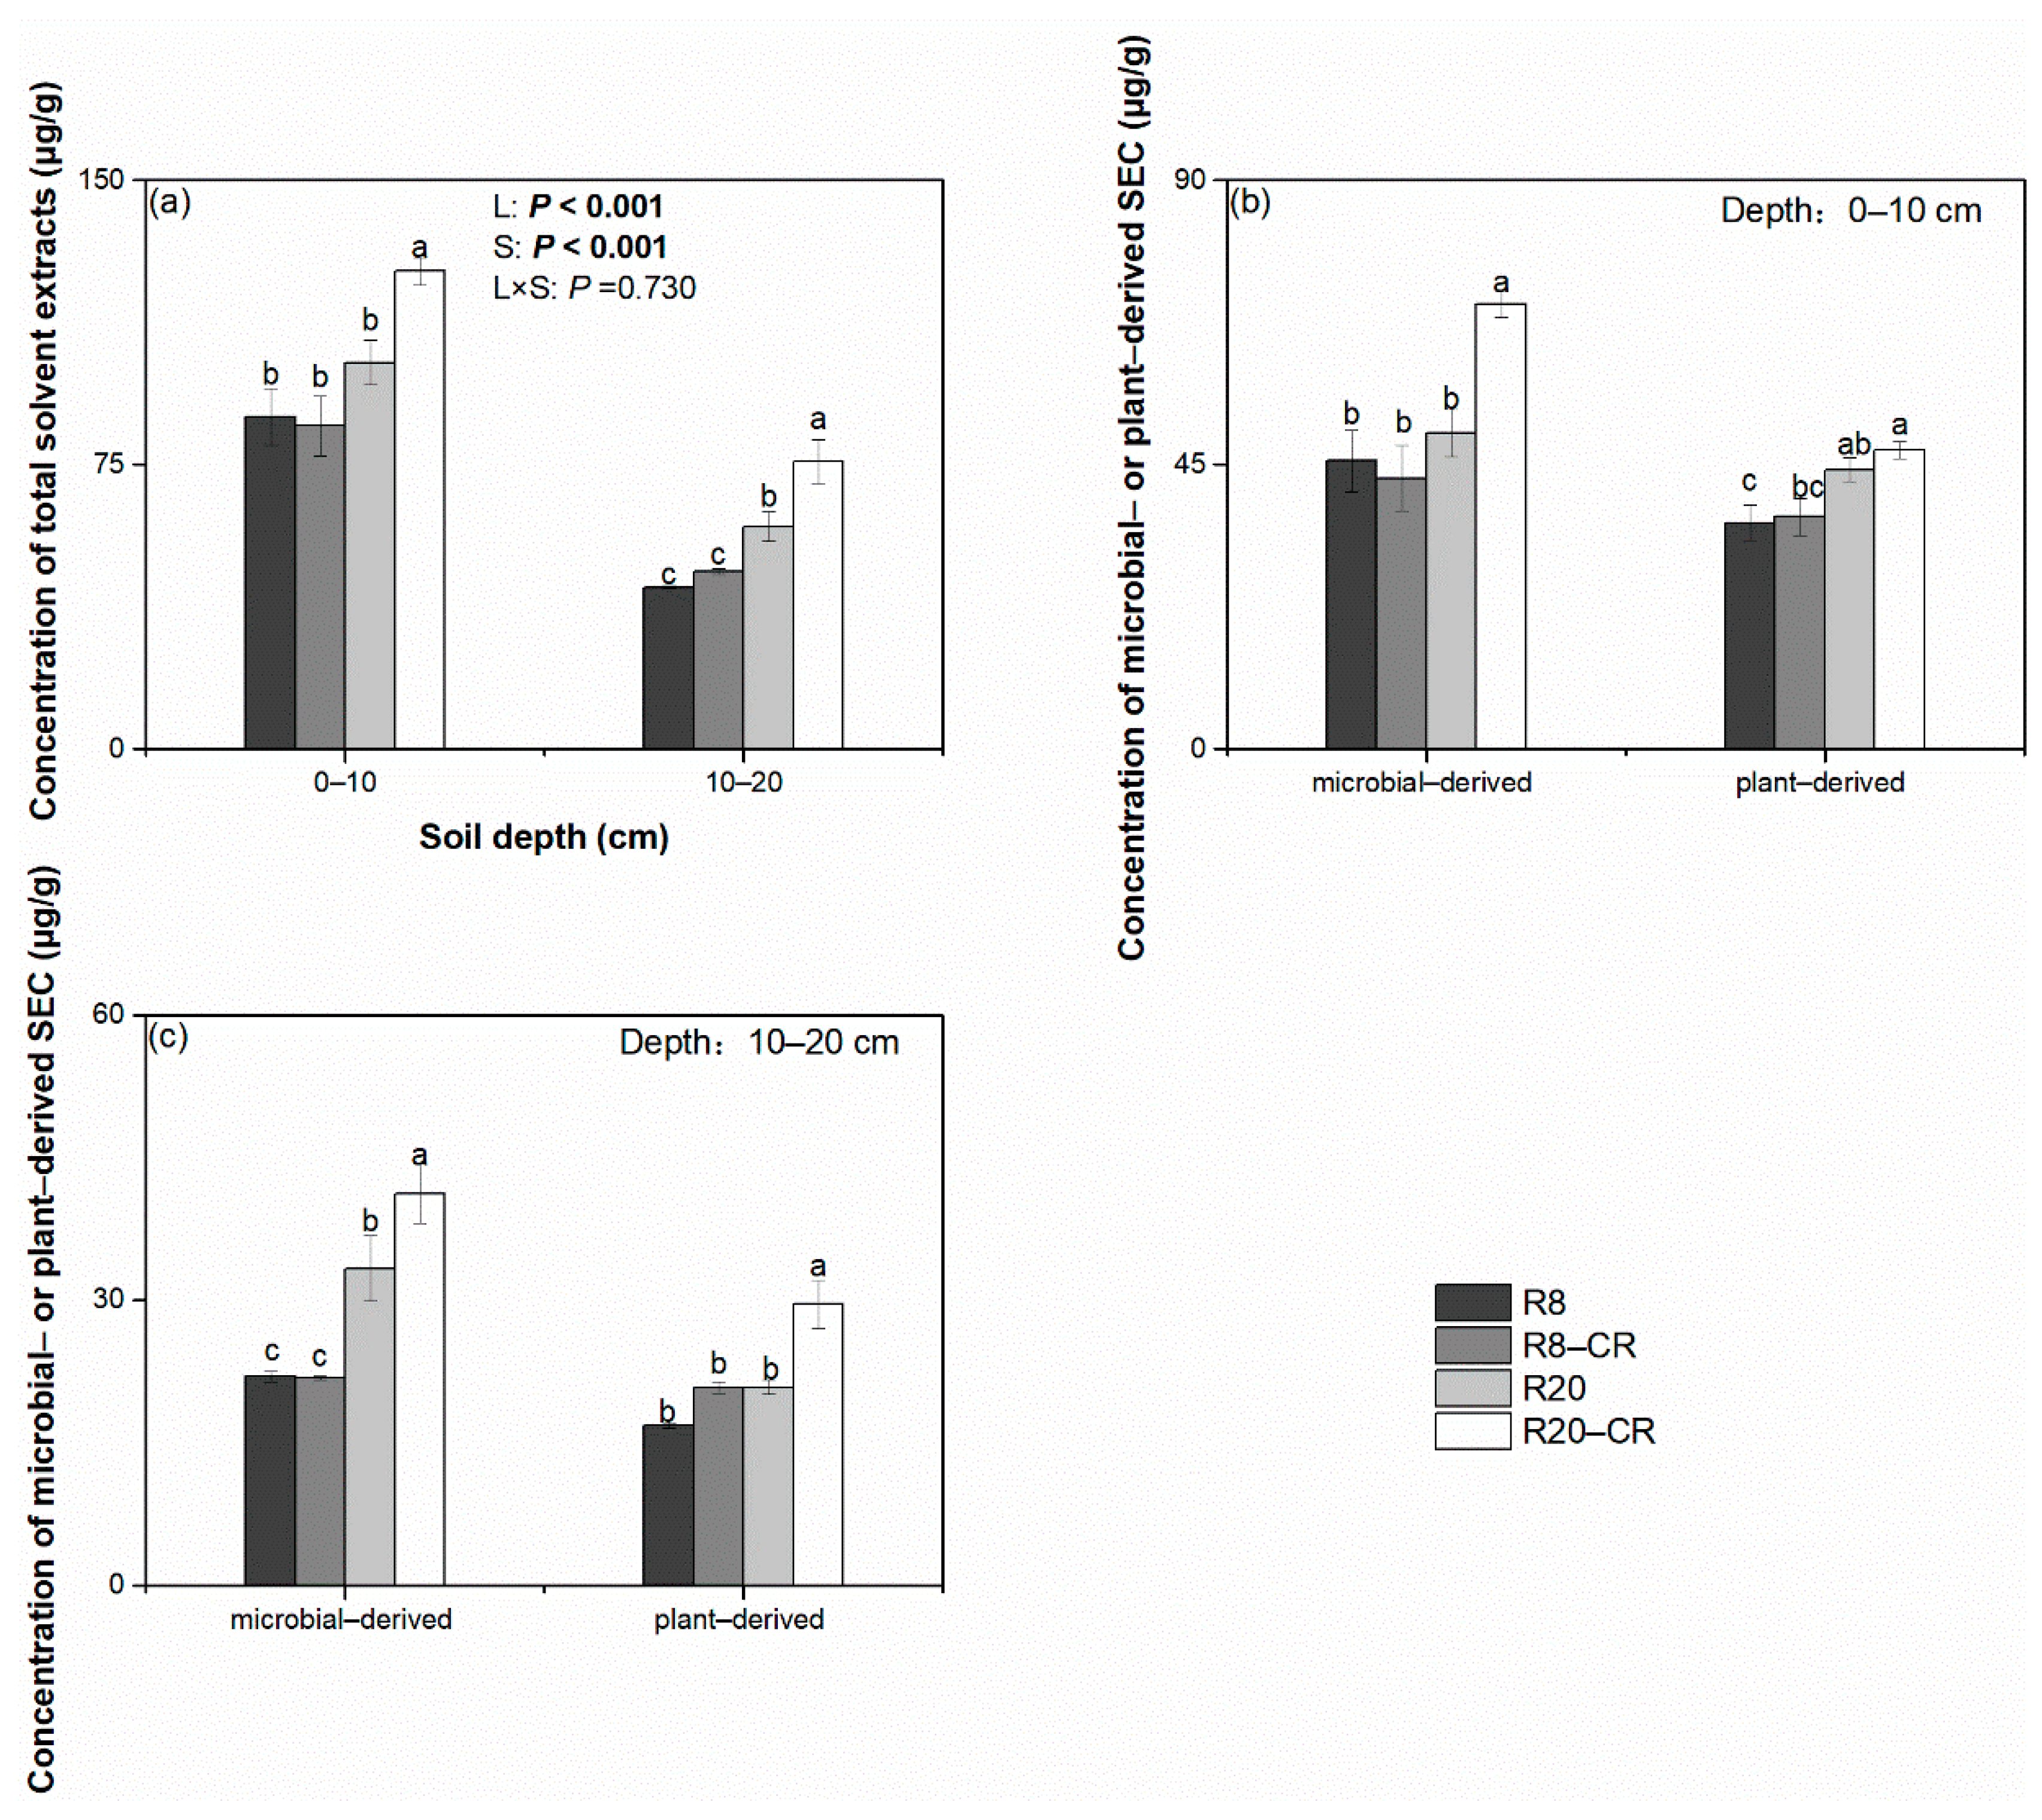
3.2. Solvent-Extractable Compounds under Four Treatments

Almost all of the solvent-extractable compounds (SEC) in shallow soil were present in larger amounts than in deeper soil among the four land use sites (Table 4). At R8, the content of total SEC did not change significantly when compared with that of the adjacent cropland (Figure 1a). Slightly larger amounts of SECs were observed in R20 than in R8, but this difference was insignificant in the surface layer. Moreover, SEC in R20-CR were present in significantly larger amounts than in R20 (Figure 1a). This result suggests that soil may require a relatively long time to exhibit a significant change in total SEC after afforestation. The plant- and microbial-derived SEC varied in different land use patterns (Figure 1b,c). All land use patterns had relatively lower plant-derived SEC concentrations than microbial-derived SEC concentrations.
Moreover, some parameters that can be used to illustrate the degradation of free lipids were calculated (Figure 2). No significant difference in the S/L values was observed between the R8 and R8-CR treatments across the 0–20 cm profile. However, in the measured S/L values between R20 and R20-CR at the two soil depths, the S/L value had decreased after 20 years of afforestation. In contrast to S/L, larger RAL values occurred at a depth of 10–20 cm than at 0–10 cm among the four treatments. At a depth of 0–10 cm, the RAL value of R20 was low when compared with that of R20-CR; however, no significant difference was found in RAL values between the R8 and R8-CR treatments. Moreover, the calculation results showed that R8 and R20 had lower ACLal, OEP, and EOP values at the 0–10 cm soil depth than at 10–20 cm (Figure 2). In the 0–20 cm soil profile, at the initial stage of afforestation, R. pseudoacacia plantations had a larger EOP than the adjacent cropland, but after 20 years, this trend had reversed.

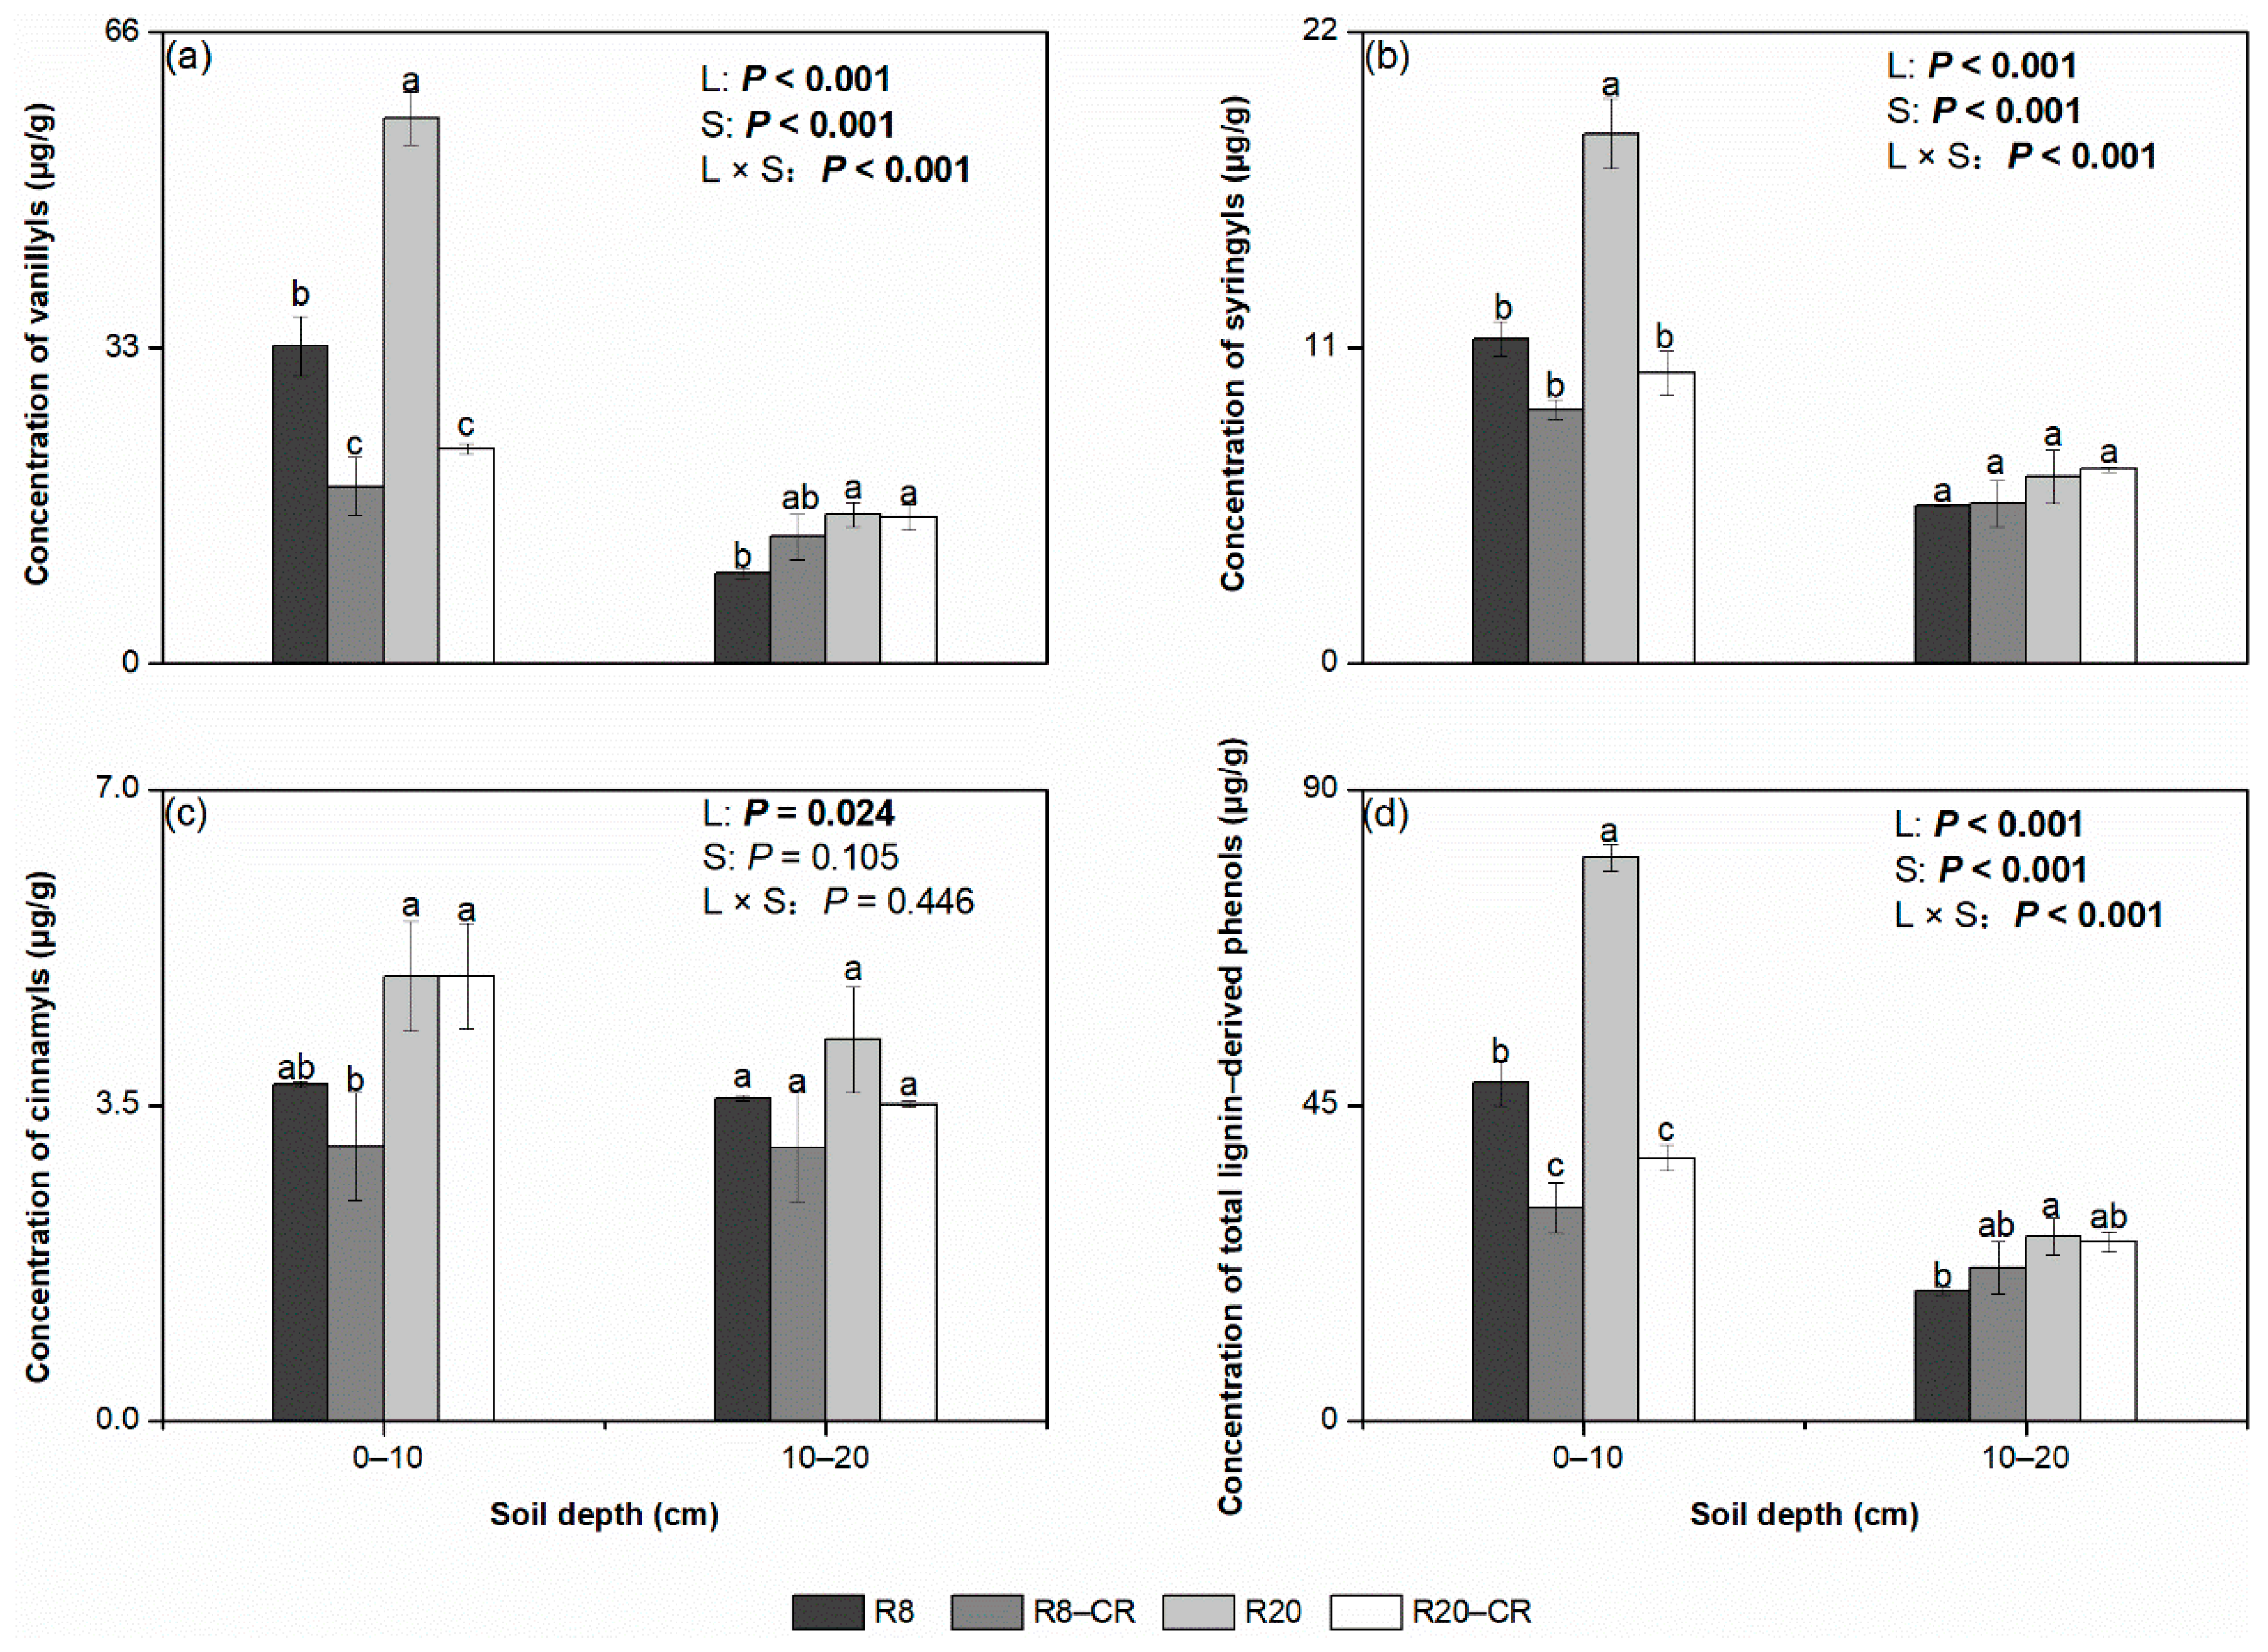
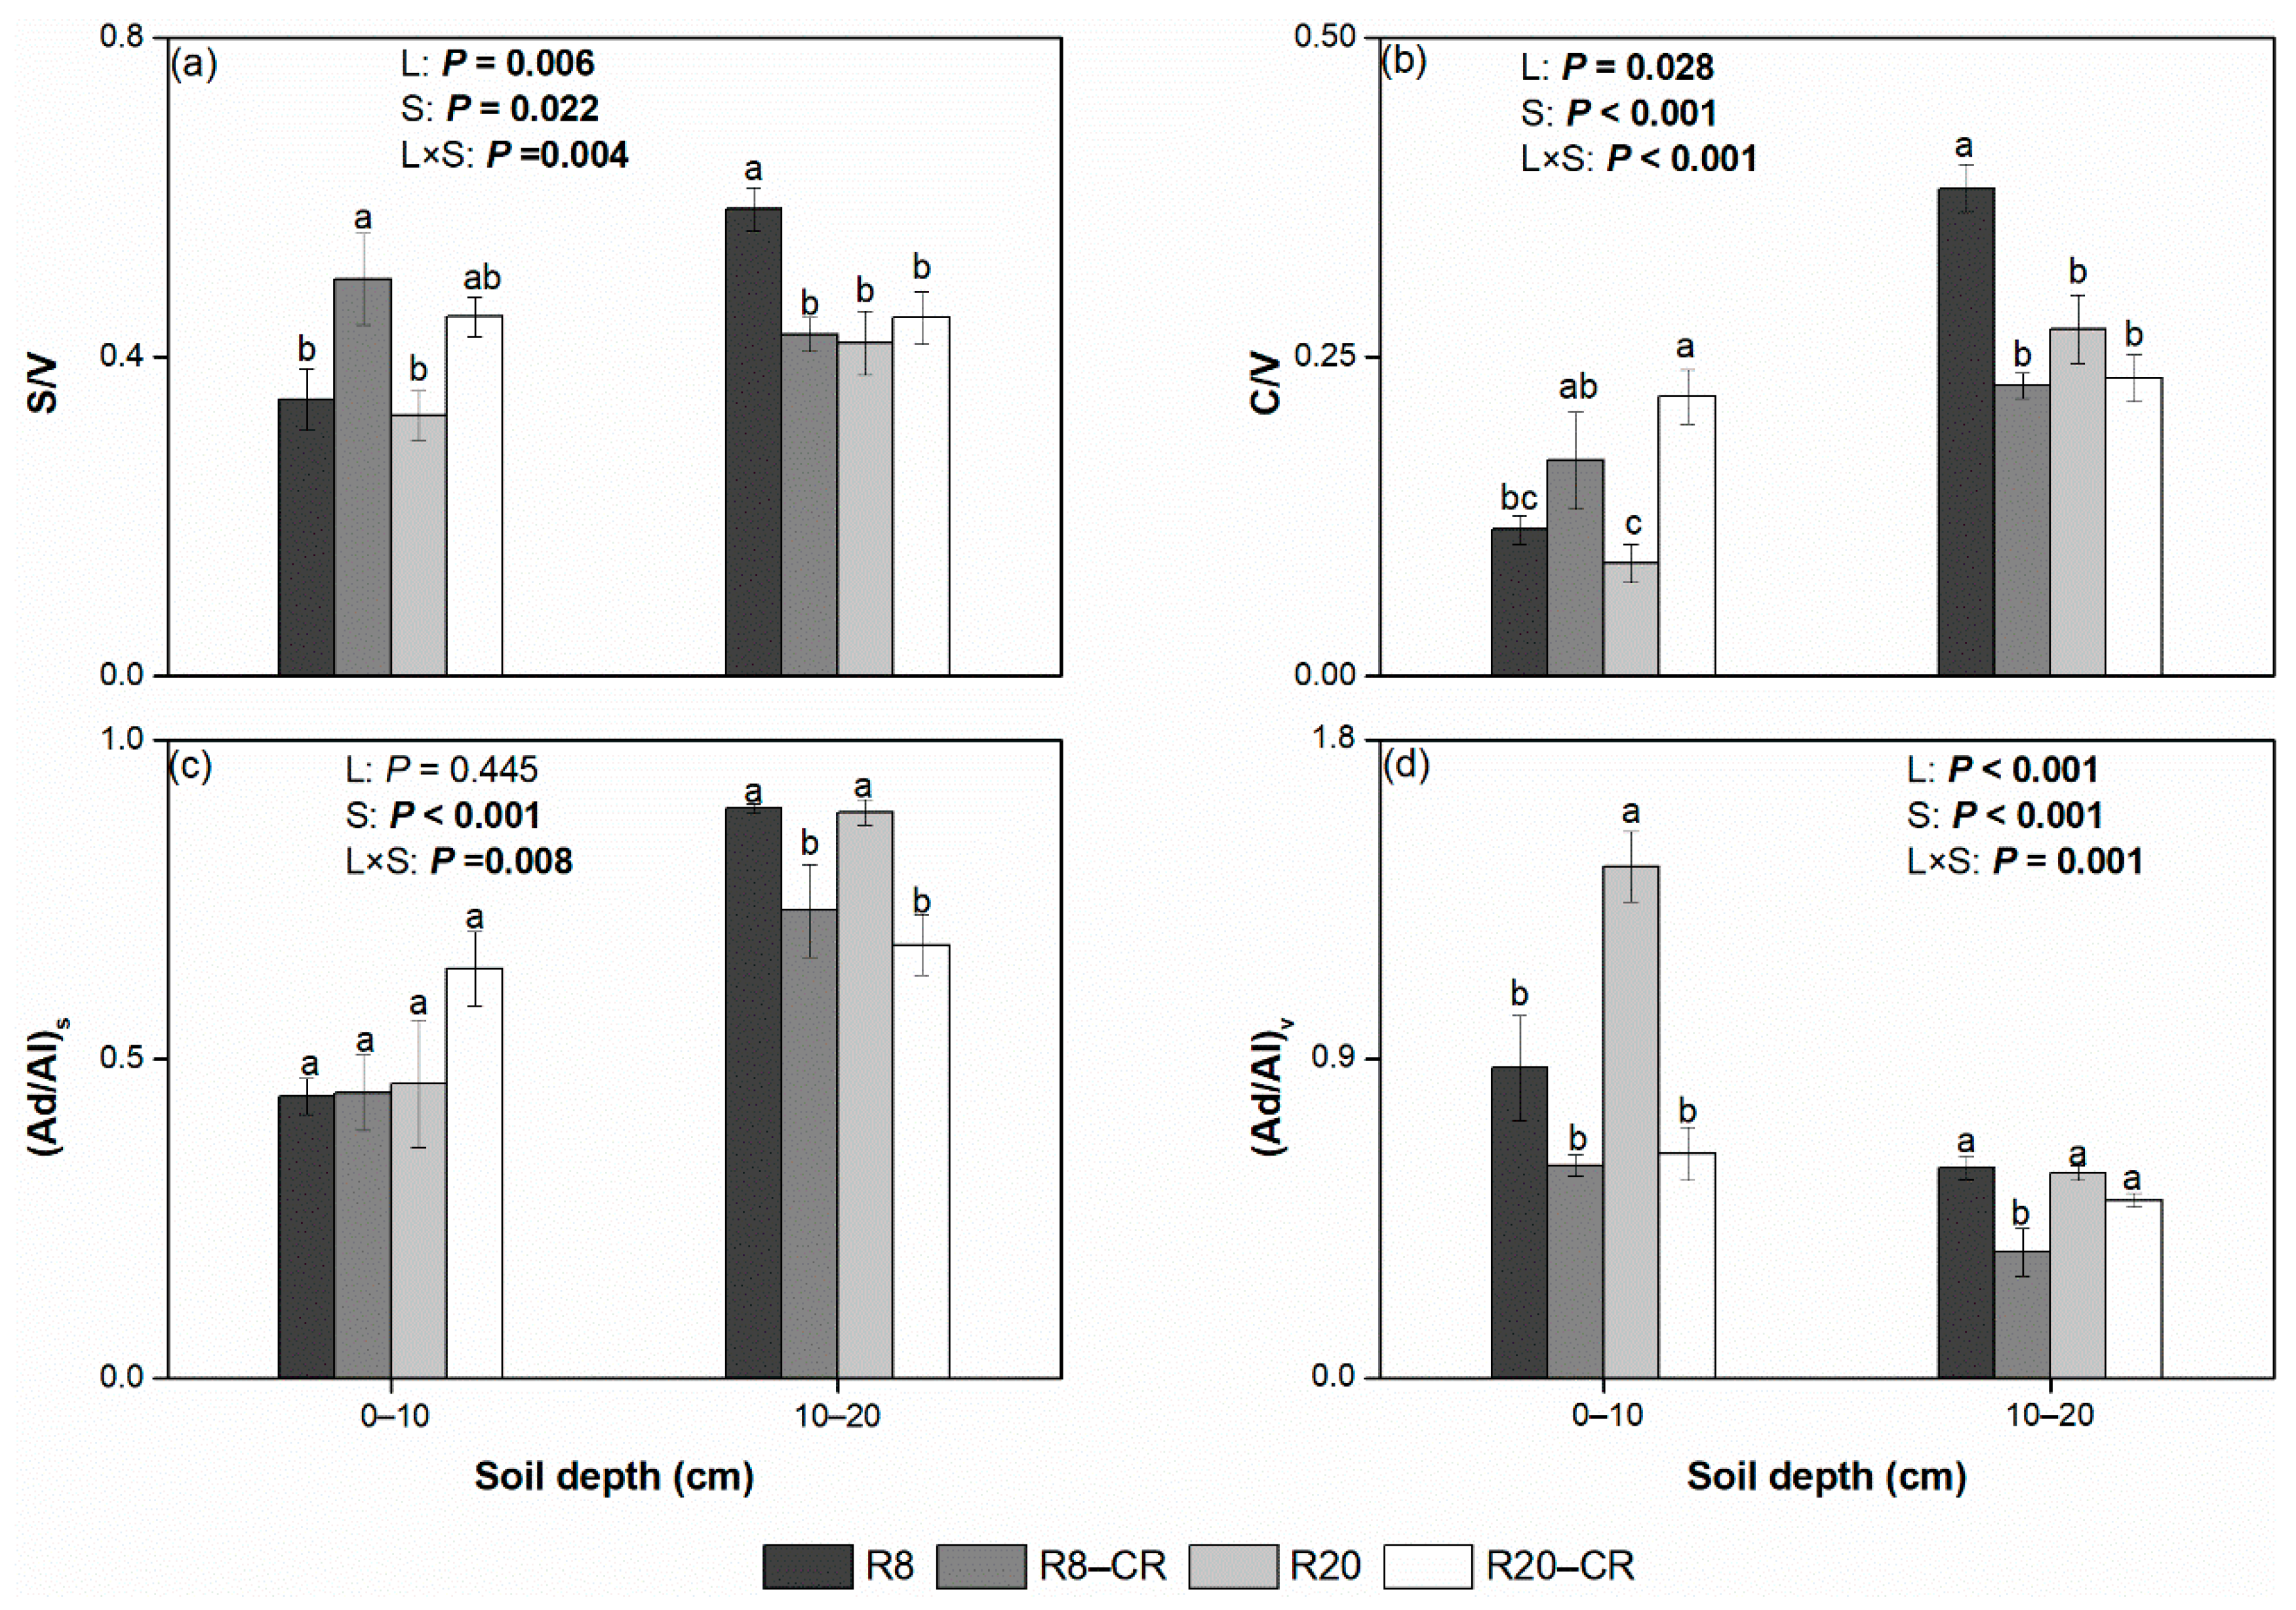
3.3. Lignin-Derived Phenols under Four Treatments

The concentrations of lignin-derived phenols generally increased after the cropland was converted into R. pseudoacacia plantations, while the concentrations of syringyls and vanillyls increased more substantially than the concentration of cinnamyls (Figure 3). With the extension of the restoration time, the concentrations of total lignin-derived phenols increased.
Several indexes were used to indicate the degree of degradation of lignin-derived phenols (Figure 4). At the 0–10 cm depth, no significant differences in the C/V and S/V values were observed between R8 and R20. At depths of 10–20 cm, however, the C/V and S/V values of R20 were significantly lower than those of R8. Moreover, the calculated (Ad/Al)s at the 0–10 cm depth in all four treatments was consistently lower than that at 10–20 cm. In contrast, the result for the (Ad/Al)v of the surface soil was observed to be larger at shallow than at deeper depths.

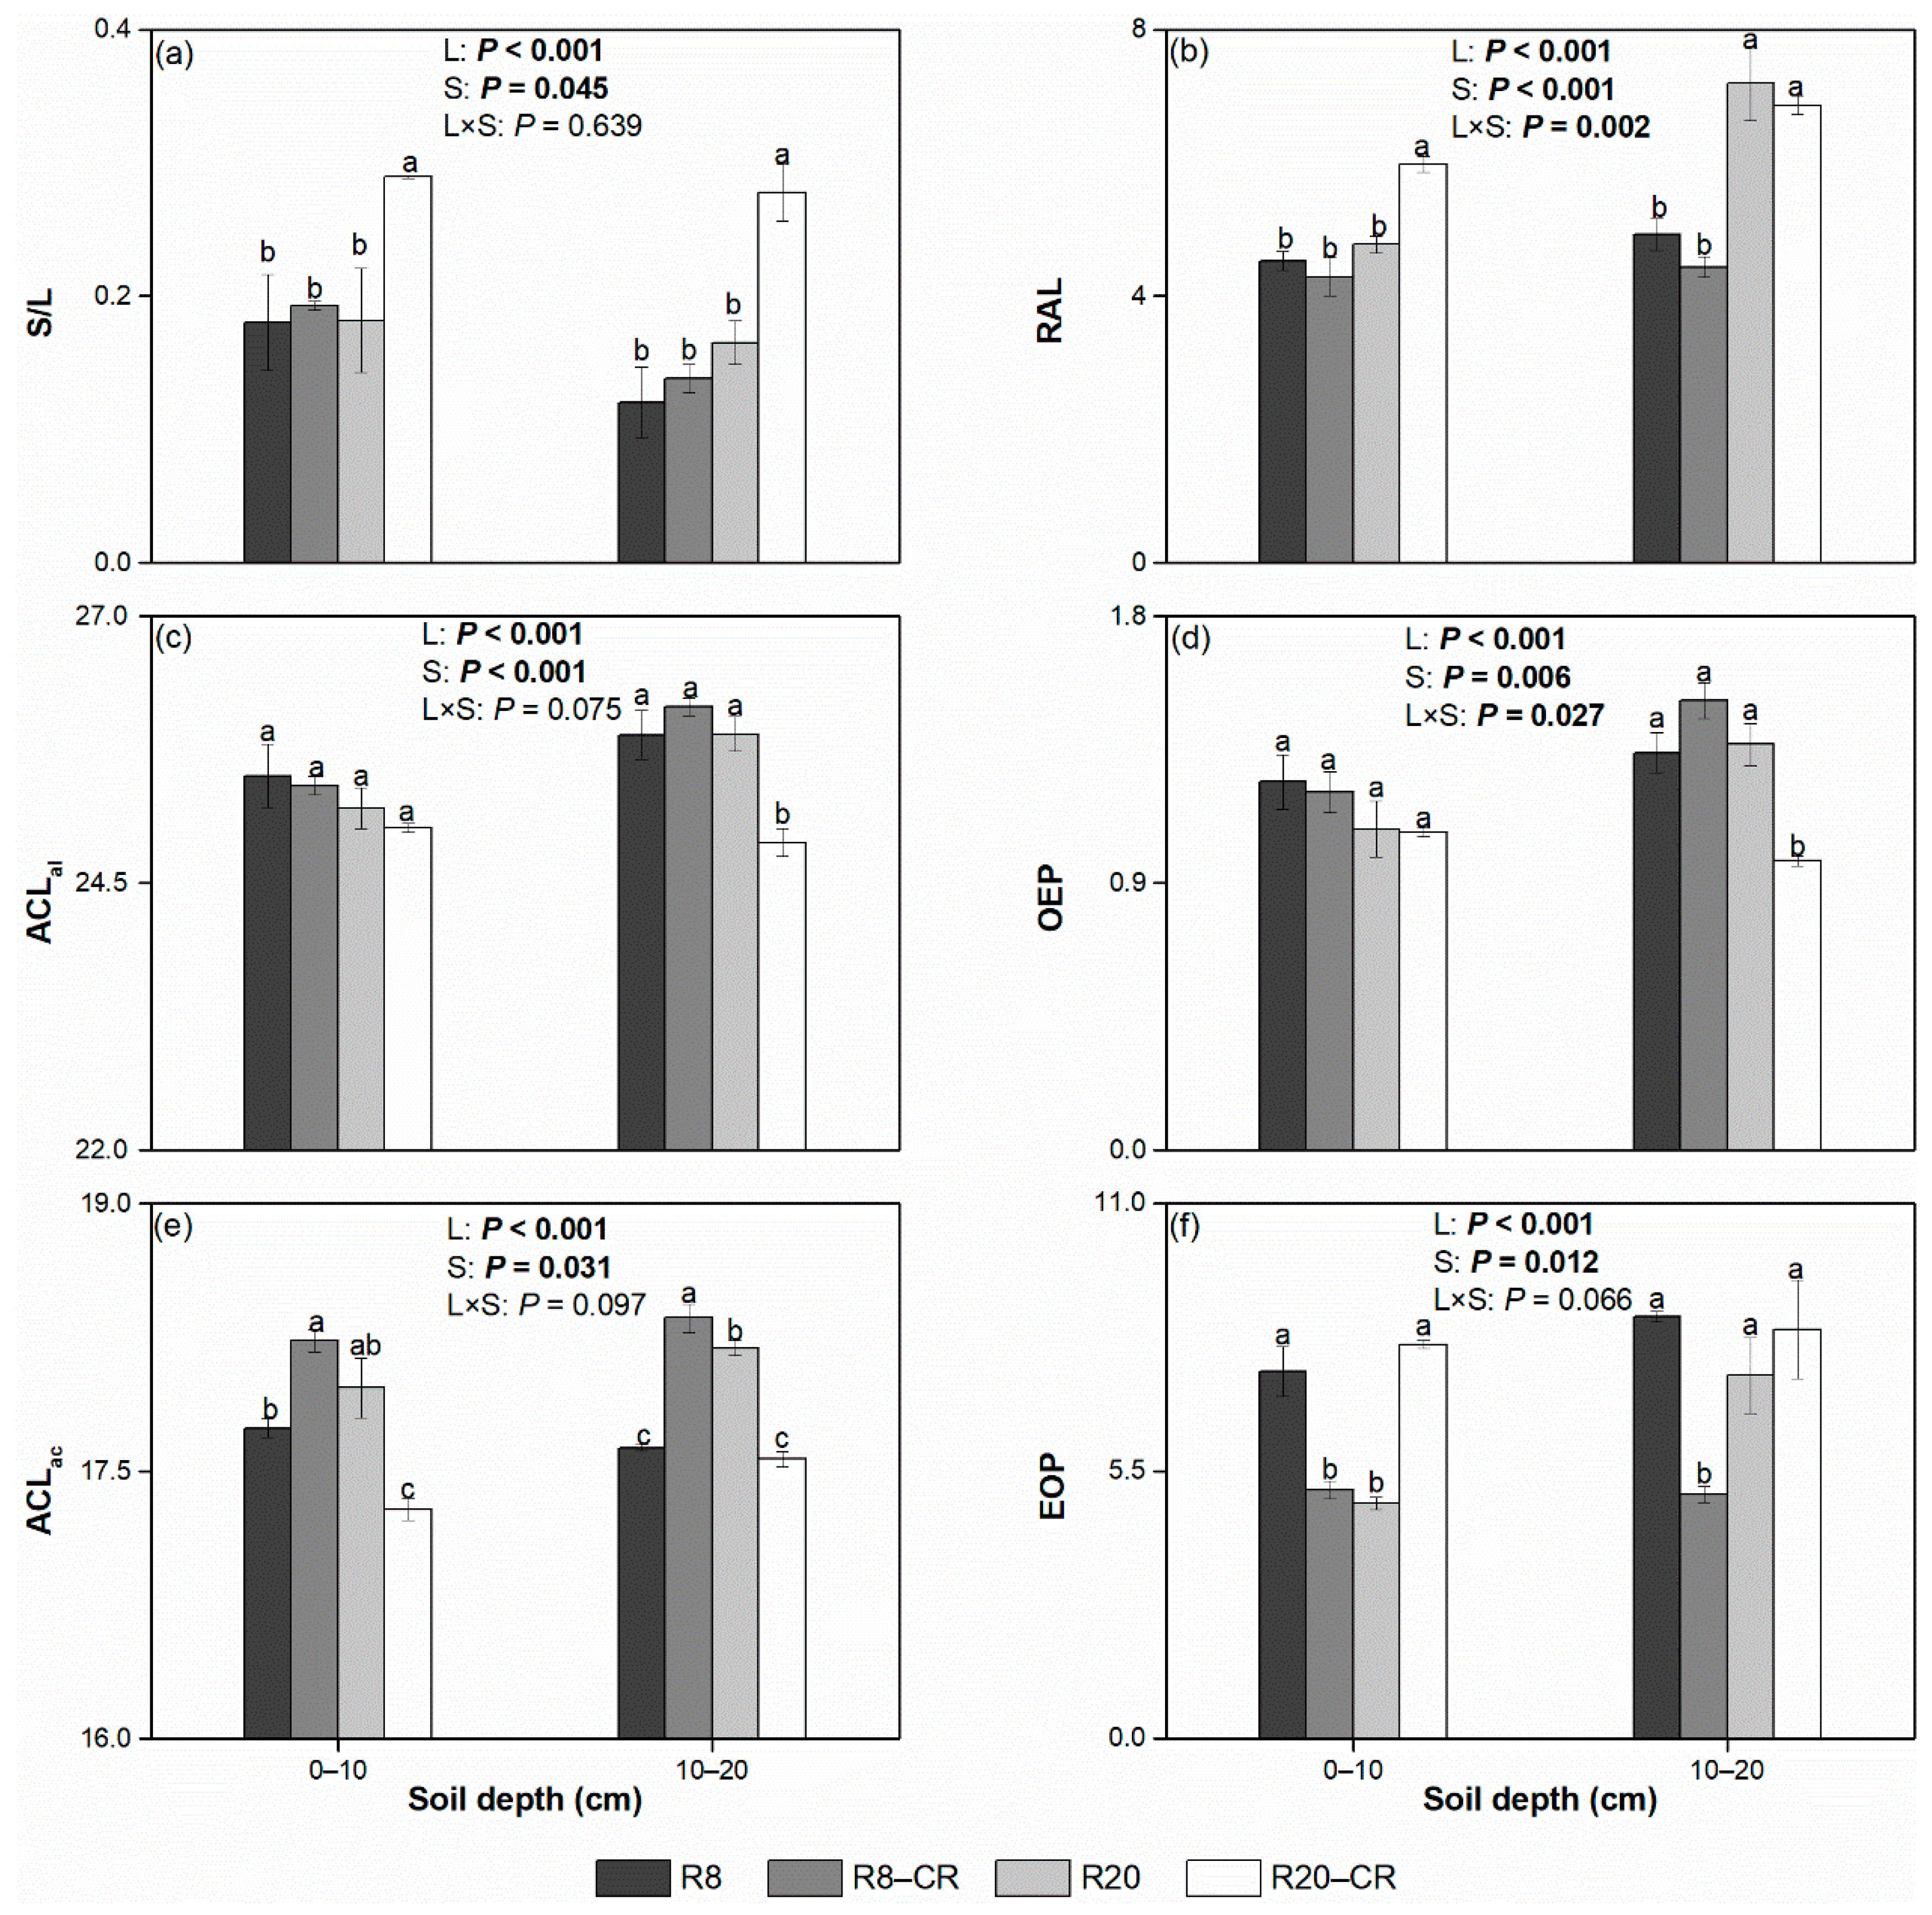
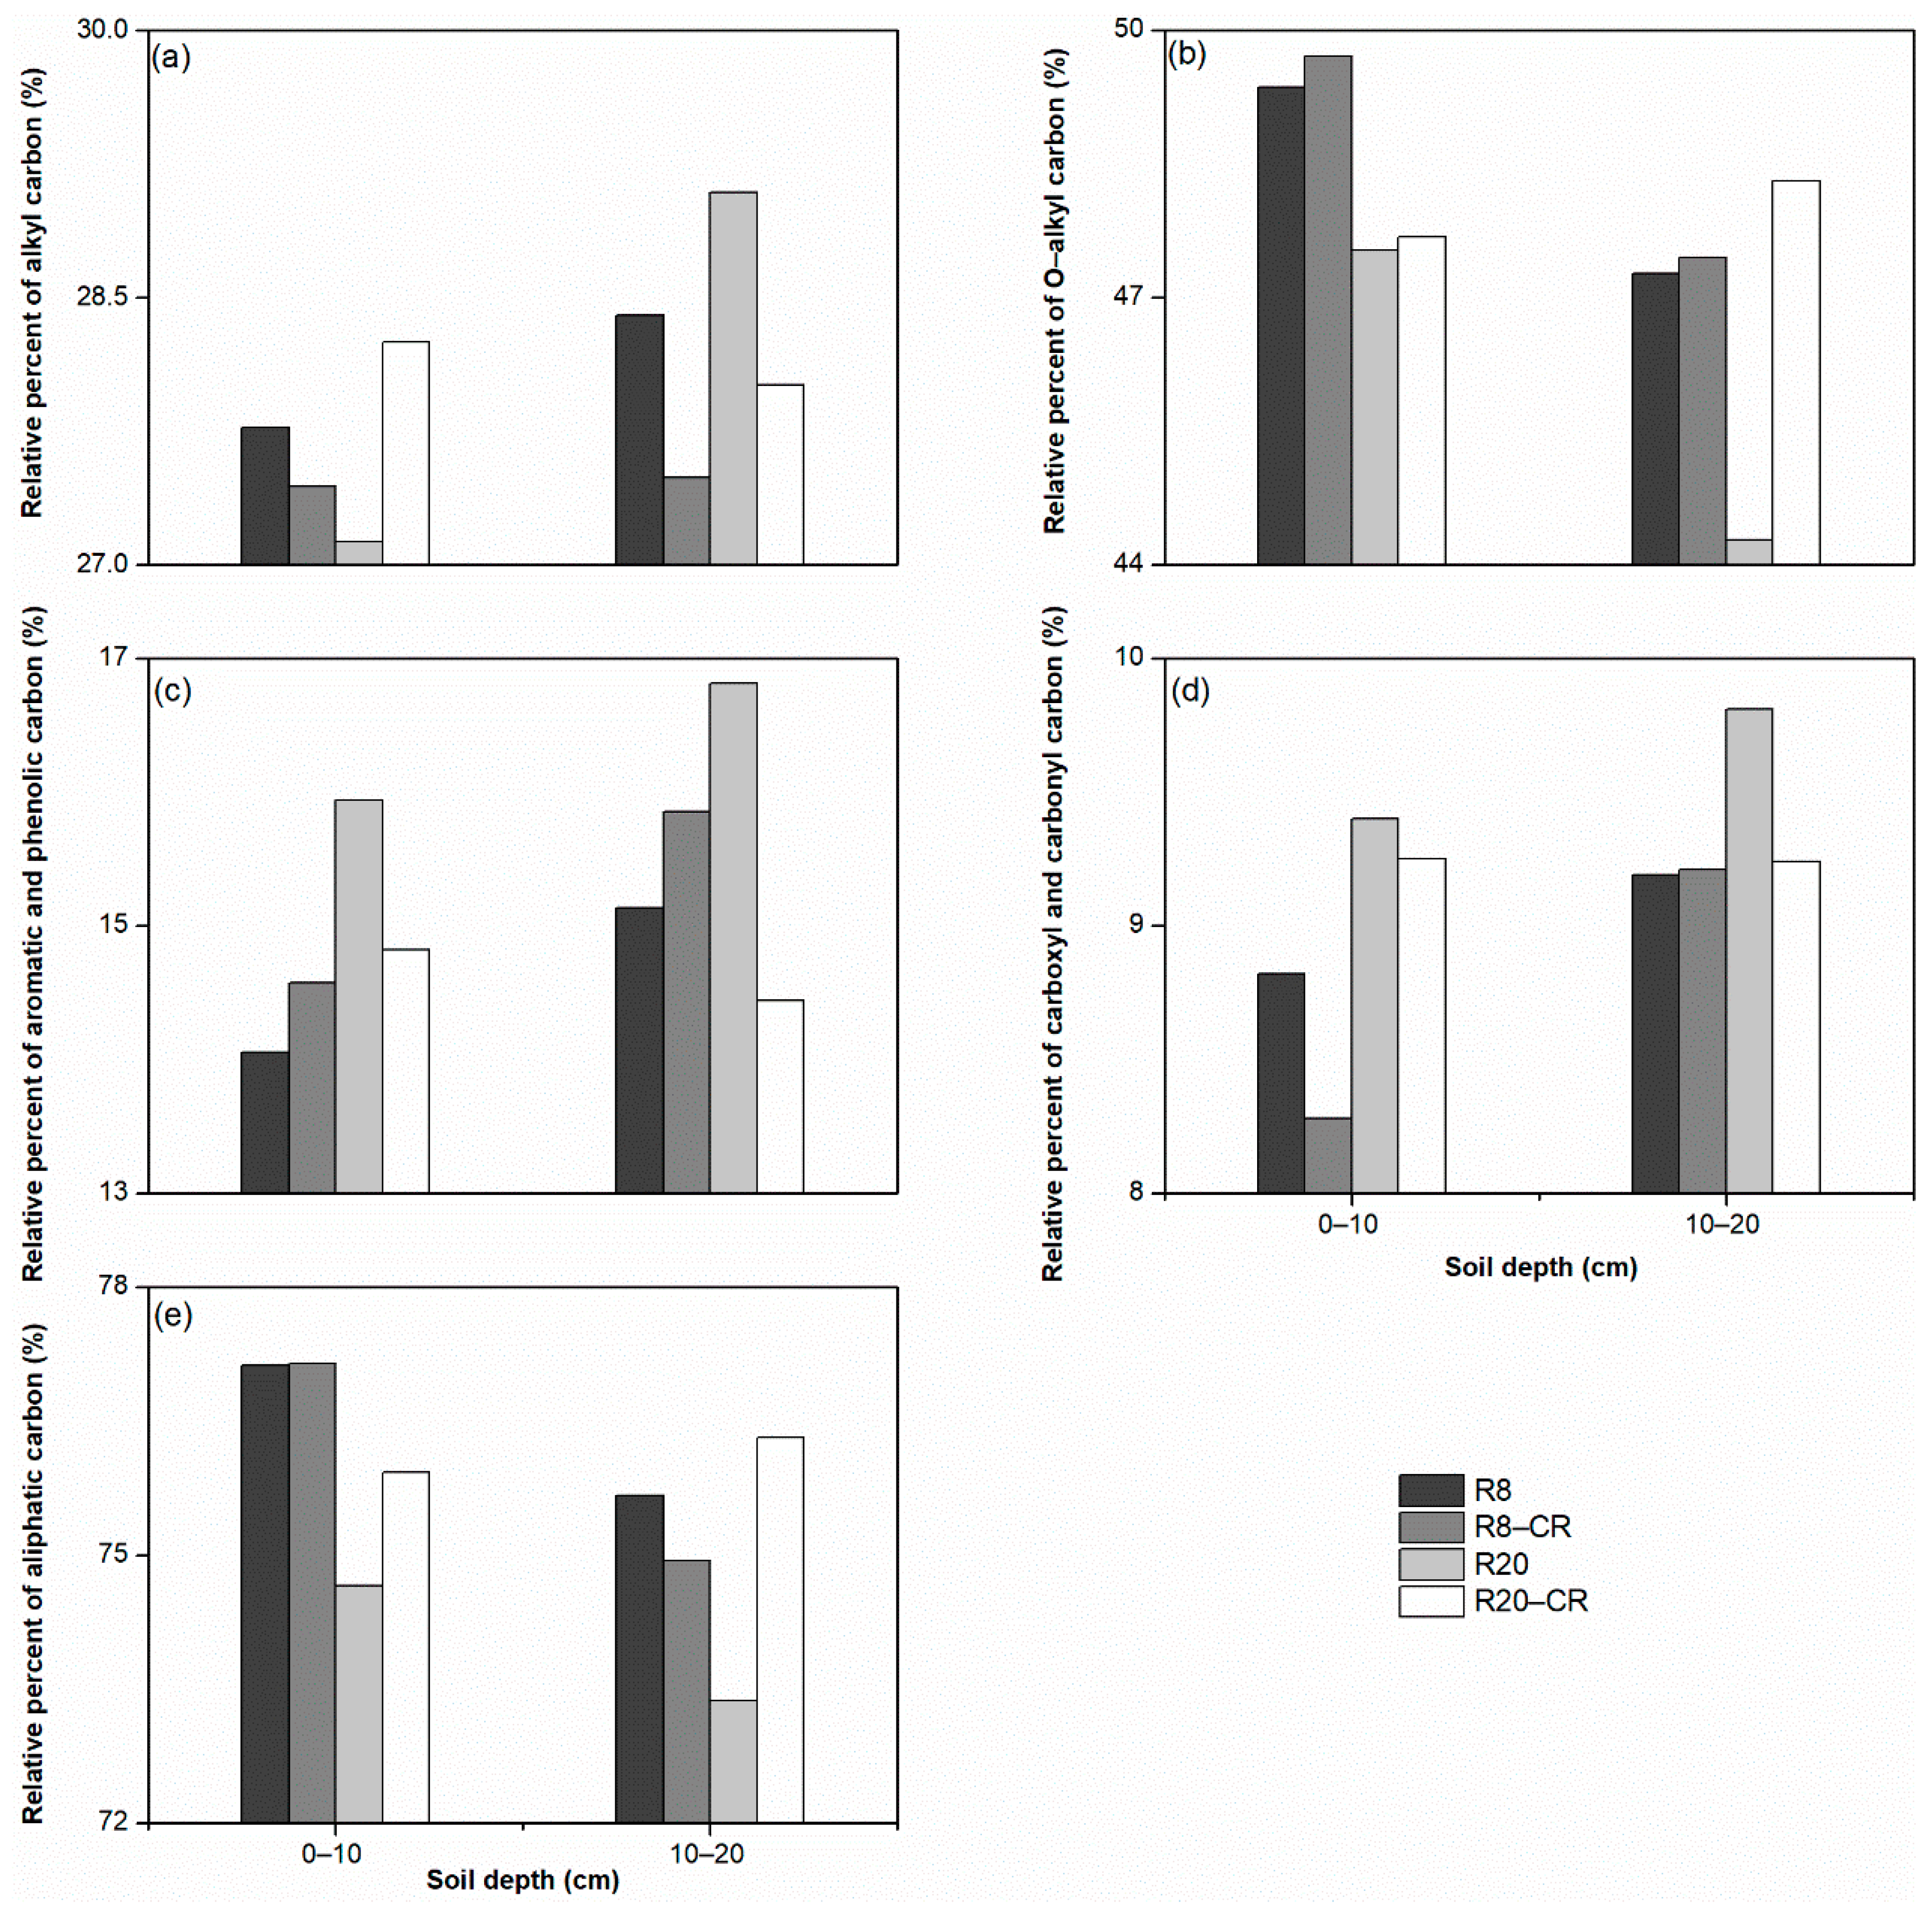
3.4. Chemical Composition of SOM Measured by NMR

Signal peaks of the four main carbon types (alkyl carbon, O-alkyl carbon, aromatic and phenolic carbon, and carboxyl and carbonyl carbon) appeared in all spectra, but at different intensities. According to the peak areas of different functional groups in the NMR, we calculated the percentages of the chemical structures in SOM. The O-alkyl carbon types were the most abundant (44.28–49.71%) in the four land use patterns (Figure 5). With increasing time after afforestation, the percentage of O-alkyl carbon decreased, and the percentage of aromatic and phenolic carbon increased. Moreover, Table 5 shows that the levels of the alkyl/O-alkyl ratio were higher in R20 than in R8.

4. Discussion

4.1. Effect of Land Use Types on SOC and MBC Concentrations and SOC Stocks

As measured in the 0–20 cm profile, the MBC concentrations of the two R. pseudoacacia plantations were lower than those in the adjacent cropland, and the MBC was slightly different between R20 and R20-CR (Table 2). This may be a result of the application of fertilizer in the cropland, which can increase the MBC concentrations [28,29]. The application of fertilizer in cropland can influence the microbial activity and then have a positive effect on MBC [30]. During the afforestation of previous croplands, we also observed that the MBC content of R. pseudoacacia plantations initially decreased, but then increased to the levels of the cropland after 20 years.
When compared with the conditions in the adjacent cropland, afforestation increased both the concentrations and stocks of SOC (Table 3). This result is consistent with the findings of many researchers who have conducted similar restoration studies on the Loess Plateau [20,31]. For example, Wei et al. (2012) reported that the SOC concentrations and stocks increased after cropland was converted into a Pinus tabuliformis plantation [20]. Moreover, the soil carbon stock calculated with the equivalent soil mass method also showed that the SOC storage increased with the increased afforestation time. This resulted from increased aboveground litter input and an increase in underground root biomass and exudate inputs [32].

4.2. Effect of Land Use Types on the Solvent-Extractable Compounds

Differences in land use patterns have led to a distinction in the surface litter and associated microbial communities, which in turn has led to differences in the chemical composition of the organic matter that accumulates in the soil [17,33]. The solvent-extractable free lipids generally accounted for less than 10% of the SOM, which included characteristic biomarkers that could be used to provide information related to the source and degradation stage of residues in SOM [14]. During the initial stage of afforestation, the content of total solvent-extractable products did not change significantly (Figure 1a). Figure 1a indicates that the change in solvent extraction products in R. pseudoacacia plantations was slow if the plantations were left undisturbed. In addition, larger solvent-extractable compound concentrations among the four treatments were found at depths of 0–10 cm when compared with 10–20 cm, which was consistent with the findings of other research studies conducted during vegetation restoration [34,35]. This phenomenon might be a result of the transfer of free lipids to organo-mineral complexes at deeper soil depths [35]. Moreover, a reduction in root input and selective lipid degradation processes in soil depths deeper than the litter layer also results in a reduction in free lipids [35,36].
Carbohydrates are organic compounds that are easily degraded in the soil profile [37,38,39]. At the measured 0–20 cm profile, R8 had larger carbohydrate concentrations than the adjacent cropland (Table 4). In contrast, no significant difference was found in the carbohydrate concentrations between R20 and R20-CR. This suggests that carbohydrates accumulate easily only in the early stage of afforestation.
In the measured soil, the concentrations of n-alkanoic acid decreased with the soil depth among the four treatments (Table 4), which agreed with previous reports that the degradation effects of n-alkanoic acids were enhanced with increasing soil depth [15]. At the 0–20 cm depth, R8 had significantly lower concentrations of alkanoic acids than R20, which was caused by the soil pH [15]. In our previous study, we found that the soil pH of R. pseudoacacia plantations decreased with the extension of the restoration time [21]. Some scholars have proposed that soil fungi dominate the microbial community when the pH is lower [40], as this provides a good environment for alkanoic acids to accumulate and be preserved [40,41].
At a depth of 0–20 cm, the microbial-derived solvent extracts were consistently greater than the plant-derived solvent extracts among the four treatments. This occurred because the plant-derived organic matter was transformed further into microbial necromass during degradation [42,43,44]. The concentrations of microbial- and plant-derived solvent extracts decreased with the soil depth in the four treatments; this phenomenon may be a result of a decrease in the root C inputs and related microbial processes in deeper soil [45,46]. After conversion for 8 years, no significant change was observed in the concentrations of microbial- and plant-derived solvent extracts between R8 and R8-CR in the 0–20 cm soil profile (Figure 1). However, the concentrations of plant- and microbial-derived solvent extracts decreased significantly at R20 compared with the adjacent croplands. This finding may be associated with the cultivation practices and afforestation time, because management practices differ in the type and intensity of disturbance [17]. Moreover, plant- and microbial-derived organic matter is protected from decomposition in soil depending on its interaction with the soil mineral matrix and aggregates [17].
Some indices of solvent extracts can indicate the sources and degradation of free lipids [47,48]. For example, the S/L value represents the ratio of short- to long-chain n-alkanoic acids. Previous studies confirmed that short-chain n-alkanoic acids were more easily degraded than long-chain n-alkanoic acids, so the S/L values decrease with degradation [34,49]. In the current study, the S/L difference between R8 and R8-CR was slight (Figure 2). However, the S/L of R20 was significantly lower than that of the adjacent cropland. This result is consistent with that of Pisani et al. (2015), who proposed that the degradation of n-alkanoic acids might require a long period [50]. The average chain length (ACL) also indicates the degree of degradation, and a lower ACL value means that a lower degree of degradation occurs for n-alkanes or n-alkanoic acids [51]. No significant difference in the ACLal values was observed among the four treatments at the 0–10 cm depth, which shows that the difference in n-alkane degradation was slight. This occurred because the turnover times of n-alkanes usually require time in the order of decades [15]. For the n-alkanoic acids, the lower ACLac of R8 than R8-CR and the higher ACLac of R20 over R20-CR suggest that the degradation of n-alkanoic acids increases with increasing time.
The RAL value is the ratio of acyclic aliphatic to cyclic lipids. Previous studies have proven that acyclic aliphatic lipids are preferred for degradation, in contrast with cyclic lipids, so a high RAL represents a low degree of lipid degradation [10,13]. Figure 2b shows that the RAL of all four treatments at the 0–10 cm depth was lower than that at the 10–20 cm depth, which suggests a higher degree of degradation of lipids in the surface over deep soil. The OEP and EOP values were calculated by the even- and odd-numbered n-alkanes or n-alkanoic acids. The OEP and EOP values generally decreased with degradation because the most abundant compounds of odd-numbered n-alkanes and even-numbered n-alkanoic acids were preferentially degraded [15,52]. In this study, no significant difference in the degradation of surface n-alkanes was observed (Figure 2d). In contrast to R8, the lower EOP value in R20 illustrates that the degradation of n-alkanoic acids increased with increasing afforestation time (Figure 2f).

4.3. Effect of Land Use Types on Lignin-Derived Phenols

Lignin-derived phenols are one of the most abundant compounds of SOM, and they are mainly derived from the vascular tissue of plants [12]. The degradation and transformation of lignin-derived phenols are influenced by land use patterns, plant community compositions, and microbial communities [53,54]. Figure 3a,c show that the concentration of lignin phenolic monomers decreased with increasing soil depth among the four treatments, which was in line with the findings of Feng and Simpson (2007) and Thevenot et al. (2010), who proposed that this trend occurs because of limitations in litter input and the physical protection of aggregates in deep soils [13,53]. Moreover, larger concentrations of syringyls, vanillyls, cinnamyls, and total lignin-derived phenols were observed in R20 than in R8 across the measured 0–20 cm profile, which suggests that more lignin-derived phenols in soils can accumulate with increasing afforestation time.
The sum of lignin-derived phenols (VSC) could be used as an index to study the impact of plant-derived compounds on SOM content and its stability [53,55,56]. In this study, we found that the VSCs of R8 and R20 were larger than those of their adjacent croplands at the 0–10 cm soil depth (Figure 3d). This result was consistent with Guggenberger et al. (1994), who found that the VSC of spruce forest soil was significantly larger than that of cropland [57]. However, these results were in contrast to those of Thevenot et al. (2010), who argued that white rot fungi, which serve as the main decomposers of lignin-derived phenols, are more abundant in forest soil than in cropland [53,58,59]. In their research, the largest VSC concentrations occurred in cropland, followed by forest and grassland soil. In our study, Figure 3d shows that the concentrations of total lignin-derived phenols increased after 8 years of afforestation compared to that of the adjacent cropland, and they increased further with the extension of the restoration time. This result suggests that the accumulation of aboveground litter and underground roots has the strongest influence on lignin-derived phenols.
The specific source of lignin-derived phenols might be inferred through their S/V and C/V values [58]. The S/V and C/V values are the ratios of syringyls or cinnamyls to vanillyls, respectively. Generally, the C/V and S/V values decrease with the degradation of lignin-derived phenols because cinnamyls and syringyls are more easily degraded than vanillyls [12,53,60]. At the 0–10 cm depth, larger S/V and C/V values were observed in croplands than in plantations (Figure 4a,b), which showed that a lower degree of degradation occurred for lignin-derived phenols in cropland, a finding that was consistent with the results of Guggenberger et al. (1994), who performed measurements in Germany [57]. In the present study, no significant difference in the degradation of the lignin-derived phenols in the topsoil was found between R8 and R20 with the extension of the restoration time (Figure 4a,b).
The monomer degradation of syringyls and vanillyls can be further inferred from the index of (Ad/Al)s and (Ad/Al)v because the aldehydes that correspond to syringyl and vanillyl groups are oxidized into acids during the degradation of lignin-derived phenols [14]. Therefore, larger values of (Ad/Al)s and (Ad/Al)v indicate a higher degree of degradation of corresponding syringyl or vanillyl components. The larger (Ad/Al)s of R20 and R8 at 10–20 cm over the shallow layer in Figure 4c shows that the two plantations experienced the greater degradation of syringyls in the deeper layer. This trend was consistent with Thevenot et al. (2010) and Rumpel et al. (2004), who observed the greater degradation of syringyls in deeper soil than in shallow soil [53,61]. However, (Ad/Al)v in Figure 4d shows a different trend when compared with (Ad/Al)s, as (Ad/Al)v decreased with increasing depth. This may be related to the difficulty of decomposing vanillyls when compared with syringyls and the different external environments required for their degradation [53].

4.4. Effect of Land Use Types on the NMR Chemical Composition of SOM

Figure 5 shows that the proportion of O-alkyl carbon was almost 50% in all four treatments, the largest component among the four functional groups of SOM. These results were in line with the findings of most previous studies [39,62]. The O-alkyl carbon compounds include carbohydrates, amino acids, and lignins [10]. A higher proportion of O-alkyl carbon generally means that the SOM is degraded relatively easily [19]. However, not all O-alkyl carbon groups are degraded readily; these groups may also be physically protected within soil aggregates or by the mineral matrix [17]. Across the 0–20 cm depth, R8 and R20 had lower O-alkyl carbon proportions than R8-CR and R20-CR, respectively (Figure 5). This indicates that the two R. pseudoacacia plantations had a relatively higher proportion of stable carbon in the carbon pool than the cropland.
The afforestation time also influences the NMR chemical composition of SOM. Figure 5 shows that the proportion of O-alkyl carbon in R20 was lower than that in R8. This suggests that the concentration of labile SOM components decreased gradually with an increase in plantation age. In addition, NMR showed that R20 and R8 had increasing proportions of carboxyl and carbonyl carbon with increasing soil depth, which was in line with the findings of Zech et al. (1992) and Guggenberger et al. (1994) [57,63]. This phenomenon may be related to CuO products (Figure 3d), because lignin side-chain oxidation reduces the concentration of total lignin-derived phenols and can contribute to an increase in the concentration of carboxyl groups [57,63].
The degradation degree of SOM can also be illustrated by the ratio of alkyl carbon to O-alkyl carbon, which is positively related to the degree of degradation, because the O-alkyl carbon is unstable and easier to decompose [17,64]. Table 5 shows larger alkyl/O-alkyl ratios of R20 over R8 in the 0–20 cm soil profile, which suggests that the SOM in R20 was relatively stable when compared with that of R8. This indicates that SOM is more easily degraded and a more unstable carbon pool exists during the early stage of afforestation. From another perspective, this also explains why the concentration of SOM often declines in the early stage of afforestation, as has been observed by other researchers.

5. Conclusions

This study evaluated differences in the molecular composition of SOM via biomarkers and NMR among different land use types, including two R. pseudoacacia plantations and their adjacent croplands in the central Loess Plateau of China. The results indicate that afforestation has significant impacts on SOM at the molecular level. After the croplands were converted into R. pseudoacacia plantations, the total solvent extracts in the plantations changed slowly with increasing time after restoration if the land was free of human disturbances. Moreover, microbial-derived solvent extracts were observed to accumulate more than plant-derived solvent extracts in the two R. pseudoacacia plantations examined. Afforestation and the extension of the restoration time also significantly increased the lignin-derived phenol content in the surface layer. The accumulation of aboveground litter and underground roots had the greatest influence on the lignin-derived phenol content. Our results indicate that the conversion of cropland to R. pseudoacacia plantations is an effective method to increase SOC stocks and carbon sequestration in the region.
The NMR results of this study indicate that more easily degradable components of SOM accumulated during the early stage of afforestation. Therefore, the proportion of the unstable carbon pool was relatively high, and the SOM content might be reduced in the early stage of afforestation. These results can provide a useful reference for land managers during the ecological restoration process.

Author Contributions

Conceptualization, S.L.; Methodology, Z.D.; Validation, X.S. and J.G.; Investigation, X.S., X.W., R.R. and S.L.; Resources, Z.D. and S.L.; Data curation, J.G.; Writing—original draft, X.S.; Writing—review & editing, Z.D., S.L. and C.H. All authors have read and agreed to the published version of the manuscript.

Funding

This research was supported by the Fundamental Research Funds of CAF (CAFYBB2020QD002-2).

Data Availability Statement

Not applicable.

Conflicts of Interest

The authors declare no conflict of interest.

References

  1. Cotrufo, M.F.; Soong, J.L.; Horton, A.J.; Campbell, E.E.; Haddix, M.; Wall, D.H.; Parton, W.J. Formation of soil organic matter via biochemical and physical pathways of litter mass loss. Nat. Geosci. 2015, 8, 776–779. [Google Scholar] [CrossRef]
  2. Spaccini, R.; Piccolo, A.; Conte, P.; Haberhauer, G.; Gerzabek, M.H. Increased soil organic carbon sequestration through hydrophobic protection by humic substances. Soil Biol. Biochem. 2002, 34, 1839–1851. [Google Scholar] [CrossRef]
  3. Nardi, S.; Pizzeghello, D.; Muscolo, A.; Vianello, A. Physiological effects of humic substances on higher plants. Soil Biol. Biochem. 2002, 34, 1527–1536. [Google Scholar] [CrossRef]
  4. Lehmann, J.; Kleber, M. The contentious nature of soil organic matter. Nature 2015, 528, 60–68. [Google Scholar] [CrossRef]
  5. Lal, R. Forest soils and carbon sequestration. For. Ecol. Manag. 2005, 220, 242–258. [Google Scholar] [CrossRef]
  6. Gardi, C.; Sconosciuto, F. Evaluation of carbon stock variation in Northern Italian soils over the last 70 years. Sustain. Sci. 2007, 2, 237–243. [Google Scholar] [CrossRef]
  7. Minasny, B.; Sulaeman, Y.; Mcbratney, A.B. Is soil carbon disappearing? The dynamics of soil organic carbon in Java. Glob. Chang. Biol. 2011, 17, 1917–1924. [Google Scholar] [CrossRef]
  8. Savarese, C.; Drosos, M.; Spaccini, R.; Cozzolino, V.; Piccolo, A. Molecular characterization of soil organic matter and its extractable humic fraction from long-term field experiments under different cropping systems. Geoderma 2021, 383, 114700. [Google Scholar] [CrossRef]
  9. Baldock, J.A.; Skjemstad, J.O. Role of the soil matrix and minerals in protecting natural organic materials against biological attack. Org. Geochem. 2000, 31, 697–710. [Google Scholar] [CrossRef]
  10. Pisani, O.; Hills, K.M.; Courtier-Murias, D.; Simpson, A.J.; Mellor, N.J.; Paul, E.A.; Morris, S.J.; Simpson, M.J. Molecular level analysis of long term vegetative shifts and relationships to soil organic matter composition. Org. Geochem. 2013, 62, 7–16. [Google Scholar] [CrossRef]
  11. Eglinton, G.; Calvin, M. Chemical fossils. Sci. Am. 1967, 216, 32–43. [Google Scholar] [CrossRef]
  12. Otto, A.; Simpson, M.J. Evaluation of CuO oxidation parameters for determining the source and stage of lignin degradation in soil. Biogeochemistry 2006, 80, 121–142. [Google Scholar] [CrossRef]
  13. Feng, X.J.; Simpson, M.J. The distribution and degradation of biomarkers in Alberta grassland soil profiles. Org. Geochem. 2007, 38, 1558–1570. [Google Scholar] [CrossRef]
  14. Otto, A.; Shunthirasingham, C.; Simpson, M.J. A comparison of plant and microbial biomarkers in grassland soils from the Prairie Ecozone of Canada. Org. Geochem. 2005, 36, 425–448. [Google Scholar] [CrossRef]
  15. Schäfer, I.K.; Lanny, V.; Franke, J.; Eglinton, T.I.; Zech, M.; Vysloužilová, B.; Zech, R. Leaf waxes in litter and topsoils along a European transect. Soil 2016, 2, 551–564. [Google Scholar] [CrossRef] [Green Version]
  16. Baldock, J.A.; Preston, C.M. Chemistry of Carbon Decomposition Processes in Forests as Revealed by Solid-State Carbon-13 Nuclear Magnetic Resonance. Carbon Forms Funct. For. Soils 1995, 89–117. [Google Scholar] [CrossRef]
  17. Pisani, O.; Haddix, M.L.; Conant, R.T.; Paul, E.A.; Simpson, M.J. Molecular composition of soil organic matter with land-use change along a bi-continental mean annual temperature gradient. Sci. Total Environ. 2016, 573, 470–480. [Google Scholar] [CrossRef] [Green Version]
  18. Kögel-Knabner, I. The macromolecular organic composition of plant and microbial residues as inputs to soil organic matter. Soil Biol. Biochem. 2002, 34, 139–162. [Google Scholar] [CrossRef]
  19. Simpson, M.J.; Simpson, A.J.; Kingery, W.L. Solid-State 13C Nuclear Magnetic Resonance (NMR) analysis of soil organic matter. In Reference Module in Earth Systems and Environmental Sciences; Elsevier: Amsterdam, The Netherlands, 2017. [Google Scholar]
  20. Wei, X.R.; Qiu, L.P.; Shao, M.A.; Zhang, X.C.; Gale, W.J. The accumulation of organic carbon in mineral soils by afforestation of abandoned Farmland. PLoS ONE 2012, 7, e32054. [Google Scholar] [CrossRef]
  21. Song, X.S.; Shi, S.M.; Lu, S.; Ren, R.X.; He, C.X.; Meng, P.; Zhang, J.S.; Yin, C.J.; Zhang, X. Changes in soil chemical properties following afforestation of cropland with Robinia pseudoacacia in the southeastern Loess Plateau of China. For. Ecol. Manag. 2021, 487, 118993. [Google Scholar] [CrossRef]
  22. Jenkinson, D.S.; Powlson, D.S. The effects of biocidal treatments on metabolism in soil-V: A method for measuring soil biomass. Soil Biol. Biochem. 1976, 8, 209–213. [Google Scholar] [CrossRef]
  23. Nelson, D.W.; Sommers, L.E. Total carbon, organic carbon, and organic matter. In Methods of Soil Analysis, Part 2. Chemical and Microbiological Properties, 2nd ed.; Page, A.L., Miller, R.H., Keeney, D.R., Eds.; Wiley: Hoboken, NJ, USA, 1982. [Google Scholar]
  24. Schmidt, M.; Knicker, H.; Hatcher, P.G.; Kogel-Knabner, I. Improvement of 13C and 15N CPMAS NMR spectra of bulk soils, particle size fractions and organic material by treatment with 10% hydrofluoric acid. Eur. J. Soil Sci. 1997, 48, 319–328. [Google Scholar] [CrossRef]
  25. Ellert, B.H.; Bettany, J.R. Calculation of organic matter and nutrients stored in soils under contrasting management regimes. Can. J. Soil Sci. 1995, 75, 529–538. [Google Scholar] [CrossRef] [Green Version]
  26. Hoefs, M.J.L.; Rijpstra, W.I.C.; Sinninghe Damsté, J.S. The influence of oxic degradation on the sedimentary biomarker record I: Evidence from Madeira Abyssal plain turbidites. Geochim. Cosmochim. Acta 2002, 66, 2719–2735. [Google Scholar] [CrossRef]
  27. Bush, R.T.; McInerney, F.A. Leaf wax n-alkane distributions in and across modern plants: Implications for paleoecology and chemotaxonomy. Geochim. Cosmochim. Acta 2013, 117, 161–179. [Google Scholar] [CrossRef]
  28. Guo, Z.; Han, J.; Li, J.; Xu, Y.; Wang, X. Effects of long-term fertilization on soil organic carbon mineralization and microbial community structure. PLoS ONE 2019, 14, e0211163. [Google Scholar]
  29. Henrique, M.R.; Ribeiro, D.F.; Fátima, A.; Ernesto, V.; João, C.; Roland, B.; Fernanda, C. Carbon mineralization kinetics in an organically managed Cambic Arenosol amended with organic fertilizers. J. Plant Nutr. Soil Sci. 2010, 173, 39–45. [Google Scholar]
  30. Jackson, L.E.; Calderon, F.J.; Steenwerth, K.L.; Scow, K.M.; Rolston, D.E. Responses of soil microbial processes and community structure to tillage events and implications for soil quality. Geoderma 2003, 114, 305–317. [Google Scholar] [CrossRef]
  31. Liu, Z.P.; Shao, M.A.; Wang, Y.Q. Effect of environmental factors on regional soil organic carbon stocks across the Loess Plateau region, China. Agric. Ecosyst. Environ. 2011, 142, 184–194. [Google Scholar] [CrossRef]
  32. Chang, R.Y.; Fu, B.J.; Liu, G.H.; Wang, S.; Yao, X.L. The effects of afforestation on soil organic and inorganic carbon: A case study of the Loess Plateau of China. Catena 2012, 95, 145–152. [Google Scholar] [CrossRef]
  33. Girona-García, A.; Badía-Villas, D.; Jiménez-Morillo, N.J.; González-Pérez, J.A. Changes in soil organic matter composition after Scots pine afforestation in a native European beech forest revealed by analytical pyrolysis (Py-GC/MS). Sci. Total Environ. 2019, 691, 1155–1161. [Google Scholar] [CrossRef]
  34. Ma, L.X.; Ju, Z.Q.; Fang, Y.Y.; Vancov, T.; Gao, Q.Q.; Wu, D.; Zhang, A.P.; Wang, Y.N.; Hu, C.S.; Wu, W.L.; et al. Soil warming and nitrogen addition facilitates lignin and microbial residues accrual in temperate agroecosystems. Soil Biol. Biochem. 2022, 170, 108693. [Google Scholar] [CrossRef]
  35. Naafs, D.F.W.; van Bergen, P.F.; Boogert, S.J.; de Leeuw, J.W. Solvent-extractable lipids in an acid andic forest soil; variations with depth and season. Soil Biol. Biochem. 2004, 36, 297–308. [Google Scholar] [CrossRef]
  36. Amblès, A.; Jacquesy, J.C.; Jambu, P.; Joffre, J.; Maggi-Churin, R. Polar lipid fraction in soil: A kerogen-like matter. Org. Geochem. 1991, 17, 341–349. [Google Scholar] [CrossRef]
  37. Melillo, J.M.; Aber, J.D.; Muratore, J.F. Nitrogen and lignin control of hardwood leaf litter decomposition dynamics. Ecology 1982, 63, 621–626. [Google Scholar] [CrossRef]
  38. Jolivet, C.; Angers, D.A.; Chantigny, M.H.; Andreux, F.; Arrouays, D. Carbohydrate dynamics in particle—Size fractions of sandy spodosols following forest conversion to maize cropping. Soil Biol. Biochem. 2006, 38, 2834–2842. [Google Scholar] [CrossRef]
  39. Boeni, M.; Bayer, C.; Dieckow, J.; Conceição, P.C.; Dick, D.P.; Knicker, H.; Salton, J.C.; Macedo, M.C.M. Organic matter composition in density fractions of Cerrado Ferralsols as revealed by CPMAS 13C NMR: Influence of pastureland, cropland and integrated crop-livestock. Agric. Ecosyst. Environ. 2014, 190, 80–86. [Google Scholar] [CrossRef] [Green Version]
  40. Nierop, K.G.J.; Verstraten, J.M. Organic matter formation in sandy subsurface horizons of Dutch coastal dunes in relation to soil acidification. Org. Geochem. 2003, 34, 499–513. [Google Scholar] [CrossRef]
  41. Bull, I.D.; van Bergen, P.F.; Nott, C.J.; Poulton, P.R.; Evershed, R.P. Organic geochemical studies of soils from the Rothamsted classical experiments—V. The fate of lipids in different long-term experiments. Org. Geochem. 2000, 31, 389–408. [Google Scholar] [CrossRef]
  42. Angst, G.; Mueller, C.W.; Prater, I.; Angst, Š.; Peterse, F.; Nierop, K.G.J. Earthworms act as biochemical reactors to convert labile plant compounds into stabilized soil microbial necromass. Commun. Biol. 2019, 2, 1–7. [Google Scholar] [CrossRef] [Green Version]
  43. Angst, G.; Mueller, K.E.; Nierop, K.G.; Simpson, M.J. Plant-or microbial-derived? A review on the molecular composition of stabilized soil organic matter. Soil Biol. Biochem. 2021, 156, 108189. [Google Scholar] [CrossRef]
  44. Yang, Y.; Dou, Y.X.; Wang, B.R.; Wang, Y.Q.; Liang, C.; An, S.S.; Soromotin, A.; Kuzyakov, Y. Increasing contribution of microbial residues to soil organic carbon in grassland restoration chronosequence. Soil Biol. Biochem. 2022, 170, 108688. [Google Scholar] [CrossRef]
  45. Gao, W.T.; Wang, Q.T.; Zhu, X.M.; Liu, Z.F.; Li, N.; Xiao, J.; Sun, X.P.; Yin, H.J. The vertical distribution pattern of microbial- and plant-derived carbon in the rhizosphere in alpine coniferous forests. Rhizosphere 2021, 20, 100436. [Google Scholar] [CrossRef]
  46. Tückmantel, T.; Leuschner, C.; Preusser, S.; Kandeler, E.; Angst, G.; Mueller, C.W.; Meier, I.C. Root exudation patterns in a beech forest: Dependence on soil depth, root morphology, and environment. Soil Biol. Biochem. 2017, 107, 188–197. [Google Scholar] [CrossRef]
  47. Jansen, B.; Wiesenberg, G. Opportunities and limitations related to the application of plant-derived lipid molecular proxies in soil science. Soil 2017, 3, 211–234. [Google Scholar] [CrossRef] [Green Version]
  48. Li, X.Q.; Anderson, B.J.; Vogeler, I.; Schwendenmann, L. Long-chain n-alkane and n-fatty acid characteristics in plants and soil—Potential to separate plant growth forms, primary and secondary grasslands? Sci. Total Environ. 2018, 645, 1567–1578. [Google Scholar] [CrossRef]
  49. Schulten, H.R.; Schnitzer, M. Aliphatics in soil organic matter in fine-clay fractions. Soil Sci. Soc. Am. J. 1990, 54, 98–105. [Google Scholar] [CrossRef]
  50. Wiesenberg, G.L.; Dorodnikov, M.; Kuzyakov, Y. Source determination of lipids in bulk soil and soil density fractions after four years of wheat cropping. Geoderma 2010, 156, 267–277. [Google Scholar] [CrossRef]
  51. Zech, M.; Buggle, B.; Leiber, K.; Markovic, S.; Glaser, B.; Hambach, U.; Huwe, B.; Stevens, T.; Sümegi, P.; Wiesenberg, G.; et al. Reconstructing Quaternary vegetation history in the Carpathian Basin, SE Europe, using n-alkane biomarkers as molecular fossils—Problems and possible solutions, potential and limitations. J. Quat. Sci. 2009, 58, 148–155. [Google Scholar] [CrossRef] [Green Version]
  52. Thevenot, M.; Dignac, M.; Rumpel, C. Fate of lignins in soils: A review. Soil Biol. Biochem. 2010, 42, 1200–1211. [Google Scholar] [CrossRef]
  53. Tamilarasan, K.; Sellamuthu, P.; Gurunathan, D.B. Integration of Lignin Removal from Black Liquor and Biotransformation Process. In Bioremediation: Applications for Environmental Protection and Management. Energy, Environment, and Sustainability; Varjani, S., Agarwal, A., Gnansounou, E., Gurunathan, B., Eds.; Springer: Singapore, 2018; pp. 77–97. [Google Scholar]
  54. Abiven, S.; Heim, A.; Schmidt, M.W.I. Lignin content and chemical characteristics in maize and wheat vary between plant organs and growth stages: Consequences for assessing lignin dynamic in soils. Plant Soil 2011, 343, 369–378. [Google Scholar] [CrossRef] [Green Version]
  55. Ruckamp, D.; Martius, C.; Braganca, M.A.L.; Amelung, W. Lignin patterns in soil and termite nests of the Brazilian Cerrado. Appl. Soil Ecol. 2011, 48, 45–52. [Google Scholar] [CrossRef]
  56. Guggenberger, G.; Christensen, B.T.; Zech, W. Land-use effects on the composition of organic matter in particle-size separates of soil: I. Lignin and carbohydrate signature. Eur. J. Soil Sci. 1994, 45, 449–458. [Google Scholar] [CrossRef]
  57. Hedges, J.I.; Mann, D.C. The characterization of plant tissues by their lignin in oxidation products. Geochim. Cosmochim. Acta 1979, 43, 1803–1807. [Google Scholar] [CrossRef]
  58. Hedges, J.I.; Ertel, J.R. Characterization of lignin by gas capillary chromatography of cupric oxidation products. Anal. Chem. 1982, 54, 174–178. [Google Scholar] [CrossRef]
  59. Bahri, H.; Dignac, M.F.; Rumpel, C.; Rasse, D.P.; Chenu, C.; Mariotti, A. Lignin turnover kinetics in an agricultural soil in monomer specific. Soil Biol. Biochem. 2006, 38, 1977–1988. [Google Scholar] [CrossRef]
  60. Rumpel, C.; Eusterhues, K.; Kögel-Knabner, I. Location and chemical composition of stabilized organic carbon in topsoil and subsoil horizons of two acid forest soils. Soil Biol. Biochem. 2004, 36, 177–190. [Google Scholar] [CrossRef]
  61. Wang, H.; Liu, S.R.; Song, Z.C.; Yang, Y.J.; Wang, J.X.; You, Y.M.; Zhang, X.; Shi, Z.M.; Nong, Y.; Ming, A.G.; et al. Introducing nitrogen-fixing tree species and mixing with Pinus massoniana alters and evenly distributes various chemical compositions of soil organic carbon in a planted forest in southern China. For. Ecol. Manag. 2019, 449, 117477. [Google Scholar] [CrossRef]
  62. Zech, W.; Ziegler, F.; Kögel-Knabner, I.; Haumaier, L. Humic substances distribution and transformation in forest soil. Sci. Total Environ. 1992, 117/118, 155–174. [Google Scholar] [CrossRef]
  63. Dieckow, J.; Bayer, C.; Conceição, C.; Zanatta, J.A.; Martin-Neto, L.; Milorid, D.B.M.; Salton, J.C.; Macedo, M.M.; Mielniczuk, J.; Hernani, L.C. Land use, tillage, texture and organic matter stock and composition in tropical and subtropical Brazilian soils. Eur. J. Soil Sci. 2009, 60, 240–249. [Google Scholar] [CrossRef]
  64. Paul, K.I.; Polglase, P.J.; Nyakuengama, J.G.; Khanna, P.K. Change in soil carbon following afforestation. For. Ecol. Manag. 2002, 168, 241–257. [Google Scholar] [CrossRef]
Figure 1. Concentrations of total and calculated sources of solvent extraction compounds (SEC) at 0–10 cm and 10–20 cm soil depths under four treatments. (a) Concentrations of total solvent extracts. (b,c) Concentrations of microbial-derived and plant-derived SEC at depths of 0–10 cm and 10–20 cm, respectively. L and S denote the effects of land use and soil depth, respectively (based on results of two-way ANOVA). Values in bold indicate significant treatment effects at p < 0.05. Values followed by different lowercase letters represent significant differences among the four treatments for the same soil layer (p < 0.05). Note: Robinia pseudoacacia plantations had been established for 8 (R8) and 20 (R20) years, and their adjacent croplands (R8–CR and R20–CR, respectively) were also analyzed.
Forests 14 01502 g001
Figure 2. Measurement of free lipids at 0–10 cm and 10–20 cm soil depths under four treatments: (a) ratio of short-chain n-alkanoic acids to long-chain n-alkanoic acids (S/L), (b) ratio of acyclic lipids to cyclic lipids (RAL), (c) average chain length of n-alkanes (ACLal), (d) odd-over-even predominance (OEP) for n-alkanes, (e) average chain length of n-alkanoic acids (ACLac), and (f) even-over-odd predominance (EOP) for n-alkanoic acids. Values in bold indicate significant treatment effects at p < 0.05. Values followed by different lowercase letters represent significant differences among the four treatments for the same soil layer (p < 0.05). Note: Robinia pseudoacacia plantations had been established for 8 (R8) and 20 (R20) years, and their adjacent croplands (R8–CR and R20–CR, respectively) were also analyzed.
Forests 14 01502 g002
Figure 3. The concentrations of (a) vanillyls, (b) syringyls, (c) cinnamyls, and (d) total lignin-derived phenols under four treatments. Values in bold indicate significant treatment effects at p < 0.05. Values followed by different lowercase letters represent significant differences among the four treatments for the same soil layer (p < 0.05). Note: Robinia pseudoacacia plantations had been established for 8 (R8) and 20 (R20) years, and their adjacent croplands (R8–CR and R20–CR, respectively) were also analyzed.
Forests 14 01502 g003
Figure 4. The parameters of lignin-derived phenols at 0–10 cm and 10–20 cm under four treatments: (a) the ratio of syringyls to vanillyls (S/V), (b) the ratio of cinnamyls to vanillyls (C/V), (c) the ratio of syringic acid to syringaldehyde ((Ad/Al)s), and (d) the ratio of vanillic acid to vanillin ((Ad/Al)v). Values in bold indicate significant treatment effects at p < 0.05. Values followed by different lowercase letters represent significant differences among the four treatments for the same soil layer (p < 0.05). Note: Robinia pseudoacacia plantations had been established for 8 (R8) and 20 (R20) years, and their adjacent croplands (R8–CR and R20–CR, respectively) were also analyzed.
Forests 14 01502 g004
Figure 5. Relative percentages of different functional areas as determined from the nuclear magnetic resonance spectra at 0–10 cm and 10–20 cm under four treatments: (a) Relative percentages of alkyl carbon; (b) Relative percentages of O–alkyl carbon; (c) Relative percentages of aromatic and phenolic carbon; (d) Relative percentages of carboxyl and carbonyl carbon; (e) Relative percentages of aliphatic carbon (aliphatic carbon = alkyl carbon + O-alkyl carbon). Note: Robinia pseudoacacia plantations had been established for 8 (R8) and 20 (R20) years, and their adjacent croplands (R8–CR and R20–CR, respectively) were also analyzed.
Forests 14 01502 g005
Table 1. Field survey results and soil bulk densities (0–20 cm, mean ± SE) under four treatments.
TreatmentTree Height
(m)
Diameter at Breast Height (cm)Understory Vegetation/Crop TypeSoil Bulk Density
(g·cm−3)
R89.5210.31Potentilla reptans L. var. sericophylla Franch., Carex breviculmis R. Br., and Setaria viridis (L.) Beauv.1.35 (0.16)
R8-CRWheat and oilseed rape rotation1.58 (0.13)
R209.71 m16.3Potentilla reptans L. var. sericophylla Franch., Carex breviculmis R. Br., and Setaria viridis (L.) Beauv.1.35 (0.18)
R20-CRWheat and oilseed rape rotation1.43 (0.23)
Note: Robinia pseudoacacia plantations had been established for 8 (R8) and 20 (R20) years, and their adjacent croplands (R8-CR and R20-CR, respectively) were also analyzed. Standard error is displayed in brackets.
Table 2. Soil microbial biomass carbon (MBC) and soil organic carbon (SOC) concentrations under four treatments.
Soil Depth (cm)TreatmentMBC (g·kg−1)SOC (g·kg−1)
0–10R80.30 (0.05) b9.98 (0.84) ab
R8-CR0.62 (0.11) a7.12 (0.46) bc
R200.72 (0.06) a12.55 (1.04) a
R20-CR0.78 (0.06) a5.25 (0.64) c
10–20R80.19 (0.02) b6.34 (0.13) a
R8-CR0.74 (0.08) a8.02 (0.68) a
R200.78 (0.13) a8.36 (0.94) a
R20-CR0.91 (0.06) a7.02 (0.12) a
Note: Robinia pseudoacacia plantations had been established for 8 (R8) and 20 (R20) years, and their adjacent croplands (R8-CR and R20-CR, respectively) were also analyzed. Standard error is displayed in brackets. Values followed by different lowercase letters within columns represent significant differences among the four treatments for the same soil layer (p < 0.05). These notes also apply to Table 3 and Table 4.
Table 3. Soil organic carbon (SOC) stocks at 0–20 cm depth under four treatments.
TreatmentSOC Stock (Mg·ha−1)
R821.11 (1.24) ab
R8-CR20.53 (1.81) b
R2027.24 (2.56) a
R20-CR15.96 (0.98) b
Values followed by different lowercase letters within columns represent significant differences among the four treatments (p < 0.05).
Table 4. Concentrations of the solvent-extractable compounds under four treatments.
Soil Depth (cm)Treatmentn-Alkanesn-Alkanolsn-Alkanoic AcidsCarbohydratesSteroidsShort-Chain Aliphatic LipidsLong-Chain Aliphatic Lipids
μg·g−1
0–10R89.35 (0.48) a10.47 (1.20) c35.78 (3.83) c19.73 (1.21) a12.33 (1.34) b32.17 (3.92) c23.44 (1.44) b
R8-CR8.68 (0.93) a9.57 (0.88) c37.84 (4.51) bc16.16 (1.13) b13.01 (0.67) ab32.34 (4.00) bc23.76 (2.27) b
R208.19 (0.28) a14.58 (0.97) b49.24 (3.16) b14.72 (1.38) b15.11 (0.86) ab42.90 (3.34) b29.10 (1.00) a
R20-CR9.77 (0.14) a18.60 (0.74) a63.87 (2.48) a18.24 (0.34) ab15.47 (0.80) a60.39 (2.74) a31.86 (0.57) a
10–20R85.65 (0.33) b3.92 (0.06) b17.83 (0.23) b9.70 (0.34) ab5.58 (0.17) c16.18 (0.26) c11.22 (0.46) b
R8-CR5.66 (0.33) b4.74 (0.18) b20.46 (0.38) b8.92 (0.28) b6.98 (0.24) b17.00 (0.37) c13.86 (0.36) b
R206.39 (0.38) b4.82 (0.12) b30.67 (3.68) a10.96 (0.47) a5.82 (0.30) bc26.85 (3.54) b15.03 (0.49) a
R20-CR10.20 (1.16) a9.22 (0.62) a37.16 (3.07) a10.89 (0.60) a8.23 (0.60) a35.20 (2.88) a21.38 (1.96) a
Values followed by different lowercase letters within columns represent significant differences among the four treatments for the same soil layer (p < 0.05).
Table 5. The parameters of different functional areas as determined from the nuclear magnetic resonance spectra at 0–10 cm and 10–20 cm under four treatments.
Soil Depth (cm)TreatmentAlkyl C/O-Alkyl RatioAromatic/O-Alkyl RatioAliphatic/Aromatic Ratio
0–10R80.560.285.49
R8-CR0.550.295.30
R200.570.344.68
R20-CR0.590.315.12
10–20R80.600.325.00
R8-CR0.580.334.73
R200.660.384.36
R20-CR0.580.305.29
Note: Robinia pseudoacacia plantations had been established for 8 (R8) and 20 (R20) years, and their adjacent croplands (R8-CR and R20-CR, respectively) were also analyzed.
Disclaimer/Publisher’s Note: The statements, opinions and data contained in all publications are solely those of the individual author(s) and contributor(s) and not of MDPI and/or the editor(s). MDPI and/or the editor(s) disclaim responsibility for any injury to people or property resulting from any ideas, methods, instructions or products referred to in the content.

