
Mapping the Late Miocene Pyrenean Forests of the La Cerdanya Basin, Spain
Abstract
:1. Introduction
2. The Late Miocene Flora from La Cerdanya Basin
- Azonal communities composed by alders, willows and poplars with an understory of ferns (mainly Osmunda) that grew in the deltaic environment of the Puigcerdà sub-basin and around the lake and on the shore of watercourses in the Bellver sub-basin;
- Zonal open or semi-open woodlands in sunny low-lying areas characterised by semi-sclerophyllous and sclerophyllous elements such as evergreen oaks, Araliaceae, Arecaceae, Buxaceae, Fabaceae, Sapotaceae, Ulmaceae, and some palaeotropical species such as Cedrela heliconia and Dombeyopsis lobata;
- Zonal mixed forests with broadleaved deciduous elements (mainly Fagus gussonii and Quercus hispanica together with Carpinus, Corylus, Ostrya, Acer, Tilia, Ulmus, Zelkova, Hamamelidaceae, Juglandaceae and other species of oaks and beeches), some conifers (Pinus, Cryptomeria, Torreya, cf. Tsuga, Cupressaceae) and evergreen nothophyllous broadleaved taxa (evergreen Quercus, Daphnogene polymorpha, Laurophyllum div. sp., Myrica) that surrounded the lake;
- Zonal woods in the mountain slopes with deciduous broadleaved taxa (Fagus, Quercus, Betula, Carpinus, among others) and conifers such as Pinus, Abies, Cathaya, Picea, Cupressaceae), which predominated at higher elevations and under appropriate topographic or edaphic conditions.
3. Material and Methods
3.1. Palaeobotanical Material
3.2. The Biomization Method
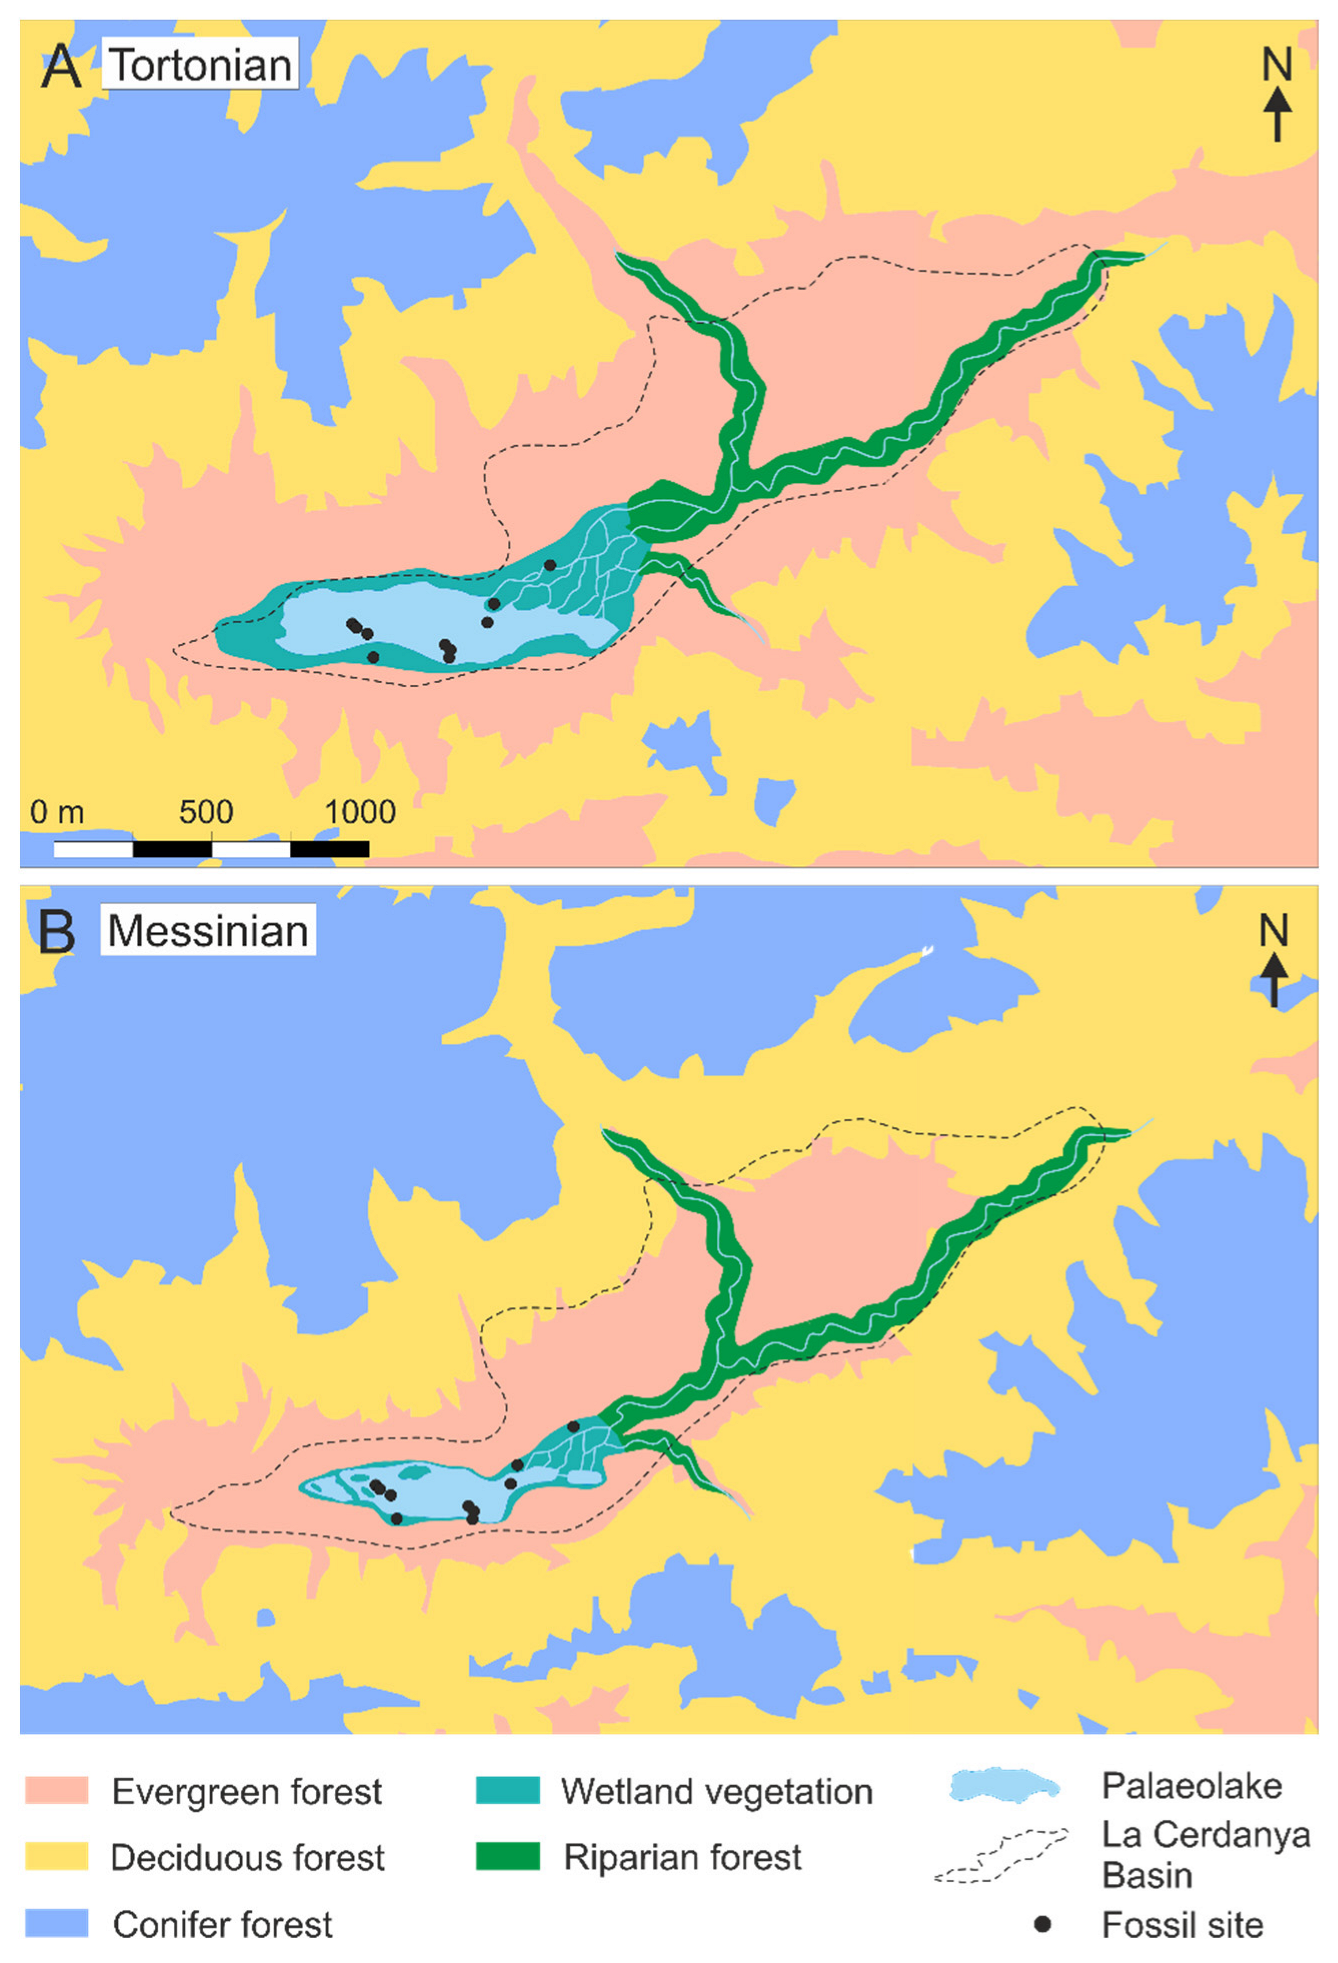
3.3. Vegetation Maps
4. Results
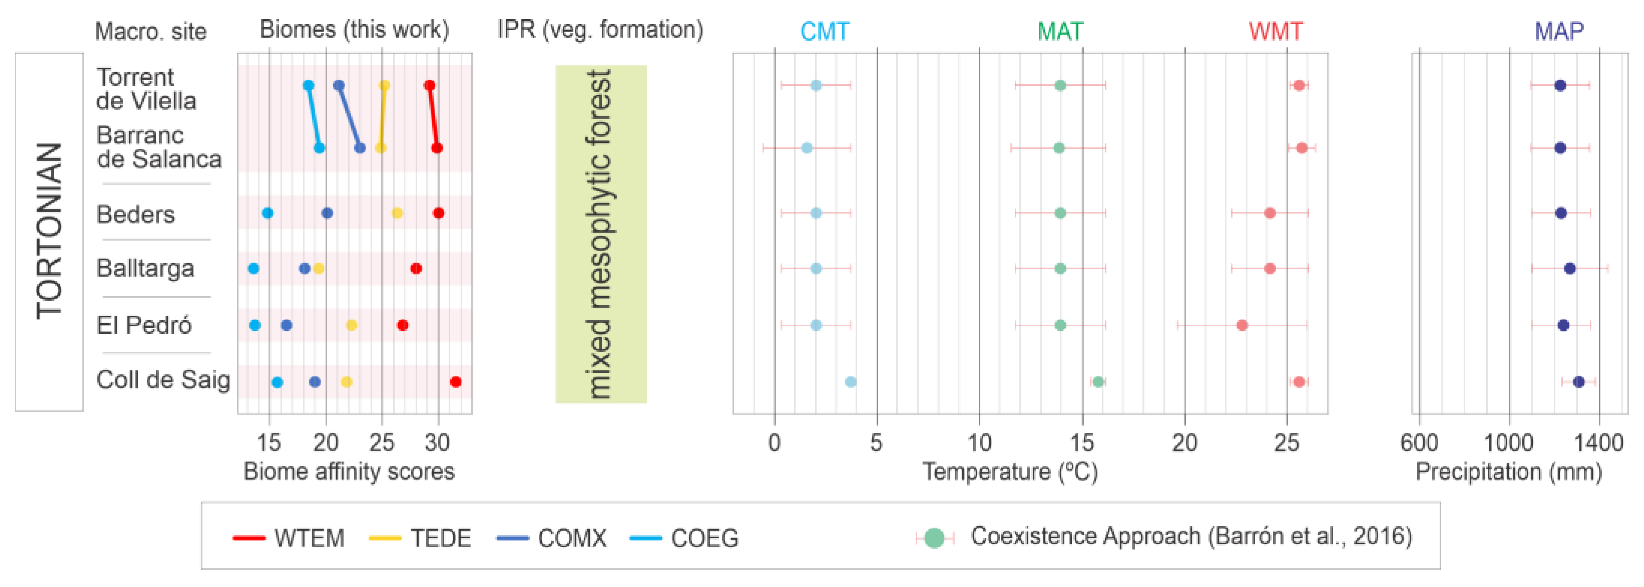
Biome Reconstruction
5. Discussion
5.1. Environmental and Taphonomical Considerations
5.2. Biome Characterization
5.3. Distribution of Late Miocene Biomes
5.4. Palaeoclimate Trends and Comparison with Other Areas
6. Conclusions
Supplementary Materials
Author Contributions
Funding
Data Availability Statement
Acknowledgments
Conflicts of Interest
References
- Barrón, E.; Rivas-Carballo, R.; Postigo-Mijarra, J.M.; Alcalde-Olivares, C.; Vieira, M.; Castro, L.; Pais, J.; Valle-Hernández, M. The Cenozoic Vegetation of the Iberian Peninsula: A Synthesis. Rev. Palaeobot. Palynol. 2010, 162, 382–402. [Google Scholar] [CrossRef]
- François, L.; Ghislain, M.; Otto, D.; Micheels, A. Late Miocene Vegetation Reconstruction with the CARAIB Model. Palaeogeogr. Palaeoclimatol. Palaeoecol. 2006, 238, 302–320. [Google Scholar] [CrossRef] [Green Version]
- Utescher, T.; Erdei, B.; François, L.; Mosbrugger, V. Tree Diversity in the Miocene Forests of Western Eurasia. Palaeogeogr. Palaeoclimatol. Palaeoecol. 2007, 253, 226–250. [Google Scholar] [CrossRef]
- Ivanov, D.; Utescher, T.; Mosbrugger, V.; Syabryaj, S.; Djordjević-Milutinović, D.; Molchanoff, S. Miocene Vegetation and Climate Dynamics in Eastern and Central Paratethys (Southeastern Europe). Palaeogeogr. Palaeoclimatol. Palaeoecol. 2011, 304, 262–275. [Google Scholar] [CrossRef]
- van Dam, J.A. Geographic and Temporal Patterns in the Late Neogene (12–3 Ma) Aridification of Europe: The Use of Small Mammals as Paleoprecipitation Proxies. Palaeogeogr. Palaeoclimatol. Palaeoecol. 2006, 238, 190–218. [Google Scholar] [CrossRef]
- Casas-Gallego, M.; Lassaletta, L.; Barrón, E.; Bruch, A.A.; Montoya, P. Vegetation and Climate in the Eastern Iberian Peninsula during the Pre-Evaporitic Messinian (Late Miocene). Palynological Data from the Upper Turolian of Venta Del Moro (Spain). Rev. Palaeobot. Palynol. 2015, 215, 85–99. [Google Scholar] [CrossRef]
- Rivas-Carballo, M.R.; Alonso-Gavilán, G.; Valle, M.F.; Civis, J. Miocene Palynology of the Central Sector of the Duero Basin (Spain) in Relation to Palaeogeography and Palaeoenvironment. Rev. Palaeobot. Palynol. 1994, 82, 251–264. [Google Scholar] [CrossRef]
- Pais, J. Évolution de La Végétation et Du Climat Pendant Le Miocène Au Portugal. Ciên Terra UNL 1986, 8, 179–191. [Google Scholar]
- Barrón, E.; Postigo-Mijarra, J.M.; Casas-Gallego, M. Late Miocene Vegetation and Climate of the La Cerdanya Basin (Eastern Pyrenees, Spain). Rev. Palaeobot. Palynol. 2016, 235, 99–119. [Google Scholar] [CrossRef]
- Valle-Hernández, M.F.; Gavilán, G.A.; Carballo, M.R.R. Analyse palynologique préliminaire du Miocène dans le NE de la dépression du Duero (aire de Belorado, Burgos, España). Geobios 1995, 28, 407–412. [Google Scholar] [CrossRef]
- Barnolas, A.; Robles, S.; García-Ramos, J.C.; Hernández, J.M. La Cordillera Pirenaica. In Geología de España; Vera, J.A., Ed.; SGE-IGME: Madrid, Spain, 2004; pp. 233–343. [Google Scholar]
- Cabrera, L.; Roca, E.; Santanach, P. Basin Formation at the End of a Strike-Slip Fault: The Cerdanya Basin (Eastern Pyrenees). J. Geol. Soc. 1988, 145, 261–268. [Google Scholar] [CrossRef]
- Roca, E. Estructura, estratigrafía y evolución tectonosedimentaria de las Cuencas Neógenas de La Cerdanya y Seu d’Urgell (Pirineos Orientales). In Geología de España; Vera, J.A., Ed.; SGE-IGME: Madrid, Spain, 2002; pp. 573–576. [Google Scholar]
- Roca, E. The Neogene Cerdanya and Seu d’Urgell Intramontane Basins (Eastern Pyrenees). In Tertiary Basins of Spain. The Stratigraphic Record of Crustal Kinematics; Friend, P.F., Dabrio, C.J., Eds.; Cambridge University Press: Cambridge, UK, 1996; pp. 114–119. ISBN 978-0-521-46171-9. [Google Scholar]
- Agustí, J.; Roca, E. Síntesis biostratigráfica de La Fosa de La Cerdanya (Pirineos Orientales). Estud. Geológicos 1987, 43, 521–529. [Google Scholar] [CrossRef]
- Anadón, P.; Cabrera, L.; Julià, R.; Roca, E.; Rosell, L. Lacustrine Oil-Shale Basins in Tertiary Grabens from NE Spain (Western European Rift System). Palaeogeogr. Palaeoclimatol. Palaeoecol. 1989, 70, 7–28. [Google Scholar] [CrossRef]
- Agustí, J.; Oms, O.; Furió, M.; Pérez-Vila, M.-J.; Roca, E. The Messinian Terrestrial Record in the Pyrenees: The Case of Can Vilella (Cerdanya Basin). Palaeogeogr. Palaeoclimatol. Palaeoecol. 2006, 238, 179–189. [Google Scholar] [CrossRef]
- Martin-Closas, C.; Wojcicki, J.J.; Fonolla, L. Fossil Charophytes and Hydrophytic Angiosperms as Indicators of Lacustrine Trophic Change. A Case Study in the Miocene of Catalonia (Spain). Cryptogam. Algol. 2006, 4, 357–379. [Google Scholar]
- Rérolle, M.L. Études Sur Les Végétaux Fossiles de Cerdagne. Rev. Sci. Nat. Montp. 1884, 4, 167–191. [Google Scholar]
- Rérolle, M.L. Études Sur Les Végétaux Fossiles de Cerdagne (Suite). Rev. Sci. Nat. Montp. 1884, 4, 252–298. [Google Scholar]
- Rérolle, M.L. Études Sur Les Végétaux Fossiles de Cerdagne (Suite et Fin). Rev. Sci. Nat. Montp. 1885, 4, 368–386. [Google Scholar]
- Barrón, E. Estudio Tafonómico y Análisis Paleoecológico de La Macro y Microflora Miocena de La Cuenca de La Cerdaña; Universidad Complutense Madrid: Madrid, Spain, 1996. [Google Scholar]
- Barrón, E.; Postigo-Mijarra, J.M.; Diéguez, C. The Late Miocene Macroflora of the La Cerdanya Basin (Eastern Pyrenees, Spain): Towards a Synthesis. Palaeontogr. Abt. B 2014, 291, 85–129. [Google Scholar] [CrossRef]
- Jelgersma, S. Investigaciones Palinológicas de Lignitos Terciarios Procedentes de Cerdaña y del Valle de Arán (Pirineos Españoles). Cursillos Conf. Inst. Lucas Mallada 1957, 4, 159–162. [Google Scholar]
- Bessedik, M. Réconstitution Des Environnements Miocènes Des Regions Nord-Ouest Mediterranéennes a Partir de La Palynologie; University of Science and Techniques of Languedoc: Montpellier, France, 1985. [Google Scholar]
- Tosal, A.; Verduzco, O.; Martín-Closas, C. CLAMP-Based Palaeoclimatic Analysis of the Late Miocene (Tortonian) Flora from La Cerdanya Basin of Catalonia, Spain, and an Estimation of the Palaeoaltitude of the Eastern Pyrenees. Palaeogeogr. Palaeoclimatol. Palaeoecol. 2021, 564, 110186. [Google Scholar] [CrossRef]
- Altolaguirre, Y.; Schulz, M.; Gibert, L.; Bruch, A.A. Mapping Early Pleistocene Environments and the Availability of Plant Food as a Potential Driver of Early Homo Presence in the Guadix-Baza Basin (Spain). J. Hum. Evol. 2021, 155, 102986. [Google Scholar] [CrossRef]
- Kovar-Eder, J.; Kvaček, Z.; Martinetto, E.; Roiron, P. Late Miocene to Early Pliocene Vegetation of Southern Europe (7–4 Ma) as Reflected in the Megafossil Plant Record. Palaeogeogr. Palaeoclimatol. Palaeoecol. 2006, 238, 321–339. [Google Scholar] [CrossRef]
- Kovar-Eder, J.; Kvaček, Z. The Integrated Plant Record (IPR) to Reconstruct Neogene Vegetation: The IPR-Vegetation Analysis. Acta Palaeobot. 2007, 47, 391–418. [Google Scholar]
- Spicer, R.A.; Wolfe, J.A. Plant Taphonomy of Late Holocene Deposits in Trinity (Clair Engle) Lake, Northern California. Paleobiology 1987, 13, 227–245. [Google Scholar] [CrossRef]
- Burnham, R.J. Relationships between Standing Vegetation and Leaf Litter in a Paratropical Forest: Implications for Paleobotany. Rev. Palaeobot. Palynol. 1989, 58, 5–32. [Google Scholar] [CrossRef]
- Burnham, R.J.; Wing, S.L.; Parker, G.G. The Reflection of Deciduous Forest Communities in Leaf Litter: Implications for Autochthonous Litter Assemblages from the Fossil Record. Paleobiology 1992, 18, 30–49. [Google Scholar] [CrossRef]
- Ferguson, D.K. Plant Taphonomic Studies with Special Reference to Messel. Kaupia 1993, 2, 117–126. [Google Scholar]
- Barrón, E.; Comas-Rengifo, M.J. Differential Accumulation of Miospores in Upper Miocene Sediments of the La Cerdaña Basin (Eastern Pyrenees, Spain). Comptes Rendus Palevol 2007, 6, 157–168. [Google Scholar] [CrossRef]
- Traverse, A. Paleopalynology, 2nd ed.; Springer: Dordrecht, The Netherlands, 2007. [Google Scholar]
- Velitzelos, D.; Bouchal, J.M.; Denk, T. Review of the Cenozoic Floras and Vegetation of Greece. Rev. Palaeobot. Palynol. 2014, 204, 56–117. [Google Scholar] [CrossRef]
- Mai, D.H. Tertiäre Vegetationsgeschichte Europas: Methoden Und Ergebnisse; Gustav Fischer: Jena, Germany, 1995. [Google Scholar]
- Hammer, Ø.; Harper, D.A.T.; Ryan, P.D. Past: Paleontological Statistics Software Package for Education and Data Analysis. Palaeontol. Electron. 2001, 4, 9. [Google Scholar]
- Prentice, C.; Guiot, J.; Huntley, B.; Jolly, D.; Cheddadi, R. Reconstructing Biomes from Palaeoecological Data: A General Method and Its Application to European Pollen Data at 0 and 6 Ka. Clim. Dyn. 1996, 12, 185–194. [Google Scholar] [CrossRef]
- Jolly, D.; Prentice, I.C.; Bonnefille, R.; Ballouche, A.; Bengo, M.; Brenac, P.; Buchet, G.; Burney, D.; Cazet, J.; Cheddadi, R.; et al. Biome Reconstruction from Pollen and Plant Macrofossil Data for Africa and the Arabian Peninsula at 0 and 6000 Years. J. Biogeogr. 1998, 25, 1007–1027. [Google Scholar] [CrossRef] [Green Version]
- Marinova, E.; Harrison, S.P.; Bragg, F.; Connor, S.; Laet, V.; Leroy, S.A.G.; Mudie, P.; Atanassova, J.; Bozilova, E.; Caner, H.; et al. Pollen-derived Biomes in the Eastern Mediterranean–Black Sea–Caspian-Corridor. J. Biogeogr. 2018, 45, 484–499. [Google Scholar] [CrossRef]
- Ni, J.; Yu, G.; Harrison, S.P.; Prentice, I.C. Palaeovegetation in China during the Late Quaternary: Biome Reconstructions Based on a Global Scheme of Plant Functional Types. Palaeogeogr. Palaeoclimatol. Palaeoecol. 2010, 289, 44–61. [Google Scholar] [CrossRef] [Green Version]
- Sun, A.; Luo, Y.; Wu, H.; Chen, X.; Li, Q.; Yu, Y.; Sun, X.; Guo, Z. An Updated Biomization Scheme and Vegetation Reconstruction Based on a Synthesis of Modern and Mid-Holocene Pollen Data in China. Glob. Planet. Chang. 2020, 192, 103178. [Google Scholar] [CrossRef]
- Mahler, S.; Shatilova, I.; Bruch, A.A. Neogene Long-Term Trends in Climate of the Colchic Vegetation Refuge in Western Georgia—Uplift versus Global Cooling. Rev. Palaeobot. Palynol. 2022, 296, 104546. [Google Scholar] [CrossRef]
- Utescher, T.; Erdei, B.; Hably, L.; Mosbrugger, V. Late Miocene Vegetation of the Pannonian Basin. Palaeogeogr. Palaeoclimatol. Palaeoecol. 2017, 467, 131–148. [Google Scholar] [CrossRef]
- Wolfe, J.A. A Paleobotanical Interpretation of Tertiary Climates in the Northern Hemisphere: Data from Fossil Plants Make It Possible to Reconstruct Tertiary Climatic Changes, Which May Be Correlated with Changes in the Inclination of the Earth’s Rotational Axis. Am. Sci. 1978, 66, 694–703. [Google Scholar]
- Su, Y.; Guo, Q.; Hu, T.; Guan, H.; Jin, S.; An, S.; Chen, X.; Guo, K.; Hao, Z.; Hu, Y.; et al. An Updated Vegetation Map of China (1:1,000,000). Sci. Bull. 2020, 65, 1125–1136. [Google Scholar] [CrossRef]
- Gesch, D.B.; Verdin, K.L.; Greenlee, S.K. New Land Surface Digital Elevation Model Covers the Earth. Eos Trans. Am. Geophys. Union 1999, 80, 69. [Google Scholar] [CrossRef]
- Miyawaki, A. A Vegetation~Ecological View of the Japanese Archipelago. Bull. Inst. Environ. Sci. Technol. 1984, 11, 85–101. [Google Scholar]
- Suc, J.-P.; Fauquette, S. The Use of Pollen Floras as a Tool to Estimate Palaeoaltitude of Mountains: The Eastern Pyrenees in the Late Neogene, a Case Study. Palaeogeogr. Palaeoclimatol. Palaeoecol. 2012, 321–322, 41–54. [Google Scholar] [CrossRef] [Green Version]
- Huyghe, D.; Mouthereau, F.; Ségalen, L.; Furió, M. Long-Term Dynamic Topographic Support during Post-Orogenic Crustal Thinning Revealed by Stable Isotope (Δ18O) Paleo-Altimetry in Eastern Pyrenees. Sci. Rep. 2020, 10, 2267. [Google Scholar] [CrossRef] [Green Version]
- Ortuño, M.; Martí, A.; Martín-Closas, C.; Jiménez-Moreno, G.; Martinetto, E.; Santanach, P. Palaeoenvironments of the Late Miocene Prüedo Basin: Implications for the Uplift of the Central Pyrenees. J. Geol. Soc. 2013, 170, 79–92. [Google Scholar] [CrossRef] [Green Version]
- Calvet, M.; Gunnell, Y.; Laumonier, B. Denudation History and Palaeogeography of the Pyrenees and Their Peripheral Basins: An 84-Million-Year Geomorphological Perspective. Earth Sci. Rev. 2021, 215, 103436. [Google Scholar] [CrossRef]
- Calvet, M.; Gunnell, Y. Planar Landforms as Markers of Denudation Chronology: An Inversion of East Pyrenean Tectonics Based on Landscape and Sedimentary Basin Analysis. Geol. Soc. Lond. Spec. Publ. 2008, 296, 147–166. [Google Scholar] [CrossRef]
- IGN-MITMA Modelo Digital Del Terreno—MDT25-ETRS89-HU31 2008. Available online: https://centrodedescargas.cnig.es (accessed on 28 January 2023).
- Dunwiddie, P.W. Macrofossil and Pollen Representation of Coniferous Trees in Modern Sediments from Washington. Ecology 1987, 68, 1–11. [Google Scholar] [CrossRef]
- Jiménez-Moreno, G.; Fauquette, S.; Suc, J.-P. Miocene to Pliocene Vegetation Reconstruction and Climate Estimates in the Iberian Peninsula from Pollen Data. Rev. Palaeobot. Palynol. 2010, 162, 403–415. [Google Scholar] [CrossRef]
- Wang, C.W. The Forests of China, with a Survey of Grassland and Desert Vegetation. Rev. Ecol. Terre Vie 1963, 17, 1–260. [Google Scholar]
- Wolfe, J.A. Temperature Parameters of Humid to Mesic Forests of Eastern Asia and Relation to Forests of Other Regions of the Northern Hemisphere and Australasia: Analysis of Temperature Data from More than 400 Stations in Eastern Asia. U.S. Geol. Surv. Prof. Pap. 1979, 1106, 1–37. [Google Scholar]
- Liu, K. Quaternary History of the Temperate Forests of China. Quat. Sci. Rev. 1988, 7, 1–20. [Google Scholar] [CrossRef]
- Kong, W.-S. Vegetational History of the Korean Peninsula: Vegetational History of Korea. Glob. Ecol. Biogeogr. 2000, 9, 391–402. [Google Scholar] [CrossRef]
- Targhi, S.; Barhoun, N.; Bachiri Taoufiq, N.; Achab, M.; Ait Salem, A.; Yousfi, M.Z. Vegetation Climate and Marine Environmental Reconstruction in the Western Mediterranean (Southern Rifian Corridor, Morocco) over the Tortonian-Messinian Transition. Heliyon 2021, 7, e08569. [Google Scholar] [CrossRef]
- Bruch, A.A.; Utescher, T.; Mosbrugger, V. Precipitation Patterns in the Miocene of Central Europe and the Development of Continentality. Palaeogeogr. Palaeoclimatol. Palaeoecol. 2011, 304, 202–211. [Google Scholar] [CrossRef]
- Zidianakis, G.; Iliopoulos, G.; Zelilidis, A.; Kovar-Eder, J. Three (Middle to) Late Miocene Plant Macroremain Assemblages (Pitsidia, Kassanoi and Metochia) from the Messara–Gavdos Region, Southern Crete. Acta Palaeobot. 2020, 60, 333–437. [Google Scholar] [CrossRef]
- Grangeon, P. Contribution à l’étude de La Paléontologie Végétale Du Massif Du Coiron; Université Clermont: Clermont-Ferrand, France, 1958. [Google Scholar]
- Moreno-Domínguez, R.; Diez, J.B.; Jacques, F.M.B.; Ferrer, J. First Macroflora Data from La Val (Late Oligocene/Early Miocene), Estadilla (Huesca, Spain). Hist. Biol. 2015, 27, 469–489. [Google Scholar] [CrossRef]
- Moreno-Domínguez, R.; Cascales-Miñana, B.; Ferrer, J.; Diez, J.B. Acrostichum, a Pioneering Fern of Floodplain Areas from the Late Oligocene Sariñena Formation of the Iberian Peninsula. PLoS ONE 2016, 11, e0162334. [Google Scholar] [CrossRef] [PubMed] [Green Version]


| # | Site Name | Sub-Basin | Stratigraphic Unit | Composite Section | Elements | Age |
|---|---|---|---|---|---|---|
| 1 | Carrer de Bellver de Cerdanya a Pi (B3/BB) | Bellver | LNU | Bellver central lake | Mios | Tortonian |
| 2 | Barranc de Salanca (BS) | Bellver | LNU | Bellver central lake | Mios/Macr | Tortonian |
| 3 | Torrent de Vilella (TV) | Bellver | LNU | Bellver central lake | Mios/Macr | Tortonian |
| 4 | Can Vilella (CV) | Bellver | UNU | Bellver central lake | Mios | Early Messinian |
| 5 | Beders | Bellver | LNU | - | Mios/Macr | Tortonian |
| 6 | Pedrá | Bellver | LNU | - | Macr | Tortonian |
| 7 | Balltarga | Bellver | LNU | - | Mios/Macr | Tortonian |
| 8 | Coll de Saig (CS) | Bellver | LNU | - | Mios/Macr | Tortonian |
| 9 | Sansor mine | Puigcerdà | LNU | - | Mios | Tortonian |
| 10 | Sanavastre mine | Puigcerdà | LNU | - | Mios | Tortonian |
| Pollen Sample | WTEM | TEDE | COMX | COEG |
|---|---|---|---|---|
| CV9 | 18.13 | 16.28 | 17.62 | 17.62 |
| CV8 | 18.73 | 15.90 | 16.83 | 16.83 |
| CV5 | 18.71 | 16.73 | 17.71 | 17.71 |
| CV4 | 18.41 | 15.71 | 17.75 | 17.75 |
| TV7 | 18.15 | 19.82 | 20.64 | 20.64 |
| TV6 | 17.05 | 17.02 | 18.24 | 18.24 |
| TV5 | 20.40 | 23.74 | 22.08 | 21.62 |
| TV4 | 17.26 | 18.50 | 18.81 | 18.81 |
| TV3 | 17.31 | 17.73 | 18.39 | 18.39 |
| TV2 | 17.45 | 17.86 | 18.23 | 18.23 |
| TV1 | 17.81 | 18.99 | 19.74 | 19.74 |
| BS7 | 20.19 | 21.10 | 20.23 | 20.23 |
| BS6 | 18.17 | 19.59 | 20.00 | 20.00 |
| BS5 | 19.85 | 21.22 | 21.17 | 21.17 |
| BS4 | 16.74 | 18.70 | 19.66 | 19.66 |
| BS3 | 16.62 | 15.21 | 17.58 | 17.58 |
| BS2 | 16.86 | 16.63 | 18.94 | 18.94 |
| BS1 | 15.87 | 15.62 | 18.17 | 18.17 |
| BB | 21.85 | 24.69 | 20.30 | 18.48 |
| B3 | 19.21 | 22.65 | 18.00 | 17.17 |
| Pollen Sample | WTEM | TEDE | COMX | COEG |
|---|---|---|---|---|
| MSA21 | 18.20 | 19.28 | 14.49 | 14.49 |
| MSA19 | 17.89 | 16.55 | 13.72 | 13.72 |
| MSA18 | 15.71 | 14.64 | 13.23 | 13.23 |
| MSA17 | 17.18 | 15.08 | 12.85 | 12.85 |
| MSA16 | 14.89 | 13.84 | 12.95 | 12.95 |
| MSA15 | 18.90 | 17.52 | 14.49 | 14.49 |
| MSA14 | 15.31 | 15.18 | 13.48 | 13.48 |
| MSA13 | 17.87 | 16.11 | 13.59 | 13.59 |
| MSA12 | 18.77 | 18.10 | 14.71 | 14.71 |
| MSA11 | 19.24 | 19.31 | 16.31 | 15.99 |
| MSA10 | 19.31 | 19.56 | 15.36 | 15.06 |
| MSA9 | 15.67 | 16.31 | 12.94 | 12.94 |
| MSA7 | 15.61 | 16.88 | 15.31 | 15.31 |
| MSA6 | 17.13 | 18.16 | 15.67 | 15.67 |
| MSA5 | 19.46 | 19.47 | 17.43 | 17.43 |
| MSA4 | 16.00 | 15.79 | 15.19 | 15.19 |
| MSA3 | 20.19 | 23.22 | 18.74 | 17.47 |
| MSA2 | 18.99 | 20.49 | 17.19 | 17.19 |
| MSA1 | 23.46 | 22.50 | 22.50 | 21.53 |
| Pollen Sample | WTEM | TEDE | COMX | COEG |
|---|---|---|---|---|
| VSP4 | 16.78 | 19.03 | 16.11 | 16.11 |
| VSP3 | 20.94 | 25.00 | 20.07 | 19.10 |
| VSP2 | 16.33 | 19.49 | 17.50 | 17.50 |
| VSP1 | 12.76 | 13.77 | 15.39 | 15.39 |
| MSP31 | 14.42 | 16.52 | 15.74 | 15.74 |
| MSP27 | 11.51 | 10.27 | 12.78 | 12.78 |
| MSP21 | 16.09 | 13.83 | 14.94 | 14.94 |
| MSP19 | 17.45 | 15.40 | 15.70 | 15.70 |
| MSP18 | 17.12 | 16.65 | 15.99 | 15.64 |
| MSP16 | 17.72 | 19.53 | 17.61 | 17.61 |
| MPS15 | 16.57 | 18.82 | 16.97 | 16.97 |
| MSP13 | 16.77 | 13.25 | 14.83 | 14.83 |
| MSP12 | 16.25 | 13.72 | 14.89 | 14.89 |
| MSP11 | 17.20 | 15.26 | 13.90 | 13.90 |
| MSP10 | 15.61 | 15.79 | 13.98 | 13.98 |
| MSP7 | 16.49 | 14.26 | 15.22 | 13.94 |
| MSP3 | 17.05 | 16.38 | 13.93 | 13.93 |
| MSP2 | 17.83 | 16.58 | 13.52 | 13.52 |
| MSP1 | 14.89 | 13.91 | 13.09 | 13.09 |
| Pollen sample | WTEM | TEDE | COMX | COEG |
|---|---|---|---|---|
| Torrent de Vilella | 29.20 | 25.22 | 21.16 | 18.41 |
| Barranc de Salanca | 29.93 | 24.88 | 23.16 | 19.43 |
| Beders | 30.03 | 26.37 | 20.09 | 14.78 |
| Balltarga | 28.05 | 19.38 | 18.08 | 13.58 |
| Pedrá | 26.86 | 22.28 | 16.46 | 13.70 |
| Coll de Saig | 31.53 | 21.85 | 18.86 | 15.65 |
Disclaimer/Publisher’s Note: The statements, opinions and data contained in all publications are solely those of the individual author(s) and contributor(s) and not of MDPI and/or the editor(s). MDPI and/or the editor(s) disclaim responsibility for any injury to people or property resulting from any ideas, methods, instructions or products referred to in the content. |
© 2023 by the authors. Licensee MDPI, Basel, Switzerland. This article is an open access article distributed under the terms and conditions of the Creative Commons Attribution (CC BY) license (https://creativecommons.org/licenses/by/4.0/).
Share and Cite
Altolaguirre, Y.; Postigo-Mijarra, J.M.; Casas-Gallego, M.; Moreno-Domínguez, R.; Barrón, E. Mapping the Late Miocene Pyrenean Forests of the La Cerdanya Basin, Spain. Forests 2023, 14, 1471. https://doi.org/10.3390/f14071471
Altolaguirre Y, Postigo-Mijarra JM, Casas-Gallego M, Moreno-Domínguez R, Barrón E. Mapping the Late Miocene Pyrenean Forests of the La Cerdanya Basin, Spain. Forests. 2023; 14(7):1471. https://doi.org/10.3390/f14071471
Chicago/Turabian StyleAltolaguirre, Yul, José Mª Postigo-Mijarra, Manuel Casas-Gallego, Rafael Moreno-Domínguez, and Eduardo Barrón. 2023. "Mapping the Late Miocene Pyrenean Forests of the La Cerdanya Basin, Spain" Forests 14, no. 7: 1471. https://doi.org/10.3390/f14071471