Article

Effects of Changing Restoration Years on Soil Nutrient Traits and Plant Community Diversity in a Phosphate Mining Area

1
College of Resources and Environment, Yunnan Agricultural University, Kunming 650201, China
2
Faculty of Animal Science and Technology, Yunnan Agricultural University, Kunming 650201, China
3
Yunnan Phosphate Chemical Croup Co., Ltd., National Engineering and Technology Center for the Development & Utilization of Phosphorous Resources, Kunming 650600, China
*
Author to whom correspondence should be addressed.
Forests 2023, 14(7), 1468; https://doi.org/10.3390/f14071468
Submission received: 30 May 2023 / Revised: 12 July 2023 / Accepted: 14 July 2023 / Published: 18 July 2023
(This article belongs to the Special Issue Forest Vegetation and Soils: Interaction, Management and Alterations)

Abstract

:
The thinning vegetation and soil erosion problems left behind by extractive mining have caused serious environmental pollution, and vegetation restoration is one of the effective strategies to counter them. To study the effects of vegetation restoration on plant community species diversity, soil carbon, nitrogen and phosphorus, and the response of their plant community succession, four communities of different ages (1, 7, 10, 40) and one natural forest (>50 years) in the Kunyang phosphate mine were selected, and the analysis was carried out using the methods and protocols for plant community inventory. The species composition was recorded, and soil was collected from 0–60 cm in each community to determine the response of soil nutrients and plant diversity to the restoration process. The results show that the species richness of the community increases with the restoration year, the species composition at 40 years of restoration is similar to that of the natural forest, and the Shannon–Wiener diversity index in the tree layer at 40 years of restoration is greater than in the natural forest. Soil pH showed a decreasing trend with restoration year, and TP and AP increased with increasing time series. And the linear stepwise regression analysis showed that soil pH, soil organic carbon (SOC), total phosphorous (TP), available phosphorous (AP), and restoration year were the main factors of plant diversity. Compared to restoration of 10 years, TP and AP at the restoration of 40 years increased to 11.9–20.0 g∙kg−1 and 33.4–75.5 mg∙kg−1. The SOC of the community reached a maximum at 40 years of restoration, 1.5, 2.8, and 2.4 times higher at 0–20 cm, 20–40, and 40–60 cm, respectively, than at 1 year. The organic carbon fraction increased with the restoration year in an ‘N’ pattern, and mineral-associated organic carbon (MOC) and unstable organic carbon fraction decreased at 10 years and 40 years of restoration. The SOC of natural forests decreased, but stable organic carbon increased. The soil pH, SOC, and organic carbon fraction of the communities decreased with increasing soil depth, while TP and AP increased with increasing soil depth at the later period of restoration. In general, with extended restoration years, 40 years plant of restoration in phosphate mines can be expected to allow for plant community succession to climax community, and the key influence on plant diversity are the phosphorus and stable carbon fractions. These results are expected to facilitate the future basis for vegetation succession and restore systems during mining area restoration.

1. Introduction

Humans have a long history of exploitation and use of mineral resources, and the rapid economic development of some regions is inextricably linked to the exploitation and use of mineral resources, but large-scale mining has led to a decline in soil fertility, a sharp decline in plant diversity, and serious environmental damage [1], while the ecological stability of mining areas is further threatened by the violent disturbance of “stratification, stripping, handling and disposal”. As sustainable development progresses, researchers have also taken a number of steps to restore the services of the mining ecosystem [2,3]. Phytoremediation is considered to be an effective way to restore land productivity and ecological stability in mining areas [4]. The natural vegetation restoration process is prolonged, and it usually takes 50–100 years for a good vegetation cover to develop due to the lack of soil and water conditions and nutrient supply in the mining area [5]. Therefore, vegetation succession in mining areas is often supplemented by artificial methods, and appropriate artificial adjustment and vegetation community construction can accelerate the rate of vegetation succession and promote the vegetation restoration process [6,7]. Plant community composition and diversity are major determinants of plant community structure and type and are often used as indicators to describe the direction, rate, and stability of community succession. Vegetation succession and biodiversity have been a hot topic of research in vegetation restoration, and with increasing successional chronology, higher plant diversity has been shown to increase ecosystem function and stability [8].
Soil provides the material basis for plant growth, and soil factors directly or indirectly influence vegetation growth and plant diversity. Soils are severely damaged after mining, with high pH and low total soil carbon, total nitrogen (TN), total phosphorus (TP), and available phosphorous (AP), while in the revegetated areas, pH decreases significantly, and fast-acting potassium increases [9]. Plant–soil relationships are a key factor in vegetation restoration and management strategies [10]. Soil quality determines the nature of vegetation succession and the effectiveness of ecological restoration [11], and soil development is influenced by plant communities through changes in abiotic soil conditions such as chemosensory substances, nutrient effectiveness, and soil structure [12]. At the same time, the soil being altered can also alter the growth of that plant, creating positive or negative feedbacks that influence the composition of the plant community and soil interactions [12,13,14]. Soil nutrients are generally positively correlated with plant diversity [15], but it has also been shown that the diversity of plants in the herbaceous layer is reduced in areas with high soil nutrients [16]. It is important not to overlook the changes in the time series during the vegetation restoration process, with soil nutrients being affected to different degrees by different successional stages. Generally, vegetation restoration has focused on re-establishing historical abiotic conditions, and once the historical physical environment has been re-established, the vegetation will, as time passes, reach a state similar to that of the surrounding natural forest ecosystems [17,18]. Some studies have shown that as restoration time increases, vegetation diversity decreases and the entire ecosystem may be transformed into a climax community, with huge tree biomass providing stability in the ecosystem [19]. In addition, during the restoration process, plant species are fewer, such as monocultures or economic crops as the main purpose of restoration, and the direction and rate of community succession in later stages may be influenced by the selection of early species [20].
Yunnan’s central region has the largest phosphate mining area and chemical base in China, where the Kunyang phosphate mine in the south has a unique geological structure and rich phosphorus content in the strata, but the surface soil and vegetation are severely damaged during the mining process. The Kunyang phosphate mine has made efforts to reclaim land and improve the ecological environment in strict accordance with the principle of “treating the mine as it is mined” since 1965 and has carried out timely vegetation reclamation of the mined areas, abandoned drainage sites, and temporarily unused mining sites. The mine has been extensively reported in recent years, and Yuan et al. conducted a study on soil nutrients in artificially restored woodlands in the Kunyang phosphate mine extraction area, which showed that soil organic matter was generally low, nitrogen was generally deficient, phosphorus levels were high, and potassium content was moderate in the vegetated restoration area; in addition, soil phosphorus and total potassium content gradually increased with the extension of the restoration period in the natural state [21]. Indigofera tinctoria L. is a pioneer tree species for slope restoration in phosphate mine drainage sites, where the nutrient content of soil total nitrogen, effective phosphorus, and fast-acting potassium is increased [22]. However, for phosphate mine reclamation sites, the effect of different restoration years on plant community diversity and on soil nutrients in the vertical layer is unclear, and the carbon, nitrogen, and phosphorus content may be changed by different plant diversity, especially in the phosphate mine areas around Dianchi Lake, where the loss of phosphorus and organic carbon is a major factor contributing to surface source pollution. And the conversion and storage of SOC during community succession is influenced by the stability of organic carbon, which has an important role in soil nutrient and quality [23]. Therefore, it is necessary to study the response of soil nutrient characteristics to plant diversity at different successional stages. In order to study the vegetation conditions and changes in soil properties around the phosphate mine area at different restoration years, in this study, plant communities in 1 year, 7 years, 10 years, and 40 years of restoration communities and natural forest communities were selected as experimental sample sites, and the plant species composition and their diversity of different community tree, shrub, and herb layers were compared using community survey methods, combined with different depth. In order to explore the development of vegetation communities around phosphate mines and the main factors limiting the diversity of communities, the plant species composition and diversity in different communities were compared using community survey methods. In conjunction with the characteristics of soil nutrient changes at different depth, the influence of plant communities on soil development was analyzed in hopes of providing a scientific basis for future ecological restoration of mining areas.

2. Materials and Methods

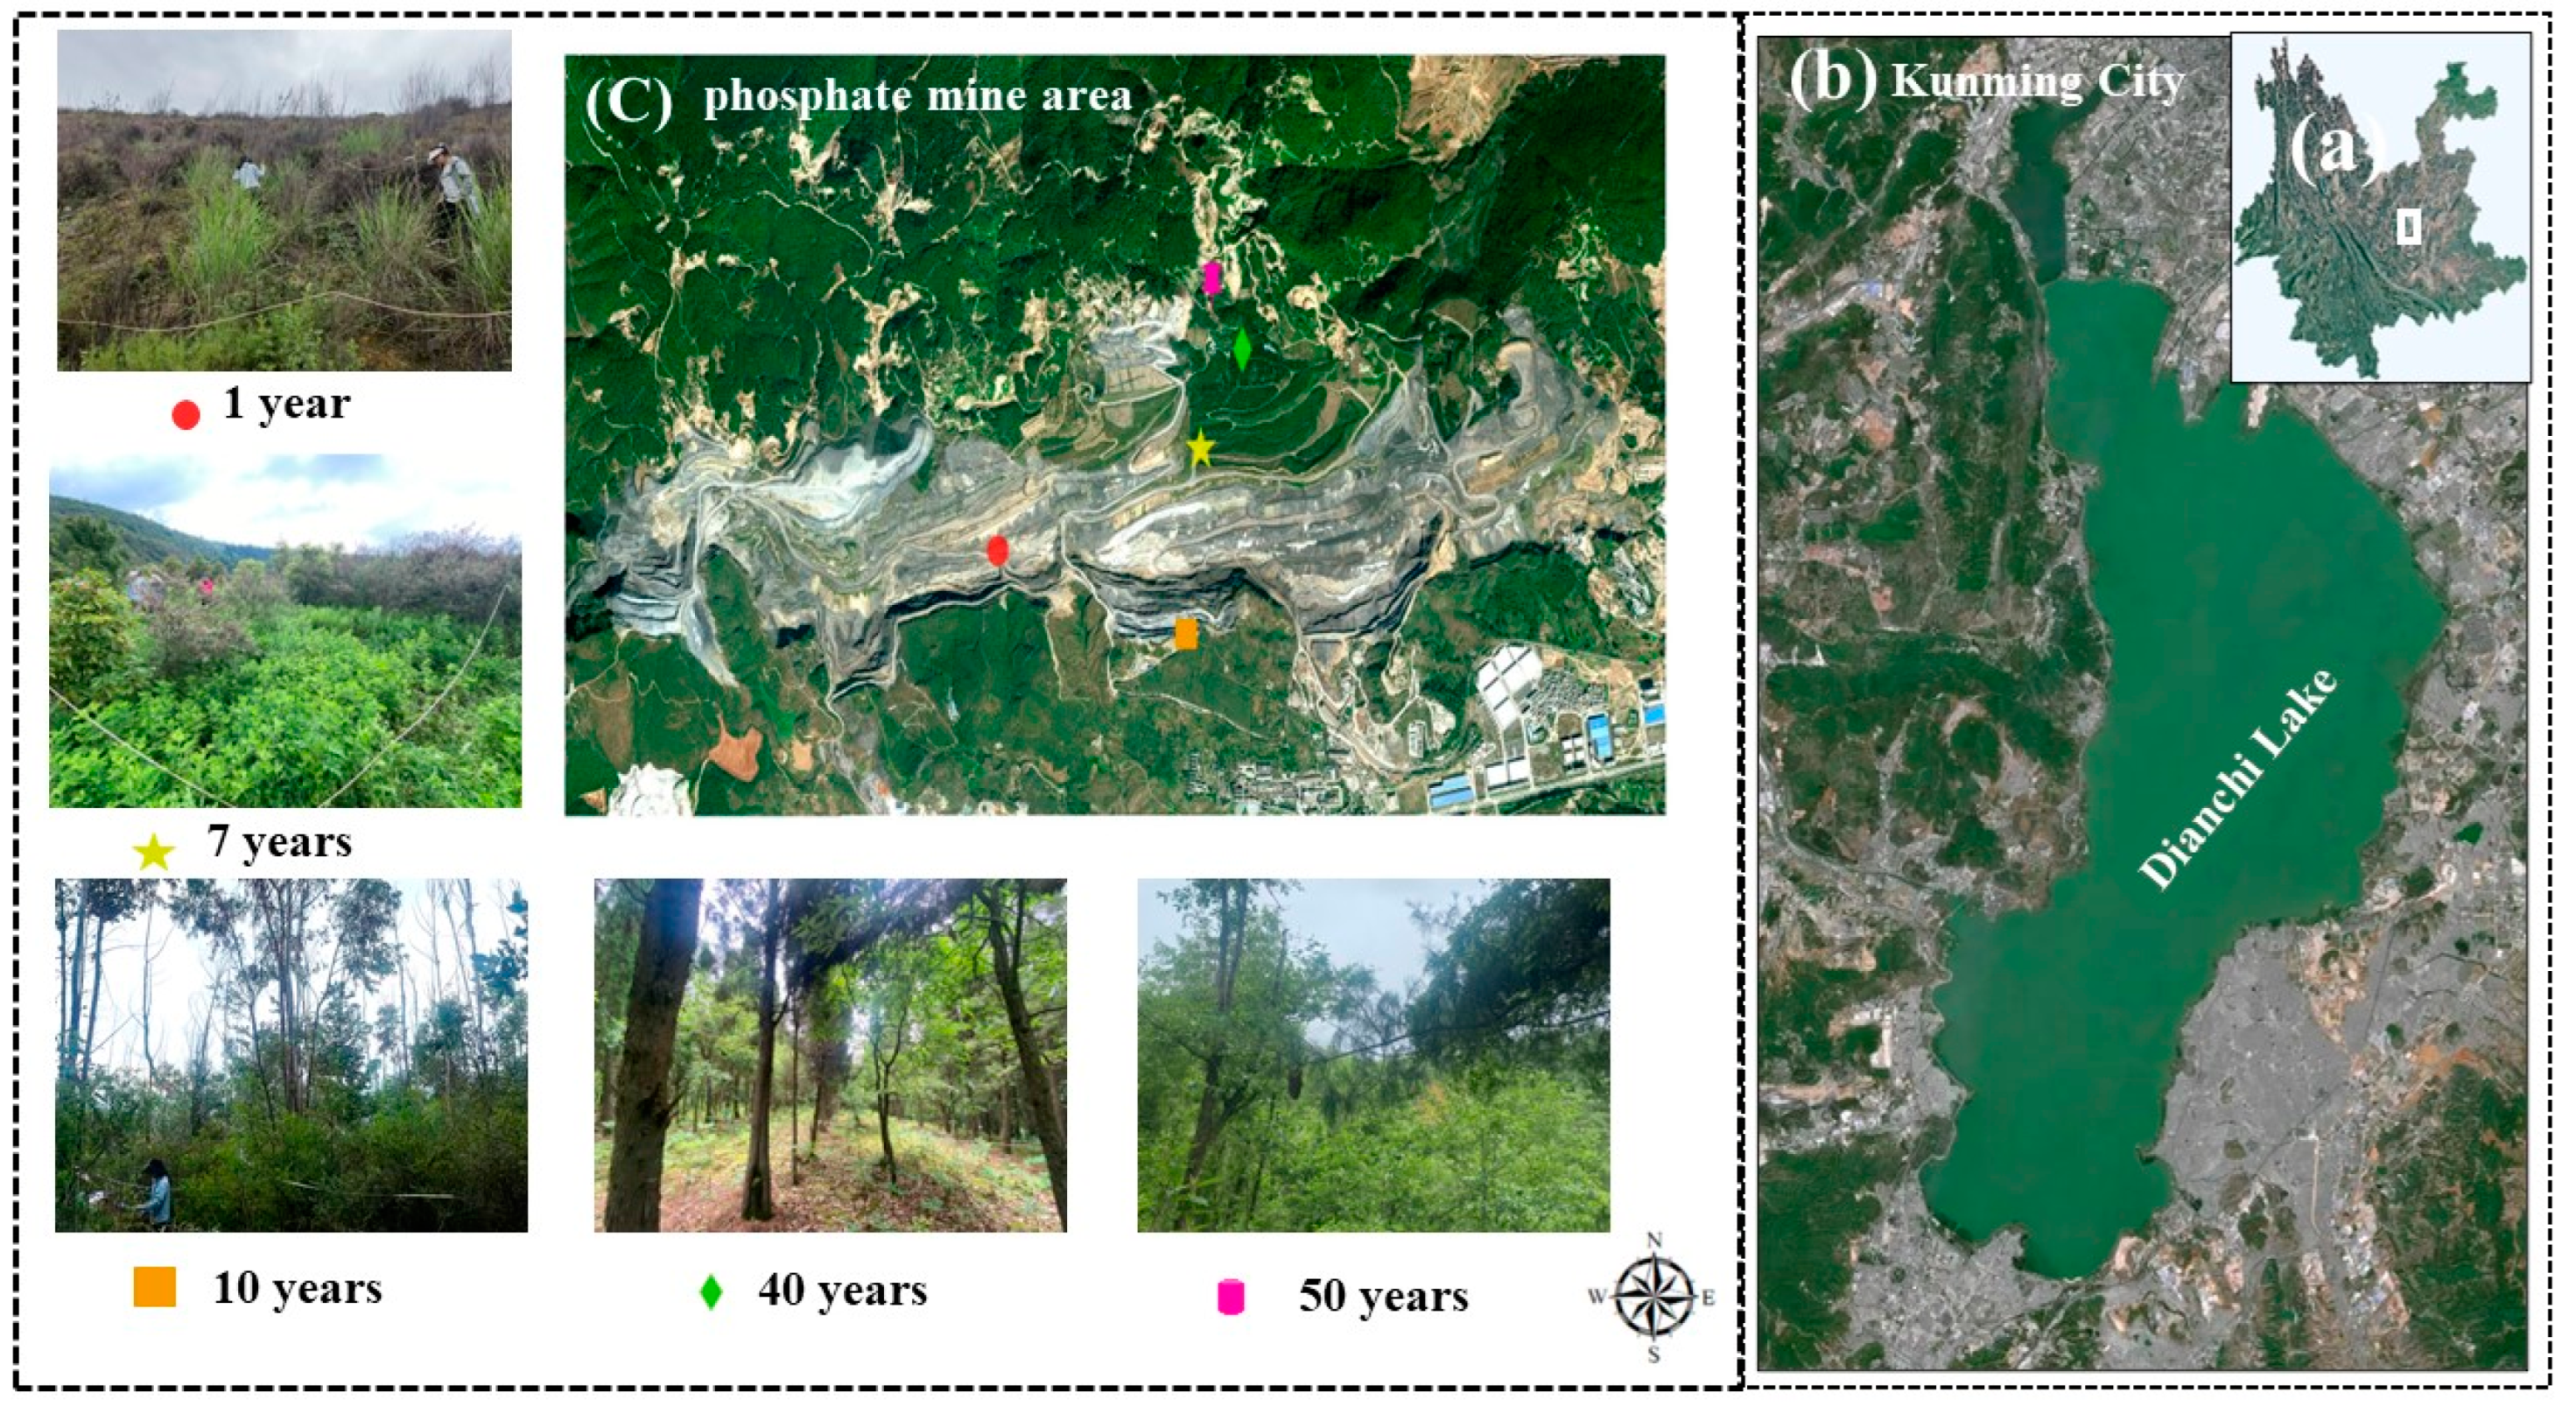
2.1. Study Site Description

The test site is located in the Kunyang phosphate mine, Jinning District, Kunming City, Yunnan Province (E: 102°54′73″–102°55′23″, N: 24°72′23″–24°72′39″), elevation 1950~2400 m above sea level, and belongs to a medium cut hilly landscape (Figure 1). The average annual temperature is 15.7 °C, with a maximum of 33 °C and a minimum of −5.4 °C. The rainy and dry seasons are distinct, with rainfall mostly concentrated between June and October, with an annual rainfall of about 1000 mm.

2.2. Sample Site Survey

In this study, five sample plots were selected within the mine site in June 2022 for a plant community survey based on soil use type and the timing of vegetation restoration. A 10 m × 10 m tree sample plot was randomly set up within the sample plot with relatively uniform community structure and habitat. According to the methods and protocols for plant community inventory [24], the habitat characteristics (elevation, slope, slope direction) and species information (tree name, number of plants, height, diameter at breast height) in the tree layer were recorded. Sample plots with 5 m × 5 m and 1 m × 1 m in the shrub layer and herb layer, respectively, were selected within 10 m × 10 m, and the plant species names, numbers, and height in the sample plots were recorded. The percentage of the vertical projection area of the aboveground part of the plant in the sample area was used as the vegetation coverage survey method. Basic information on the different communities is given in Table 1.

2.3. Soil Collection and Determination Indicators

Three soil sections were randomly set up in the 10 m × 10 m sample plots as sampling points, and 45 soil samples were taken from the 0–20 cm, 20–40 cm, and 40–60 cm layers using the five points method and mixed uniformly. The soil samples were taken back to the laboratory and divided into two parts. After removing visible impurities and plant roots, one part of the fresh soil sample was used for the determination of dissolved organic carbon (DOC) and the other part was naturally air-dried and passed through a 2 mm nylon sieve for TN, TP, available nitrogen (AN), AP, soil organic carbon (SOC), readily oxidizable carbon (ROC), light organic carbon (LOC), light fraction organic carbon (LFOC), particulate organic carbon (POC), and mineral-associated organic carbon (MOC) content.

2.4. Soil determination Methods

In the laboratory, chosen physicochemical analyses were performed including the following: pH at 1:2.5 (m/v) soil/water mixture was shaken for 30 min at room temperature (26 °C) and left for 5 h before determination with digital pH meter (ATARTER 3100); TN was determined using automatic nitrogen determination after the soil was decocted with H2SO4 acid; AN was determined using the NaOH diffusion method; TP was determined using Mo-Sb Anti-spectrophotometer method (700 nm) after melting with NaOH; AP was determined with spectrophotometric (700 nm) using 0.5 mol/L NaHCO3; SOC was determined using potassium dichromate volumetric method [25]; fresh soil samples were mixed at a ratio of 1:5 (m/v) soil/water, shaken, centrifuged, and filtered; DOC was determined using potassium dichromate method; ROC was determined using potassium permanganate oxidation method; LPOC was determined using 1.70 g/cm3 NaI density method, and after separation, it was determined using the potassium dichromate method; and POC and MOC were separated with (NaPO3)6 and then determined using the potassium dichromate method [26].

2.5. Statistical Analysis

The data were collected, and the standard curves for available phosphorus, total phosphorus, total nitrogen, and available nitrogen were analyzed using Microsoft Excel 2010 (Redmond, WA, USA). One-way analysis of variance (one-way ANOVA), a significance test (Duncan’s method, p = 0.05) correlation analysis, and linear stepwise regression analysis were carried out using IBM SPSS Statistics 23.0 (Chicago, IL, USA). The data obtained were expressed as mean ± standard deviation (n = 3); figures were drawn using Origin 2022. The international standard ecological software Canoco 5.0 was used to perform the RDA data operations, and the relationships between plant community characteristics and soil factors were expressed using RDA two-dimensional ordination plots.
Species diversity was determined using the Shannon diversity index (H′), the species richness index (R), the Pielou’s evenness index (J), and the Simpson diversity index (D) for description. The formulas were calculated as follows:
H = i = 1 s P   i ln P   i
R = S
J = H ln s
D = 1 i = 1 s P i 2
P i = N i / N
where “S” is the number of species in the sample; “N” is the total number of individuals of each species; and “Pi” is the multiplicity ratio of the i-th species in the ground.

3. Results

3.1. Plant Community Composition

A plant community survey of five sample sites around the phosphate mine area (Table 2) identified a total of 34 plant species, including trees, shrubs, and herbs, belonging to 24 families and 32 genera. As shown in Figure 1, the three communities were restored for 10 years, 40 years, and natural forest trees, including Eucalyptus pellita F. Muell., Cupressus duclouxiana Hickel, hemp oak Quercus acutissima Carruth., Quercus aliena Bl., Pinus armandii Franch., and Alnus cremastogyne Burk.. In the shrub layer, which was present in all four communities except for the 40 years of restoration community, the most shrub plants occurred in the 10 years community, including Cotoneaster pannosus Franch., Osyris wightiana Wall. Ex Wight var. stipitate, Lespedeza bicolor Turcz., and Myrsine africana L., and the 7-year and 1-year communities were dominated by Indigofera tinctoria L. and Buddleja asiatica L., which accounted for 85% and 100% of the total number of individuals of shrub layer species in this community, respectively. In the natural and 40 years of restoration communities, the herb layer was richer in species, with the natural forest dominated by Eupatorium coelestinum L. and Pteris ensiformis, accounting for 41% and 38% of the total number of individuals in the herb layer in this community, respectively. The 40 years of restoration community was dominated by Paeonia suffruticosa Andr., accounting for 92%. In the 10-year community, E. coelestinum and Lophatherum gracile Brongn. each accounted for 40%, while in the natural forest community, L gracile accounted for only 5%. The restored 7-year and 1-year herb layers included Artemisia argyi Lévl. et Van. and Medicago sativa L.

3.2. Species Diversity in Communities

As shown in Figure 2A, tree, shrub, and herb layers were all present in the community after 10 years of restoration, with a higher number of species of 33% in restoration of 40 years, but no shrub layer was present in this community, and the shrub layer had the highest number of species in the 10 years of restoration, accounting for 50% of the whole community. Between the 1-year and 10-year growth series, the number of shrub species gradually increased with restoration years, but the number of species in the herb layer gradually decreased, with the highest number of species in the herb layer at 1-year, accounting for 75% of the entire community, with little difference in the number and percentage of species in the herb layer between the restored for 40 years and natural forest. In the natural forest communities, H′ was greatest in the herbaceous and shrub layers (Figure 2B), and H′ was similar for the 1, 7, and 10-year communities. The species richness of the communities at 50 years of restoration was 3 and 2.4 times higher than that of the 1 and 7-year communities, respectively (Table 3), and the J and D showed similar trends, with a maximum at 10 years.

3.3. Nutrient Characteristics of Soils

From Figure 3A,B, it can be seen that in the 0–20 cm, 20–40 cm, and 40–60 cm soil layers, the TN content of the community in the restored for 1 year and natural forest gradually decreased with soil depth, which is in contrast to the change in TN content in the restored 10 for years community, which gradually increased with soil depth, with the highest TN content of 1.1 in the 40–60 cm soil layer (p < 0.05). The highest total N content in the 40–60 cm soil layer was 1.1 g∙kg−1 (p < 0.05), which was 6.25 times higher than in the natural forest. The TN and AN content of the same soil layer in different communities showed a rising and then declining trend with increasing restoration age. The 10-year community had the highest AN content, with 76.3 mg∙kg−1 in the 0–20 cm soil layer, and there was no significant difference in the AN content of the other communities except for the 7-year community (p > 0.05). The TP and AP content of the same soil layer decreased and then increased with increasing restoration year (Figure 3C,D), with the 50-year community having the highest TP content in the 0–20 cm, 20–40 cm, and 40–60 cm soil layers, at 22.8, 22.2, and 25.7 g∙kg−1, respectively (p > 0.05). The TP content of the restored 40 years and natural forest communities gradually increased with soil depth, while the TP content of the 7 years and 10 years communities did not change with soil depth. Similar to the change in TP, the content of AP in the same soil layer gradually increased with the restoration years, higher in the restored 40 years and natural forest communities, and increased with soil depth in the 1, 7, 10, and 40-year communities, except for the natural forest communities where the content of AP gradually decreased with soil depth.
Soil pH gradually decreases with increasing restoration years (Figure 3E), and the pH is close to neutral at 1 and 7 restoration years and gradually decreases with soil depth at 10 and 40 years of restoration and in natural stands, with an overall acidic pH.
The SOC content of plant communities in the phosphate mine area ranged from 3.1–31.4 g∙kg−1 at different restoration ears (Figure 4A), with the SOC content of annual communities remaining higher with increasing restoration years at soil levels of 0–20 cm, 20–40 cm, and 40–60 cm and 2.7, 2.6, and 1.9 times higher at 40 years of restoration than at 10 years of restoration. The DOC content of all communities, except for the community recovered for 40 years, showed the highest content in the 0–20 cm soil layer (Figure 4B), which gradually decreased with longer restoration years, and the DOC content of each community also gradually decreased with the depth of the soil layer. The DOC content of all communities, except for the community recovered for 40 years, showed the highest content in the 0–20 cm soil layer (Figure 4B), which gradually decreased with longer restoration years, and the DOC content of each community also gradually decreased with the depth of the soil layer. ROC, LPOC, POC, and MOC content showed an overall “N” pattern with increasing restoration years (Figure 4B–F), with the highest ROC, LPOC, and POC in the 0–20 cm soil layer at 10 years of restoration, and the highest MOC in the 0–20 and 20–40 cm soil layers at 7 years of restoration. The highest MOC was reached at 7 years of restoration. The organic carbon fraction of each community showed an overall decreasing trend with increasing soil depth.

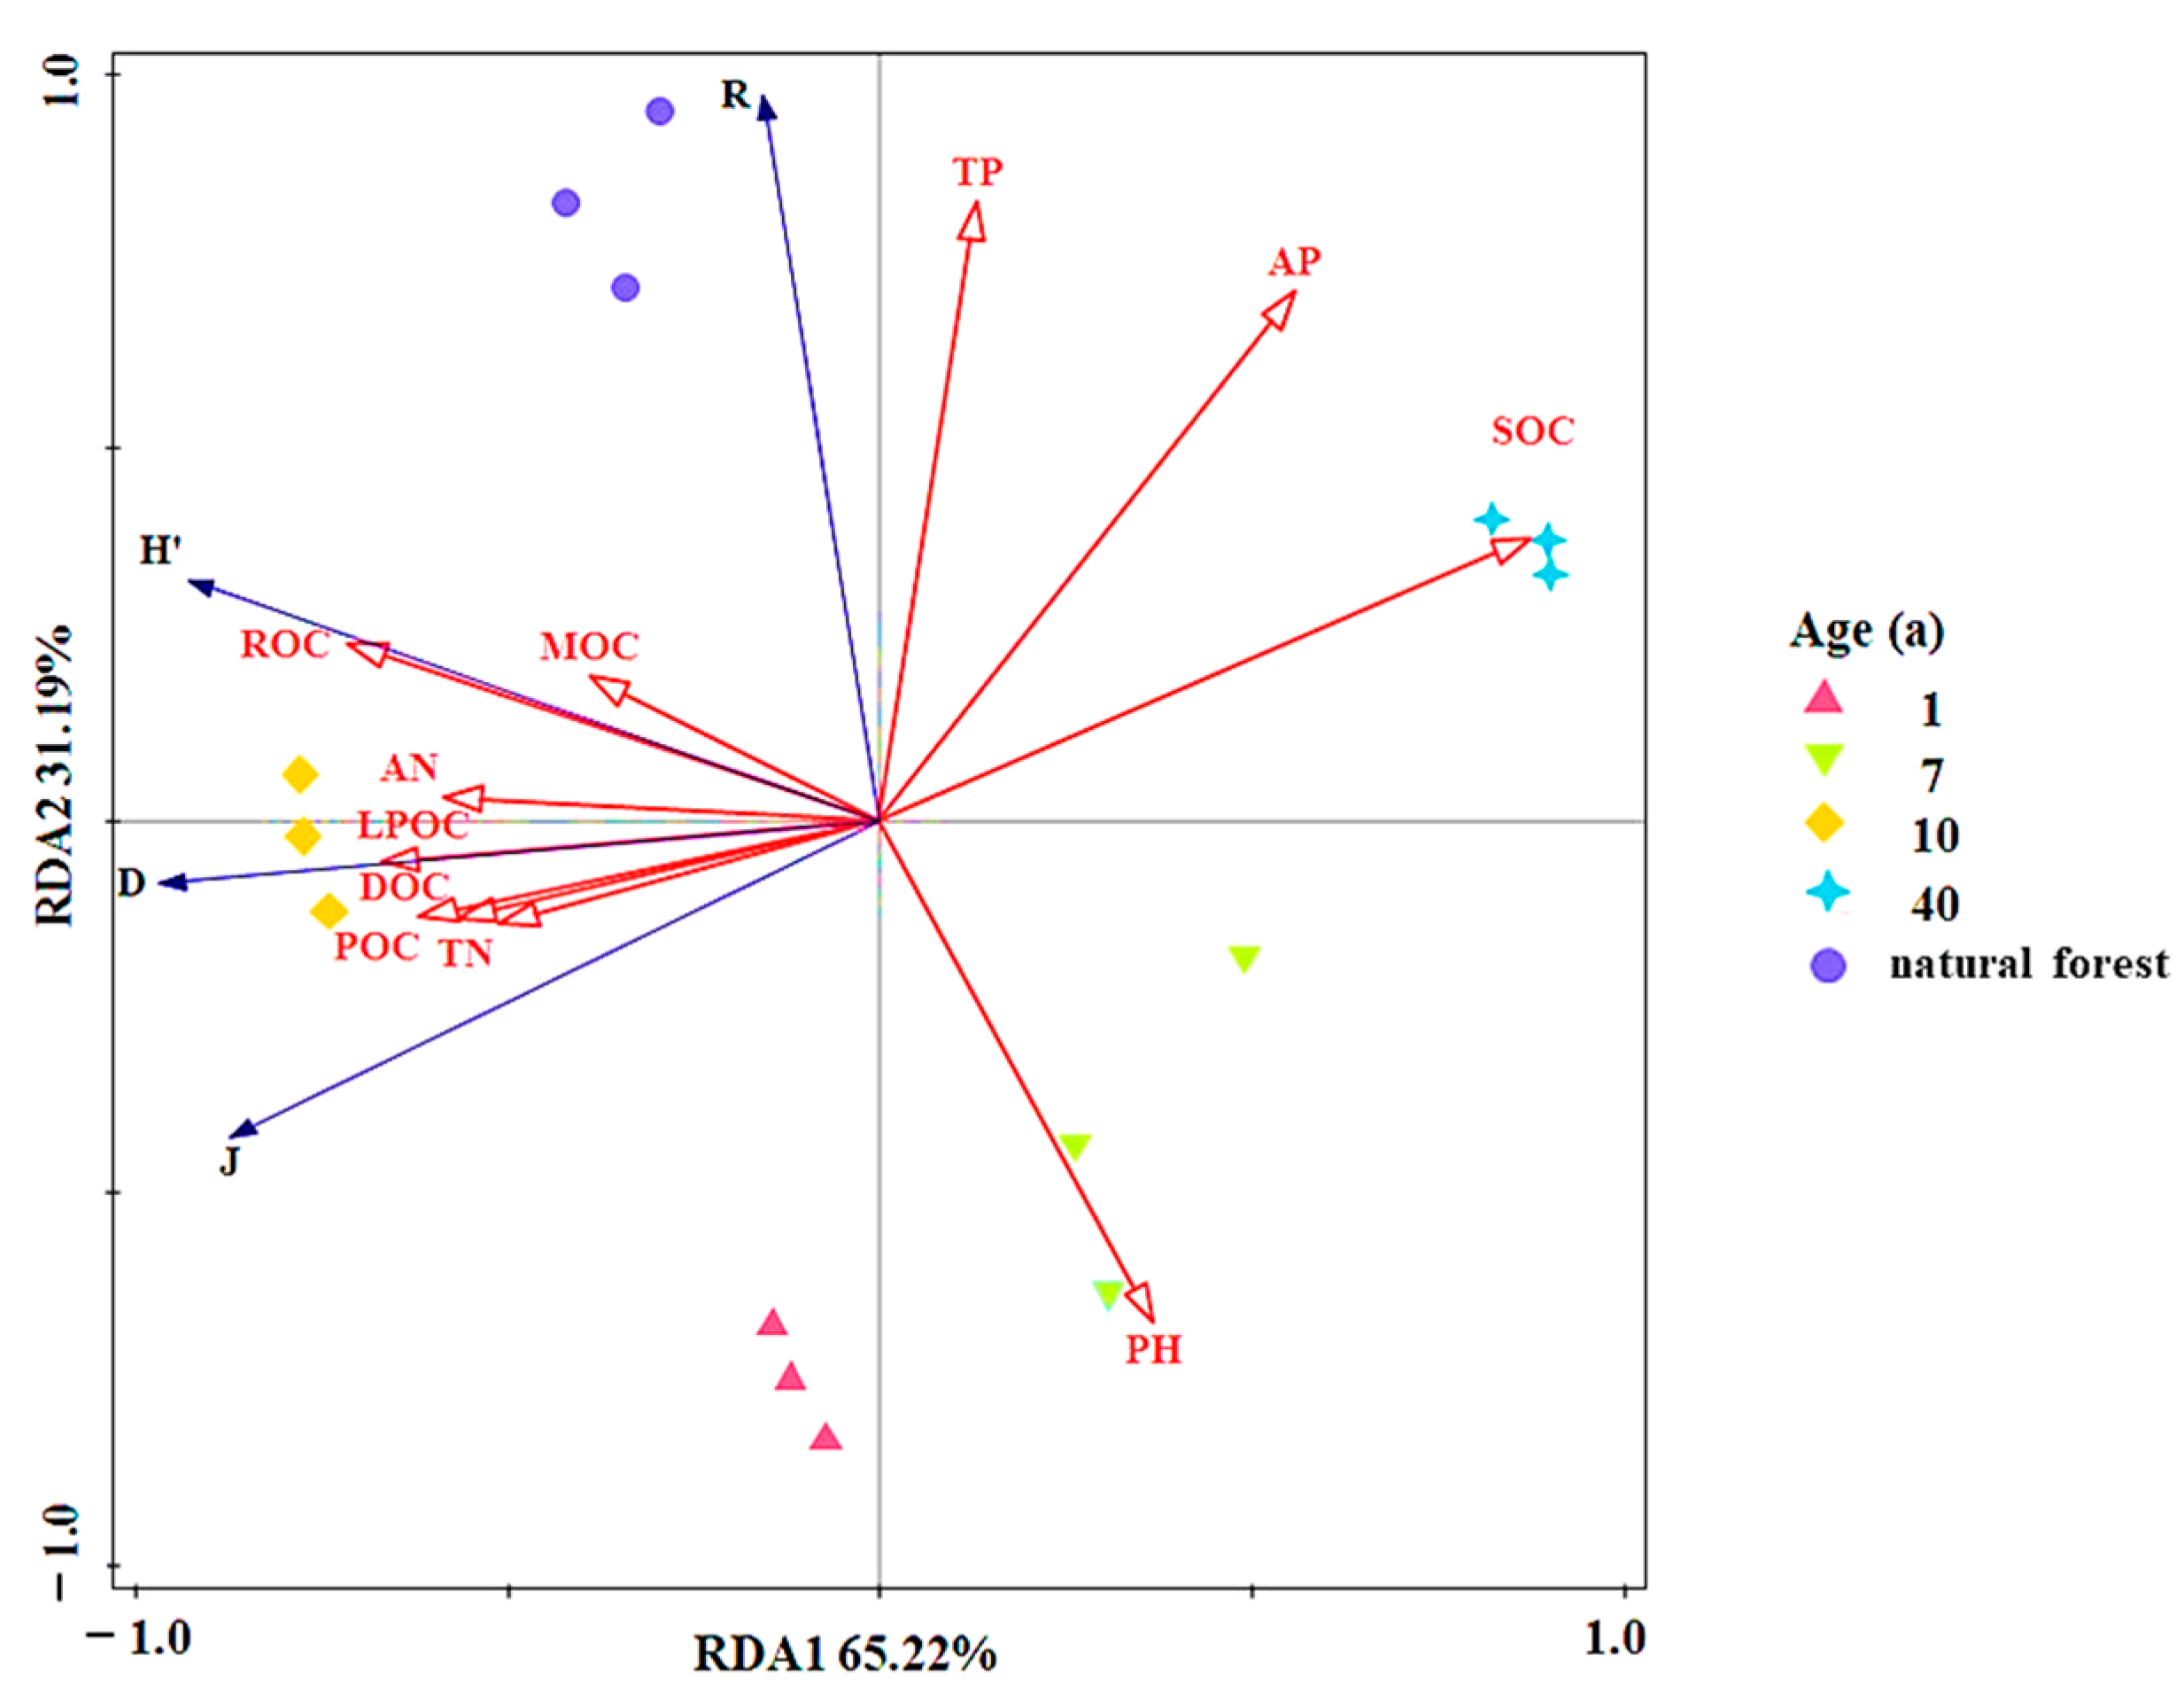
3.4. Relation between Plant Diversity to Soil Nutrients and Restoration Years

A correlation analysis between species diversity and soil physicochemical properties in the sample sites around the mine is shown in Table 4. The H′ and D were highly significantly and positively correlated with soil total nitrogen content and highly significantly and negatively correlated with soil organic matter content. In addition, H′ and D were significantly correlated with POC and MOC content, respectively (p < 0.05). The S was highly significantly and positively correlated with soil pH, TP, and AP content (p < 0.01), and the J was significantly and negatively correlated with soil pH (p < 0.01) and SOC (p < 0.05) and positively correlated with AN content and TP content (p < 0.05). The and D were highly significant and positively correlated with the R. Therefore, the J was selected as a species variable. Table 5 shows that soil pH, SOC, TP, AP, and restoration year had highly significant effects on the J (p < 0.001). Soil pH had the greatest effect on the J (26.5%), followed by SOC (6.9%), TP (2.9%), AP (0.8%), and restoration age (7.4%).
The different community diversity indicators were set as environmental response variables, and the soil nutrient indicators were used as environmental factors. The results of the RDA ranking of the soil environmental factors in the different communities are shown in Figure 5. Axis 1 and axis 2 explained 65.22% and 31.19%, respectively, and the two axes can better reflect the correlation between plant diversity and soil factors present in each community, with axis 1 mainly related to changes in organic carbon fraction, total, and AN content and axis 2 mainly related to TP content and pH.

4. Discussion

4.1. Species Composition and Diversity in Phosphate Mining Areas at Different Restoration Years

Plant communities undergo forward succession with increasing years of restoration and play an important role in stabilizing ecosystems [27]. During the herb–shrub–tree succession, the number of species in the community gradually increased (Table 2), and the number of species in the community changed as the succession progressed. The Shannon diversity index for the tree layer of the 40-year community was 1.83 times higher than that of the natural forest, indicating that the tree layer of the 40-year community had the highest species diversity but did not reach the climax community, and that in the subsequent succession process, the restored 40-year community evolved towards the climax community, with the dominant species of the community becoming more prominent and species diversity reduced [28]. Furthermore, the diversity of plant species varied at different levels of the community, as the diversity of the herb layer of the natural forest increased compared to that of the 40-year restored community. The herb layer of these two communities had a larger number of species of E. coelestinum, P. ensiformis, P. aspericaulis var. cuspigera, L. gracile and P. suffruticosa, all belonging to perennial herb plants. As for the communities at the shorter restoration time of 1 and 7 years, the number of species in the communities was low and dominated by shrubs and herbs. With the increase in restoration years, shrub species gradually increased, and herb species gradually decreased, and the R and J of the communities showed a gradually increasing trend (Table 3). This is similar to the trend in vegetation succession in mines by Li et al. [27]. For restored areas with a short growth period, the process of changing from a former mining system to a near natural forest-grass ecosystem will release more ecological niches, and some pioneer grass species will rapidly settle and multiply. Relatively vast ecological niches are occupied [29], as in the naturally restored 1-year community in this study. The species that accounted for a relatively large number of species were the annual herb plants, like M. sinensis and R. hastatus; they form a simple structure with prominent dominant species. On the other hand, natural succession eventually leads to a stable species diversity and species richness [30]. There is an increase in the variety of community species composition at 40 and 50 years of restoration, but the decrease in the number of shrub species and the increase in herb plants, a phenomenon that is contrary to the change at shorter restoration years and the gradual dominance of perennial herbaceous plants, are consistent with the results of various studies on the change in vegetation restoration in mining areas with the number of years of restoration [31,32]. In the process of community succession, annual herbs are often succeeded by perennial herbs, which tend to reproduce mainly by seeds, and though the reproductive capacity is relatively weak, they have a strong ability to reproduce through roots and stems and can easily form more stable populations after settlement [33], while communities of seed origin also have a higher diversity [34]. Therefore, perennial herbaceous plants are more likely to form diverse and stable communities during the revegetation of mining areas.

4.2. Soil Nitrogen and Phosphorus Nutrient Characteristics in Different Restoration Years

Plant growth–soil generation is a complementary process, with plant growth taking up a lot of soil resources and nutrients, and as plant diversity is restored, soil resources and turnover rates rise [35]. In this study, the soil TP and AP showed a trend of first decreasing and then increasing with the restoration years. The 1-year restored community had higher TP and AP than both the 7-year and 10-year restored communities, which may be due to the 1-year community growing near the phosphate mine area drainage site, where some phosphate ore was mixed in during the collection of soil and soil drainage after phosphate mining. With the decrease in soil pH (Figure 3C–E), the phosphorus in the phosphate ore gradually weathered and released, and the short-term phosphorus content in the soil was higher. Compared to the 7-year restored community, most of AP was taken up by plants; soil pH increased, and phosphorus sorption decreased, which is consistent with the findings of Nobile et al. [36]. Soil N content in restored 1, 7, and 40-year restored and natural forest does not vary significantly with the number of restoration years. However, TN and AN content increase significantly at 10 years of restoration, and soil N indicators also tend to increase with increasing soil depth, which is not consistent with changes in N during most vegetation succession [37], which may be related to the trees within the community, in which Eucalyptus trees are predominantly planted, and the rapid growth requires a large accumulation of nitrogen [38]. Fertilizer is an essential nurturing measure during E. coelestinum growth, and supplemental nitrogen fertilizer is especially predominant, so this may be the reason for the high N content for 7 years of restoration.

4.3. Effects of Different Restoration Years on Plant Community Diversity and Soil Organic Carbon

Soil organic carbon affects plant community composition and species diversity and is a key factor in the material cycling process of plant ecosystems [39]. In this study, correlation analysis and linear stepwise regression analysis showed that soil pH, SOC, TP, AP, and years of restoration all explained changes in vegetation diversity in phosphate mining areas better. Soil organic carbon and AP were often considered key indicators of soil restoration, and it was also shown that mixed forests in phosphate mining areas possessed higher soil organic carbon content than single forests after 20 years of restoration [40]. Compared to herb or shrub litter, more advanced tree communities have higher decomposition rates and nutrient return, suggesting that community succession can modify and gradually restore soil organic matter content [41]. RDA analysis showed that with increasing year, pH was no longer the main influencing factor, and its role in self-regulation and vegetation restoration gradually stabilized [42]. SOC, TP, and AP were significantly correlated with community species richness in restored 40 years communities and natural forests, and soil SOC, TP, and AP gradually became limiting factors for plant diversity.
The results show that the organic carbon fractions showed an ‘N’-shaped variation with increasing age (Figure 4) and with the MOC content of 0–20 cm and 20–40 cm soil layers of 10 years of restoration during the decreasing range of the ‘N’-shaped variation, while the content of unstable carbon fractions including ROC, LPOC, and POC in the 0–20 cm layer only showed a significant decreasing trend at 40 years of restoration, indicating that the stable carbon fractions in the 0–40 cm layer are more susceptible to the influence of the vegetation restoration process than the unstable carbon fractions. The persistence of the unstable carbon fraction is mainly influenced by microbial and enzyme inhibition, and the stable carbon fraction is mainly influenced by fraction mineral conjugation [43]. In the first 5 years of vegetation restoration in phosphate mining areas, the mineral composition of the soil, such as calcium (Ca), sulfur (S), and zinc (Zn) elements, is high. As the restoration period is prolonged to 10 years, the MOC may also gradually decrease due to the decrease in the mineral composition of the soil [44]; on the other hand, the stability of SOC is influenced by the vegetation types, litters, root secretions, and root numbers [45]. As the community succession reaches the middle stage, species composition and biodiversity increase. Vegetation types, litters, and root secretions increase, which accelerates the conversion of soil stable carbon fraction to unstable carbon, thus reducing the content of stable carbon fraction and increasing the content of unstable carbon fraction at 10 years of restoration, which is consistent with the results of Xu et al. who found that although the sequestration of soil organic carbon increased during the vegetation restoration process, the stability of soil organic carbon decreased [46]. As the restoration period increases, the SOC content of 0–20 cm, 20–40 cm, and 40–60 cm gradually increases and then slowly decreases, with the highest values occurring in communities that have been restored for 40 years rather than in natural forests that have been growing for 50 years. With the continuous input of C, the SOC pool usually saturates or increases at a decreasing rate with the phenomenon of soil C saturation [47,48]. Natural forests are most affected by C saturation, but the stable organic carbon becomes higher (Figure 4A). In the later stages of vegetation restoration, MOC content gradually decreases with restoration years, but stable organic carbon content is still higher than most unstable organic carbon content at 40 years of restoration, suggesting that during vegetation succession in phosphate mining areas, stable carbon fractions in soils may change towards the carbon sequestration capacity of top communities, increasing soil organic carbon conversion and sequestration in mining areas [44,49]. In summary, the period of restoration affects the variation in soil SOC content, and MOC is the main influence on total SOC in plant communities in phosphate mining areas. An increasing amount of research is now proving that variation depends on the function of the interaction between plant diversity, microbial diversity, and soil function, where microbial accumulation can lead to organic carbon destabilization both through increased respiration and through the accumulation of microbial biomass residues (necromass) [50,51,52]. Hence, there is a need to study the relationship between plant diversity and soil organic carbon and microorganisms during plant community succession to provide a scientific basis for mine site restoration.

5. Conclusions

In this study, the species composition and diversity in different plant sample plots in the phosphate mine area changed significantly with the restoration years. From 1 to 40 years restoration, the plant species showed a gradual increase in the community, and the number and diversity of species could reach the level of natural forest after 40 years of restoration. The perennial herb plants in the communities of 40 years of restoration and nature forest plots could form a stable community structure. Soil pH, organic carbon content, phosphorus content, and restoration years were the main factors affecting plant diversity. Soil pH, SOC, organic carbon fraction, and TP and AP content of the community in the restored 1–10 years decreased with increasing soil depth, and in the restored period, TP and AP content increased with increasing soil depth as species composition and plant diversity increased. Organic carbon content became a limiting factor for plant diversity in mature forests, with stable organic carbon fractions increasing in the early recovery period, gradually changing to unstable carbon fractions after 10 years restoration and decreasing after 40 years of restoration as the community evolved towards the climax community, with stable carbon fractions increasing in natural forests. In summary, soil phosphorus and organic carbon are the main factors of plant succession in plant restoration of phosphate mines waste land, with the stable organic carbon fraction influencing the sequestration of organic carbon. The results of this study can provide a basis for community succession change and soil management after plant restoration in phosphate mines waste land.

Author Contributions

C.W. and Y.Z. designed the project. C.X., S.K. and L.H. conducted the experiments. C.X. and S.K.: data curation, formal analysis, validation, visualization, writing—original draft, writing—review and editing. L.H.: investigation, resources, supervision, project administration. C.W.: methodology, resources, investigation. Y.Z.: conceptualization, investigation, methodology, project administration, supervision, writing—review and editing. All authors have read and agreed to the published version of the manuscript.

Funding

This research was funded by Yunnan Provincial Science and Technology Plan Project, grant number 202203AC100002.

Institutional Review Board Statement

Not applicable.

Informed Consent Statement

Not applicable.

Data Availability Statement

The original contributions presented in the study are included in the article. Further inquiries can be directed to the corresponding authors.

Acknowledgments

The authors would like to thank all participants of this study for their great cooperation.

Conflicts of Interest

The authors declare no conflict of interest.

References

  1. Malaviya, S.; Munsi, M.; Oinam, G.; Joshi, P. Landscape approach for quantifying land use land cover change (1972–2006) and habitat diversity in a mining area in Central India (Bokaro, Jharkhand). Environ. Monit. Assess. 2010, 170, 215–229. [Google Scholar] [CrossRef]
  2. Adlassnig, W.; Weiss, Y.S.; Sassmann, S.; Steinhauser, G.; Hofhansl, F.; Baumann, N.; Lichtscheidl, I.K.; Lang, L. The copper spoil heap Knappenberg, Austria, as a model for metal habitats—Vegetation, substrate and contamination. Sci Total Environ. 2016, 563–564, 1037–1049. [Google Scholar] [CrossRef]
  3. Gastauer, M.; Souza, F.P.; Ramos, S.J.; Caldeira, C.F.; Silva, J.R.; Siqueir, J.O.; Furtini Neto, A.E. Mine land rehabilitation in Brazil: Goals and techniques in the context of legal requirements. Ambio 2019, 48, 74–88. [Google Scholar] [CrossRef] [PubMed]
  4. Srinivasan, M.; Bhatia, S.; Shenoy, K. Vegetation-environment relationships in a South Asian tropical montane grassland ecosystem: Restoration implications. Trop. Ecol. 2015, 56, 201. [Google Scholar] [CrossRef]
  5. Daily, G.C. Restoring Value to the World’s degraded lands. Science 1995, 269, 350–354. [Google Scholar] [CrossRef]
  6. Singh, R.S.; Tripathi, N.; Chaulya, S.K. Ecological study of revegetated coal mine spoil of an Indian dry tropical ecosystem along an age gradient. Biodegradation 2012, 23, 837–849. [Google Scholar] [CrossRef]
  7. Martínez-Ruiz, C.; Fernández-Santos, B.; Putwain, P.D.; Fernández-Gómez, M.J. Natural and man-induced revegetation on mining wastes: Changes in the floristic composition during early succession. Ecol. Eng. 2007, 30, 286–294. [Google Scholar] [CrossRef]
  8. Tilman, D.; Reich, P.B.; Knops, J.M. Biodiversity and ecosystem stability in a decade-long grassland experiment. Nature 2006, 441, 629–632. [Google Scholar] [CrossRef] [PubMed]
  9. Deng, J.; Bai, X.; Zhou, Y.B.; Zhu, W.X.; Yin, Y. Variations of soil microbial communities accompanied by different vegetation restoration in an open-cut iron mining area. Sci. Total Environ. 2020, 704, 135243. [Google Scholar] [CrossRef]
  10. Li, S.; Liber, K. Influence of different revegetation choices on plant community and soil development nine years after initial planting on a reclaimed coal gob pile in the Shanxi mining area, China. Sci. Total Environ. 2018, 618, 1314–1323. [Google Scholar] [CrossRef]
  11. Putten, W.; Bardgett, R.D.; Bever, J.D.; Bezemer, T.M.; Casper, B.B.; Fukami, T.; Kardol, P.; Klironomos, J.N.; Kulmatiski, A.; Schweitzer, J.A.; et al. Plant-soil feedback: The past, the present and future challenges. J. Ecol. 2013, 101, 265–276. [Google Scholar] [CrossRef]
  12. Thakur, M.P.; Putten, W.H.; Wilschut, R.A.; Veen, G.F.; Kardol, P.; van Ruijven, J.; Allan, E.; Roscher, C.; van Kleunen, M.; Bezemer, T.M. Plant-soil feedbacks and temporal dynamics of plant diversity-productivity relationships. Trends Ecol. Evol. 2021, 36, 651–661. [Google Scholar] [CrossRef]
  13. Kulmatiski, A.; Beard, K.H.; Stevens, J.R.; Cobbold, S.M. Plant-soil feedbacks: A meta-analytical review. Ecol. Lett. 2008, 11, 980–992. [Google Scholar] [CrossRef] [Green Version]
  14. Wang, G.Z.; Jia, J.Y.; Zhang, J.L. Plant soil feedback theory and its applications and agricultural ecosystems. Acta Ecologica Sinica. 2021, 41, 14. [Google Scholar] [CrossRef]
  15. Liu, C.; Liu, Y.; Guo, K.; Wang, S.L.; Yang, Y. Concentrations and resorption patterns of 13 nutrients in different plant functional types in the karst region of south-western China. Ann. Bot. 2014, 113, 873–885. [Google Scholar] [CrossRef] [PubMed]
  16. Yu, J.; Zhang, X.; Xu, C.Y.; Hao, M.H.; Choe, C.H.; He, H.J. Thinning can increase shrub diversity and decrease herb diversity by regulating light and soil environments. Front Plant Sci. 2022, 13, 948648. [Google Scholar] [CrossRef] [PubMed]
  17. Yuan, Y.; Zhao, Z.Q.; Niu, S.Y.; Bai, Z.K. The reclaimed coal mine ecosystem diverges from the surrounding ecosystem and reaches a new self-sustaining state after 20–23 years of succession in the Loess Plateau area, China. Sci. Total Environ. 2020, 727, 138739. [Google Scholar] [CrossRef]
  18. Suding, K.N.; Gross, K.L.; Houseman, G.R. Alternative states and positive feedbacks in restoration ecology. Trends Ecol. Evol. 2004, 19, 46–53. [Google Scholar] [CrossRef] [PubMed]
  19. Juwarkar, A.A.; Singh, L.; Singh, S.K.; Jambhulkar, H.P.; Thawale, P.R.; Kanfade, H. Natural vs. reclaimed forests—A case study of successional change, reclamation technique and phytodiversity. Int. J. Min. Reclam. Environ. 2014, 29, 1–23. [Google Scholar] [CrossRef]
  20. Chiquoine, L.P.; Abella, S.R.; Bowker, M.A. Rapidly restoring biological soil crusts and ecosystem functions in a severely disturbed desert ecosystem. Ecol. Appl. 2016, 26, 1260–1272. [Google Scholar] [CrossRef] [Green Version]
  21. Yuan, Y.; Li, X.Y.; Liu, X.M. Restoration of nutrient in phosphate mined-out areas: A case study of the phosphate mine in kunyang, Yunnan. Genom. Appl. Biol. 2017, 36, 8. [Google Scholar]
  22. Zhou, J.H.; Yu, L.; Wang, Y.S.; Xiao, Y.N.; Zhu, Y.L. Effects of Magnolia multiflora. with different growth years on soil nutrient changes in Phosphorus mine slope. Soil Water Conserv. China 2022, 4, 38–41. [Google Scholar] [CrossRef]
  23. Wang, Q.K.; Wang, S.L.; Zhong, M.C. Ecosystem carbon storage and soil organic carbon stability in pure and mixed stands of Cunninghamia lanceolata and Michelia macclurei. Plant Soil. 2013, 370, 295–304. [Google Scholar] [CrossRef]
  24. Fang, J.Y.; Wang, X.P.; Shen, Z.H.; Tang, Z.Y.; He, J.S.; Yu, D.; Jiang, Y.; Wang, Z.H.; Zheng, C.Y.; Zhu, J.L.; et al. Methods and protocols for plant community inventory. Biodivers. Sci. 2009, 17, 533–548. [Google Scholar] [CrossRef]
  25. Bao, S.D. Agricultural Soil Analysis, 3rd ed.; China Agricuture Press: Beijing, China, 2000. [Google Scholar]
  26. Marriott, E.E.; Wander, M.M. Total and labile soil organic matter in organic and conve entional farming systems. Soil Sci. Soc. Am. J. 2006, 70, 950–959. [Google Scholar] [CrossRef] [Green Version]
  27. Li, J.W.; He, B.Y.; Li, C.; Hui, H.Y.; Liu, B.; Zhang, X.X. Analysis of grassland community-level plant functional traits and functional diversity at different times during restoration. Acta Prataculturae Sin. 2023, 32, 16–25. [Google Scholar] [CrossRef]
  28. Auclair, A.N.; Goff, F.G. Diversity relations of upland forests in the western great lakes area. Univ. Chic. Press J. 1971, 105, 946. [Google Scholar] [CrossRef]
  29. Li, T.; Wu, M.H.; Duan, C.Q.; Li, S.Y.; Liu, C.E. The effect of different restoration approaches on vegetation development in metal mines. Sci. Total Environ. 2022, 806, 150626. [Google Scholar] [CrossRef]
  30. Walker, L.R.; Walker, J.; Hobbs, R.J. Linking Restoration and Ecological Succession; Springer series on environmental management; Springer: New York, NY, USA, 2007. [Google Scholar]
  31. Feng, H.B.; Zhou, J.W.; Zhou, A.G.; Bai, G.Y.; Li, Z.X.; Chen, H.N.; Su, D.H.; Han, X. Grassland ecological restoration based on the relationship between vegetation and its below-ground habitat analysis in steppe coal mine area. Sci. Total Environ. 2021, 778, 146221. [Google Scholar] [CrossRef]
  32. Reed, C.C.; Berhe, A.A.; Moreland, K.C.; Wilcox, J.W.; Sullivan, B. Restoring function: Positive responses of carbon and nitrogen to 20 years of hydrologic restoration in montane meadows. Ecol. Appl. 2022, 32, e2677. [Google Scholar] [CrossRef]
  33. Yun, J.Y.; Guo, C.Y.; Li, J.C.; Wang, X.; Li, Q.R. Colonized wild plants in the reclamation area of the antaibao opencast coal mine. Arid. Zone Res. 2016, 33, 399–409. [Google Scholar] [CrossRef]
  34. Sun, C.; Chai, Z.; Liu, G.; Sha, X. Changes in species diversity patterns and spatial heterogeneity during the secondary succession of grassland vegetation on the loess plateau, China. Front Plant Sci. 2017, 8, 1465. [Google Scholar] [CrossRef] [PubMed] [Green Version]
  35. Hooper, D.U.; Chapin, F.S.; Ewel, J.J.; Hector, A.; Inchausti, P.; Lavorel, S.; Lawton, J.H.; Lodge, D.M.; Loreau, M.; Naeem, S.; et al. Effects of biodiversity on ecosystem functioning: A consensus of current knowledge. Ecol. Monogr. 2005, 75, 3–35. [Google Scholar] [CrossRef]
  36. Nobile, C.M.; Bravin, M.N.; Becquer, T.; Paillat, J.M. Phosphorus sorption and availability in an andosol after a decade of organic or mineral fertilizer applications: Importance of pH and organic carbon modifications in soil as compared to phosphorus accumulation. Chemosphere 2020, 239, 124709. [Google Scholar] [CrossRef] [PubMed]
  37. Zhang, Y.; Xu, X.; Li, Z.; Xu, C.H.; Luo, W. Improvements in soil quality with vegetation succession in subtropical China karst. Sci. Total Environ. 2021, 775, 145876. [Google Scholar] [CrossRef]
  38. Smethurst, P.; Holz, G.; Moroni, M.; Baillie, C. Nitrogen management in Eucalyptus nitens plantations. For. Ecol. Manag. 2004, 193, 63–80. [Google Scholar] [CrossRef]
  39. Li, H.; Wu, Y.; Liu, S.; Zhao, W.Z.; Xiao, J.F.; Winosiecki, L.A.; Vågen, T.G.; Xu, J.C.; Yin, X.Y.; Wang, F.; et al. The Grain-for-Green project offsets warming-induced soil organic carbon loss and increases soil carbon stock in Chinese Loess Plateau. Sci. Total Environ. 2022, 837, 155469. [Google Scholar] [CrossRef]
  40. Gu, L.P.; Kong, J.J.; Chen, K.; Guo, Y.Q. Monitoring soil biological properties during the restoration of a phosphate mine under different tree species and plantation types. Ecotoxicol. Environ. Saf. 2019, 180, 130–138. [Google Scholar] [CrossRef]
  41. Yamileth, D.H.; Elena, V.; Jesús, C.; Patrick, L.; Luis, F.C.; Juan, J.J. Evaluation of reclamation success in an open-pit coal mine using integrated soil physical, chemical and biological quality indicators. Ecol. Indic. 2019, 103, 182–193. [Google Scholar] [CrossRef]
  42. Wang, S.; Cao, Y.; Geng, B.; Yang, K.; Zhou, Z.K. Succession law and model of reconstructed soil quality in an open-pit coal mine dump of the loess area, China. J. Environ. Manag. 2022, 312, 114923. [Google Scholar] [CrossRef]
  43. Lavallee, J.M.; Soong, J.L.; Cotrufo, M.F. Conceptualizing soil organic matter into particulate and mineral-associated forms to address global change in the 21st century. Glob. Chang. Biol. 2020, 26, 261–273. [Google Scholar] [CrossRef] [PubMed] [Green Version]
  44. Hou, X.Y.; Liu, S.H.; Cheng, F.Y.; Su, X.K.; Dong, S.K.; Zhao, S.; Liu, G.H. Variability of environmental factors and the effects on vegetation diversity with different restoration years in a large open-pit phosphorite mine. Ecol. Eng. 2019, 127, 245–253. [Google Scholar] [CrossRef]
  45. Rüegg, J.; Quezada, J.C.; Santonja, M.; Ghazoul, J.; Kuzyakov, Y.; Buttler, A.; Guillaume, T. Drivers of soil carbon stabilization in oil palm plantations. Land Degrad. Dev. 2019, 30, 1904–1915. [Google Scholar] [CrossRef]
  46. Xu, H.W.; Qu, Q.; Wang, M.G.; Li, P.; Li, Y.Z.; Xue, S.; Liu, G.B. Soil organic carbon sequestration and its stability after vegetation restoration in the Loess Hilly Region, China. Land Degrad. Dev. 2020, 5, 568–580. [Google Scholar] [CrossRef]
  47. Brown, K.H.; Bach, E.M.; Drijber, R.A.; Hofmockel, K.S.; Jeske, E.S.; Sawyer, J.E.; Castellano, M.C. A long-term nitrogen fertilizer gradient has little effect on soil organic matter in a high-intensity maize production system. Glob. Chang. Biol. 2014, 20, 1339–1350. [Google Scholar] [CrossRef]
  48. Lajtha, K.; Bowden, R.D.; Crow, S.; Fekete, I.; Kotroczó, Z.; Plante, A.; Simpson, M.J.; Nadelhoffer, K.J. The detrital input and removal treatment (DIRT) network: Insights into soil carbon stabilization. Sci. Total Environ. 2018, 640–641, 1112–1120. [Google Scholar] [CrossRef]
  49. Rasmussen, C.; Heckman, K.; Wieder, W.R.; Keiluweit, M.; Lawrence, C.R.; Berhe, A.A.; Blankinship, J.C.; Crow, S.E.; Druhan, J.L.; Pries, C.E.H.; et al. Beyond clay: Towards an improved set of variables for predicting soil organic matter content. Biogeochemistry 2018, 137, 297–306. [Google Scholar] [CrossRef]
  50. Miltner, A.; Bombach, P.; Schmidt-Brücken, B.; Kästner, M. SOM genesis: Microbial biomass as a significant source. Biogeochemistry 2012, 111, 41–55. [Google Scholar] [CrossRef]
  51. Lange, M.; Eisenhauer, N.; Sierra, C.A.; Bessler, H.; Engels, C.; Griffiths, R.I.; Mellado-Vázquez, P.G.; Malik, A.A.; Roy, J.; Scheu, S.; et al. Plant diversity increases soil microbial activity and soil carbon storage. Nat. Commun. 2015, 6, 6707. [Google Scholar] [CrossRef] [Green Version]
  52. Panchal, P.; Preece, C.; Peñuelas, J.; Giri, J. Soil carbon sequestration by root exudate. Trends Plant Sci. 2022, 27, 749–757. [Google Scholar] [CrossRef]
Figure 1. Location map of the study site (a) Yunnan, (b) Dianchi in Kunming, and (c) phosphate mine areas around Dianchi. Different shapes and colour of marks indicate sample sites with different years of restoration. Red circles indicate sample site for 1 year restoration, yellow pentagrams indicate for 7 years, orange squares indicate for 10 years, green rhombuses indicate for 40 years, and purple cylinders indicate for natural forest.
Forests 14 01468 g001
Figure 2. Species number percentage(A) and Shannon diversity index (B) at different restoration years. Note: no shrub layer in the 40 years of restoration community and no tree layer in the 7-year and 1-year communities in (B); no calculation was made for the Shannon diversity index (H′), and H′ was calculated as 0 for one tree in the 10-year community and one shrub in the 1-year community.
Forests 14 01468 g002
Figure 3. Influence of different restoration years on the (A) total nitrogen (TN), (B) available nitrogen (AN), (C) total phosphorus (TP), (D) available phosphorus (AP), and (E) pH of different soil layers in the community. Note: Different lowercase letters indicate significant differences in soil nutrients between soil layers of different communities (p < 0.05).
Forests 14 01468 g003
Figure 4. Influence of different restoration years on the (A) soil organic carbon (SOC), (B) dissolved organic carbon (DOC), (C) readily oxidizable carbon (ROC), (D) light fraction organic carbon (LFOC), (E) particulate organic carbon (POC), (F) mineral-associated organic carbon (MOC) content of different soil layers in the community. Note: Different lowercase letters indicate significant differences in soil nutrients between soil layers of different communities (p < 0.05).
Forests 14 01468 g004
Figure 5. RDA ranking analysis of plant diversity and soil nutrients in the different community. Note: Blue arrows indicate plant diversity indicators, and red arrows indicate soil nutrient indicators.
Forests 14 01468 g005
Table 1. Basic information about the community.
Restoration Year/aElevation/mSlope Gradient/°Slope DirectionVegetation Coverage/%
12113–21106southwest27%
72057–20606west80%
102038–204540southeast100%
402218–22403southeast70%
natural forest2268–227340east100%
Table 2. The plants species composition in different communities.
NumberLife FormSpecies NameRestoration Year/aNatural Forest
171040
1TreePinus armandii Franch. +
2Alnus cremastogyne Burk. +
3Cupressus duclouxiana Hickel +
4Quercus acutissima Carruth. +
5Quercus aliena Bl. +
6Eucalyptus pellita F.Muell. +
7ShrubBerberis silva-taroucana Schneid. +
8Zanthoxylum simulans Hance. +
9Buddleja officinalis Maxim. +
10Cotoneaster pannosus Franch. +
11Osyris wightiana Wall. ex Wight var. stipitata +
12Lespedeza bicolor Turcz. +
13Myrsine africana L. +
14Indigofera tinctoria L. +
15Cinnamomum camphora L.++
16Buddleja asiatica Lour.+
17HerbEupatorium coelestinum L. +++
18Phytolacca americana L. +
19Rubus ellipticus var. obcordatus (Franch.) Focke +
20Pteris ensiformis Burm. +
21Pteris aspericaulis var. cuspigera +
22Rheum officinale Baill. +
23Lophatherum gracile Brongn. + +
24Paeonia suffruticosa Andr. +
25Erigeron canadensis L. +
26Geranium wilfordii Maxim. +
27Microbiota decussata Kom. +
28Pinellia ternata (Thunb.) Makino +
29Lonicera japonica Thunb. +
30Medicago sativa L. +
31Artemisia argyi Lévl. et Van. +
32Imperata cylindrica (L.) Raeusch. +
33Miscanthus sinensis Anderss.+
34Rumex hastatus D. Don.+
Note: ‘+’ indicate the plant is existent in different communities.
Table 3. Species composition and plant diversity index in different communities.
Restoration Year/aSJD
141.310.68
750.980.67
1081.340.83
4090.660.44
natural forest121.020.76
Note: ‘S’ indicates species richness index, ‘J’ is Pielou Evenness index, and ‘D’ is Simpson diversity index, same as follows.
Table 4. Correlation analysis of plant diversity and soil nutrients.
pHTNANTPAPSOCDOCROCLPOCPOCMOCHRJD
H−0.3960.717 **0.772 **−0.359−0.536 *−0.913 **0.0520.2360.2170.572 *0.2111−0.1620.646 **0.860 **
R−0.754 **−0.0660.1090.827 **0.651 **0.253−0.0880.308−0.026−0.0930.212−0.16210.640 *0.202
J−0.851 **0.4260.569 *0.4100.112−0.524 *−0.0050.4380.1260.0890.0060.646 **0.640 *10.830 **
D−0.691 **0.560 *0.625−0.031−0.031−0.654 **−0.3070.088−0.169−0.127−0.527 *0.860 **0.2020.830 **1
Note: ** Correlation is significant when the confidence (double test) is 0.01; * Correlation is significant when the confidence (double test) is 0.05.
Table 5. Linear stepwise regression analysis of soil nutrients and restoration years on plant diversity.
VariableEstimate
(Standard Error)
ANOVARelative
Importance
F-ValuePr (>F)
pH−0.9113.22***26.5%
SOC−0.2014.58***6.9%
TP0.9625.96***2.9%
AP−0.6024.65***0.8%
age−0.4123.85***7.4%
Note: *** Correlation is significant when the confidence (double test) is 0.001.
Disclaimer/Publisher’s Note: The statements, opinions and data contained in all publications are solely those of the individual author(s) and contributor(s) and not of MDPI and/or the editor(s). MDPI and/or the editor(s) disclaim responsibility for any injury to people or property resulting from any ideas, methods, instructions or products referred to in the content.

