Article

Study on the Spatial Heterogeneity of the Impact of Forest Land Change on Landscape Ecological Risk: A Case Study of Erhai Rim Region in China

Faculty of Geography, Yunnan Normal University, Kunming 650500, China
*
Author to whom correspondence should be addressed.
Forests 2023, 14(7), 1427; https://doi.org/10.3390/f14071427
Submission received: 12 June 2023 / Revised: 28 June 2023 / Accepted: 10 July 2023 / Published: 12 July 2023
(This article belongs to the Special Issue Forest Ecological Management and Sustainable Development)

Abstract

:
As an important ecological ecotone of water and land ecosystems, the lakeside is characterized by a variety ecosystem services and high vulnerability. Forest land is important in resolving the ecological risks of the lakeside area and building its ecological base. It is important to explore the effect of change in forest land on landscape ecological risk in the lakeside area, alleviate the contradiction between ecological protection and construction and development in the area, and realize sustainable development. The present study attempted to explore the spatial and temporal evolutionary features of forest land in the Erhai rim region from 2000 to 2020 using bivariate spatial autocorrelation and multi-scale geographical weighted regression (MGWR) models. The following are the findings of this investigation of the 2000–2020 period: (1) the forest land area in the region generally decreased, first increasing and then decreasing, and was mainly occupied by cultivated land and artificial surfaces; (2) the total landscape ecological risk in the region presented an upward trend, and medium- and higher-risk areas were the main risk areas, with the latter increasing; (3) the impact of forest land expansion and contraction intensity on landscape ecological risk exhibited spatial and temporal heterogeneity. The main forms of forest land change at different stages differed, and the impacts on landscape ecological risk were also different. Reasonable forest land expansion can effectively alleviate the growth in landscape ecological risk, whereas the shrinkage of forest land would aggravate the landscape ecological risk in the Erhai rim region. Moreover, the findings can offer reference for the exploration of ecological protection and coordinated optimization of economic development in Erhai Lake.

1. Introduction

Forest land is a vital part of the forest ecosystem and a basic part of ecological environment construction [1]. It plays a vital part in regulating the regional climate, regulating the hydrological cycle, maintaining the global carbon balance, protecting biodiversity, improving ecological security barrier functions, and promoting sustainable social development [2,3,4,5]. Changes in forest land directly affect the construction of national ecological security patterns and the global ecological environment [6]. In recent years, the protection of forest ecosystems has become a consensus worldwide [7,8,9]. China has also carried out a series of ecological construction projects around forest land protection, including returning farmland to forests, natural forest protection, and the development of the Three-North Shelter Forests Project. These constructions have effectively restored forest ecosystems, increased the area of forest land, protected the diversity of forest species, and significantly improved the quality of the ecological environment [10,11,12]. However, with the rapid increase in population and rapid development of industrialization and urbanization, human beings have also increased the development and utilization of forest land, resulting in serious damage to the forest ecosystem, which directly or indirectly brings many risks to the regional ecological environment [13,14].
The organization and structure of the ecosystem are influenced by various land-use patterns and intensities, which have regional and cumulative effects on ecology [15]. Currently, the ecological risks resulting from changes in natural ecosystems and land-use types are important factors affecting regional ecological security [16]. As an important tool for macroecological management, ecological risk assessment has gradually become a prominent topic in research [17]. As a significant component of ecological risk assessment, landscape ecological risk assessment specifically concentrates more on the spatial and temporal heterogeneity of ecological risks and possible adverse results of scale effects. It examines the spatial and temporal differentiation patterns of risks and risk expression of specific spatial patterns for ecological functions and processes [18,19]. Landscape ecological risk assessment is of great significance for research on mountains, rivers, forests, farmlands, lakes, grasslands, and deserts as part of the community of life, and is also an effective means of regional ecological risk prevention and management. Kapustka et al. (2001) used the landscape ecology theory to evaluate ecological risks and proposed corresponding control strategies [20]. Paukert et al. (2011) proposed a landscape-scale ecological risk index from the perspective of landscape structure and land-use change. [21]. Ayre et al. (2012) introduced the Bayesian method for landscape ecological risk assessment to assess the ecological risk in the upper reaches of the Grand River in Oregon [22]. With the landscape ecological risk assessment, which is based on land-use change and is becoming a research hotspot, researchers worldwide have furthered the research on the topic [23,24]. Most research areas are concentrated in key risk control regions, such as urban [25] and administrative [26] areas, watersheds [27], industrial and mining areas [28] and nature reserves [29]; however, landscape ecological risk assessment around lakeside areas needs to be further developed.
In addition, as human understanding of the structure and function of forest land continues to advance, the ecological and environmental issues brought on by changing forest lands have gradually attracted the attention of many scholars. Iroume et al. (2005) studied the relationship between forest coverage and summer floods [30]. Lombaerde et al. (2022) concluded that a forest cover has a buffering effect on the temperature of future climate [31]. Hu et al. (2020) evaluated the effects of poplar ecological retreat initiatives on the water content of Dongting Lake wetlands using the InVEST model [32]. Shi et al. (2007) adopted the soil classification category (SCS) model for exploring the impact of forest land change on watershed runoff in Shenzhen [33]. Shi et al. (2016) investigated how changing forest land affected the value of ecosystem services using a price inversion technique [34]. Yao et al. (2006) used geographic information system (GIS) spatial analysis and traditional statistical analysis to analyze the impact of forest land change on soil erosion [35]. The existing research focuses more on the effect of forest land change on climate regulation, water conservation, soil conservation, and habitat maintenance, and rarely on the spatial heterogeneity of the impact of changing forest land on ecological risk in a landscape.
The lakeside area is an important ecological ecotone between aquatic and terrestrial ecosystems and shows high sensitivity to human activities [36,37]. The total landscape pattern there is relatively fragmented and poorly stabilized. Changes to it are significant and rapid under the influence of natural conditions and human activity [19]. As one of the nine plateau lakes in Yunnan, the resources and environmental conditions of the lake are good, economic development has occurred early, and the degree of urbanization is high. At the same time, the implementation of a series of ecological actions, like closing hillsides to facilitate afforestation and returning farmland to forests, as a part of China’s “Natural Forest Resources Protection Project” has greatly improved the forest coverage of Eryuan County in the north of Erhai Lake and Cangshan Mountain in the east coast. Nevertheless, with the acceleration of urbanization, the demand for urban space land, particularly in the central cities in western Yunnan and mountainous cities in Haidong, is increasing daily. Forest land on the low hills and gentle slopes on the south and east banks of Erhai Lake is occupied, and the land-use types have changed fundamentally, posing a great threat to the ecosystem in the region. Improving the ecological function of lakeside areas has become a focus of increasing attention [38].
Forest land accounts for the largest proportion of the land-use type in the Erhai rim region. Compared with those in other land-use types, changes in forest land can more obviously reflect the effect of human activities on landscape structure and function. However, with the fast development of urbanization and the implementation of ecological projects, the forest land area in the Erhai rim has changed considerably; therefore, what are the changes of forest land and landscape ecological risks in the Erhai rim from 2000 to 2020? How did the woodland changes affect the landscape ecological risk? These ate urgent questions that need to be addressed at present. Therefore, in this study, we considered the Erhai rim region as an example, measured and investigated the intensity of forest land change from 2000 to 2020, constructed a landscape ecological risk model through a landscape pattern index, and discussed the spatial and temporal distribution characteristics of landscape ecological risk in the region. Furthermore, a multi-scale geographically weighted regression (MGWR) model was adopted for revealing the spatial heterogeneity of the impact of forest land change intensity on landscape ecological risk change to enrich empirical studies on the internal mechanisms of forest land change and landscape ecological risk. Our study offers a scientific basis for promoting the exploration of high-quality development paths oriented toward ecological priority and green development in the Erhai rim region.

2. Materials and Methods
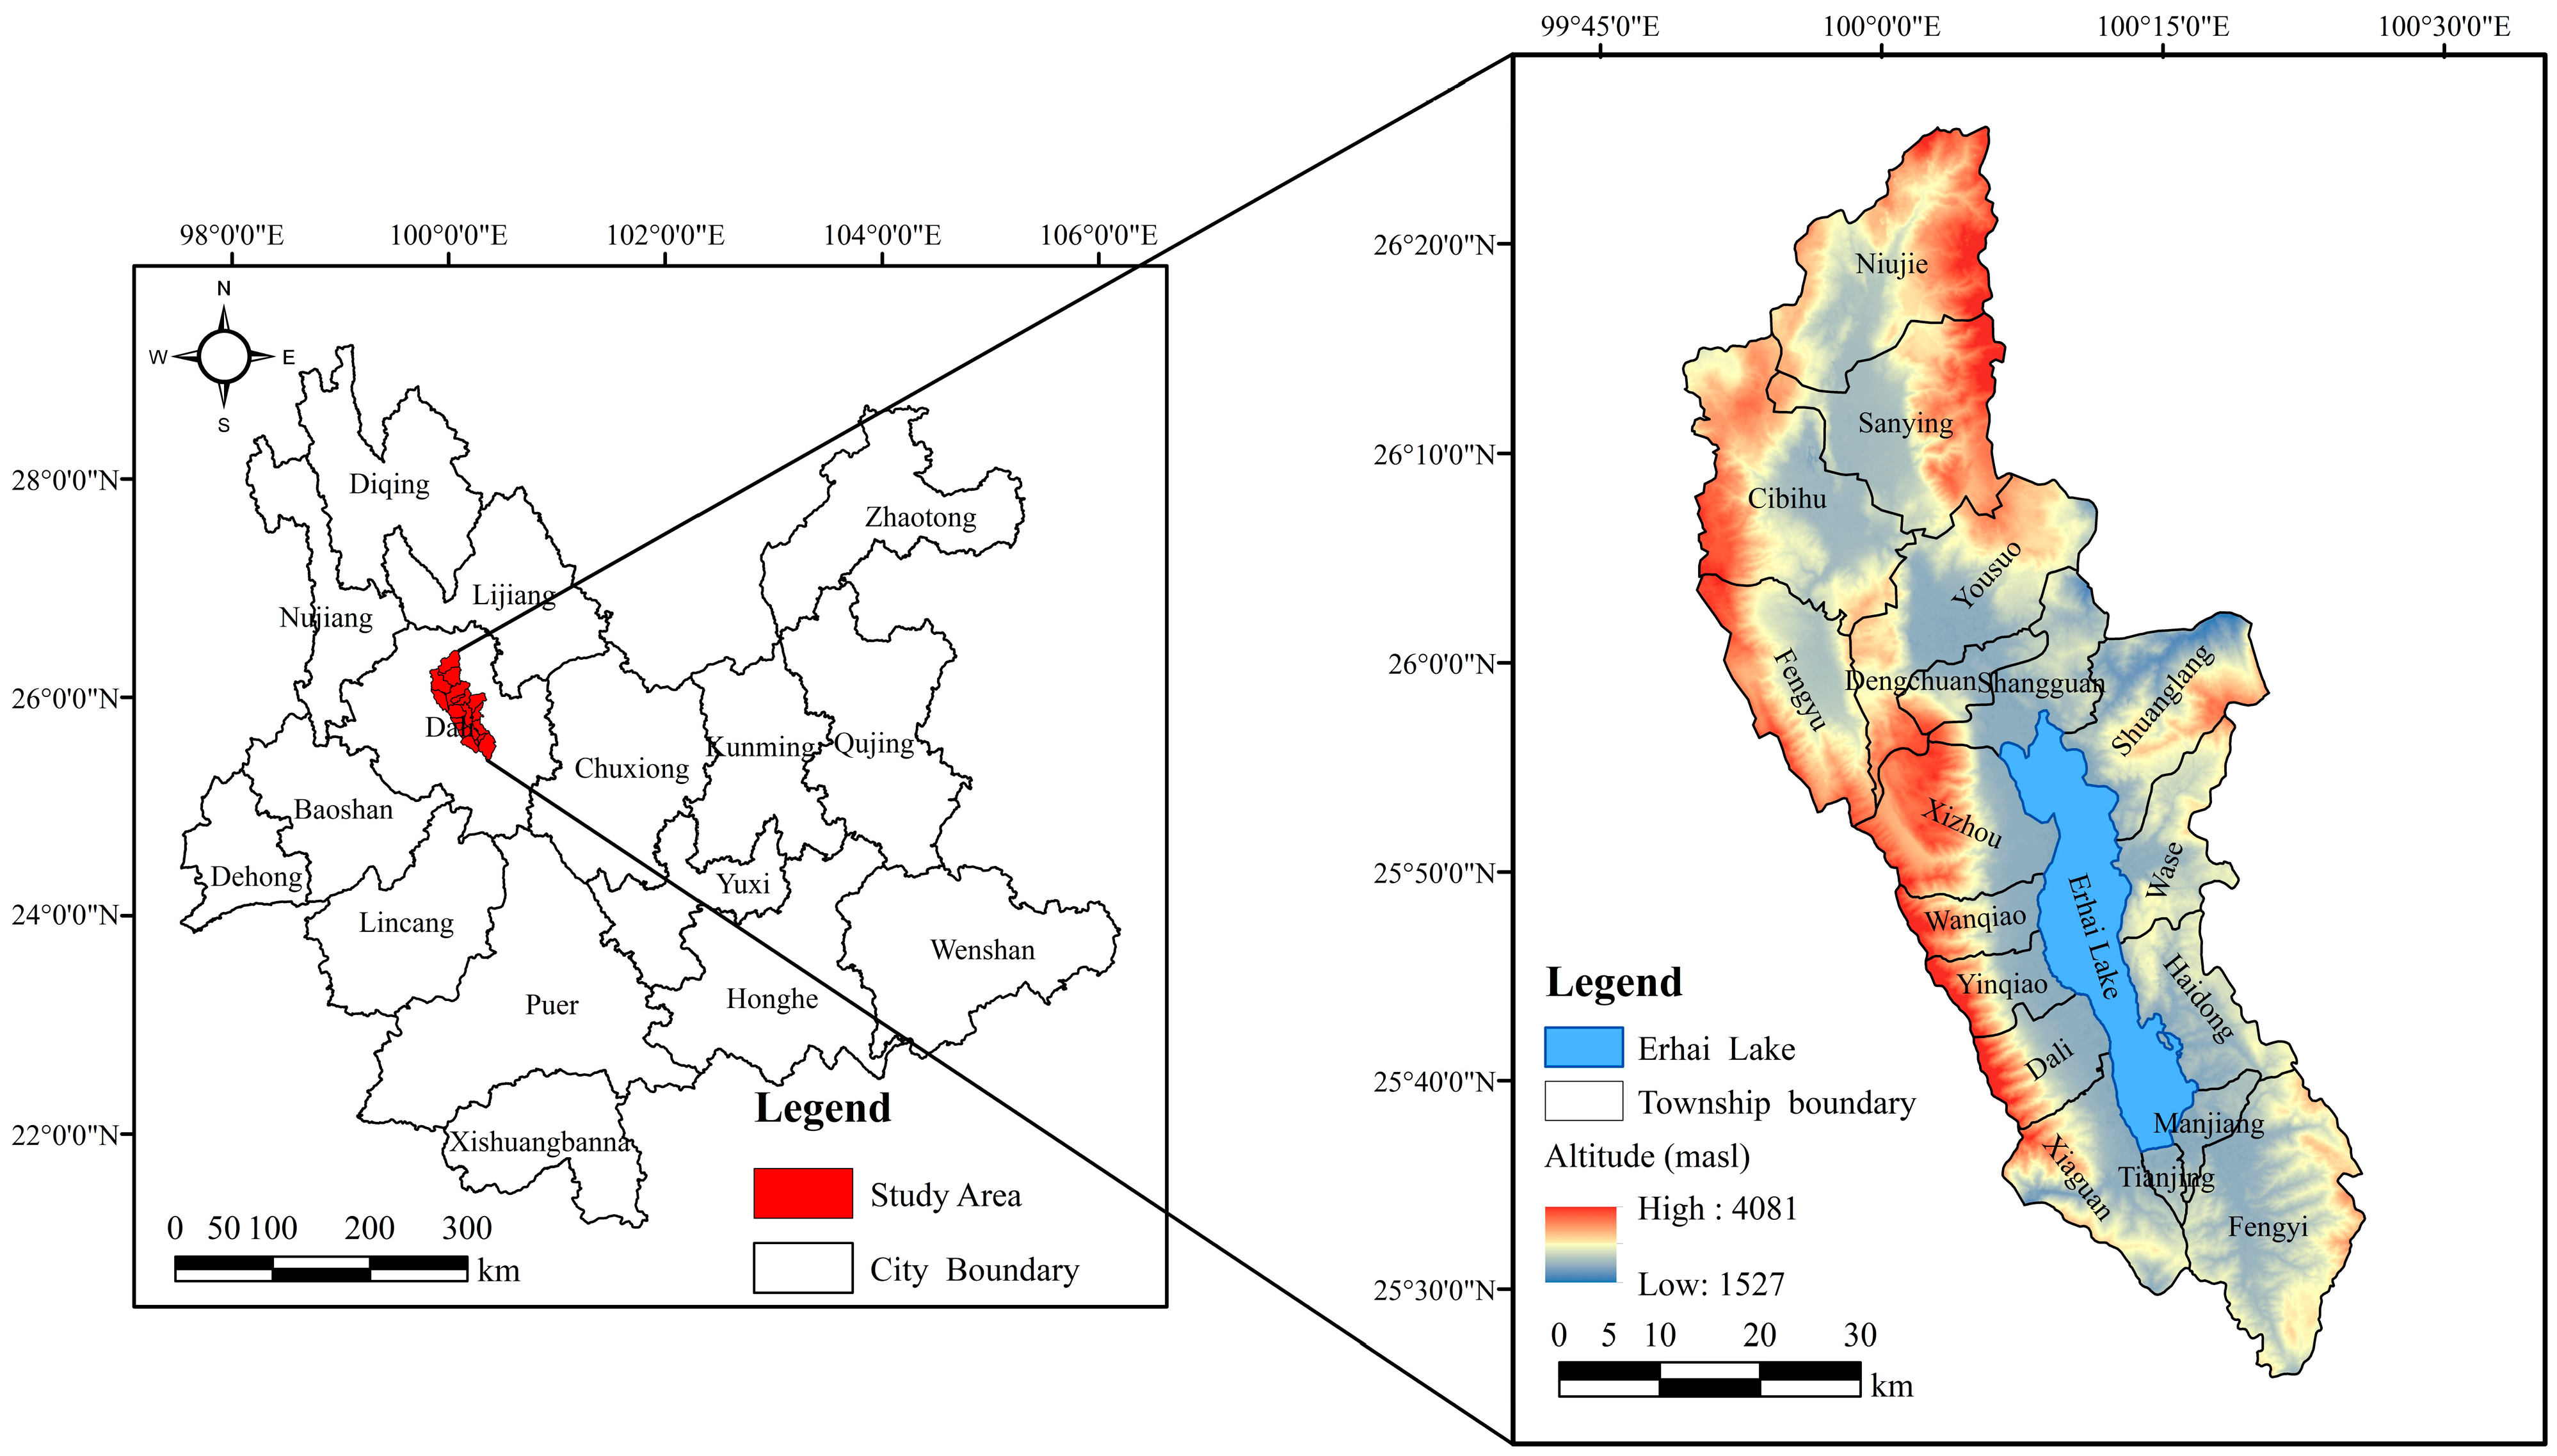
2.1. Study Area

The Erhai rim region is located in the western part of Yunnan Province, China, in the central part of Dali Bai and Bai Autonomous Prefecture (100°5′ E–100°17′ E, 25°36′ N–25°58′ N). There is a high altitude in the west and a low altitude in the east of the terrain; the difference in relative altitude is 2554 m, and mountains surround it to the west. From northwest to southeast, it presents an irregular strip, including 18 towns in Dali City and Eryuan County, and the total area is about 2565 km2 (Figure 1). The Erhai rim region is a typical area with overlapping characteristics, such as the fragile ecological environment of plateau lakes, diversified integration of ethnic cultures, and active rural economic and social development [39]. With the rise in tourism and rapid advancement of urbanization in the region in recent years, this region presents high requirements for ecological and environmental protection. As a vital part of the region’s community life, the stability of the function and structure of its mountains, rivers, forests, fields, lakes, and sands is of great significance for the sustainable development of the region. Therefore, it is important to study the spatial heterogeneity of the effect of forest land change on landscape ecological risk in this area to promote the prevention of regional ecological risks.

2.2. Data Source

Considering the time node of China’s policy of return of cultivated land to forest and the implementation of China’s natural forest resource protection project, land-use data from 2000 to 2020 were selected. The data were derived from the Globeland30 global land cover database (http://www.globallandcover.com/, accessed on 15 December 2022), including three periods of data from 2000, 2010, and 2020, with a spatial resolution of 30 m × 30 m. The dataset covered a long period and had high overall accuracy, and the Kappa coefficient was 0.78 [40]. In accordance with the classification system of Globeland30, there are seven land-use types in the study area, including cultivated land, forest land, grassland, shrubland, wetland, water body, and artificial surface. The World Geodetic System 1984 (WGS84) Universal Transverse Mercator (UTM) Zone 47 Northern Hemisphere projection was used.

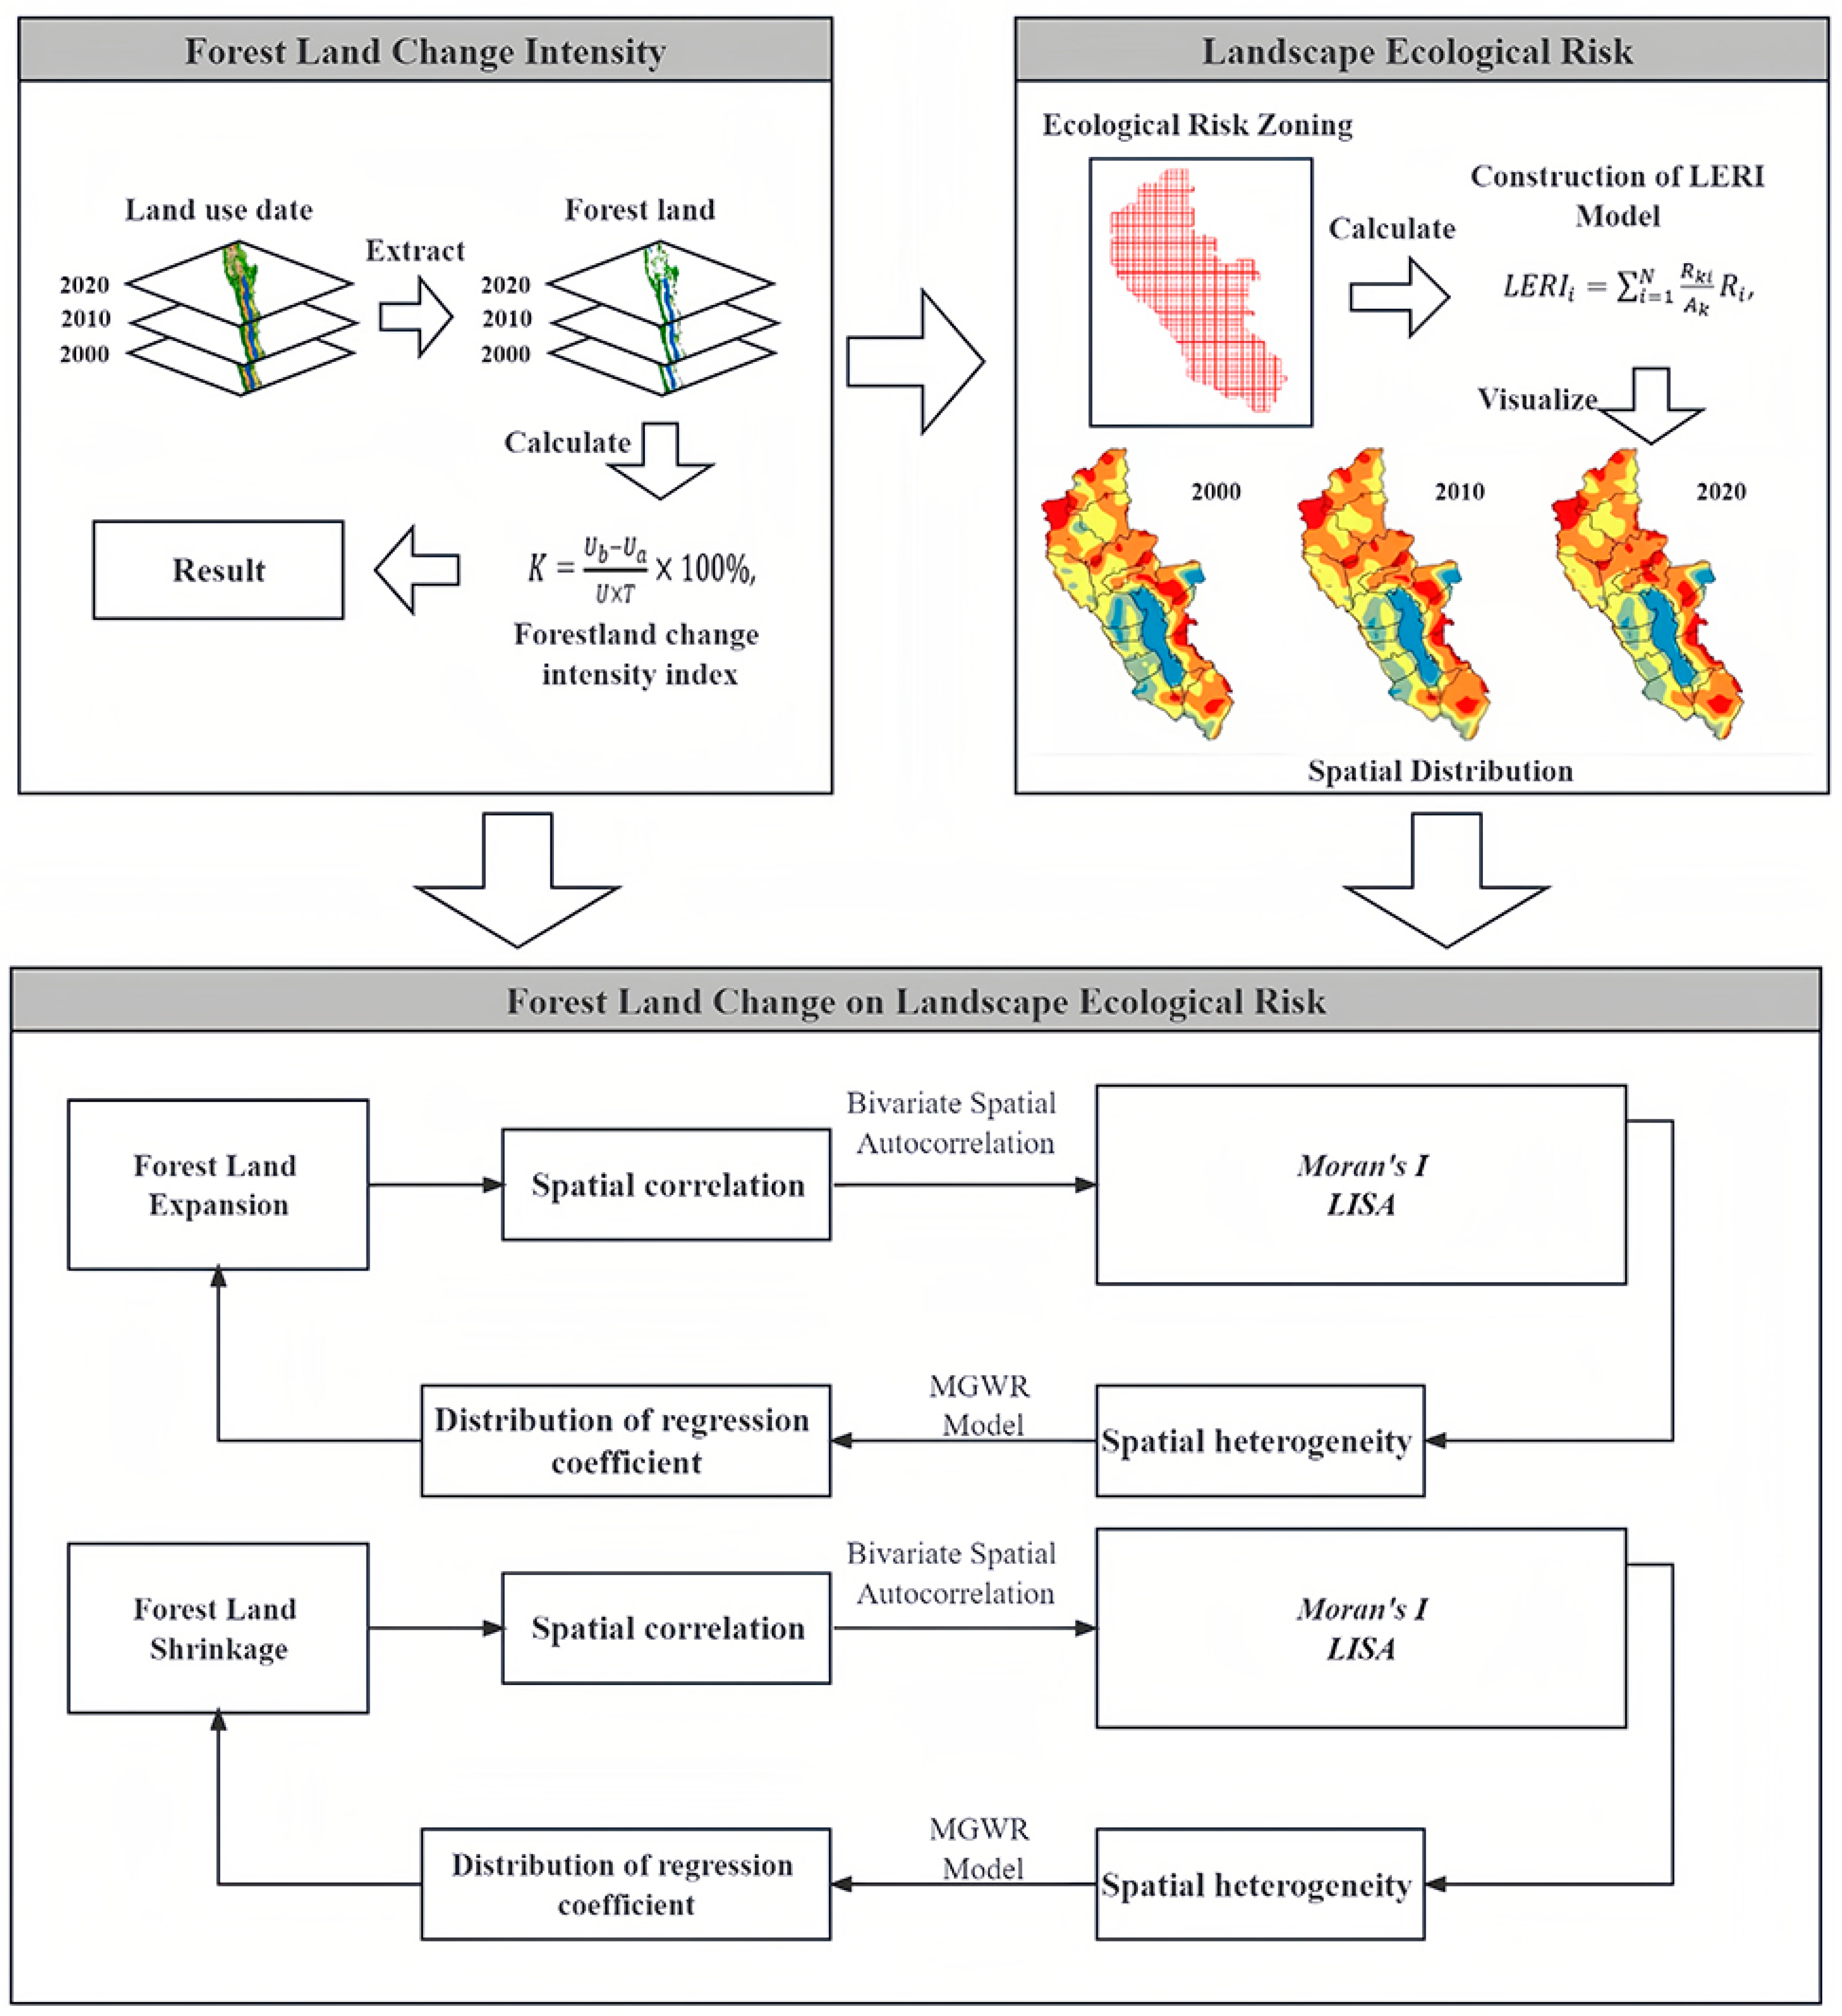
2.3. Research Methods

The content of the present study mainly includes the intensity of forest land change, landscape ecological risk and the effect of forest land change intensity on landscape ecological risk, and the relevant research methods are used to conduct the study around the research content as follows (Figure 2):

2.3.1. Forest Land Change Intensity Index

The intensity index of forest land change refers to the percentage of the changed area of forest land within a specific period out of the total area of regional land. It is a common quantitative index that reflects the degree and speed of forest land change [41,42,43]. The formula used to calculate the change intensity index was as follows:
K = U b U a U × T × 100 % ,
where K denotes the intensity index of forest land change during the study period; Ua and Ub are the areas of forest land at the beginning and end of the study period, separately; U refers to the total area of the study zone; and T indicates the length of the study period, generally in years.

2.3.2. Ecological Risk Zoning

With the purpose of reasonably dividing the ecological risk area based on spatial heterogeneity, patch size, and size of the study area, according to the principle of two–five times the average patch [44,45], the study area was classified into 836 2 km × 2 km grids, and the ecological risk value of the center point of each grid was used as the ecological risk index of that ecological risk plot.

2.3.3. Construction of Landscape Ecological Risk Model

As a commonly used quantitative research method, the landscape pattern index method describes landscape patterns and their changes through a combination of multiple indices. In line with previous research results [46,47], the present study used the landscape disturbance index, landscape vulnerability, and landscape loss indices to construct an ecological risk assessment model that could be used to analyze the temporal and spatial evolution features of landscape ecological risk in the Erhai rim region. The formula is written as follows:
L E R I i = i = 1 N A k i A k R i ,
where L E R I i represents the landscape ecological risk index of the risk area i , N denotes the number of landscape types, A k i represents the area of landscape type i in the k th risk plot, A k denotes the total area of the k th risk cell, and R i refers to the loss index of landscape type i .
(1)
Landscape Disturbance Index ( U i )
The landscape disturbance index is adopted for describing the degree of interference of different landscape types with external factors. The formula is as follows:
U i = a C i + b S i + c F i ,
where C i refers to the landscape fragmentation index; S i refers to the landscape separation index; F i is the landscape dominance index; and a, b, and c represent the weights of the corresponding landscape indices, with a + b + c = 1. Based on existing research results [48], we assigned the following values: a = 0.5, b = 0.3, and c = 0.2.
(2)
Landscape Vulnerability Index ( E i )
The landscape vulnerability index represents the sensitivity of different landscape types to external interference. In line with the existing research results and expert scoring, the vulnerability indices of six landscape types were scored from low to high [49]: forest land = 1; water body = 2; wetland = 3; shrub land = 4; grassland = 5; and cultivated land = 6. The vulnerability indices of each landscape type were obtained after normalization.
(3)
Landscape Loss Index ( R i )
The landscape loss index was employed to represent the degree of loss for each landscape type when disturbed. The formula is as follows:
R i = U i × E i .

2.3.4. Bivariate Spatial Autocorrelation

Geoda 1.20 is superior in the calculation of spatial autocorrelation; it can be applied to investigate the spatial distribution characteristics of an attribute and the correlations between variables. Generally, the spatial correlation is measured and tested using global and local spatial autocorrelations [50,51]. The formula is as follows:
I = n i = 1 n j = 1 n W i j × i = 1 n j = 1 n W i j ( x i x ¯ ) ( x j x ¯ ) i = 1 n ( x i x ¯ ) 2 ,
where x i and x j are the observed values, x ¯ represents the average of x i , W i j is the spatial weight adjacency matrix of spatial cells i and j ( i   j = 1, 2, 3, …), and the global Moran’s I value is generally [−1, 1]. A Moran’s I value greater than 0 suggests that the spatial unit attributes are positively associated. A value of less than 0 suggests that the spatial unit attributes are negatively correlated; a value of 0 suggests that the spatial units are randomly distributed, and there is no correlation. The p-value was used for the significance test—when p > 0.1, it indicates that it is not significant, while p < 0.1 indicates significance.
I k l i = Z k i j = 1 n w i j Z l j ,
where w i j is the spatial connection matrix between spatial elements; Z k i = x k i x ¯ k λ k ; Z l i = x l i x ¯ l λ l ; x k i refers to the value of attribute k of spatial cell i ; x l i is the value of attribute l of spatial cell i ; x ¯ k and x ¯ l represent the average of k and l , respectively; and λ k and λ l represent the variance of attributes k and l , respectively.
Based on the local Moran’s I index, the H-H stands for high–high clusters, the L-L stands for low–low clusters, the H-L stands for high–low clusters, the L-H stands for low–high clusters.

2.3.5. Construction of MGWR Model

MGWR is an improvement over the geographically weighted regression model (GWR). It differs from GWR, which assumes that the local relationship within each model changes on the same spatial scale. MGWR permits the relationship between response variables and different predictors to change at different spatial scales [52,53], which is more in line with spatial heterogeneity [54]. Therefore, the MGWR model is more conducive to an in-depth analysis of the effect of forest land change on the spatial differentiation of landscape ecological risk. The formula for the MGWR model can be expressed as follows:
y i = j = 1 k β b w j ( u i , v i ) x i j + ε i ,
where y i represents the explained variable; ( u i , v i ) denotes the coordinates of the center point at i ; b w j indicates the broadband used by the j th variable regression coefficient; β b w j denotes the regression coefficient of the j th variable at i .

3. Results

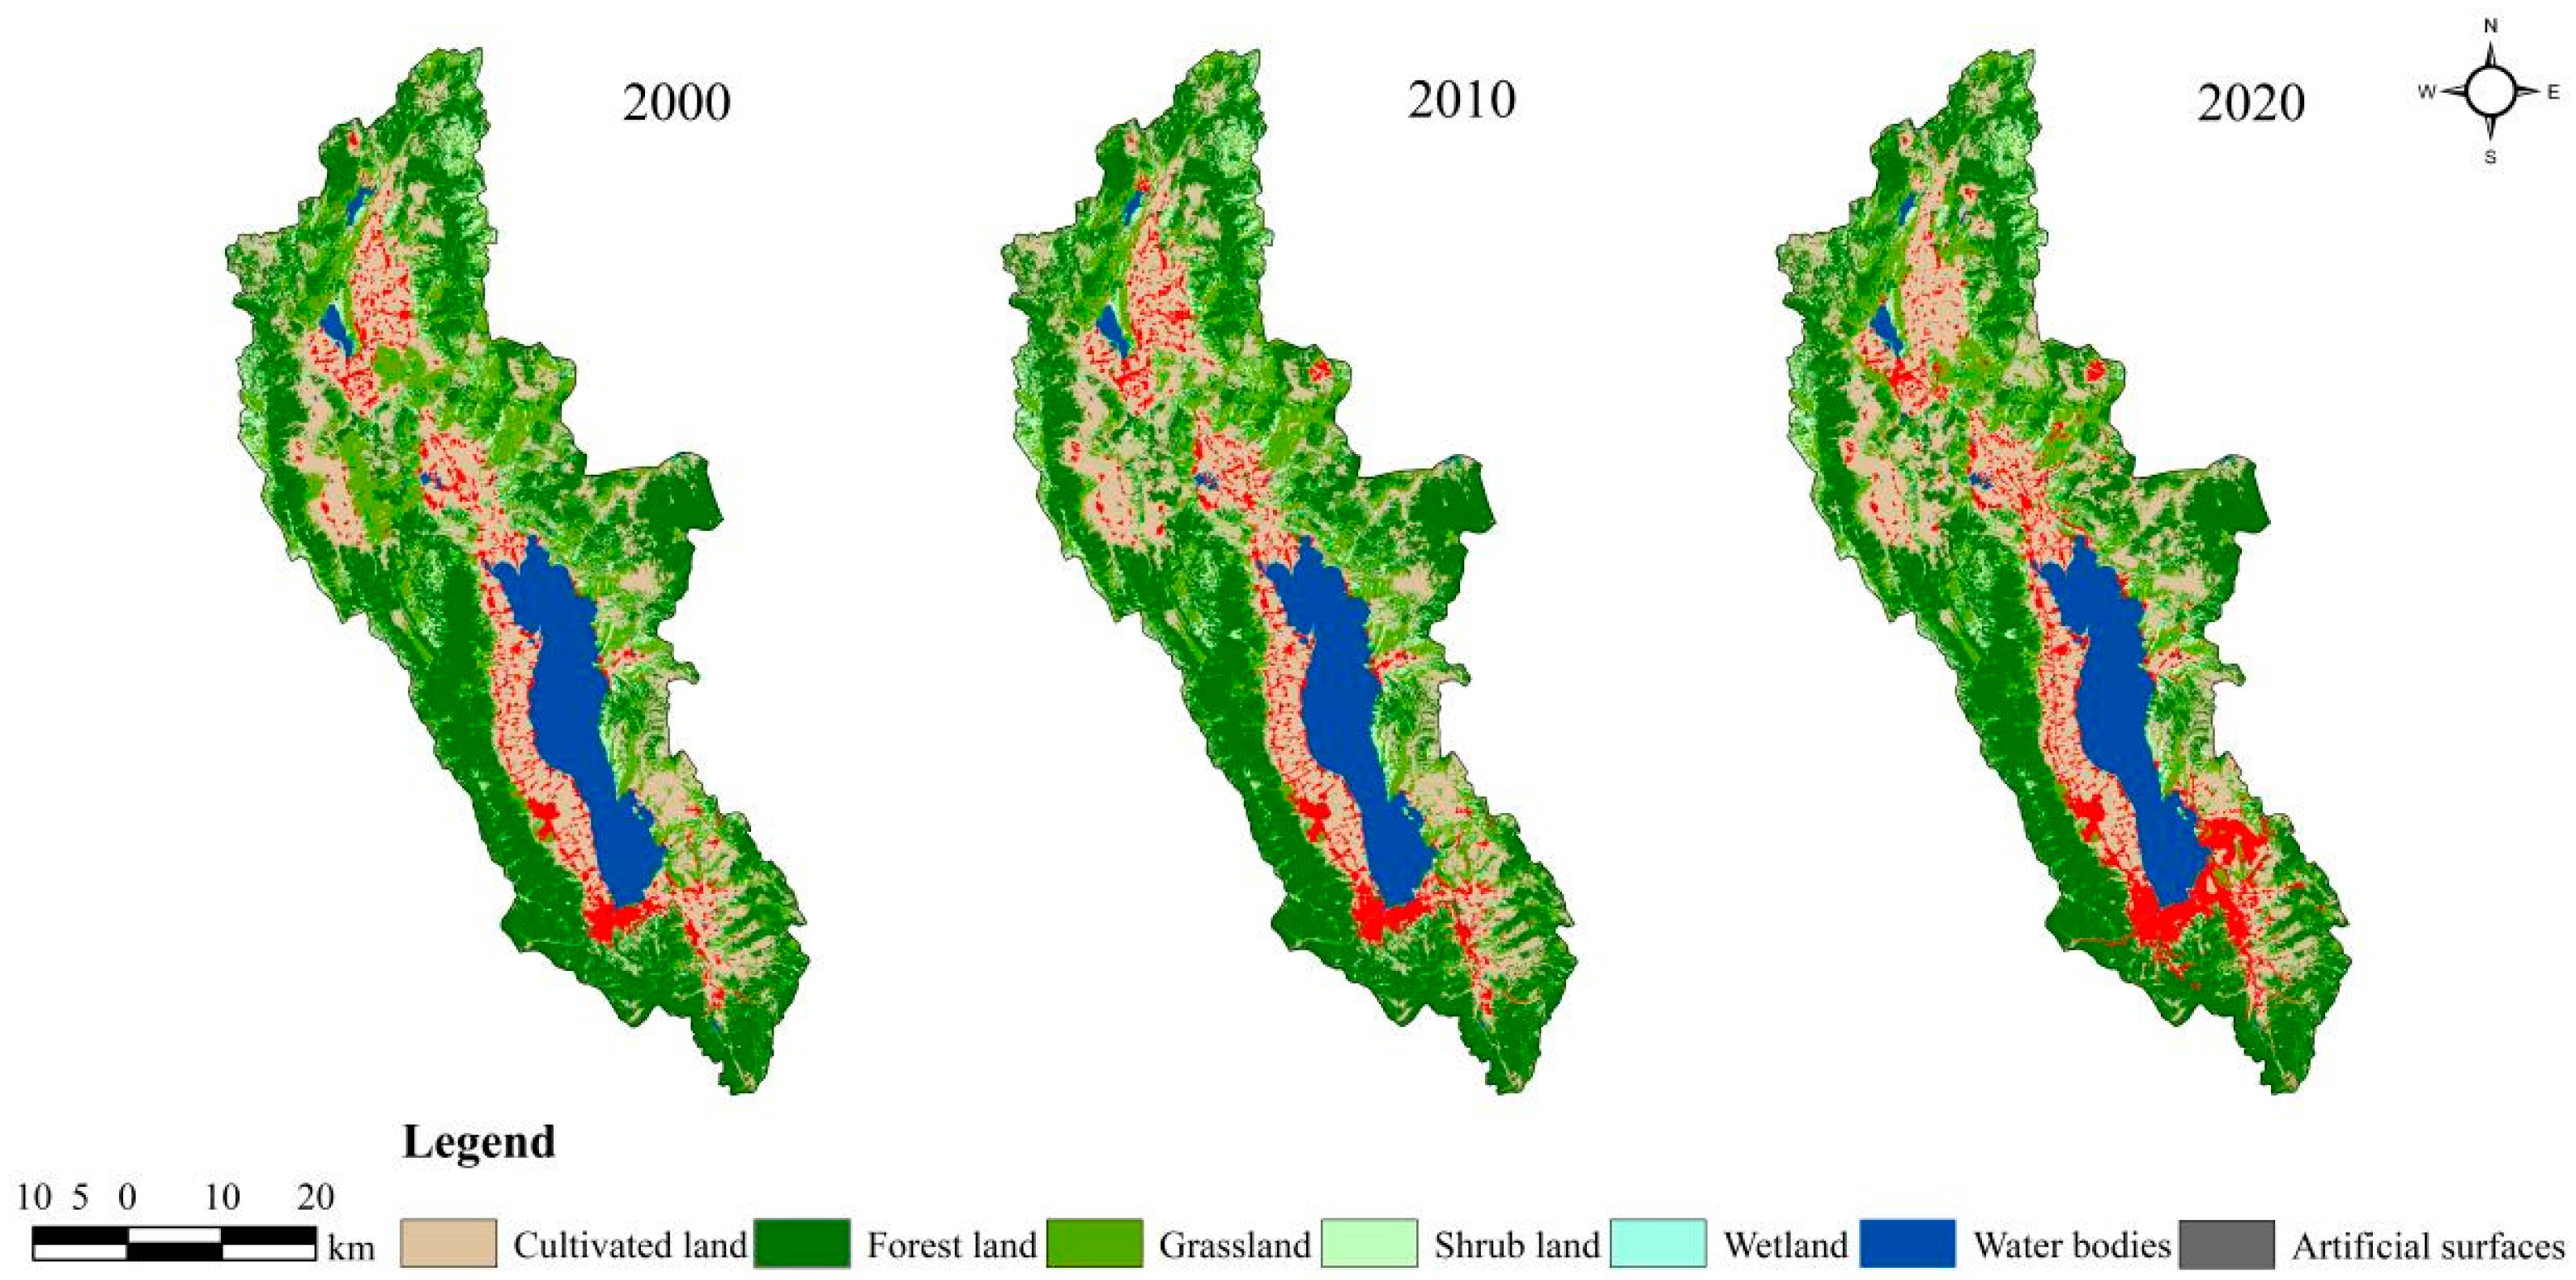
3.1. Analysis of Forest land Change Characteristics in the Erhai Rim Region

Based on Figure 3 and Table 1 and Table 2, we know that the land-use structure in the Erhai rim region changed obviously, and there were frequent and complex mutual transformation phenomena among various land-use types. The evolutionary features of the landscape pattern were further analyzed in terms of changes in the number of patches, fragmentation, separation and dominance indices of land-use types. Regarding the number of patches, the overall number of patches in the study area decreased, while the number of patches in wetlands, cultivated land and artificial surfaces increased, and the number of patches in forest land, grassland, shrubland and water bodies presented an overall decreasing trend. From the dominance index, forest land, as the dominant land-use type in the study area, has the highest dominance value and has a relatively strong influence on the landscape pattern of the whole area. In 2000, 2010, and 2020, the area of forest land was 112,227.03 hm2, 113,239.08 hm2, and 109,728.54 hm2, accounting for 37.97%, 38.32%, and 37.12% of the overall land area, respectively. It was mainly located in areas with less human activity at the periphery of the study area and crossed with grassland and shrubland. From 2000 to 2020, the change in forest land in the study area presented a development trend of an initial expansion and subsequent contraction, with the total area decreasing by 2498.49 hm2. From 2000 to 2010, the forest land mainly expanded by 1012.05 hm2. The number of patches in forest land increased, and its fragmentation, separation, interference, vulnerability, loss, and dominance also increased significantly. From 2010 to 2020, the change in forest land was mainly due to a shrinkage of 3510.54 hm2. The number of patches in forest land decreased, and the degree of fragmentation, separation, interference, vulnerability, loss, and dominance also decreased significantly. Based on the area of forest land change, the expansion of forest land mainly occurred in Fengyu Town, north of Erhai Lake; the most significant area of forest land shrinkage was on the east and south shores of Erhai Lake, and the area with the smallest change in forest land area was in the Cangshan National Nature Reserve, west of Erhai Lake.
The conversion matrix of land-use types was used to explore the interconversion of land-use types in the Erhai Rim from 2000 to 2020 (Table 2). Different degrees of mutual transformation were observed between the land-use types in the study area. Moreover, the findings demonstrate that although the implementation of the policy of returning farmland to forests has led to the conversion of cultivated land to forest land in a small part of the Erhai rim region, overall, the transfer to forest land was still mainly from shrubland and grassland. Affected by urbanization, the cultivated land was also converted to artificial surfaces. Among them, the most significant area of forest land shrinkage was in the northeast and south of Erhai Lake, and most of it has been converted to cultivated land and artificial surfaces that are closely related to the economy and society, indicating that the intervention of human activities on forest land in the Erhai rim region is still large.

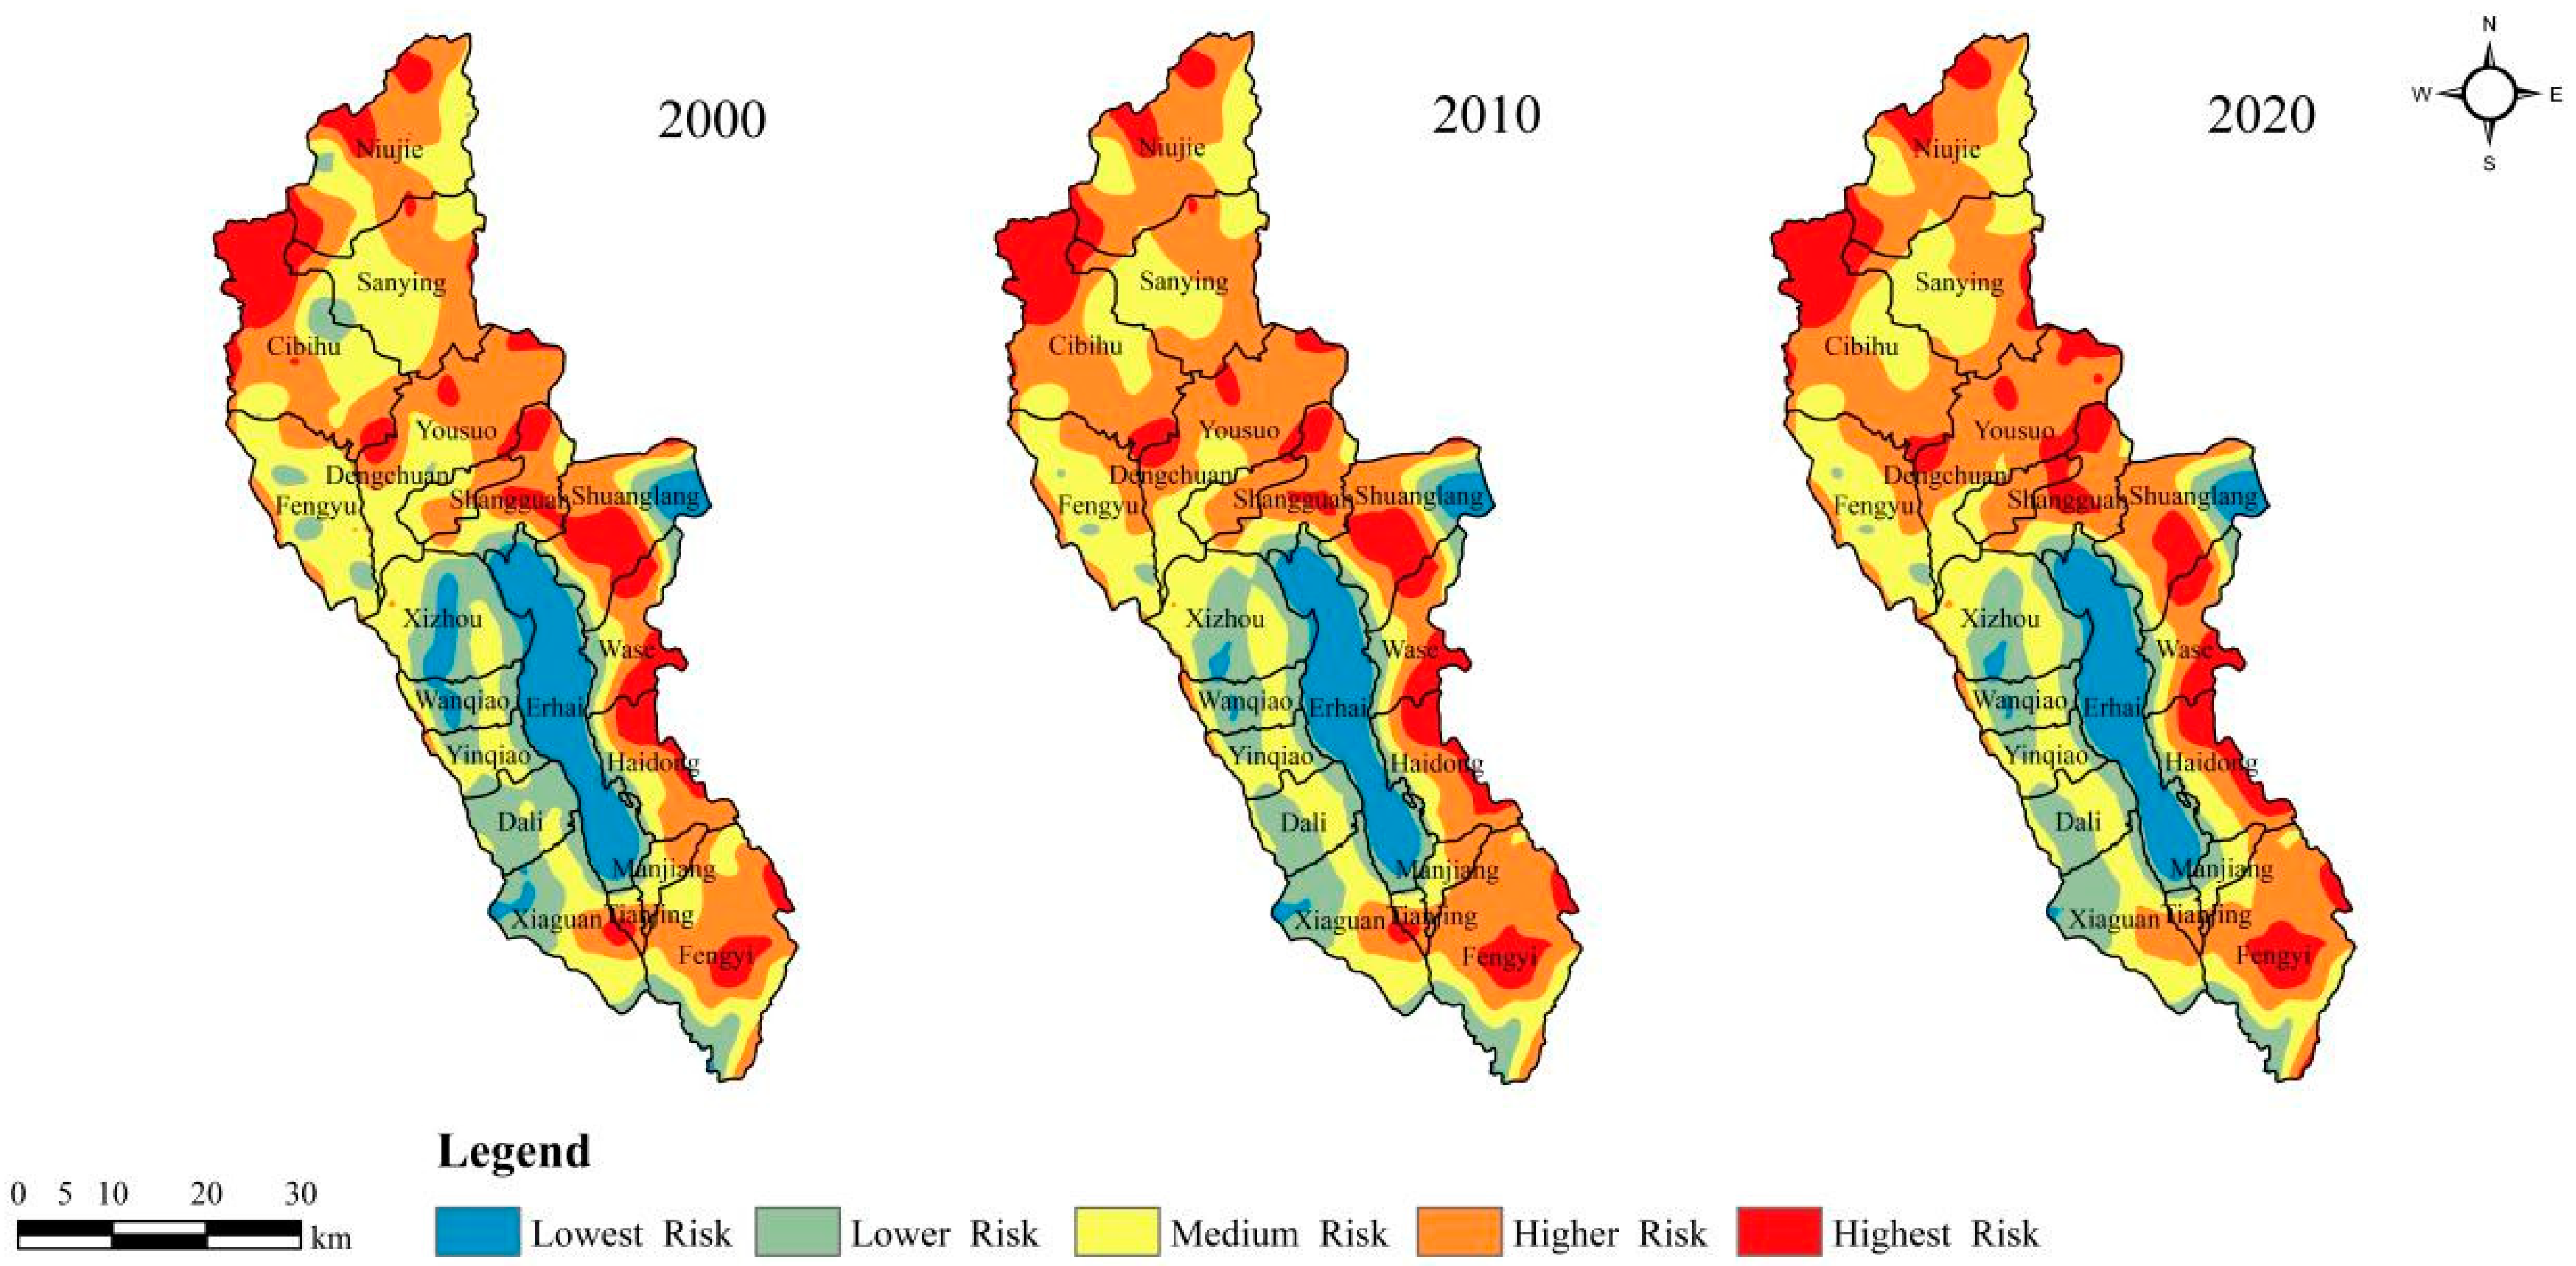
3.2. Analysis of Spatial and Temporal Variation Characteristics of Landscape Ecological Risk

In 2000, 2010, and 2020, the mean landscape ecological risk index values in the Erhai rim region were 0.0448, 0.0453, and 0.0457, respectively, indicating a total upward trend. This shows that with the advancement of urbanization and tourism, the ecological risk in the Erhai rim has increased. Meanwhile, to compare the grade changes of landscape ecological risk in the Erhai rim, the spatial distribution of landscape ecological risk in 2000, 2010, and 2020 was acquired via Kriging interpolation of the landscape risk index of 836 landscape ecological risk communities. To show and compare the changes in ecological risk intuitively, we combined the natural breakpoint method and divided it into five risk grades based on the values of 2010 (Figure 4): the lowest risk area (LERI < 0.024), lower risk area (0.024 ≤ LERI ≤ 0.034), medium risk area (0.034 ≤ LERI ≤ 0.043), higher risk area (0.043 ≤ LERI ≤ 0.051), and the highest risk area (LERI > 0.051).
From the area share of ecological risk in each landscape (Table 3), from 2000 to 2020, the overall ecological risk in the Erhai rim was high, with the area share of medium-risk and higher-risk areas accounting for more than 60%, whereas the area share of low ecological risk area was less than 10%. From the perspective of the area change at each landscape’s ecological risk level, the higher-risk and highest-risk areas presented a gradual upward trend. Among them, the higher-risk area increased the most, from 92,044.67 hm2 in 2000 to 105,638.47 hm2 in 2020, an increase of 13,593.8 hm2, and the proportional area ratio also increased from 31.50% in 2000 to 36.11% in 2020, becoming the largest ecological risk area in this region. However, the lowest-, lower-, and medium-risk areas tended to be lower. Among them, the medium-risk areas experience the most significant decrease, by 5969.81 hm2. The area change in the landscape ecological risk level shows that the landscape ecology in the Erhai rim region generally tends to deteriorate. In the future, in order to prevent an increase in risk levels, more attention should be focused on the ecological protection of areas with medium risk and above. From 2000 to 2020, the spatial distribution of landscape ecological risk level in the Erhai rim region was comparatively stable and formed a “multi-polar” distribution pattern in space. The distribution of ecological risks in the landscape showed significant spatial heterogeneity. The landscape ecological risk in the Haixi area was significantly lower than that in the Haidong area, and it was mainly in the lowest- and lower-risk areas. From 2000 to 2020, the spatial distribution of the lowest-risk areas in the Erhai rim region remained essentially unchanged, being mainly concentrated in the waters of the Erhai Sea, the Cang Mountains on the western side of the Erhai Lake, and the Jizu Mountain area on the northeastern side, and remained highly consistent with the scope of the nature reserve. Within the study period, the west coast of Erhai Lake was dominated by low- and medium-risk areas, and the lowest-risk areas were distributed in a ring. However, with the development of tourism in Xizhou Town, land-use types have changed greatly, the landscape pattern has become increasingly complex, and the ecological risk areas have deteriorated, showing the transformation of the lowest- and lower-risk areas to higher-level ecological risk areas. The townships in Eryuan County north of Erhai Lake were mainly highest-risk areas, relatively highest-risk areas, and medium-risk areas, and there existed little change between the ecological risk levels. The ecological risks on the eastern and southern sides of Lake Erhai changed significantly. The highest-risk areas on the eastern side of Erhai Lake are mainly were distributed in mountainous forest areas with relatively fragmented landscapes. Although Dali Bai Autonomous Prefecture has increased its ecological protection and restoration efforts in recent years, they are affected by karst landforms. The soil is barren, the survival rate of tree species is low, ecological restoration is difficult, the landscape vulnerability index is high, and the ecosystem has poor resistance to external interference. Therefore, the risk of ecosystem deterioration increased, which is manifested by the transformation of the landscape ecological risk level to a higher level, with the increase in ecological risk south of Erhai Lake mainly due to the construction of innovative industrial parks. There have been significant conversions of forest and agricultural land into artificial surfaces. High-intensity human activities make landscape patches on the edge of artificial surface expansions more fragmented, leading to an increase in high-risk areas. In contrast, in the courtyard office area of the innovation industrial park on the south bank of Erhai Lake, due to stable land development, the space is connected to a piece, the landscape patches are gradually aggregated and regular, and the landscape fragmentation is reduced. This leads to a reduction in landscape loss; thus, the landscape ecological risk value is reduced from the highest to a lower risk area. Despite a number of ecological conservation initiatives having been conducted, high-intensity economic activities and special geological features in the region have led to a continuous reduction in forest land, shrubland, and grassland, a significant reduction in lake ecosystem functions, and an increased risk of ecosystem deterioration.

3.3. Impact Analysis of Forest Land Change on Landscape Ecological Risk Based on MGWR Model

Forest land, the most obvious type of land use in Erhai rim region, has the largest area and is crucial as an ecological barrier. Its change may threaten regional ecological security. From 2000 to 2020, the main forms of forest land change in the Erhai Lake area were forest land expansion and shrinkage, and the intensity index can better characterize the degree and speed of forest land change; therefore, this study will explore the impact of forest land expansion intensity and shrinkage contraction intensity on landscape ecological risk and offer a scientific foundation for the future development of differentiated forest land protection strategies in the Erhai Lake area of China.

3.3.1. Effects of Forest Land Expansion Intensity on Landscape Ecological Risk

(1)
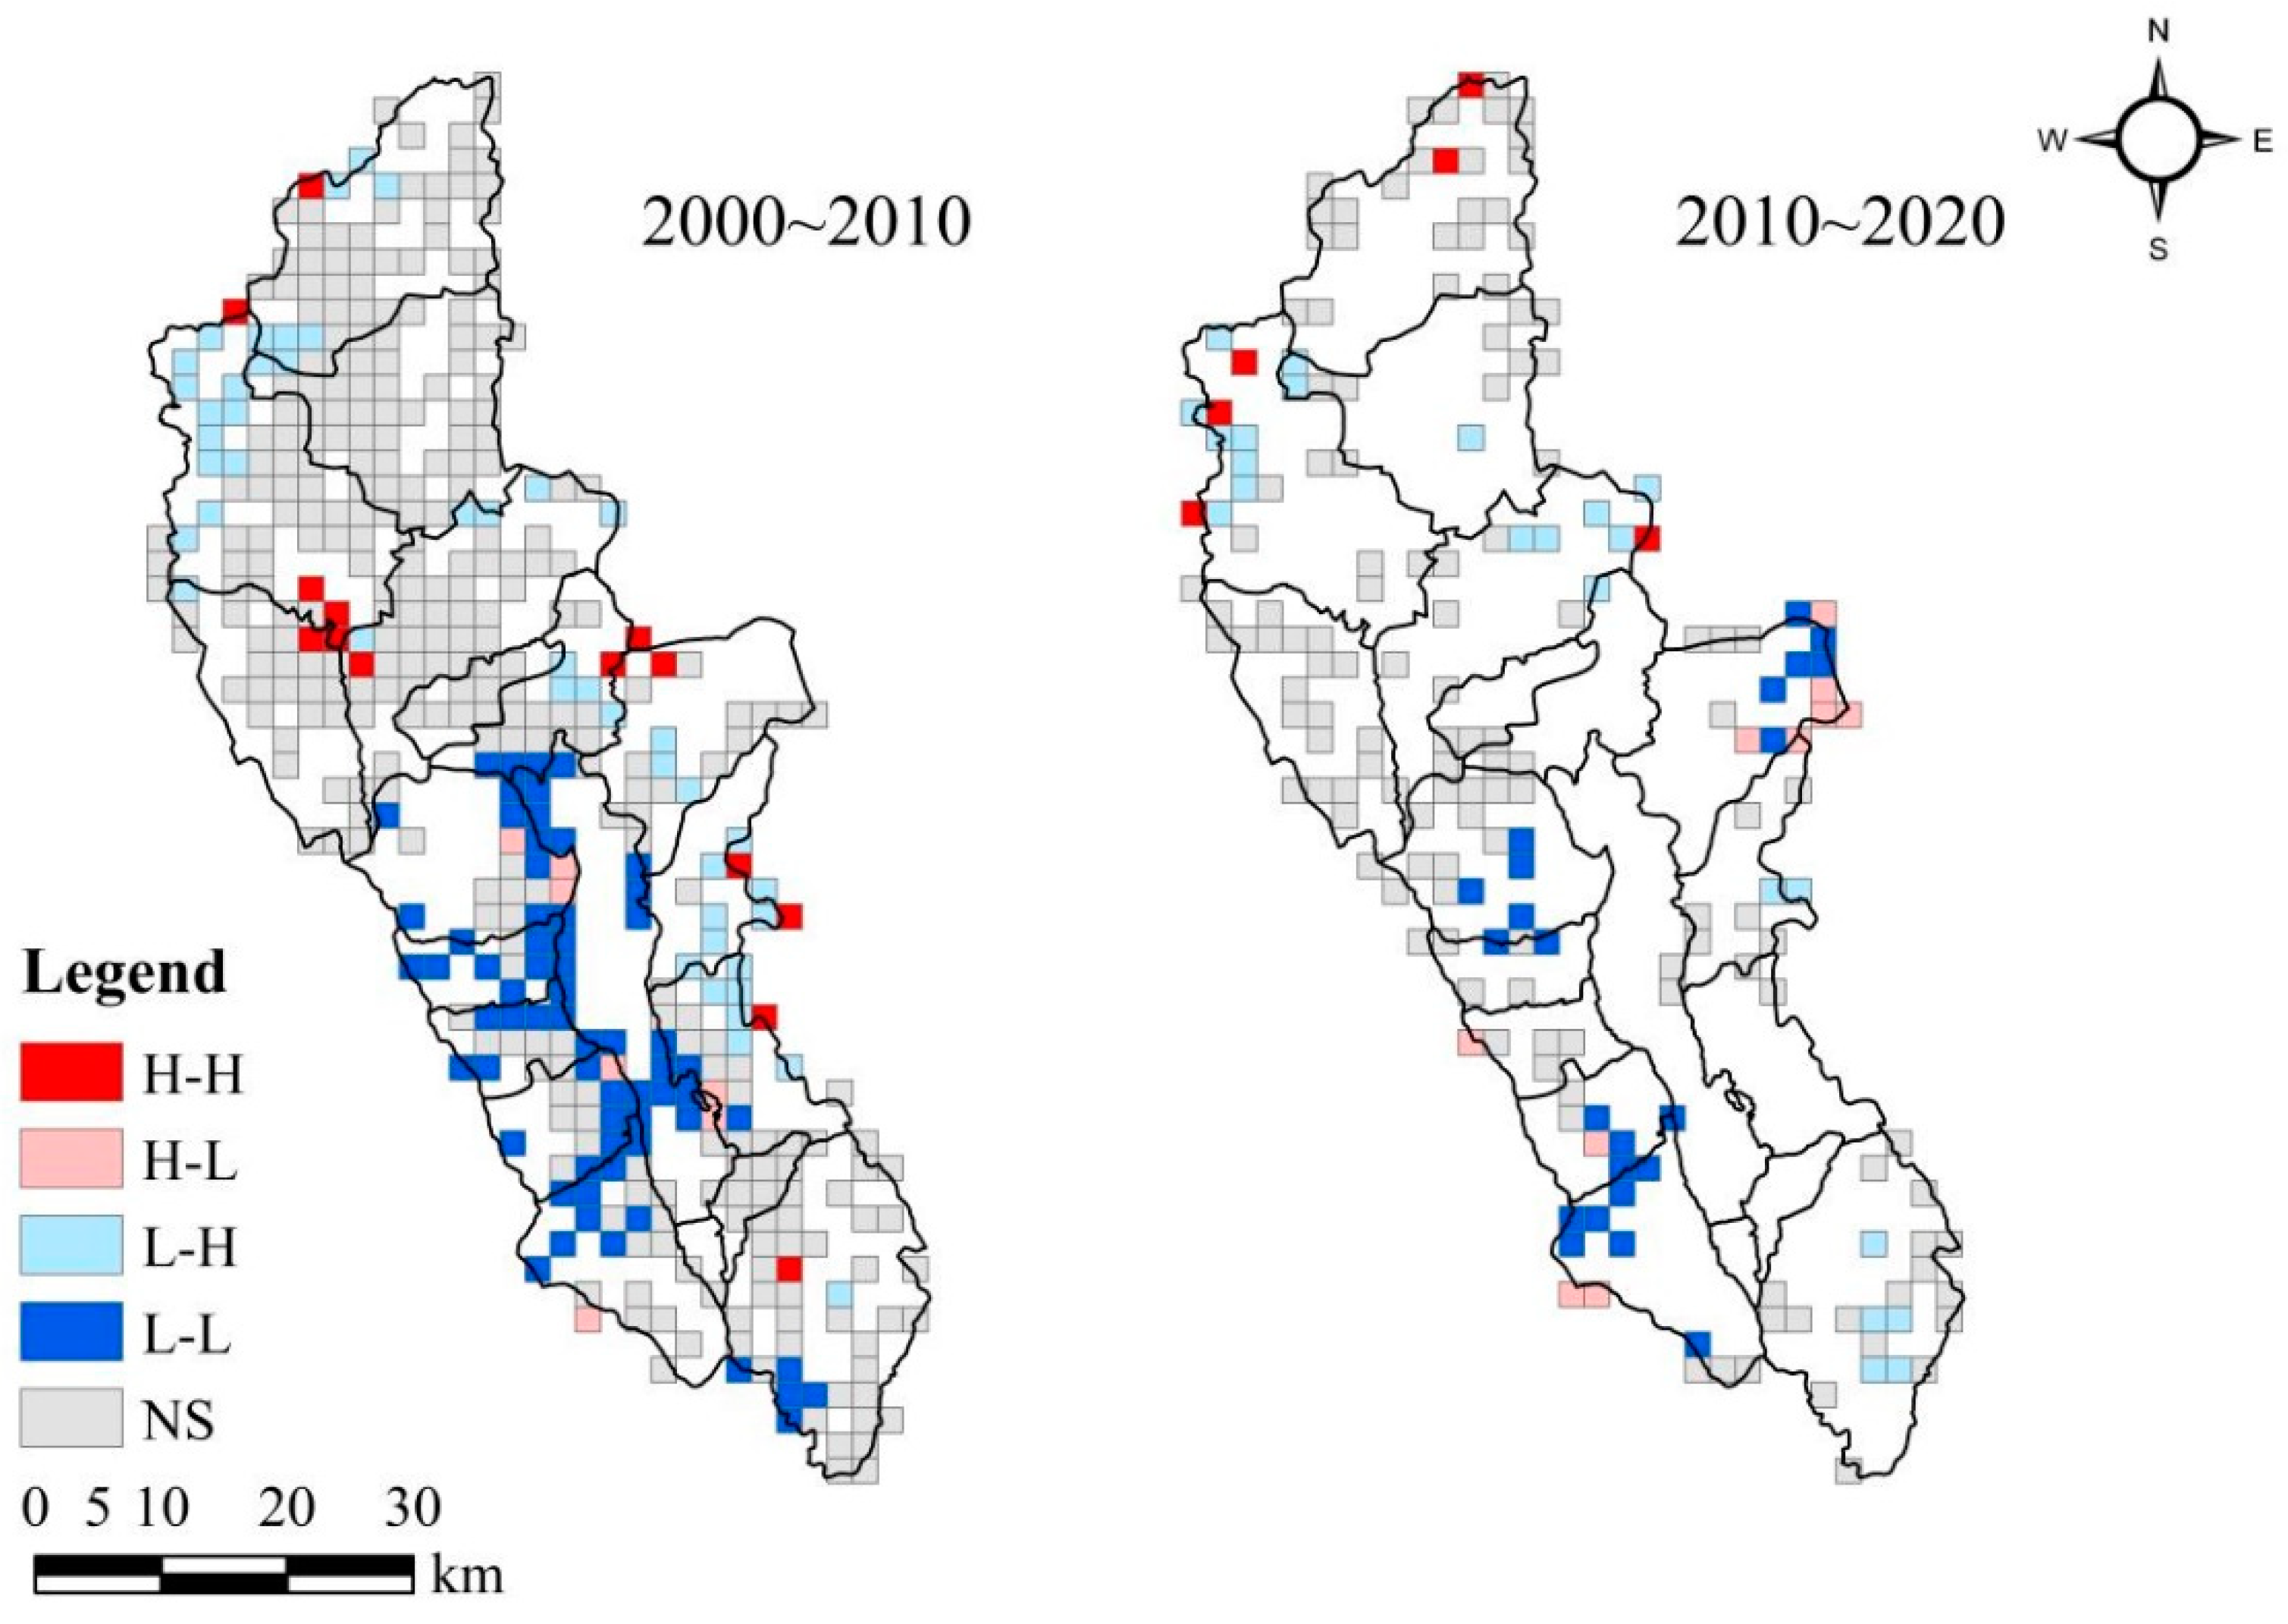
Spatial correlation between forest land expansion intensity and landscape ecological risk
This study used the Geoda spatial analysis tool and the k-nearest neighbor spatial weight matrix. Taking the land expansion intensity index as the first variable and the landscape ecological risk value as the second variable, the bivariate global spatial autocorrelation Moran’s I index of forest land expansion intensity and landscape ecological risk in the Erhai rim region from 2000 to 2010 and 2010 to 2020 were 0.053 and −0.053, respectively, and significant at the 0.005 level. There existed an obvious positive spatial correlation between forest land expansion intensity and landscape ecological risk in 2000–2010, and the increase in forest land expansion intensity would aggravate the increase in landscape ecological risk; nevertheless, there existed a significant negative spatial relationship between forest land expansion intensity and landscape ecological risk in the study area in 2010–2020. The spatially significant negative correlation between the intensity of forest land expansion and landscape ecological risk in the study area from 2010 to 2020 was significant, and the increase in forest land expansion intensity did not aggravate the increase in landscape ecological risk in this period. The bivariate global spatial autocorrelation test suggests that there is a significant spatial dependence effect between forest land expansion intensity and landscape ecological risk. Consistent with the results, there was an obvious space-dependent effect between forest land expansion intensity and landscape ecological risk.
We used the Geoda spatial analysis tool to draw a bivariate local index of a spatial autocorrelation (LISA) cluster diagram with the purpose of further exploring the local spatial correlation features of the impact of forest land changes on landscape ecological risk in the Erhai rim region (Figure 5). From 2000 to 2010, the effect of forest land expansion intensity on landscape ecological risk in the Erhai rim region was mainly low forest land expansion intensity–low landscape ecological risk area in local spatial agglomeration mainly distributed on the west and east coasts of Erhai Lake, around the towns of Cuose and Haidong and southeast of Fengyi Town. From 2010 to 2020, the impact of forest land expansion intensity on landscape ecological risk was mostly based on low forest land expansion intensity–low landscape ecological risk areas and high forest land expansion intensity–low landscape ecological risk areas. The low forest land expansion intensity–low landscape ecological risk area is mostly concentrated in Xizhou Town, Dali Town, Xiaguan Town, and Shuanglang Town on the east coast of Erhai Lake. The high forest land expansion intensity–low landscape ecological risk areas are distributed in Shuanglang Town, Yinqiao Town, Dali Town, and Xiaguan Town.
(2)
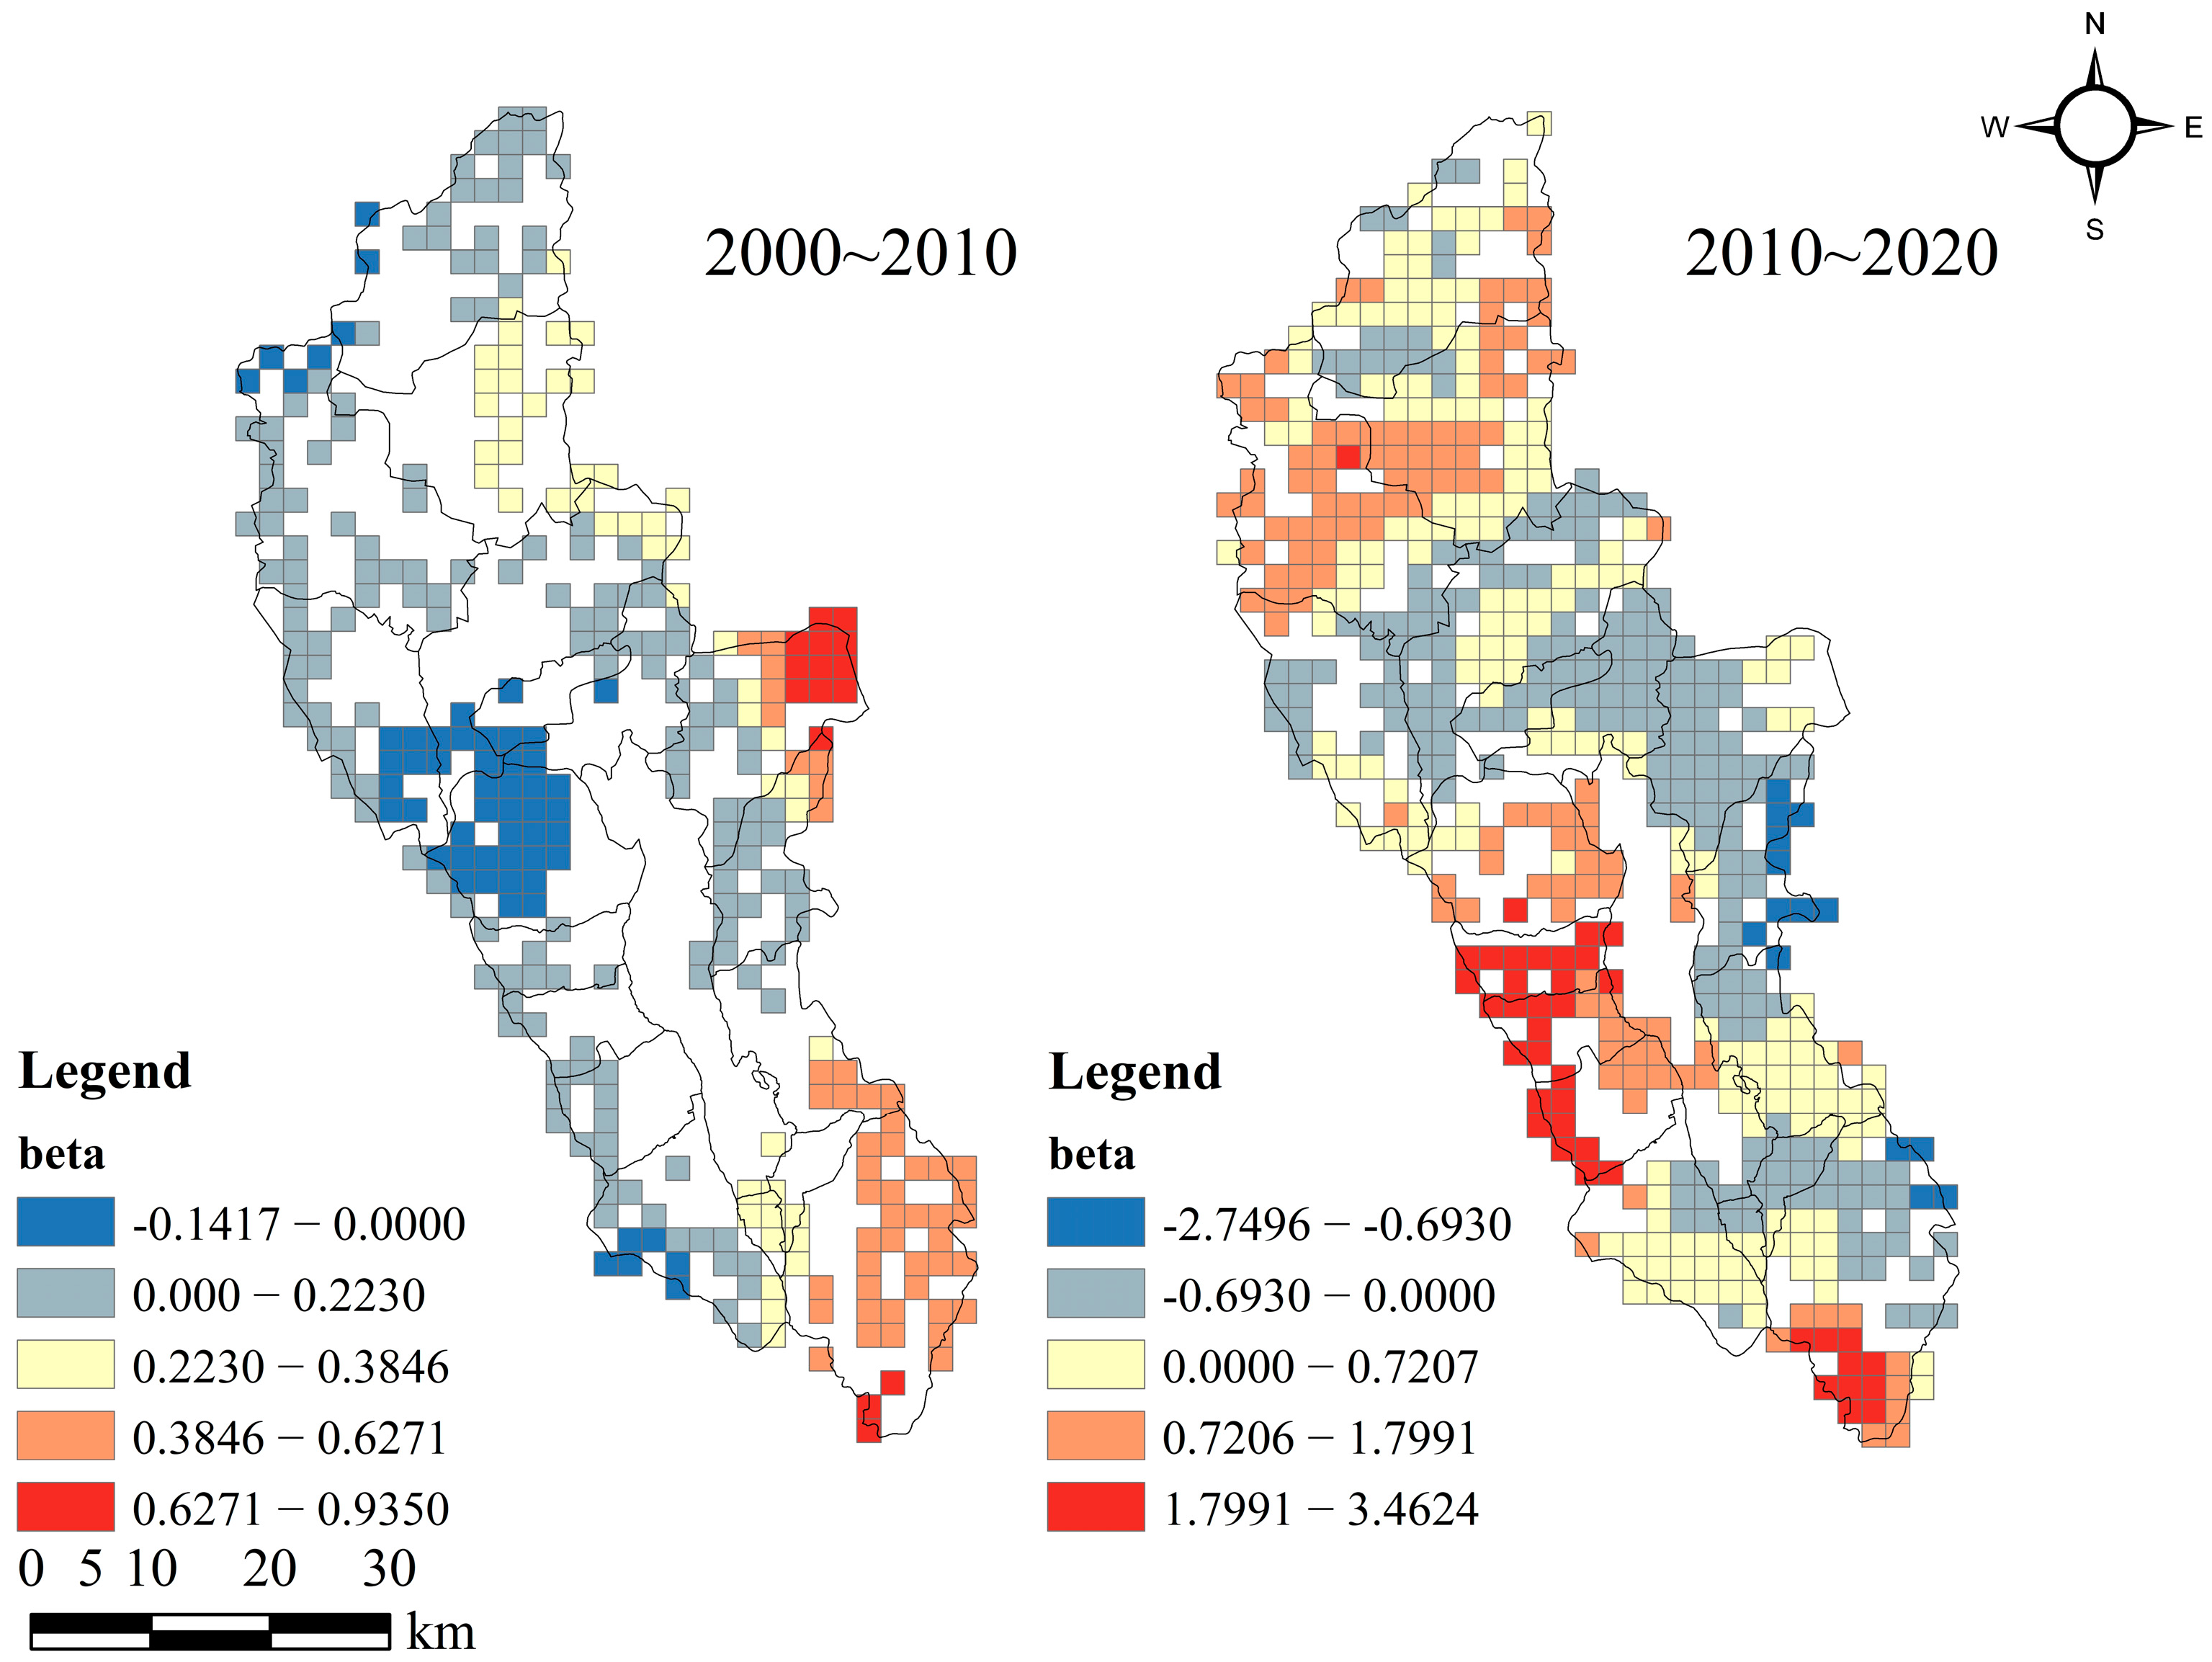
Spatial heterogeneity of the effect of forest land expansion intensity on landscape ecological risk
In the current work, the forest land expansion intensity index was used as the explanatory variable, and the landscape ecological risk value was the dependent variable (Figure 6). The MGWR model was adopted for analyzing the two variables. From the perspective of time scale, from 2000 to 2010, the regression coefficient of the impact of forest land expansion intensity on landscape ecological risk in the Erhai rim region was mainly positive, and the positive area accounted for 75.40%; that is, the forest land expansion intensity and the number of forest land landscape patches increased, the landscape fragmentation was large, and the landscape ecological risk value continued to increase. During the period from 2010 to 2020, all the regression coefficients of the influence of forest land expansion intensity on landscape ecological risk in the Erhai rim region were negative; that is, the increase in forest land expansion intensity causes the forest land to present a concentrated and contiguous distribution, which will not aggravate the increase in landscape ecological risk but will promote the reduction in landscape ecological risk. In line with the aspect of spatial distribution, the spatial differences in the impact of forest land expansion on landscape ecological risk were large. During the period from 2000 to 2010, the wider area of the Erhai Rim was positive and the smaller area was negative. The high-value areas are mostly concentrated in Xizhou, Wanqiao, and Yinqiao Towns on the west bank of Erhai Lake, and in Xiaguan and Fengyi Towns on the south bank. The expansion of forest land in these areas was mainly due to cultivated land and artificial surfaces. The intensity of forest land expansion was large, the distribution of forest land changed from concentration to dispersion, and the degree of landscape fragmentation and separation and the landscape ecological risk increased. The low value area is distributed in Shangguan, Shuanglang, and Wase Towns northeast of Erhai Lake. Forest land expansion was mostly in areas where the distribution of forest land and grassland was relatively concentrated. It is mainly due to the optimization and adjustment of land-use types within the forest land. The intensity of forest land expansion hs increased, the area of forest land increased significantly, fragmentation and separation within forest land decreased, and the landscape ecological risk decreased accordingly. From 2010 to 2020, the impact of forest land expansion intensity on landscape ecological risk in the Erhai rim region was negative, and the difference between regression coefficients was small, indicating that forest land expansion stabilized during this period and had little impact on landscape ecological risk. Meanwhile, the regression coefficient of the impact of forest land expansion on landscape ecological risk was shown to be high in the southwest and low in the northeast and was distributed in the northwest–southeast band.

3.3.2. Effects of Forest Land Shrinkage on Landscape Ecological Risk
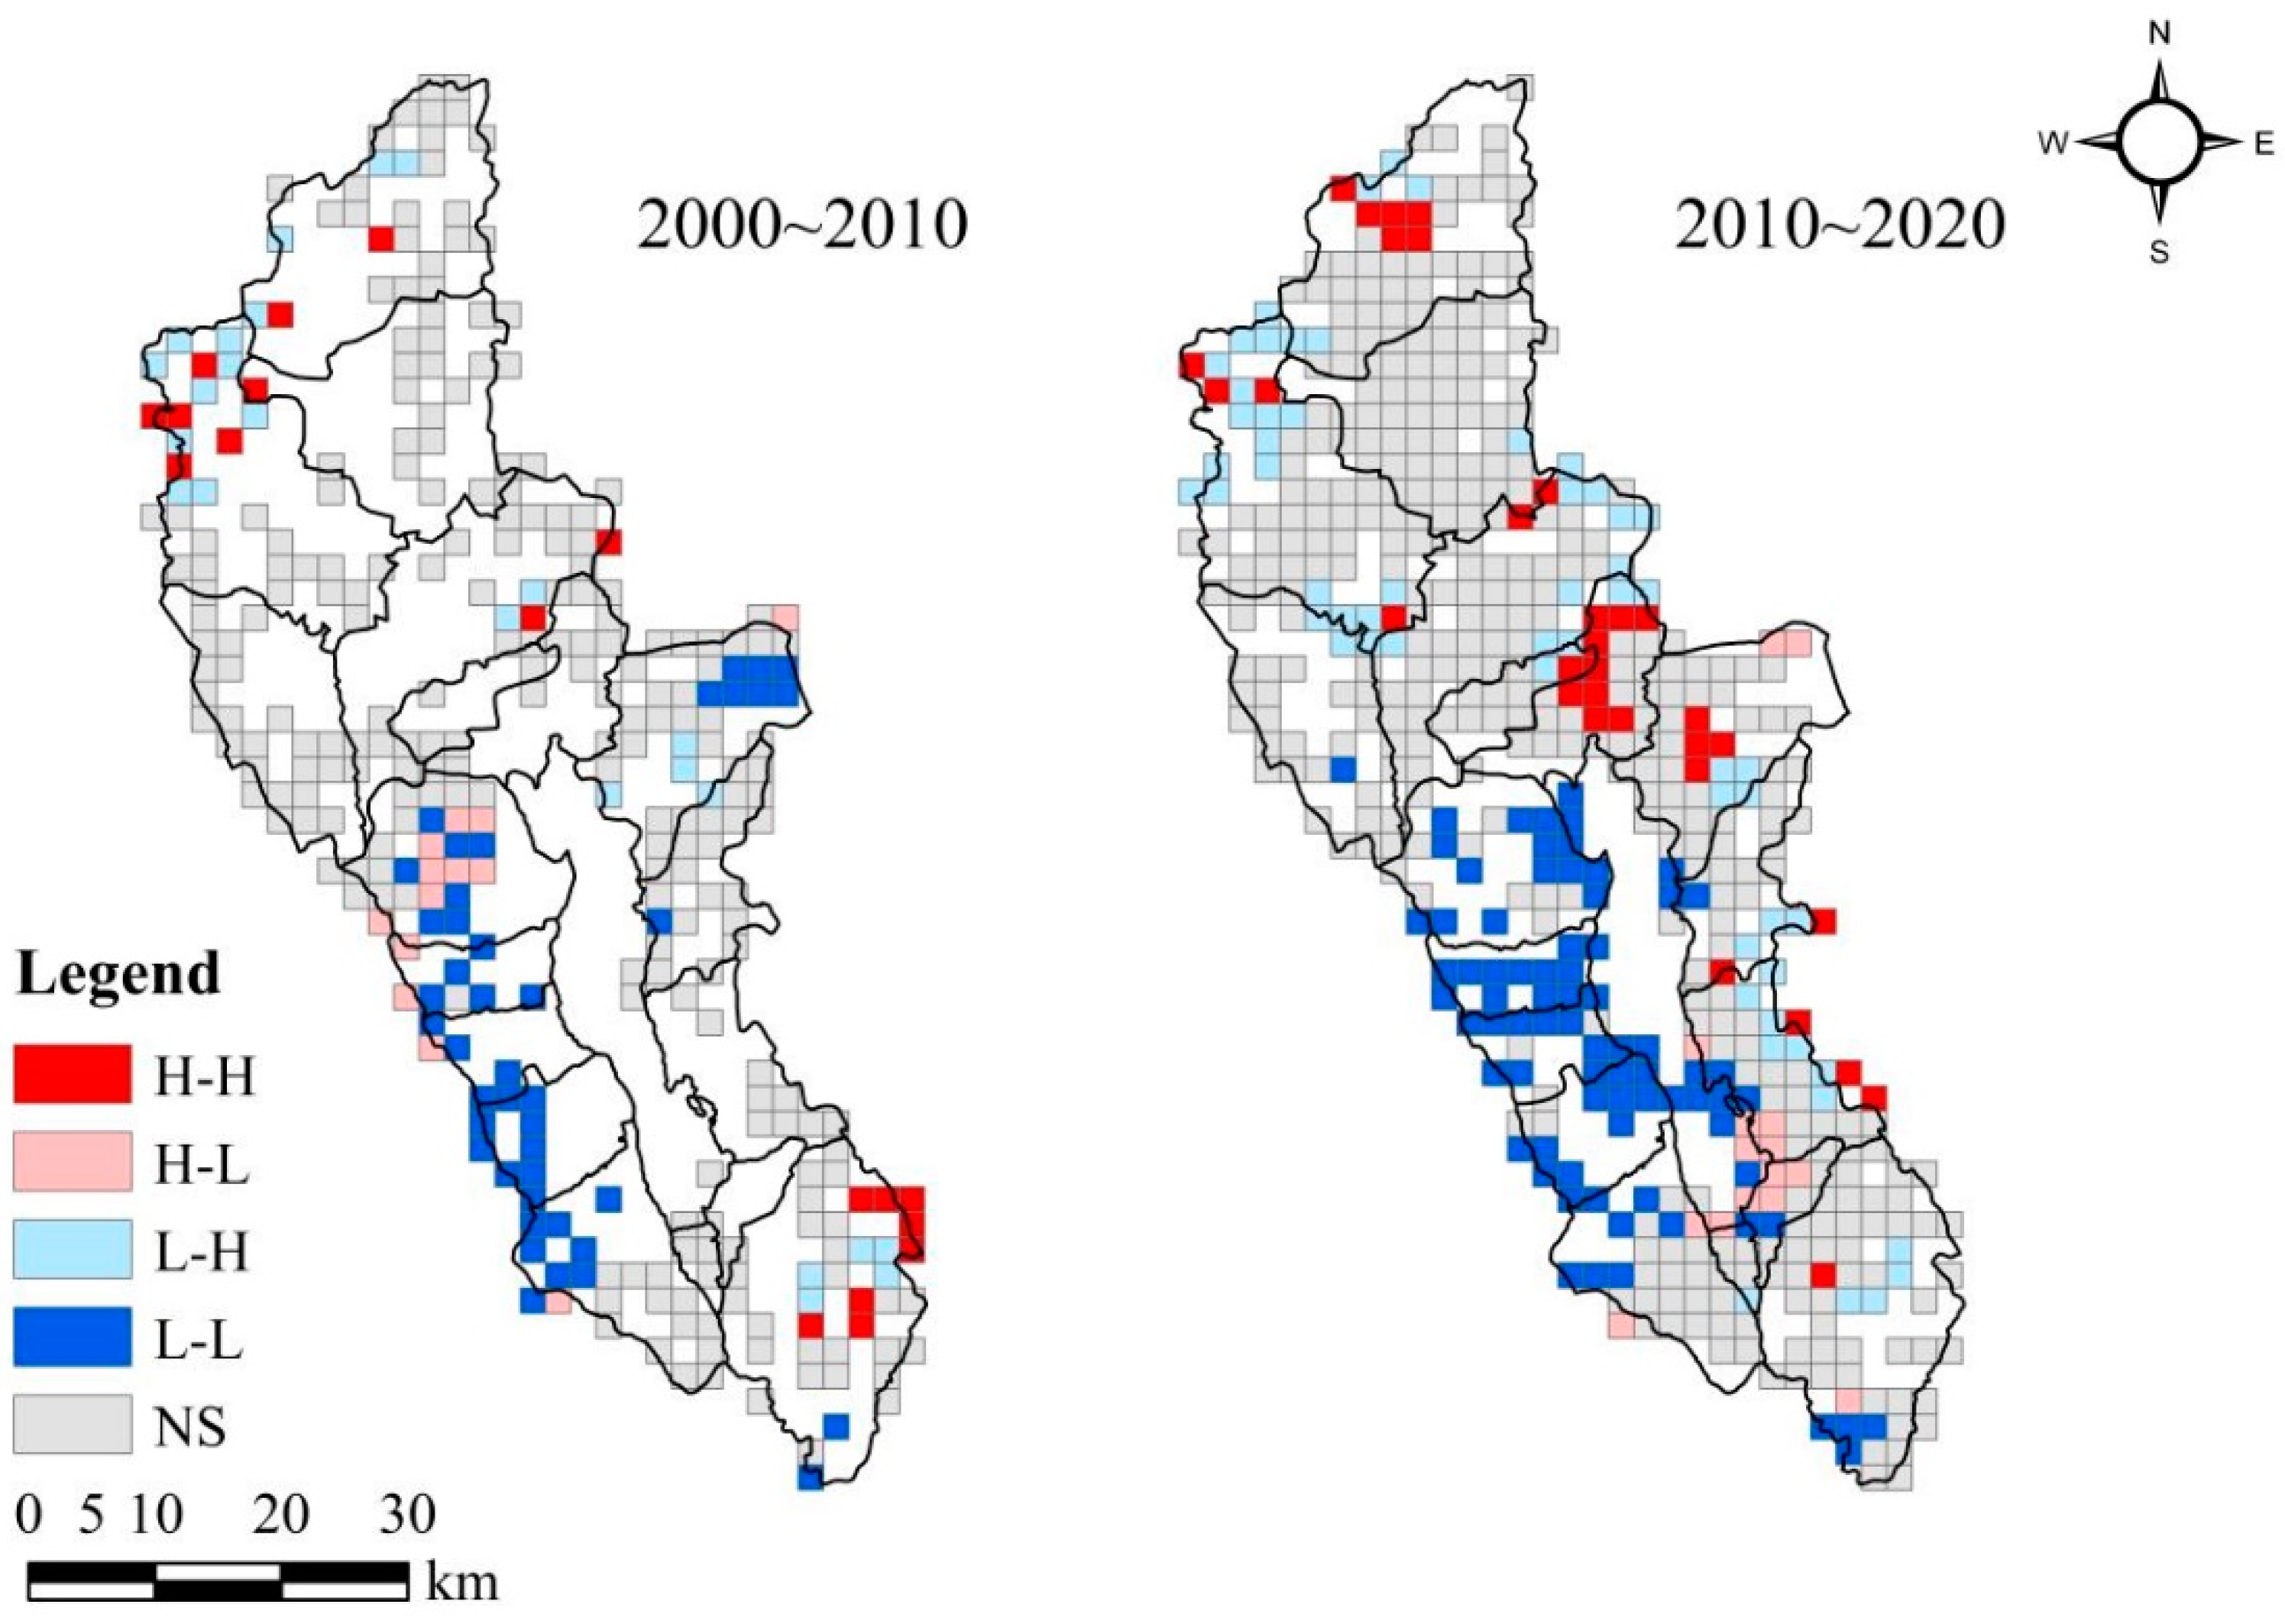
(1)
Spatial correlation between forest land shrinkage intensity and landscape ecological risk
Similarly, the forest land shrinkage intensity index was used as the first variable, and the landscape ecological risk value was the second variable. The Geoda spatial analysis tool was employed to analyze the bivariate global spatial autocorrelation Moran’s I index of the effect of forest land shrinkage intensity on landscape ecological risk, −0.048 and 0.059, respectively, and was of significance at the 0.005 level. There existed an obvious negative spatial correlation between forest land shrinkage intensity and landscape ecological risk in the study area from 2000 to 2010, indicating that forest land shrinkage intensity increased and landscape ecological risk decreased. From 2010 to 2020, there was a significant positive spatial correlation between forest land shrinkage intensity and landscape ecological risk in the Erhai rim region, and an elevation in the forest land shrinkage intensity aggravated the increase in landscape ecological risk. Based on the obtained results, there was a significant spatial relationship between the intensity of forest land shrinkage and landscape ecological risk regarding spatial dependence.
From the bivariate local spatial autocorrelation LISA clustering map of the effect of forest land shrinkage intensity on landscape ecological risk (Figure 7), from 2000 to 2010 and 2010 to 2020, the impact was mainly in low forest land shrinkage intensity–low landscape ecological risk areas in the local spatial agglomeration. From 2000 to 2010, the low forest land shrinkage intensity–low landscape ecological risk areas were mostly distributed in nature reserves with higher altitude and better forest coverage, namely the Cangshan Mountain on the west coast of Erhai Lake and the Jizu Mountain in Shuanglang Town on the northeast shore of Erhai Lake. In addition, from 2010 to 2020, the area of low forest land shrinkage intensity–low landscape ecological risk increased obviously and was mainly distributed in the Cangshan Mountains and flat urban areas on the west shore of Erhai Lake, with a small-scale distribution on the east coast of Erhai Lake and south of Fengyi Town.
(2)
Spatial heterogeneity of the impact of forest land shrinkage intensity on landscape ecological risk
The forest land shrinkage intensity index was used as the explanatory variable to further investigate the spatial heterogeneity of the impact of forest land shrinkage intensity on landscape ecological risk, and the landscape ecological risk value was the dependent variable (Figure 8). The MGWR model was used for the regression analysis. From the aspect of time scale, from 2000 to 2020, the regression coefficient of the impact of forest land shrinkage intensity on landscape ecological risk in the Erhai rim region was mainly positive, and the regression coefficient rose from 0.20 to 0.42. The positive impact of forest land shrinkage intensity on landscape ecological risk was even more significant. However, from the perspective of spatial distribution, the effect of forest land shrinkage intensity on landscape ecological risk showed significant spatial differences. From 2000 to 2010, except for some negative grids in Xizhou, Fengyu, Cibihu, and Xiaguan Towns and Niujie Township, all regions were positive. The land-use types in the low-value areas were mainly forest land and grassland, and most of the forest land was converted to grassland. Grasslands increased over a large area, the fragmentation of landscape patches decreased, and the landscape ecological risk was low. The high-value area is primarily distributed northeast of Shuanglang Town. Forest land shrinkage in this area was mainly concentrated at the edge of the junction between cultivated and forest land. Forest land is occupied by cultivated land; the landscape fragmentation and degree of interference are large, and the landscape ecological risk is high. From 2010 to 2020, the range and depth of the impact of forest land shrinkage intensity on landscape ecological risk in the Erhai rim region increased, and the spatial differences were more complex. The high-value areas were mainly distributed in the towns of Xizhou, Wanqiao, Yinqiao, and Xiaguan and southwest of Fengyi and Cibihu on the western shore of Erhai Lake. The high-value distribution areas are mostly at the edge of the junction of forest land and other land-use types. The degree of landscape fragmentation and separation is high, and the shrinkage of forest land can lead to an increase in the landscape ecological risk in this area. The low-value areas were mostly located in the marginal areas of the eastern part of the study area. These areas had smaller forest land shrinkage and higher landscape ecological risk, indicating that the higher landscape ecological risk in these areas may have been caused by other factors.

4. Discussion

As one of the three major forest regions in China and one of the key areas of the ecological security barrier in Southwest China, the Erhai rim region is abundant in ecological resources. However, with the development of urbanization and tourism, cultivated land and artificial surfaces occupy a large amount of ecological space. The area of ecological lands, such as forest land, grassland, shrub land, and water bodies, is decreasing, posing a threat to the security of the regional ecological environment. As the most important land-use type in the Erhai rim region, forest land plays a critical part in maintaining regional ecological functions, including water and soil conservation, water quality improvement, habitat maintenance, and other ecological functions. However, its changes were influenced by natural factors and human activities, which has a great effect on the landscape pattern and landscape ecological risk of Erhai rim region.
(1)
The construction of an ecological civilization in the Erhai rim has achieved remarkable results, and government policies and economic development have had a profound impact on forest land changes. The years 2000, 2010, and 2020 are important time points for the implementation of China’s natural forest resource protection project, and forest land change in the Erhai rim region also shows important characteristics at these stages. From 2000 to 2010, due to the effective implementation of the first phase of the National Natural Forest Resources Protection Project and the policy of returning cultivated land to forest land, the area of forest land in the Erhai rim increased from 112,227.03 hm2 in 2000 to 113,239.08 hm2 in 2010, showing an expansion in forest land change. From 2010 to 2020, despite the implementation of the second phase of the Natural Forest Resource Protection Project, construction projects such as the central city of western Yunnan, mountainous city of Haidong, Dali Expressway, railway, and innovative industrial park were launched because of the acceleration of urbanization. The forest land on the low mountainous gentle slope and the suburban area was required for urban and industrial construction land, and the area occupied ecological land such as forest land, grassland, shrubland, and water bodies was significantly reduced. Most of it was converted to artificial surfaces and cultivated land closely related to human activities. During the period from 2000 to 2020, the spatial distribution of forest land changes in the Erhai rim region varied. The expansion of forest land mainly occurred in Fengyu Town, north of Erhai Lake. Large-scale planting of walnut trees had a vital impact on the stability and increase in forest land. The shrinkage of forest land was mainly in the construction area of Haidong Mountain City and an innovative industrial park, in line with the economic development of the Erhai rim region. The change in forest land area in the Cangshan National Nature Reserve on the western shore of Erhai Lake was not obvious due to the protection of the ecological environment in the Erhai rim region that guaranteed the protection of forest land and improvement of ecological environment quality.
(2)
The landscape ecological risk in the Erhai rim region deteriorated overall but partially improved. The landscape ecological risk value in the Erhai rim region presented a gradual upward trend, and the ecological risk level in the region was mainly due to medium- and higher-risk areas. Clearly, the areas of higher and highest risk increased, whereas the lowest- areas, lower- areas, and medium-risk areas decreased. There existed significant spatial heterogeneity in the distribution of ecological risk levels. The ecological risk levels in the Haixi area were mainly the lowest- and lower-risk areas and the total ecological risk was significantly lower than that in the Haidong area. The lowest-risk areas were mostly concentrated in nature reserves such as Erhai Lake, Cangshan Mountain, and Jizu Mountain, where the landscape pattern was relatively smooth, whereas the highest-risk and higher-risk areas were mostly distributed in the northern, eastern, and southern parts of Erhai Lake. The landscape patterns of these areas were complex; in most of them, the landscape patches of forest land, grassland, and shrubland were staggered, and land-use changes were the most frequent and significant. Landscape patches exhibited high fragmentation, high separation, and poor connectivity. The interaction between different landscapes was blocked, resulting in high landscape ecological risk. In some areas, the ecological environment has exhibited a positive development trend. The Patio Office of the Innovative Industrial Park on the southern shore of Erhai Lake has a stable artificial surface development; landscape patches were spatially connected, landscape fragmentation decreased, and the ecological risk level changed from high to low.
(3)
Forest land changes in the Erhai rim region profoundly affect the ecological risk in the region. The bivariate global spatial autocorrelation Moran’s I index of forest land change and landscape ecological risk showed a significant positive correlation between forest land expansion and landscape ecological risk, which gradually became negative over time. The correlation between forest land shrinkage and landscape ecological risk was the opposite and gradually changed from negative to positive. High forest land expansion intensity–low landscape ecological risk areas and low forest contraction intensity–low landscape ecological risk areas indicate that ecological protection measures in the Erhai rim region are effective. Areas with low forest land expansion intensity and high landscape ecological risk, and high forest contraction intensity and high landscape ecological risk need to focus on forest land change dynamics to strengthen ecological restoration in the future. The driving mechanisms of landscape ecological risk changes caused by high forest land expansion intensity, high landscape ecological risk areas, high forest contraction intensity, low landscape ecological risk areas, and low forest contraction intensity and high landscape ecological risk areas deserve further exploration. From 2000 to 2020, the impact of forest land change on landscape ecological risk in the Erhai rim region was spatially heterogeneous. Reasonable forest land expansion can effectively alleviate the increase in landscape ecological risk and is closely related to the expansion of forest land. Forest land expansion has gradually shifted from fragmentation to concentration, and its impact on landscape ecological risk has gradually changed from positive to negative. The negative area spread from the northeast and north of Erhai Lake to the entire study area. The shrinkage of forest land aggravates the increase in landscape ecological risk, the positive impact of forest land shrinkage on landscape ecological risk is becoming increasingly significant, and the positive area is expanding. Therefore, in order to increase the area of forest land and lower the regional eco-logical risk, the Erhai rim region should highlight the development strategy of forest land with ecological priority, pay attention to the formulation of forest land protection and utilization planning, strive to deal with the conflicts between forest land resources, urban construction and agricultural production, etc., and promote intensive forest land expansion on the basis of keeping the “red line” of forest land. In addition, researchers should also pay attention to the selection of tree species in the karst landscape of the eastern coast of the Erhai Sea to improve the survival rate of trees and forest coverage in the region, thus promoting the high-quality development path of the Erhai rim region with ecological priority and green development as the guides.
The present study investigated the spatial heterogeneity of the impact of forest land change on landscape ecological risk in the Erhai rim region, and these results are highly reliable and provide significant guidance for forest land protection in the Erhai rim region. However, deficiencies remain in the research process and are subject to improvement.
(1)
With regard to the setting of the research scale, a variety of scales can be used for comparative research in the future to explore the correlation and influence between different variables at different scales, to enhance the accuracy of ecological protection planning, and scientifically coordinate the correlation between ecological protection and economic development.
(2)
Regarding the construction of the landscape ecological risk model, the present study only considered the area weights of each landscape from the aspect of land use without considering the influence of other ecological factors, thus reducing the ecological meaning of representation of landscape ecological risk; future research needs to be further supplemented and improved.
(3)
This study only discussed the influence of forest land change intensity on landscape ecological risk and did not consider the influence of other forest land change indices on landscape ecological risk. At the same time, research on impact models needs to be further explored, and a better impact model needs to be developed to investigate the impact of forest land change on landscape ecological risk.

5. Conclusions

In accordance with the land-use data of the Erhai rim region from 2000 to 2020, the present study analyzed the change in forest land in the region from 2000 to 2020, evaluated and analyzed the landscape ecological risk with a landscape ecological risk model, bivariate spatial autocorrelation, and an MGWR regression model. The degree of influence of forest land change intensity on landscape ecological risk in the Erhai rim region was discussed. The key conclusions are as follows:
(1)
Forest land is the main land-use type in the Erhai rim region and is mostly distributed in the periphery of the study area with less human activity and cross-distribution with grassland and shrubland. From 2000 to 2020, the area of forest land decreased by 2498.49 hm2, with significant spatial and temporal heterogeneity. From 2000 to 2010, the change in forest land in the study area was dominated by expansion, which mostly occurred in Fengyu Town in the northern Erhai Lake. From 2010 to 2020, the demand for urban construction land increased, forest land shrank significantly, and most lands were converted into cultivated and construction land. The most evident shrinkage occurred in the relatively flat areas on the east and south shores of Erhai Lake.
(2)
During the period from 2000 to 2020, the overall landscape ecological risk in the Erhai rim region presented an upward trend. The landscape ecological risk levels in the region were mostly medium- and high-risk areas. The landscape ecological risk levels showed a “multi-polar” distribution pattern, and the changes in higher-risk and highest-risk areas increased, while the lowest-, lower-, and medium-risk areas decreased.
(3)
From 2000 to 2020, forest land changes made an obvious impact on landscape ecological risk. The influence of forest land expansion intensity on landscape ecological risk gradually changed from positive to negative. The high-value areas were mostly distributed on the west and south shores of Erhai Lake, whereas the low-value areas were mainly concentrated on the east and north shores of Erhai Lake. The effect of forest land shrinkage intensity on landscape ecological risk is positive and significant. Local small-scale areas have negative effects. The high-value areas changed from the northeast of Shuanglang Town and Fengyi Town on the south shore of Erhai Lake to the north and south of the study area and the west coast of Erhai Lake.

Author Contributions

Conceptualization, M.W. (Mengjiao Wang), Y.W. (Yingmei Wu) and Y.W. (Yang Wang); methodology, software, and data curation, M.W. (Mengjiao Wang), C.L. and Y.W. (Yan Wu); writing—original draft preparation, M.W. (Mengjiao Wang), Y.W. (Yingmei Wu) and Y.W. (Yang Wang), B.G. and M.W. (Min Wang); writing—review and editing, M.W. (Mengjiao Wang), Y.W. (Yingmei Wu) and Y.W. (Yang Wang); visualization, M.W. (Mengjiao Wang) and C.L. All authors have read and agreed to the published version of the manuscript.

Funding

The current research was financially supported by the National Natural Science Foundation of China (42071381; 41761037; 41961019). Ten Thousand Talent Plans for Young Top-notch Talents of Yunnan Province (YNWR-QNBJ-2019-200).

Data Availability Statement

The data supporting the findings of the present study are available from the corresponding author upon reasonable request.

Conflicts of Interest

The authors declare no conflict of interest.

Abbreviation

LERI: landscape ecological risk; MGWR, multi-scale geographically weighted regression; GWR, geographically weighted regression.

References

  1. Bonan, G. Forests, climate, and public policy: A 500-year interdisciplinary odyssey. In Annual Review of Ecology, Evolution, and Systematics; Futuyma, D.J., Ed.; Annual Review of Ecology Evolution and Systematics; Annual Reviews: Palo Alto, CA, USA, 2016; Volume 47, pp. 97–121. [Google Scholar]
  2. Nesha, K.; Herold, M.; De Sy, V.; Duchelle, A.E.; Martius, C.; Branthomme, A.; Garzuglia, M.; Jonsson, O.; Pekkarinen, A. An Assessment of Data Sources, Data Quality and Changes in National Forest Monitoring Capacities in the Global Forest Resources Assessment 2005–2020. Environ. Res. Lett. 2021, 16, 054029. [Google Scholar] [CrossRef]
  3. Zhen, S.; Zhao, Q.; Liu, S.; Wu, Z.; Lin, S.; Li, J.; Hu, X. Detecting Spatiotemporal Dynamics and Driving Patterns in Forest Fragmentation with a Forest Fragmentation Comprehensive Index (FFCI): Taking an Area with Active Forest Cover Change as a Case Study. Forests 2023, 14, 1135. [Google Scholar] [CrossRef]
  4. Yonaba, R.; Tazen, F.; Cissé, M.; Mounirou, L.A.; Belemtougri, A.; Ouedraogo, V.A.; Koïta, M.; Niang, D.; Karambiri, H.; Yacouba, H. Trends, sensitivity and estimation of daily reference evapotranspiration ET0 using limited climate data: Regional focus on Burkina Faso in the West African Sahel. Theor. Appl. Climatol. 2023, 153, 947–974. [Google Scholar] [CrossRef]
  5. Lèye, B.; Zouré, C.O.; Yonaba, R.; Karambiri, H. Water resources in the sahel and adaptation of agriculture to climate change: Burkina faso. In Climate Change and Water Resources in Africa: Perspectives and Solutions Towards an Imminent Water Crisis; Diop, S., Scheren, P., Niang, A., Eds.; Springer International Publishing: Cham, Switzerland, 2021; pp. 309–331. [Google Scholar]
  6. Xu, X.; Liu, J.; Zhuang, D.; Zhang, S. Analysis on Spatial-Temporal Characteristics and Driving Factors of Woodland Change in the Northeastern China Based on 3S Technology. Sci. Geogr. Sin. 2004, 24, 55–60. [Google Scholar] [CrossRef]
  7. Jackson, B.; Sparks, J.L.D.; Brown, C.; Boyd, D.S. Understanding the Co-occurrence of Tree Loss and Modern Slavery to Improve Efficacy of Conservation Actions and Policies. Conserv. Sci. Pract. 2020, 2, 13. [Google Scholar] [CrossRef]
  8. Moffette, F.; Alix-Garcia, J.; Shea, K.; Pickens, A.H. The Impact of Near-real-time Deforestation Alerts Across the Tropics. Nat. Clim. Chang. 2021, 11, 172–178. [Google Scholar] [CrossRef]
  9. Xiong, B.; Chen, R.S.; Xia, Z.L.; Ye, C.; Anker, Y. Large-scale Deforestation of Mountainous Areas during the 21(st) Century in Zhejiang Province. Land Degrad. Dev. 2020, 31, 1761–1774. [Google Scholar] [CrossRef]
  10. Li, X.; Hai, Q.; Zhu, Z.; Zhang, D.; Shao, Y.; Zhao, Y.; Li, H.; Vandansambuu, B.; Ning, X.; Chen, D.; et al. Spatial and Temporal Changes in Vegetation Cover in the Three North Protection Forest Project Area Supported by GEE Cloud Platform. Forests 2023, 14, 295. [Google Scholar] [CrossRef]
  11. Li, W.; Zinda, J.A.; Zhang, Z. Does the “Returning Farmland to Forest Program” Drive Community-Level Changes in Landscape Patterns in China? Forests 2019, 10, 933. [Google Scholar] [CrossRef] [Green Version]
  12. Pang, Y.; Meng, S.; Shi, K.; Yu, T.; Wang, X.; Niu, X.; Zhao, D.; Liu, L.; Feng, M.; Qin, X.; et al. Forest Coverage Monitoring in the Natural Forest Protection Project Area of China. Acta Ecol. Sin. 2021, 41, 5080–5092. [Google Scholar]
  13. Ma, S.; Qiao, Y.P.; Wang, L.J.; Zhang, J.C. Terrain Gradient Variations in Ecosystem Services of Different Vegetation Types in Mountainous Regions: Vegetation Resource Conservation and Sustainable development. For. Ecol. Manag. 2021, 482, 118856. [Google Scholar] [CrossRef]
  14. Ma, X.; Wu, H.; Qin, B.; Wang, L. Spatiotemporal Change of Landscape Pattern and Its Eco-environmental Response in the Yangtze River Economic Belt. Sci. Geogr. Sin. 2022, 42, 1706–1716. [Google Scholar] [CrossRef]
  15. Li, C.; Wu, Y.; Gao, B.; Zheng, K.; Wu, Y.; Li, C. Multi-scenario Simulation of Ecosystem Service Value for Optimization of Land Use in the Sichuan-Yunnan Ecological Barrier, China. Ecol. Indic. 2021, 132, 108328. [Google Scholar] [CrossRef]
  16. Chen, X.; Ding, Z.; Yang, J.; Chen, X.; Chen, M. Ecological Risk Assessment and Driving Force Analysis of Landscape in the Compound Mine-urban Area of the Northern Peixian County. Chin. J. Ecol. 2022, 41, 1796–1803. [Google Scholar] [CrossRef]
  17. Zhou, P.; Meng, J. Progress of Ecological Risk Management Research: A Review. Acta Ecol. Sin. 2009, 29, 2097–2106. [Google Scholar] [CrossRef]
  18. Cao, Q.; Zhang, X.; Ma, H.; Wu, J. Review of Landscape Ecological Risk and An Assessment Framework Based on Ecological Services: ESRISK. Acta Geogr. Sin. 2018, 73, 843–855. [Google Scholar] [CrossRef]
  19. Peng, J.; Dang, W.; Liu, Y.; Zong, M.; Hu, X. Review on Landscape Ecological Risk Assessment. Acta Geogr. Sin. 2015, 70, 664–677. [Google Scholar] [CrossRef]
  20. Kapustka, L.; Galbraith, H.; Luxon, M.; Yocum, J. Using Landscape Ecology to Focus Ecological Risk Assessment and Guide Risk Management Decision-making. Toxicol. Ind. Health 2001, 17, 236–246. [Google Scholar] [CrossRef]
  21. Paukert, C.; Pitts, K.; Whittier, J.; Olden, J. Development and Assessment of A Landscape-scale Ecological Threat Index for the Lower Colorado River Basin. Ecol. Indic. 2011, 11, 304–310. [Google Scholar] [CrossRef]
  22. Ayre, K.K.; Landis, W.G. A Bayesian Approach to Landscape Ecological Risk Assessment Applied to the Upper Grande Ronde Watershed, Oregon. Hum. Ecol. Risk Assess. 2012, 18, 946–970. [Google Scholar] [CrossRef]
  23. Liu, Y.; Xu, W.H.; Hong, Z.H.; Wang, L.G.; Ou, G.L.; Lu, N. Assessment of Spatial-Temporal Changes of Landscape Ecological Risk in Xishuangbanna, China from 1990 to 2019. Sustainability 2022, 14, 10645. [Google Scholar] [CrossRef]
  24. Zhu, K.W.; He, J.; Zhang, L.X.; Song, D.; Wu, L.J.; Liu, Y.Q.; Zhang, S. Impact of Future Development Scenario Selection on Landscape Ecological Risk in the Chengdu-Chongqing Economic Zone. Land 2022, 11, 964. [Google Scholar] [CrossRef]
  25. Li, R.; Wei, W. A Study on Landscape Ecological Risk Assessment in New Urban Districts: A Case Study of Chenggong District, Kunming City. J. Kunming Univ. Sci. Technol. Nat. Sci. 2020, 45, 124–132. [Google Scholar] [CrossRef]
  26. Meng, X.; Ren, Z.; Zhang, C. Study on Land Use Change and Ecological Risk in Xianyang City. Arid. Zone Res. 2012, 29, 137–142. [Google Scholar] [CrossRef]
  27. Li, X.; Li, J. Analysis on Regional Landscape Ecological Risk Based on GIS --A Case Study along the Lower Reaches of the Weihe River. Arid. Zone Res. 2008, 25, 899–903. [Google Scholar] [CrossRef]
  28. Wu, J.; Qiao, N.; Peng, J.; Huang, X.; Liu, J.; Pan, Y. Spatial Variation of Landscape Eco-risk in Open Mine Area. Acta Ecol. Sin. 2013, 33, 3816–3824. [Google Scholar] [CrossRef]
  29. Gaines, K.F.; Porter, D.E.; Dyer, S.A.; Wein, G.R.; Pinder, J.E.; Brisbin, I.L. Using Wildlife as Receptor Species: A Landscape Approach to Ecological Risk Assessment. Environ. Manag. 2004, 34, 528–545. [Google Scholar] [CrossRef]
  30. Iroume, A.; Huber, A.; Schulz, K. Summer Lows in Experimental Catchments with Different Forest Covers, Chile. J. Hydrol. 2005, 300, 300–313. [Google Scholar] [CrossRef]
  31. De Lombaerde, E.; Vangansbeke, P.; Lenoir, J.; Van Meerbeek, K.; Lembrechts, J.; Rodríguez-Sánchez, F.; Luoto, M.; Scheffers, B.; Haesen, S.; Aalto, J.; et al. Maintaining forest cover to enhance temperature buffering under future climate change. Sci. Total Environ. 2022, 810, 151338. [Google Scholar] [CrossRef] [PubMed]
  32. Hu, W.; Li, G.; Gao, Z.; Jia, G.; Wang, Z.; Li, Y. Assessment of the impact of the Poplar Ecological Retreat Project on water conservation in the Dongting Lake wetland region using the InVEST model. Sci. Total Environ. 2020, 733, 139423. [Google Scholar] [CrossRef] [PubMed]
  33. Shi, P.; Yuan, Y.; Zheng, J.; Wang, J.; Ge, Y.; Qiu, G. The Effect of Land Use/Cover Change on Surface Runoff in Shenzhen Region, China. Catena 2007, 69, 31–35. [Google Scholar] [CrossRef]
  34. Shi, X.; Chen, K.; Jie, C.; Long, T. Evaluation on Service Value of Forest Ecosystem in Jilin Province. Bull. Soil Water Conserv. 2016, 36, 312. [Google Scholar] [CrossRef]
  35. Yao, H.; Cui, B. The Effect of Land Use and Its Change on Soil Erosion of the Lancang River Watershed in Yunnan Province. Acta Sci. Circumstantiae 2006, 26, 1362–1371. [Google Scholar] [CrossRef]
  36. Wu, Y.; Li, C.; Gao, B.; Wang, M.; Wu, Y.; Zheng, K. Construction of Urban Ecological Security Pattern in Highland Lakes Cites: The Case of Dali City. Acta Ecol. Sin. 2023, 2023, 1–14. [Google Scholar] [CrossRef]
  37. Shao, J.; Zhou, J. Practice and Explore of Lakeside Urbanization in the Context of “Two-oriented Society” in Wuhan Urban Agglomeration. Urban Dev. Stud. 2012, 19, 39–45. [Google Scholar] [CrossRef]
  38. Ye, C.; Li, C.; Deng, T. Structures and Ecological Functions of Lake Littoral Zones. Res. Environ. Sci. 2015, 28, 171–181. [Google Scholar] [CrossRef]
  39. Ding, W. A Study on the Characteristics of Climate Change around the Erhai Area, China. Resour. Environ. Yangtze Basin 2016, 25, 599–605. [Google Scholar] [CrossRef]
  40. Jun, C.; Ban, Y.F.; Li, S.N. Open access to Earth land-cover map. Nature 2014, 514, 434. [Google Scholar] [CrossRef] [Green Version]
  41. Liu, S.; Shen, H. A GIS based Model of Urban Land Use Growth in Beijing. J. Geogr. 2000, 55, 407. [Google Scholar] [CrossRef]
  42. Wang, Y.; Sun, R. Impact of Land Use Change on Coupling Coordination Degree of Regional Water-energy-food System: A Case Study of Beijing-Tianjin-Hebei Urban Agglomeration. J. Nat. Resour. 2022, 37, 582–599. [Google Scholar] [CrossRef]
  43. Jia, H.; Wang, R.; Li, H.; Diao, B.; Zheng, H.; Guo, L.; Liu, L.; Liu, J. The Changes of Desertification and Its Driving Factors in the Gonghe Basin of North China over the Past 10 Years. Land 2023, 12, 998. [Google Scholar] [CrossRef]
  44. Wei, H.; Xu, L.; Li, X.; Li, J. Landscape Ecological Risk Assessment and Its Spatiotemporal Changes of the Boston Lake Basin. Environ. Sci. Technol. 2018, 41, 345–351. [Google Scholar] [CrossRef]
  45. Lu, L.; Zhang, J.; Sun, C.; Wang, X.; Zheng, D. Landscapeecological Risk Assessment of Xi river Basin Based on Land-use Change. Acta Ecol. Sin. 2018, 38, 5952–5960. [Google Scholar] [CrossRef]
  46. Xie, H. Regional Eco-risk Analysis of Based on Landscape Structure and Spatial Statistics. Acta Ecol. Sin. 2008, 28, 5020–5026. [Google Scholar] [CrossRef]
  47. Gao, B.; Wu, Y.; Li, C.; Zheng, K.; Wu, Y.; Wang, M.; Fan, X.; Ou, S. Multi-Scenario Prediction of Landscape Ecological Risk in the Sichuan-Yunnan Ecological Barrier Based on Terrain Gradients. Land 2022, 11, 2079. [Google Scholar] [CrossRef]
  48. Zhang, Y.; Xie, X. Regional Ecological Risk Assessment in Nansi Lake Based on RS and GIS. Acta Ecol. Sin. 2015, 35, 1371–1377. [Google Scholar] [CrossRef]
  49. Gao, B.; Li, C.; Wu, Y.; Zheng, K.; Wu, Y. Landscape Ecological Risk Assessment and Influencing Factors in Ecological Conservation Area in Sichuan-Yunnan Provinces, China. J. Appl. Ecol. 2021, 32, 1603–1613. [Google Scholar] [CrossRef]
  50. Wu, Y.; Wu, Y.M.; Li, C.; Gao, B.P.; Zheng, K.J.; Wang, M.J.; Deng, Y.H.; Fan, X. Spatial Relationships and Impact Effects between Urbanization and Ecosystem Health in Urban Agglomerations along the Belt and Road: A Case Study of the Guangdong-Hong Kong-Macao Greater Bay Area. Int. J. Environ. Res. Public Health 2022, 19, 16053. [Google Scholar] [CrossRef]
  51. Chang, J.; Sun, P.J.; Wei, G.E. Spatial Driven Effects of Multi-Dimensional Urbanization on Carbon Emissions: A Case Study in Chengdu-Chongqing Urban Agglomeration. Land 2022, 11, 1858. [Google Scholar] [CrossRef]
  52. Fotheringham, A.S.; Yang, W.B.; Kang, W. Multiscale Geographically Weighted Regression (MGWR). Ann. Am. Assoc. Geogr. 2017, 107, 1247–1265. [Google Scholar] [CrossRef]
  53. Shen, T.; Yu, H.; Zhou, L.; Gu, H.; He, H. On Hedonic Price of Second-Hand Houses in Beijing Based on Multi-Scale Geographically Weighted Regression:Scale Law of Spatial Heterogeneity. Econ. Geogr. 2020, 40, 75–83. [Google Scholar] [CrossRef]
  54. Yu, H.; Fotheringham, A.; Li, Z.; Oshan, T.; Kang, W.; Wolf, L. Inference in Multiscale Geographically Weighted Regression. Geogr. Anal. 2020, 52, 87–106. [Google Scholar] [CrossRef]
Figure 1. Location of the Erhai rim in China.
Forests 14 01427 g001
Figure 2. Research processes.
Forests 14 01427 g002
Figure 3. Distribution of land-use types in the Erhai rim at different times.
Forests 14 01427 g003
Figure 4. Distribution of ecological risks in Erhai rim region at different periods.
Forests 14 01427 g004
Figure 5. Spatial LISA cluster diagram of forest land expansion intensity and landscape ecological risk in the Erhai rim region.
Forests 14 01427 g005
Figure 6. Distribution of regression coefficient between forest land expansion intensity and landscape ecological risk in the Erhai rim region.
Forests 14 01427 g006
Figure 7. Spatial LISA clustering map of forest land shrinkage intensity and landscape ecological risk in the Erhai rim region.
Forests 14 01427 g007
Figure 8. Distribution of regression coefficient of forest land shrinkage intensity and landscape ecological risk in the Erhai rim region.
Forests 14 01427 g008
Table 1. Landscape pattern index 2000–2020 for the Erhai Rim Region.
Landcover
Class
YearNumber of PlaquesArea/hm2FragmentationSeparation DegreeDominanceDisturbance DegreeVulnerable DegreeLoss Degree
Cultivated land2000196866,301.020.02970.08610.58840.15840.21430.0339
2010199767,958.010.02940.08570.59560.15950.21430.0342
2020222969,641.370.03200.08950.61160.16520.21430.0354
Forest land200017,076112,227.030.15220.19500.91440.31750.03570.0113
201019,123113,239.080.16890.20550.99020.34410.03570.0123
202016,962109,728.540.15460.19660.96420.32910.03570.0118
Grassland200014,99847,316.780.31700.28150.51640.34620.17860.0618
201015,55341,723.550.37280.30530.53390.38470.17860.0687
202014,61839,954.870.36590.30240.51820.37730.17860.0674
Shrub land200026,79129,8890.89630.47340.45190.68060.14290.0972
201028,12230,961.170.90830.47650.52100.70130.14290.1002
202026,62828,135.260.94640.48640.50080.71930.14290.1028
Wetland200020.812.46910.78570.17661.50560.10710.1613
20101371.820.18100.21270.00260.15480.10710.0166
2020723.670.29570.27190.00170.22980.10710.0246
Water bodies200030326,482.770.01140.05350.34830.09140.07140.0065
201021426,208.720.00820.04520.21520.06070.07140.0043
202021926,159.850.00840.04570.21660.06120.07140.0044
Artificial surfaces200081013,189.950.06140.12390.26760.12140.25000.0303
201079315,245.010.05200.11400.17440.09510.25000.0238
2020109321,763.800.05020.11210.24620.10800.25000.0270
Table 2. Land-use type transfer matrix for the Erhai Rim 2000–2020.
Landcover ClassCultivated LandForest Land GrasslandShrub LandWetlandWater BodiesArtificial
Surfaces
hm2
The 2000
Cultivated land53,218.801824.752640.69752.3111.70216.096970.7765,635.11
Forest land2983.5096,770.963960.186348.51044.281136.16111,243.59
Grassland7513.833834.4529,710.353658.412.9720.252329.6547,069.91
Shrub land2426.316112.263282.1217,057.070.4535.01832.5029,745.72
Wetland0.0900000.7200.81
Water bodies170.73162.6390141.575.6725,559.5488.4726,218.61
Artificial
surfaces
2593.9875.87117.4558.862.8824.2110,174.5913,047.84
202068,907.24108,780.9239,800.7928,016.7323.6725,900.1021,532.14292,961.59
Table 3. Ecological risk level of Erhai rim region in each period.
Types200020102020
Lowest RiskArea/hm227,613.9627,613.9522,165.54
Proportion/%9.459.457.58
Lower RiskArea/hm243,794.8843,794.9039,047.11
Proportion/%14.9914.9913.35
Medium RiskArea/hm293,532.1593,532.1387,562.34
Proportion/%32.0132.0129.93
Higher RiskArea/hm292,044.6792,044.69105,638.47
Proportion/%31.5031.5036.11
Highest RiskArea/hm235,255.7035,255.7038,155.50
Proportion/%12.0612.0613.04
Disclaimer/Publisher’s Note: The statements, opinions and data contained in all publications are solely those of the individual author(s) and contributor(s) and not of MDPI and/or the editor(s). MDPI and/or the editor(s) disclaim responsibility for any injury to people or property resulting from any ideas, methods, instructions or products referred to in the content.

