Article

Effect of Stand Density on Soil Organic Carbon Storage and Extracellular Enzymes Activity of Larch Plantation in Northeast China

1
Engineering Research Center of Chuanxibei RHS Construction at Mianyang Teachers’ College of Sichuan Province, Mianyang Teachers’ College, Mianyang 621010, China
2
School of Forestry, Northeast Forestry University, Hexing Rd. 26, Harbin 150040, China
3
Forestry Inventory and Planning Institute of Jilin Province, Changchun 130022, China
*
Author to whom correspondence should be addressed.
Forests 2023, 14(7), 1412; https://doi.org/10.3390/f14071412
Submission received: 17 June 2023 / Revised: 5 July 2023 / Accepted: 6 July 2023 / Published: 11 July 2023
(This article belongs to the Special Issue Forest Soil Carbon and Climate Change)

Abstract

:
Soil is the largest carbon (C) pool in terrestrial ecosystems. A small change of soil organic carbon (SOC) storage may have a substantial effect on the CO2 concentration in the atmosphere, potentially leading to global climate change. Forest stand density has been reported to influence SOC storage, yet the effects are often inconsistent. In order to reveal the mechanisms of effect of stand density on SOC storage, larch plantations with three different stand densities (which were 2000, 3300 and 4400 trees per hectare) were chosen. Soil properties were measured in three soil layers which are: 0–20 cm, 20–40 cm and 40–60 cm. An incubation experiment with 14C-labeled cellulose addition was subsequently conducted to study the decomposition of SOC and cellulose, as well as the enzymes activity involved in C and nutrients cycle. The results showed that SOC storage increased with increasing stand density in larch plantations, which was due to the higher C stored in heavy fraction instead of light fraction in higher density. The decomposition of added cellulose decreased with increasing stand density in each soil layer, as well as the cumulative soil derived CO2 emission rate. The activity of enzymes involved in C-cycle and C- and nitrogen (N)-cycle remained unaffected by stand density in the 0–20 cm and 20–40 cm layers. The enzyme activity involved in the phosphorus (P)-cycle did not change corresponding to the stand density in each soil layer. Enzymes involved in the N-cycle showed the highest activity in the middle stand density in 0–20 cm, but no difference was observed among different densities in the subsurface layer except for tyr in the 40–60 cm layer, which showed the lowest activity in high stand density. Cellulose addition stimulated the extracellular enzymes activity involved in the C-cycle and P-cycle in the 0–20 cm layer, and the stimulation declined with increasing stand density. However, significant stimulation of cellulose addition to C-cycle involved enzymes activity was not found in the subsurface layer. We aim to reveal the mechanism of effects of stand density of larch plantations on SOC storage by focusing on the cellulose and SOC decomposition and the corresponding extracellular enzymes activity. In the plots of higher stand density, larch plantations may lead to a weaker C output and stronger C input, which leads to the higher SOC storage.

1. Introduction

Since the 1980s, a lot of plantations have been established due to the large scale of afforestation in Northeast China. The plantation establishment could increase C storage in biomass, and has significant effects on soil C storage in many different ways [1,2,3]. Although afforestation can compensate for the C emission load of nations according to the “Kyoto Protocol”, the C sequestration capacity of the plantations planted in different ways are discrepant. For example, the stand density of the plantation has a strong effect on SOC storage [4,5,6,7,8,9,10,11,12,13], which makes the stand density important in evaluating the C footprint offset by afforestation.
The C stored in soil can be separated as light fraction SOC and heavy fraction SOC according to its density [14]. The light fraction SOC is known as the residual of plants and animals, which has a high C concentration but low proportion in soils; while the heavy fraction SOC is known as refractory humus, which has a low C concentration but high proportion. This leads to the different implications of light fraction SOC and heavy fraction SOC on soil C sequestration and balance. Studies have shown that C stored in soil heavy fraction and light fraction are altered by different stand density [7,11,15]. However, it remains unclear whether the variation of total SOC storage that changed with stand density is mainly due to the variation of light fraction or the heavy fraction. Having better knowledge of it could help to expound the capability of soil C sequestration in the forests of different stand density.
It has been well documented that fresh organic carbon (FOC) inputting from litter and root can be changed concomitantly with stand density [16,17]. The transformation could affect the SOC mineralization and storage through altering the condition of energy and nutrients for microbes in soil [18,19]. This could be ascribed to the microbial consumption of FOC that will influence the SOC mineralization, which is called a “priming effect” [20,21]. Additionally, soil inorganic N altered by stand density [10,22] is also a key factor of priming effect, as it regulates the microbial utilization of FOC and SOC [23,24,25,26].
Normally, SOC can be accumulated by the residual of FOC with the consumption of microbes, as it is fresh energy abundant [27]. However, the input of FOC could offer energy to produce extracellular enzymes [28,29,30,31,32], which may accelerate SOC decomposition [20]. Meanwhile, inorganic N regulates the competition for energy between K-strategy microbes and r-strategy microbes, which also alters the decomposition rates of FOC and SOC [19], thereby changing the SOC storage. Furthermore, the plant derived FOC is always composed of components with great complexity [33]. Some constituents such as phenols [34,35] may suppress the microbial activity in soil, which leads to the decline of both FOC and SOC decomposition and thus changes the SOC storage [36]. The FOC input would increase with increasing stand density, but few studies have focused on the responses of SOC storage to microbial suppression caused by FOC. Therefore, it is important to keep researching on the effects of FOC on SOC in different stand densities.
In temperate forests, litter returning offers a large amount of FOC input to soil. It indicates the weak energy limit in the upper soil layer. The energy supply may be restricted due to the decline of FOC acquired with soil depth increases [37,38,39]. Since the availability of energy and nutrients crucially affect the competition between K- and r-strategists [19], and will further change the decomposition of SOC and FOC, we speculated that the differences of energy and nutrients availability between the upper and lower soil layer would alter the SOC pool in different soil depths as Salome et al. [40] suggested. However, the studies on C pool in deep soils are not sufficient; in particular, the C pool in deep soils of different stand density sites is not documented.
In order to gain energy and nutrients, microbes would need to produce extracellular enzymes to decompose substrate in soil, which makes the enzymes activity indicators for the microbial needs for energy and nutrients [41,42,43,44,45]. Studies have pointed out that the addition of FOC affected the activity of enzymes involved in soil C-, N- and P-cycles [46,47,48,49], leading to different processes in soil element cycling and SOC storage [50,51]. Nevertheless, how enzymes activity changes within different stand densities after FOC addition remains unclear. Additionally, this knowledge gap would hold back revealing the mechanisms of how stand density influences SOC storage under different stand densities.
In this study, 10-year-old larch (Larix spp.) plantations with different stand density were chosen to analyze the mechanism of effects of stand density on SOC storage. An incubation experiment was conducted to investigate the changing patterns of SOC storage in different soil layers by using 14C-labeled cellulose as added FOC, as cellulose is a significant composition in FOC in the natural environment. We hypothesized that the difference of SOC storage in different stand densities is mainly driven by the different patterns of SOC mineralization and FOC input.

2. Materials and Methods

2.1. Field Conditions

The study sites were located in Maoershan Experimental Station of Northeast Forestry University, Heilongjiang Province, China (127°32′41″ E, 45°21′51″ N), with an average altitude of 320 m. This region has a temperate continental monsoon climate with a mean annual temperature of 2.8 °C and mean annual precipitation of 700 mm. The natural forests in this region are mainly composed of Larix gmelini, Fraxinus mandshurica, Betula platylhylla, Acer mono, Phellodendron amurense, Populus davidiana, etc.
The larch plantations we chose were planted in 2007 on a clear-cutting blank from a natural secondary forest, with 3 stand densities (which were 2000, 3300 and 4400 trees per hectare). The larch trees were planted in each density as a square of 50 m × 50 m with 3 replicates that were randomly distributed in the middle of a west slope with a gradient < 10°, and with a soil type of Alfisol. No artificial management was conducted in the plantations. However, within the 10 years of growing until we started sampling in 2016, not all the trees survived. In 2014, forest liquidation was applied before this experiment was conducted. The residuals were moved out after liquidation.

2.2. Sampling

A sampling plot with the square of 20 m × 20 m was set in the middle of each density plantation (9 sampling plots in total) in early September of 2016. For sampling roots, 6 cores from each plot were randomly chosen 50 to 70 cm away from the trees. A soil core with an inner diameter of 60 mm was employed at the 0–20 cm layer, 20–40 cm layer and 40–60 cm layer for measuring the biomass of fine roots, which was defined as a diameter < 2 mm [52,53]. Meanwhile, for sampling soils, 3 profiles of 60 cm depth were dug in each plot, as the soil profile in this field is with 60 cm depth. Soil samples from the 3 profiles of each site were homogeneously and equally mixed, and passed through a 2 mm mesh to remove stones and plant debris before the soil properties were measured. All soil samples from the same soil layer have a similar mechanical composition, which is 40.63 ± 0.26% of sand, 41.35 ± 0.28% of silt and 18.02 ± 0.10% of clay in 0–20 cm, 54.82 ± 0.62% of sand, 29.49 ± 0.87% of silt and 15.69 ± 0.25% of clay in 20–40 cm and 59.29 ± 0.42% of sand, 31.03 ± 0.32% of silt and 9.68 ± 0.34% of clay in 40–60 cm. As described by Kirkby et al. [14], fractionation was employed for obtaining the refractory SOC fraction which was subsequently used for incubation by using a 0.4 mm mesh, which means the samples for incubation are known as the heavy fraction of SOC.

2.3. Incubation

A laboratory incubation study was conducted for 46 days at 20 °C. For each stand density and each soil layer, a control treatment and C treatment with 3 experimental replicates were set. For the incubation, 45 g (dry basis) of air-dried soil samples from each density site of 0–20 cm layer, 20–40 cm layer and 40–60 cm layer were weighed into 100 mL polyethylene flasks with a water content of 40% water holding capacity. All the flasks were put into airtight vessels sealed in the dark at 20 °C for 8 days of pre-incubation. After the pre-incubation, 14C-labeled cellulose was added into the C treatment samples with the C content approximately 5 times that of soil microbial biomass C (Cmic, which is 888.89 µg C g−1 in 0–20 cm layer, 148.22 µg C g−1 in 20–40 cm layer and 59.33 µg C g−1 in 40–60 cm layer). The added radioactivity was about 23 kBq for each C treatment and was added by mixing the 14C-labeled cellulose with the unlabeled cellulose under the assumption that 14C-labeled and unlabeled cellulose are degraded in the same way. The water content of all the samples was adjusted to 60% water holding capacity before the incubation started. The samples were incubated for 46 days at 20 °C in a respirometer (prw electronics, Berlin, Germany). CO2 was automatically measured every 4 h by determining changes in electrical conductivity in 15 mL 0.6 M, 10 mL 0.3 M and 10 mL 0.06 M KOH for samples from 0–20 cm layer, 20–40 cm layer and 40–60 cm layer, respectively, and placed inside the vessels. The amount of 14C-labeled cellulose derived CO2 was determined on day 3, 5, 7, 11, 14, 18, 24, 28, 35, 38, 42 and 46 by using liquid scintillation counting. A 1 mL subsample of KOH was mixed with 6 mL scintillation cocktail (Ultima Gold, Perkin Elmer, Waltham, MA, USA) and measured with a Tri-Carb 2800TR (Perkin Elmer, Waltham, MA, USA). After sampling, the KOH was renewed.

2.4. Physical and Chemical Analysis

C and N were analyzed by dry combustion using a vario El Cube elemental analyzer (Elementar Analysesysteme GmbH, Hanau, Germany). A chloroform fumigation-extraction method [54] was used to determine the Cmic. A total of 10 g moist soil was fumigated for 24 h at room temperature with chloroform. Fumigated and nonfumigated samples were shaken for 30 min with 40 mL 0.05 M K2SO4 and then filtered with 0.45 µm membrane. The total organic C in the solutions was determined using a Dimatoc 2000 (DIMATEC Analysentechnik GmbH, Essen, Germany). The Cmic was calculated as the differences of C content between fumigated and nonfumigated samples under k = 0.45. Dissolved organic C (DOC) was extracted by shaking 10 g soil with 40 mL 0.05 M K2SO4 for 30 min. Soil texture was analyzed after SOC removal with H2O2 by laser diffraction using an Analysette 22 MicroTec plus with a wet dispersion unit (Fritsch GmbH, Idar-Oberstein, Germany). Mineral N (Nmin) concentration was the sum of ammonium concentration and nitrate concentration, which was extracted by shaking 10 g soil with 100 mL 0.01 M K2SO4 for 60 min. The pH of the soil samples was measured in 0.01 M CaCl2 (1:2.5, w/v) after 1 h of equilibration with a glass electrode.

2.5. Extracellular Enzymes

Extracellular enzyme activities involved in the C-, N-, and P-cycle were analyzed using a fluorescence multiplate assay according to Marx et al. [55] at the end of incubation. Following this, methylumbelliferyl-labelled substrates were used to determine enzymes involved in the C-cycle: 4-methylumbelliferyl-β-D-xylopyranoside (β-xylosidase (β-xyl)), 4-methylumbelliferyl-β-D-glucoside (β-glucosidase (β-glu)) and 4-methylumbelliferyl-β-D-cellobioside (β-cellobiosidase (β-cello)). The enzyme involved in the P-cycle was measured by 4-methylumbelliferyl phosphate disodium salt (acid phosphatase (pho)). Enzymes involved in the N-cycle were measured using the following amidomethylcoumarin(AMC)-labelled substrates: L-tyrosine-7-AMC (tyrosine-aminopeptidase (tyr)) and L-arginine-7-AMC (arginine-aminopeptidase (arg)). N-Acetyl-β-glucosaminidase(N-acet), which is involved in the C- and N-cycle, was determined using 4-methylumbelliferyl-N-acetyl-β-D-glucosaminide.

3. Results

3.1. Soil Properties

The fine-root biomass in the high stand density sites presented 45.11%, 59.19% and 83.79% higher than those in the low stand density sites in the 0–20 cm, 20–40 cm and 40–60 cm soil layers, respectively (p < 0.05). The C and N concentration for soil samples used in incubation did not change with stand density. The C/N ratio in the 0–20 cm layer and the 20–40 cm layer was not affected by stand density, but in the 40–60 cm layer the C/N ratio was higher in the high stand density site. Cmic in the incubation sample declined with increasing stand density, ranging from 230.48 µg g−1 to 128.32 µg g−1 in the 0–20 cm layer, 39.04 µg g−1 to 26.27 µg g−1 in the 20–40 cm layer and 9.22 µg g−1 to 6.38 µg g−1 in the 40–60 cm layer. Nmin was not affected by the stand density in each layer. The Nmin/Cmic ratio increased with stand density in each soil layer. DOC concentration increased with increasing stand density, rising from 51.41µg g−1 to 73.66µg g−1 in the 0–20 cm layer, 44.53 µg g−1 to 57.38 µg g−1 in the 20–40 cm layer and 33.60 µg g−1 to 60.43 µg g−1 in the 40–60 cm layer. The pH stayed unchanged despite the stand density (Table 1).

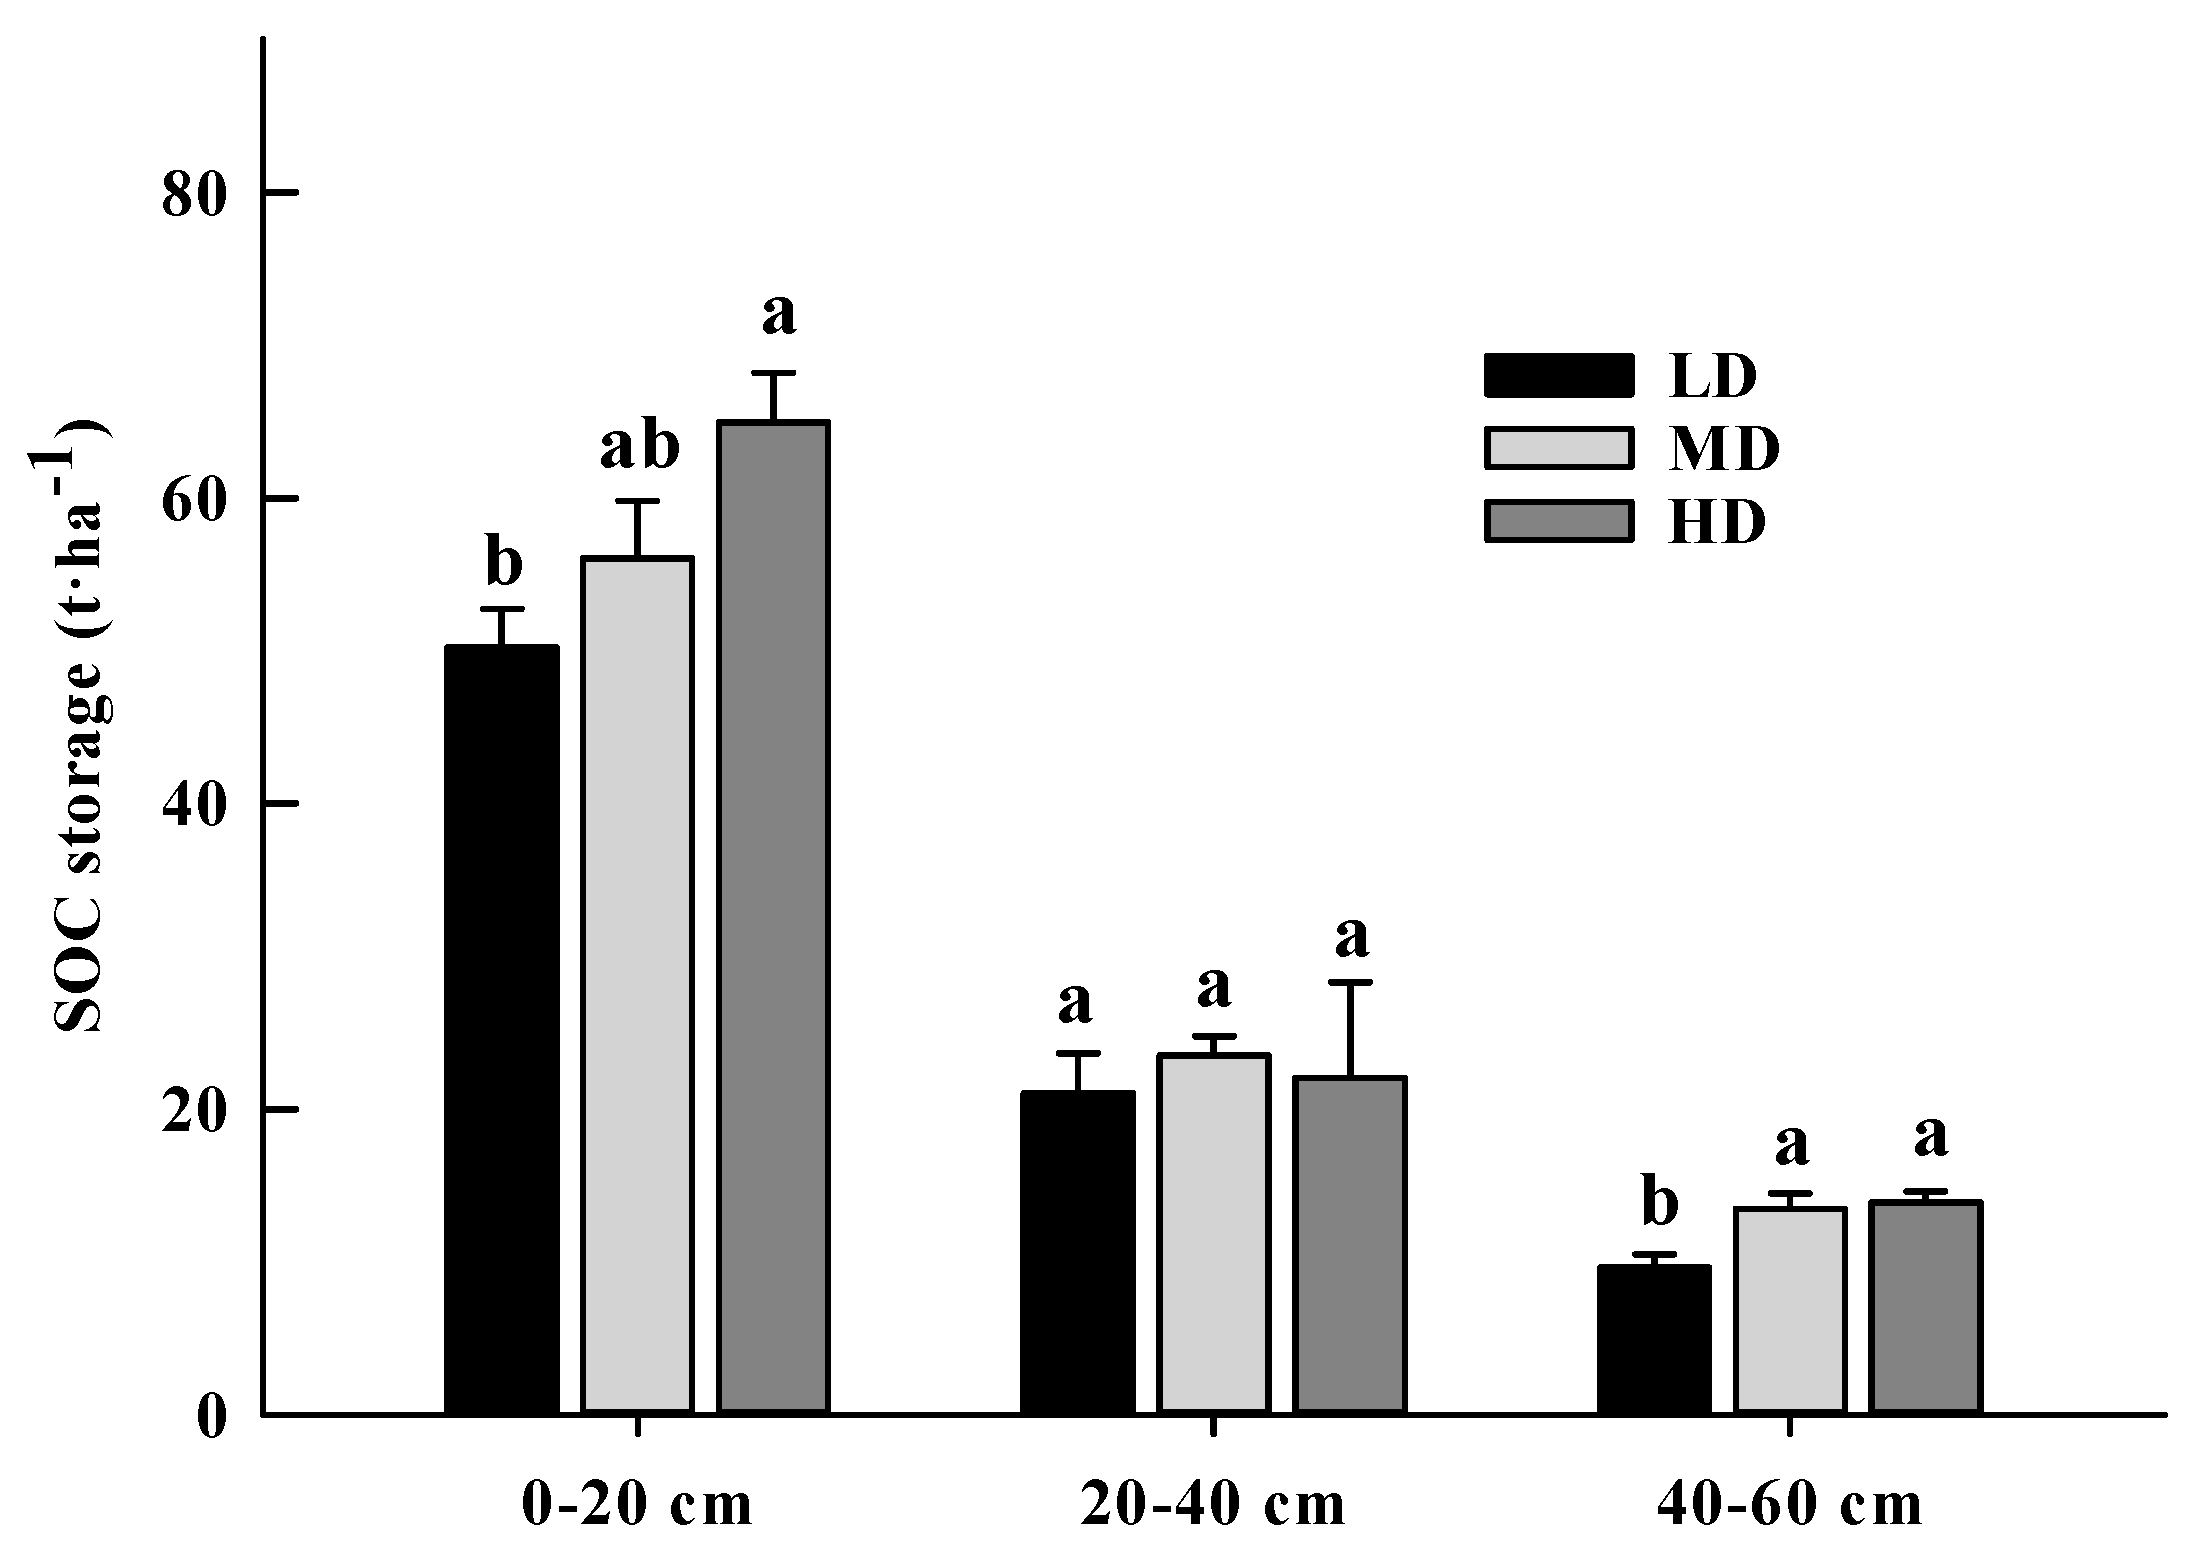
3.2. SOC Storage and Its Allocation in Light Fraction and Heavy Fraction

SOC storages in high density sites were 29.37% and 44.83% higher than those in low density sites in the 0–20 cm and 40–60 cm layers (p < 0.05). However, no significant difference of SOC storage was found in the 20–40 cm layer (Figure 1). With stand density increasing, the percentage of heavy fraction in SOC storage changed differently in each soil layer, ranging from 94.81% to 96.94%, 96.83% to 98.36% and 96.91% to 97.24% in the 0–20 cm, 20–40 cm and 40–60 cm layers, respectively. The contribution of heavy fraction to the total SOC storage increased with increasing stand density in each soil layer, rising from 76.64% to 99.83% in the 0–20 cm layer, from 91.53% to 125.98% in the 20–40 cm layer and from 97.83% to 98.20% in the 40–60 cm layer (Figure 2).

3.3. Emission of 14C-CO2 and SOC Derived CO2

Emission of 14C-CO2 declined with increasing stand density. The effects of stand density on the emission of 14C-CO2 decomposition mainly happened in the first 5 days of incubation. After 20 days, 14C-CO2 was almost exhausted (Figure 3). The SOC derived CO2 emission in the control presented highest in the low stand density site in the 0–20 cm layer and 40–60 cm layer but remain unchanged in the 20–40 cm layer. With the amendment of cellulose, the SOC derived CO2 emission in the 0–20 cm layer was not altered by stand density changing, while in the 20–40 cm layer and 40–60 cm layer it declined with increasing stand density, ranging from 44.28 mg C-CO2 g−1 C to 21.57 mg C-CO2 g−1 C and 46.28 mg C-CO2 g−1 C to 17.48 mg C-CO2 g−1 C, respectively (Figure 4).

3.4. Extracellular Enzymes Activity

The activity of enzymes involved in the C-cycle and C- and N-cycle remained unaffected by stand density in the 0–20 cm layer and 20–40 cm layer; while in the 40–60 cm layer it changed differently to the stand density. The activity of pho did not change with the stand density in each soil layer, ranging from 1570.11–1983.20 μmol g−1C h−1 in the 0–20 cm layer and 12,301.62–13,397.28 μmol g−1C h−1 in 20–40 cm and 11,220.70–13,987.43 μmol g−1C h−1 in the 40–60 cm, respectively. Activity of enzymes involved in the N-cycle presented highest in the middle stand density site in the 0–20 cm layer. However, in the two subsurface layers, the enzymes activity involved in the N-cycle did not alter the stand density except tyr in the 40–60 cm layer, which was the lowest at the high stand density site.
The responses of enzymes activity to the cellulose addition were very different. In the 0–20 cm layer, the addition of cellulose stimulated the activity of enzymes involved in the C-cycle and P-cycle, where the stimulation appeared to be higher in low density sites. In the 20–40 cm layer, enzymes activity involved in C- and P-cycling were partly stimulated by cellulose, except β-glu in the middle density site and β-cello in low stand density site, which were suppressed by the cellulose addition. However, enzymes involved in the N-cycle activity were not significantly affected by the application of cellulose except arg in the sample from the high stand density site. In the 40–60 cm layer, no regular effects of stand density on the stimulation of cellulose addition to enzymes activity were found. The positive stimulation of cellulose addition only happened on β-xyl in low and middle stand density sites and pho in the middle stand density site. Nevertheless, suppression effects of cellulose addition were found on arg, as well as N-acet and β-cello in the low stand density site, β-xyl in the high stand density site and pho in the low and high stand density sites (Table 2).

4. Discussion

4.1. SOC Storage Changes with Stand Density

SOC storage increased with the increase in stand density at the 0–60 cm layers, ranging from 78.10 t ha−1 to 97.30 t ha−1. In each soil layer, the SOC storage was also more abundant in high stand density sites (Figure 1), indicating that more C can be sequestrated in soils, as the stand density increased from 2200 trees per hectare to 4400 per hectare. This was in line with the studies of how SOC storage changed within a 25 cm depth in different stand densities of 11-year-old Pinus radiata D. Don and Betula alba L. plantations [7] and within a 15 cm depth in different stand densities of invaded Acacia zanzibarica forests [10]. With the stand density increased, the increment of SOC storage in our study was mostly contributed to by the increase in heavy fraction rather than light fraction (Figure 2), implying the change of C stored in heavy fraction soil could have a key influence on SOC storage change, as it is also mentioned by Kirkby et al. [56].
The SOC storage could be regarded as the result of the balance between SOC output and input. In our study, its output was considered as the mineralization of SOC under the addition of cellulose, because FOC is continually accessed in the natural environment. Under cellulose amendments, no difference of the SOC mineralization between different stand densities was found; while in the subsurface soils, higher SOC mineralization in the low stand density site was found instead (Figure 4). We speculated that the SOC output in lower soil layers might decline when the stand density is higher, while in the top layer it might not be altered by the change of stand density. The SOC input in our study was taken as the residual after the decomposed cellulose was left in soil. Cellulose is one of the main components in litter and, most importantly, the applied cellulose was exhausted during the 46 days of incubation when the 14C-CO2 emission rate was found to be extremely low in the later period (Figure 3). It was also mentioned by Fontaine et al. [18], who indicated that the cellulose will be exhausted within two weeks. The cumulative FOC mineralization decreased with the increasing stand density, indicating that during the 46 days of incubation more cellulose derived C was retained in soils of higher stand density [57]. Meanwhile, there was a larger amount of fine-root biomass as the stand density increased (Table 1), which indicates a higher potential C input in soils [58,59]. Thus, we suggest that the increase in SOC storage with increasing stand density was due to the higher C input in the top soil layer; while in subsurface layer, it was due to the result of both increasing C input and decreasing C output.

4.2. The Explanations for SOC Storage Change

As Fountain et al. [19] proposed, microbes responsible for the SOC decomposition could be divided into two strategists, r-strategists and K-strategists. The K-strategists are responsible for the decomposition of the refractory C fraction which makes up the main part of SOC in our study; while the r-strategists are more likely to decompose the labile C, which is the cellulose in this case [18,60,61,62]. We found that the stand density had significantly affected the decomposition of both SOC and cellulose (Figure 3 and Figure 4), indicating that the variation of stand density may have influences on the soil microbial community (e.g., the activity of K- and r-strategies microbes). It has been reported that the composition of the soil microbial community is closely related to the condition of energy and nutrients [19]. As the extracellular enzymes activity reflects the microbial needs for energy and nutrients [41,42,63,64], it could represent the state of C energy and nutrients in soil. For the surface soils, the addition of cellulose stimulated the enzyme activity involved in the C-cycle (Table 2), indicating there was an energy lack in the surface layer [44,46,65]. In addition, the stimulation of cellulose to the enzyme activity involved in the C-cycle declined as the stand density increased (Table 2), indicating a decreasing energy limit with increasing stand density in the surface soil. This could also be verified by the increase in DOC concentration with increasing stand density (Table 1). For subsurface soil layers, no stimulation of cellulose addition to the C-cycle involved enzyme activities was found (Table 2), suggesting either energy was sufficient in subsurface soils, or the C-cycle involved enzyme activities were stimulated, which was caused by the energy limitation; however, we did not manage to detect it, as the added cellulose is often consumed quickly when N is rich. The soil samples used in the incubation experiment were fractionated with 0.4 mm mesh, resulting in the removal of most of light fraction C, while only DOC remained as the labile fraction in the sieved soils. However, the DOC concentration in subsurface layers was either lower or similar to that in surface soils (Table 1), indicating that the energy was not rich [38]. Meanwhile, the stimulation of cellulose addition to the pho activity showed a similar trend to the activity of the C-cycle involved enzymes (Table 2), suggesting the subsurface layers were sufficient in P. However, we did not find similar results in other studies. In this case, it is possible that the increasing pho activity was stimulated due to the lack of P but we did not observe it due to the ephemeral dynamics. Thus, we suggest there was an energy deficiency in the subsurface soils; however, the stimulation of added cellulose to the activity of the C-cycle involved enzymes occurred before the incubation ended. The trend in DOC concentration suggests there was a lower energy limit in subsurface soils in a higher stand density.
In our experiment, addition of cellulose did not stimulate the activity of enzymes involved in the N-cycle in the surface soil layer, suggesting no N deficiency was observed in the surface [24,66,67]. In subsurface soils, the Nmin/Cmic ratio was found to be higher than in the surface soil (Table 1), indicating that more N was available for microbes in the subsurface, suggesting there was sufficient N in the subsurface. It is possible that with sufficient N, the higher stand density soils might have a higher Cmic [65] and respiration [58,66] due to a lower energy limit. However, in our study, opposite results were found (Table 1; Figure 4), suggesting that the microbial competition for nutrients and energy might not be the key factor of the variation of SOC cycling in different stand densities and other reasons might be responsible.

4.3. Suppression of Microbes

In the incubation experiment, the cumulative unlabeled CO2 emission declined with the stand density increase (Figure 4), indicating that with the stand density going higher, both the SOC turnover and cellulose decomposition decreased. In addition, the Cmic followed the same trend as the SOC turnover and cellulose decomposition changed with stand density. As Bagchi et al. [36] reported, the accumulation of the SOC pool may be altered by the suppression of microbial activity due to the existence of herbivores. We speculated that there are some other factors that may suppress the activity of microbes in larch plantations. The declining SOC turnover and cellulose decomposition with increasing stand density could possibly be due to the suppression of microbial activity.
It has been reported that the microbial activity can be suppressed by the high amount of clay content of soil [68,69], due to the more concomitant inert fraction existing in high clay soil for low microbe consumption [70,71,72]. Meanwhile, the microbial activity can also be suppressed by soil acidification [24,73,74]. However, in our study, neither differences of clay content nor soil pH were found in the larch plantations of different stand density (Table 1), indicating the irrelevancy of the soil microbial activity suppression with the soil clay content or pH. Nevertheless, studies have pointed out that phenols released from root exudating or litter decomposing can suppress soil microbial activity [34,35]. Root exudates from larch contain a decent amount of phenols and benzoates as mentioned by Ji et al. [32], which can explain the increasing microbial activity suppression in the sites of high stand density. In the larch plantation, fine-root biomass in all soil layers was found to be increased when the stand density increases (Table 1), leading to a higher input rate of root exudates in high stand density sites [75,76,77]. At the same time, more aboveground litter is expected to return into the soil when the stand density increases. Thus, with the increase in stand density, a greater amount of suppresser enters into the soil, inducing the more intensive suppression of microbes.

4.4. Microbial Suppression Attributions to Soil C Storage

Generally, r-strategy microbes are mainly responsible for labile organic matters being decomposed, with a high sensitivity to environment change; while K-strategy microbes are mainly responsible for the refractory of organic matters, such as cellulose, being decomposed, with a low sensitivity to environment change [18,78]. Our results exhibited the declined 14C-CO2 emission rate with the stand density increasing, and the differences happened in the first 3–5 days (Figure 3). As the soil samples we used to incubate were fractionated to remove the labile organic matter [14], it demonstrated that r-strategy microbes are rapidly suppressed. In addition, soil K-strategy microbes were considered suppressed according to the cumulated 12C-CO2 emission rate, which presented lower in soils from high stand density sites along the soil profile (Figure 4). Thus, we brought up an idea that the increase in soil C storage with increasing stand density in larch plantations could be an outcome of soil microbial suppression, as both r- and K-strategies microbes were suppressed by substrate decomposing. In this case, the slower decomposition rate of SOC led to a lower soil refractory output, while less FOC, such as cellulose, was decomposed, which made more FOC derived C sequestrated in the soil.

4.5. Limitation of the Study

The study focused on the mechanisms of effect of stand density on SOC storage in larch plantations. However, there are still some limitations. On one hand, based on the results of the cellulose and SOC decomposition and the extracellular enzymes activity, the idea that microbial activity suppression by larch plantations may cause the accumulation of SOC in different stand density sites was brought up; however, we did not find confident evidence to prove this. On the other hand, in order to obtain the heavy fraction and light fraction from soil and use them for further experiments, the fractionation method we used was “dry sieving and winnowing”, which was referred from Kirkby et al. [14]. It could lead to a small difference compared to the traditional fractionation method using NaI solution with 1.84 g cm−1.

5. Conclusions

With stand density increasing, SOC storage increases in the surface and subsurface soil of larch plantations. The increment of SOC storage is mostly contributed to by the increase in heavy fraction rather than light fraction. Decomposition of cellulose declined with increasing stand density, leading to an increase in residue remaining as a C input into the soil. The cumulative soil derived CO2 emission rate also declined with the increase in stand density, leading to a lower C output in high stand density plots. With stand density increasing, the stimulation of cellulose to the activity of enzymes involved in the C-cycle went down, indicating a reduced energy limit in the higher stand density. Thus, the weaker soil C output and more imported C was kept in the soil of high-density sites, which caused higher SOC storage in larch plantations.

Author Contributions

In the process of completing the experiment and manuscript, all authors have valued contribution as follows, X.S. (Xudong Sun) is responsible for conducting the experiment, data collection and manuscript writing; H.S. is responsible for completing the final manuscript and revision. J.C., G.G., R.L., J.L., Y.L. and X.S. (Xiaoyang Sun) are responsible for some experiment assistance and data analysis; Y.Z. is responsible for the experiment design. All authors have read and agreed to the published version of the manuscript.

Funding

This work was supported by Sichuan Science and Technology Program (2023NSFSC1167), National Key R&D Program of China (2022YFD2201002), Sichuan Science and Technology Program (2021YJ0293, 23NSFSC1968) and the Research Initiation Project of Mianyang Teachers’ College (2021A018).

Data Availability Statement

The data presented in this study are available on request from the corresponding author. The data are not publicly available due to privacy restrictions.

Acknowledgments

We would like to thank the “RUBION” at the Ruhr-Universität Bochum for providing us with laboratories and equipment for working with radioactive chemicals. We also want to thank Bernd Marschner, Julian Heitkötter and Xinchen Feng for offering support when the experiments were underway.

Conflicts of Interest

The authors declare no conflict of interest. The funders had no role in the design of the study; in the collection, analyses, or interpretation of data; in the writing of the manuscript; or in the decision to publish the results.

References

  1. Frouz, J.; Pižl, V.; Cienciala, E.; Kalčík, J. Carbon storage in post-mining forest soil, the role of tree biomass and soil bioturbation. Biogeochemistry 2009, 94, 111–121. [Google Scholar] [CrossRef]
  2. Karhu, K.; Wall, A.; Vanhala, P.; Liski, J.; Esala, M.; Regina, K. Effects of afforestation and deforestation on boreal soil carbon stocks-Comparison of measured C stocks with Yasso07 model results. Geoderma 2011, 164, 33–34. [Google Scholar]
  3. Li, D.; Niu, S.; Luo, Y. Global patterns of the dynamics of soil carbon and nitrogen stocks following afforestation: A meta-analysis. New Phytol. 2012, 195, 172–181. [Google Scholar]
  4. Litton, C.M.; Ryan, M.G.; Knight, D.H.; Stahl, P.D. Soil-surface carbon dioxide efflux and microbial biomass in relation to tree density 13 years after a stand replacing fire in a lodgepole pine ecosystem. Glob. Change Biol. 2003, 9, 680–696. [Google Scholar]
  5. Scott, N.A.; Tate, K.R.; Ross, D.J.; Parshotam, A. Processes influencing soil carbon storage following afforestation of pasture with Pinus radiata at different stocking densities in New Zealand. Aust. J. Soil Res. 2006, 44, 85–96. [Google Scholar]
  6. Jandl, R.; Lindner, M.; Vesterdal, L.; Bauwens, B.; Baritz, R.; Hagedorn, F.; Johnson, D.W.; Minkkinen, K.; Byrne, K.A. How strongly can forest management influence soil carbon sequestration? Geoderma 2007, 137, 253–268. [Google Scholar]
  7. Fernández-Núñez, E.; Rigueiro-Rodríguez, A.; Mosquera-Losada, M.R. Carbon allocation dynamics one decade after afforestation with Pinus radiata D. Don and Betula alba L. under two stand densities in NW Spain. Ecol. Eng. 2010, 36, 876–890. [Google Scholar] [CrossRef] [Green Version]
  8. Noh, N.J.; Son, Y.; Lee, S.K.; Yoon, T.K.; Seo, K.W.; Kim, C.; Lee, W.-K.; Bae, S.W.; Hwang, J. Influence of stand density on soil CO2 efflux for a Pinus densiflora forest in Korea. J. Plant Res. 2010, 123, 411–419. [Google Scholar] [CrossRef]
  9. González, I.G.; Corbí, J.M.G.; Cancio, A.F.; Ballesta, R.J.; Cascón, M.R.G. Soil carbon stocks and soil solution chemistry in Quercus ilex stands in Mainland Spain. Eur. J. For. Res. 2012, 131, 1653–1667. [Google Scholar]
  10. Sitters, J.; Edwards, P.J.; Venterink, H.O. Increases of Soil C, N, and P Pools Along an Acacia Tree Density Gradient and Their Effects on Trees and Grasses. Ecosystems 2013, 16, 347–357. [Google Scholar]
  11. Sun, X.; Wang, W.; Razaq, M.; Sun, H. Effects of stand density on soil organic carbon storage in the top and deep soil layers of Fraxinus mandshurica plantations. Austrian J. For. Sci. 2019, 136, 27–44. [Google Scholar]
  12. Gao, Y.; Dang, P.; Zhao, Z. Effects of afforestation on soil carbon and its fractions: A case study from the Loess Plateau, China. J. For. Res. 2018, 29, 1291–1297. [Google Scholar] [CrossRef]
  13. Ahmad, B.; Wang, Y.; Hao, J.; Liu, Y.; Bohnett, E.; Zhang, K. Variation of carbon density components with overstory structure of larch plantations in northwest China and its implication for optimal forest management. For. Ecol. Manag. 2021, 496, 119399. [Google Scholar]
  14. Kirkby, C.A.; Kirkegaard, J.A.; Richardson, A.E.; Wade, L.J.; Blanchard, C.; Batten, G. Stable soil organic matter: A comparison of C:N:P:S ratios in Australian and other world soils. Geoderma 2011, 163, 197–208. [Google Scholar] [CrossRef]
  15. Truax, B.; Fortier, J.; Gagnon, D.; Lambert, F. Planting Density and Site Effects on Stem Dimensions, Stand Productivity, Biomass Partitioning, Carbon Stocks and Soil Nutrient Supply in Hybrid Poplar Plantations. Forests 2018, 9, 293. [Google Scholar] [CrossRef] [Green Version]
  16. Litton, C.; Ryan, M.; Knight, D. Effects of tree density and stand age on carbon allocation patterns in postfire lodgepole pine. Ecol. Appl. 2004, 14, 460–475. [Google Scholar] [CrossRef] [Green Version]
  17. Fang, S.; Xue, J.; Tang, L. Biomass production and carbon sequestration potential in poplar plantations with different management patterns. J. Environ. Manage. 2007, 85, 672–679. [Google Scholar] [CrossRef]
  18. Fontaine, S.; Bardoux, G.; Abbadie, L.; Mariotti, A. Carbon input to soil may decrease soil carbon content. Ecol. Lett. 2004, 7, 314–320. [Google Scholar] [CrossRef]
  19. Fontaine, S.; Barot, S. Size and functional diversity of microbe populations control plant persistence and long-term soil carbon accumulation. Ecol. Lett. 2005, 8, 1075–1087. [Google Scholar] [CrossRef]
  20. Blagodatskaya, E.; Kuzyakov, Y. Mechanisms of real and apparent priming effects and their dependence on soil microbial biomass and community structure: Critical review. Biol. Fertil. Soils 2008, 45, 115–131. [Google Scholar] [CrossRef]
  21. Kuzyakov, Y.; Friedel, J.; Stahr, K. Review of mechanisms and quantification of priming effects. Soil Biol. Biochem. 2000, 32, 1485–1498. [Google Scholar] [CrossRef]
  22. Noh, N.J.; Kim, C.; Bae, S.W.; Lee, W.K.; Yoon, T.K.; Muraoka, H.; Son, Y. Carbon and nitrogen dynamics in a Pinus densiflora forest with low and high stand densities. J. Plant. Ecol. 2013, 6, 368–379. [Google Scholar] [CrossRef] [Green Version]
  23. Fontaine, S.; Bardoux, G.; Benest, D.; Verdier, B.; Mariotti, A.; Abbadie, L. Mechanisms of the priming effect in a savannah soil amended with cellulose. Soil Sci. Soc. Am. J. 2004, 68, 125–131. [Google Scholar]
  24. Averill, C.; Waring, B. Nitrogen limitation of decomposition and decay: How can it occur? Glob. Change Biol. 2018, 24, 1417–1427. [Google Scholar] [CrossRef] [PubMed] [Green Version]
  25. Bowden, R.D.; Davidsonb, E.; Savageb, K.; Arabiaa, C.; Steudlerc, P. Chronic nitrogen additions reduce total soil respiration and microbial respiration in temperate forest soils at the Harvard Forest. For. Ecol. Manag. 2004, 196, 43–56. [Google Scholar] [CrossRef]
  26. Yang, K.; Zhu, J.; Gu, J.; Xu, S.; Yu, L.; Wang, Z. Effects of continuous nitrogen addition on microbial properties and soil organic matter in a Larix gmelinii plantation in China. J. For. Res. 2018, 29, 85–92. [Google Scholar] [CrossRef]
  27. Kögel-Knabner, I. The macromolecular organic composition of Plant and microbial residues as inputs to soil organic matter. Soil Biol. Biochem. 2002, 34, 139–162. [Google Scholar] [CrossRef]
  28. Fontaine, S.; Henault, C.; Aamor, A.; Bdioui, N.; Bloor, J.M.G.; Maire, V.; Mary, B.; Revaillot, S.; Maron, P.A. Fungi mediate long term sequestration of carbon and nitrogen in soil through their priming effect. Soil Biol. Biochem. 2011, 43, 86–96. [Google Scholar] [CrossRef]
  29. Chaparro, J.M.; Sheflin, A.; Manter, D.; Vivanco, J.M. Manipulating the soil microbiome to increase soil health and plant fertility. Biol. Fertil. Soils 2012, 48, 489–499. [Google Scholar]
  30. Luo, Y.; Zhao, X.; Andrén, O.; Zhu, Y.; Huang, W. Artificial root exudates and soil organic carbon mineralization in a degraded sandy grassland in northern China. J. Arid Land 2014, 6, 423–431. [Google Scholar] [CrossRef]
  31. Badri, D.; Vivanco, J.M. Regulation and function of root exudates. Plant Cell Environ. 2009, 32, 666–681. [Google Scholar] [CrossRef] [PubMed]
  32. Ji, L.; Salahuddin, L.J.; Zhang, J.; You, L.; He, C.; Yang, L. Larch (Larix gmelinii) bulk soil phenolic acids promote manchurian walnut (Juglans manshurica) growth and soil microorganism biomass. Pak. J. Bot. 2016, 48, 2549–2556. [Google Scholar]
  33. Zhu, X.; Liu, W.; Chen, H.; Deng, Y.; Chunfeng, C.; Zeng, H. Effects of forest transition on litterfall, standing litter and related nutrient returns: Implications for forest management in tropical China. Geoderma 2019, 333, 123–134. [Google Scholar] [CrossRef]
  34. Anyanwu, I.; Semple, K. Assessment of the effects of phenanthrene and its nitrogen heterocyclic analogues on microbial activity in soil. SpringerPlus 2016, 5, 279. [Google Scholar] [CrossRef] [PubMed] [Green Version]
  35. Ushio, M.; Miki, T.; Kitayama, K. Phenolic Control of Plant Nitrogen Acquisition through the Inhibition of Soil Microbial Decomposition Processes: A Plant-Microbe Competition Model. Microbes Environ. 2009, 24, 180–187. [Google Scholar] [CrossRef]
  36. Bagchi, S.; Roy, S.; Maitra, A.; Rubanpreet, S.S. Herbivores suppress soil microbes to influence carbon sequestration in the grazing ecosystem of the Trans-Himalaya. Agric. Ecosyst. Environ. 2017, 239, 199–206. [Google Scholar] [CrossRef]
  37. Rumpel, C.; Kögel-Knabner, I. Deep soil organic matter-a key but poorly understood component of terrestrial C cycle. Plant Soil 2011, 338, 143–158. [Google Scholar] [CrossRef]
  38. Fontaine, S.; Barot, S.; Barre, P.; Bdioui, N.; Mary, B.; Rumpel, C. Stability of organic carbon in deep soil layers controlled by fresh carbon supply. Nature 2007, 450, 277–280. [Google Scholar] [CrossRef]
  39. Iversen, C.; Keller, J.K.; Garten, C.T.; Norby, R. Soil carbon and nitrogen cycling and storage throughout the soil profile in a sweetgum plantation after 11 years of CO2-enrichment. Glob. Change Biol. 2012, 18, 1684–1697. [Google Scholar] [CrossRef]
  40. Salomé, C.; Nunan, N.; Pouteau, V.; Lerch, T.Z.; Chenu, C. Carbon dynamics in topsoil and in subsoil may be controlled by different regulatory mechanisms. Glob. Change Biol. 2010, 16, 416–426. [Google Scholar]
  41. Sinsabaugh, R.S. Enzymic analysis of microbial pattern and process. Biol. Fertil. Soils 1994, 17, 69–74. [Google Scholar] [CrossRef]
  42. Caldwell, B.A. Enzyme activities as a component of soil biodiversity: A review. Pedobiologia 2005, 49, 637–644. [Google Scholar]
  43. Allison, S.D.; Weintraub, M.N.; Gartner, T.B.; Waldrop, M.P. Evolutionary-Economic Principles as Regulators of Soil Enzyme Production and Ecosystem Function. In Soil Enzymology; Springer: Berlin/Heidelberg, Germany, 2011; pp. 229–243. [Google Scholar]
  44. Burns, R.G.; DeForest, J.L.; Marxsen, J.; Sinsabaugh, R.L.; Stromberger, M.E.; Wallenstein, M.D.; Weintraub, M.N.; Zoppini, A. Soil enzymes in a changing environment: Current knowledge and future directions. Soil Biol. Biochem. 2013, 58, 216–234. [Google Scholar]
  45. Arunrat, N.; Sereenonchai, S.; Sansupa, C.; Kongsurakan, P.; Hatano, R. Effect of Rice Straw and Stubble Burning on Soil Physicochemical Properties and Bacterial Communities in Central Thailand. Biology 2023, 12, 501. [Google Scholar]
  46. Hernández, D.L.; Hobbie, S.E. The effects of substrate composition, quantity, and diversity on microbial activity. Plant Soil 2010, 335, 397–411. [Google Scholar] [CrossRef]
  47. Brzostek, E.; Finzi, A.C. Substrate supply, fine roots, and temperature control proteolytic enzyme activity in temperate forest soils. Ecology 2011, 92, 892–902. [Google Scholar] [CrossRef]
  48. Brackin, R.; Robinson, N.; Lakshmanan, P.; Schmidt, S. Soil microbial responses to labile carbon input differ in adjacent sugarcane and forest soils. Soil Res. 2014, 52, 307. [Google Scholar] [CrossRef]
  49. Heitkötter, J.; Niebuhr, J.; Heinze, S.; Marschner, B. Patterns of nitrogen and citric acid induced changes in C-turnover and enzyme activities are different in topsoil and subsoils of a sandy Cambisol. Geoderma 2017, 292, 111–117. [Google Scholar]
  50. Keeler, B.; Hobbie, S.; Kellogg, L. Effects of Long-Term Nitrogen Addition on Microbial Enzyme Activity in Eight Forested and Grassland Sites: Implications for Litter and Soil Organic Matter Decomposition. Ecosystems 2008, 12, 1–15. [Google Scholar] [CrossRef]
  51. Riggs, C.; Hobbie, S. Mechanisms driving the soil organic matter decomposition response to nitrogen enrichment in grassland soils. Soil Biol. Biochem. 2016, 99, 54–65. [Google Scholar] [CrossRef] [Green Version]
  52. Eissenstat, D.M.; Wells, C.E.; Yanai, R.D.; Whitbeck, J.L. Building roots in a changing environment: Implications for root longevity. New Phytol. 2000, 147, 33–42. [Google Scholar]
  53. Heinze, S.; Ludwig, B.; Piepho, H.-P.; Mikutta, R.; Don, A.; Wordell-Dietrich, P.; Helfrich, M.; Hertel, D.; Leuschner, C.; Kirfel, K.; et al. Factors controlling the variability of organic matter in the top- and subsoil of a sandy Dystric Cambisol under beech forest. Geoderma 2018, 311, 37–44. [Google Scholar] [CrossRef]
  54. Vance, E.; Brookes, P.C.; Jenkinson, D.S. An Extraction Method for Measuring Soil Microbial Biomass C. Soil Biol. Biochem. 1987, 19, 703–707. [Google Scholar] [CrossRef]
  55. Marx, M.C.; Wood, M.; Jarvis, S.C. A microplate fluorimetric assay for the study of enzyme diversity in soils. Soil Biol. Biochem. 2001, 33, 1633–1640. [Google Scholar] [CrossRef]
  56. Kirkby, C.A.; Richardson, A.E.; Wade, L.J.; Passioura, J.B.; Batten, G.D.; Blanchard, C.; Kirkegaard, J.A. Nutrient availability limits carbon sequestration in arable soils. Soil Biol. Biochem. 2014, 68, 402–409. [Google Scholar] [CrossRef]
  57. DeMarco, J.; Mack, M.C.; Bret-Harte, M.S. Effects of arctic shrub expansion on biophysical vs. biogeochemical drivers of litter decomposition. Ecology 2014, 95, 1861–1875. [Google Scholar] [CrossRef] [PubMed]
  58. de Graaff, M.A.; Jastrow, J.D.; Gillette, S.; Johns, A.; Wullschleger, S.D. Differential priming of soil carbon driven by soil depth and root impacts on carbon availability. Soil Biol. Biochem. 2014, 69, 147–156. [Google Scholar] [CrossRef]
  59. Czarnota, M.A.; Rimando, A.M.; Weston, L.A. Evaluation of Root Exudates of Seven Sorghum Accessions. J. Chem. Ecol. 2003, 29, 2073–2083. [Google Scholar] [CrossRef] [PubMed]
  60. Blagodatskaya, E.V.; Blagodatsky, S.A.; Anderson, T.H.; Kuzyakov, Y. Priming effects in Chernozem induced by glucose and N in relation to microbial growth strategies. Appl. Soil Ecol. 2007, 37, 95–105. [Google Scholar] [CrossRef]
  61. Klumpp, K.; Fontaine, S.; Attard, E.; Le Roux, X.; Gleixner, G.; Soussana, J.-F. Grazing triggers soil carbon loss by altering plant roots and their control on soil microbial community. J. Ecol. 2009, 97, 876–885. [Google Scholar] [CrossRef]
  62. Shahzad, T.; Chenu, C.; Repincay, C.; Mougin, C.; Ollier, J.-L.; Fontaine, S. Plant clipping decelerates the mineralization of recalcitrant soil organic matter under multiple grassland species. Soil Biol. Biochem. 2012, 51, 73–80. [Google Scholar] [CrossRef]
  63. Dawson-Glass, E.; Hewins, C.R.; Burke, D.J.; Stuble, K.L. Experimental increases in pH and P availability exert long-term impacts on decomposition in forests. Appl. Soil Ecol. 2023, 181, 104654. [Google Scholar] [CrossRef]
  64. Stott, D.E.; Andrews, S.S.; Liebig, M.A.; Wienhold, B.J.; Karlen, D.L. Evaluation of β-Glucosidase Activity as a Soil Quality Indicator for the Soil Management Assessment Framework. Soil Sci. Soc. Am. J. 2010, 74, 107–119. [Google Scholar] [CrossRef] [Green Version]
  65. Huang, Y.; Wu, Z.; Zong, Y.; Li, W.; Chen, F.; Wang, G.G.; Li, J.; Fang, X. Mixing with coniferous tree species alleviates rhizosphere soil phosphorus limitation of broad-leaved trees in subtropical plantations. Soil Biol. Biochem. 2022, 175, 108853. [Google Scholar] [CrossRef]
  66. Koyama, A.; Wallenstein, M.; Simpson, R.; Moore, J. Carbon-degrading enzyme activities stimulated by increased nutrient availability in arctic tundra soils. PLoS ONE 2013, 8, e77212. [Google Scholar] [CrossRef] [Green Version]
  67. Stark, S.; Männistö, M.; Eskelinen, A. Nutrient availability and pH jointly constrain microbial extracellular enzyme activities in nutrient-poor tundra soils. Plant Soil 2014, 383, 373–385. [Google Scholar] [CrossRef]
  68. Creamer, C.A.; Jones, D.L.; Baldock, J.A.; Rui, Y.; Murphy, D.V.; Hoyle, F.C.; Farrell, M. Is the fate of glucose-derived carbon more strongly driven by nutrient availability, soil texture, or microbial biomass size? Soil Biol. Biochem. 2016, 103, 201–212. [Google Scholar] [CrossRef]
  69. Hüblová, L.; Frouz, J. Contrasting effect of coniferous and broadleaf trees on soil carbon storage during reforestation of forest soils and afforestation of agricultural and post-mining soils. J. Environ. Manage. 2021, 290, 112567. [Google Scholar] [CrossRef]
  70. Wäldchen, J.; Schöning, I.; Mund, M.; Schrumpf, M.; Bock, S.; Herold, N.; Totsche, K.; Ernst Detlef, S. Estimation of clay content from easily measurable water content of air-dried soil. J. Plant. Nutr. Soil Sci. 2012, 175, 367–376. [Google Scholar] [CrossRef]
  71. Dilustro, J.J.; Collins, B.; Duncan, L.; Crawford, C. Moisture and soil texture effects on soil CO2 efflux components in southeastern mixed pine forests. For. Ecol. Manag. 2005, 204, 87–97. [Google Scholar] [CrossRef]
  72. Müller, T.; Höper, H. Soil organic matter turnover as a function of the soil clay content: Consequences for model applications. Soil Biol. Biochem. 2004, 36, 877–888. [Google Scholar] [CrossRef]
  73. Zhang, W.; Lu, Z.; Yang, K.; Zhu, J. Impacts of conversion from secondary forests to larch plantations on the structure and function of microbial communities. Appl. Soil Ecol. 2017, 111, 73–83. [Google Scholar] [CrossRef]
  74. Berger, T.W.; Neubauer, C.; Glatzel, G. Factors controlling soil carbon and nitrogen stores in pure stands of Norway spruce (Picea abies) and mixed species stands in Austria. For. Ecol. Manag. 2002, 159, 3–14. [Google Scholar] [CrossRef]
  75. Iversen, C.; Ledford, J.; Norby, R. CO2 enrichment increases carbon and nitrogen input from fine roots in a deciduous forest. New Phytol. 2008, 179, 837–847. [Google Scholar] [CrossRef] [PubMed]
  76. Hu, Y.; Zeng, D.H.; Ma, X.Q.; Chang, S. Root rather than leaf litter input drives soil carbon sequestration after afforestation on a marginal cropland. For. Ecol. Manag. 2016, 362, 38–45. [Google Scholar] [CrossRef]
  77. Ding, Y.; Leppälammi-Kujansuu, J.; Helmisaari, H.S. Fine root longevity and below- and aboveground litter production in a boreal Betula pendula forest. For. Ecol. Manag. 2019, 431, 17–25. [Google Scholar] [CrossRef]
  78. Fontaine, S.; Mariotti, A.; Abbadie, L. The priming effect of organic matter: A question of microbial competition? Soil Biol. Biochem. 2003, 35, 837–843. [Google Scholar] [CrossRef]
Figure 1. The SOC storage of larch plantations with different stand density. Bars represent the means with standard error in error bar (n = 3), different letters represent significant differences among stand densities in the same layer (p < 0.05). LD, MD and HD represented low density, middle density and high density.
Forests 14 01412 g001
Figure 2. The allocation of SOC storage (A) and the increment of SOC storage (B) in light fraction and heavy fraction of larch plantations with different stand density. T, M and D represented the 0–20 cm layer, 20–40 cm layer and 40–60 cm layer. LD, MD and HD represented low density, middle density and high density.
Forests 14 01412 g002
Figure 3. Daily emission rate of cellulose derived CO2 (14C-CO2) from soils of larch plantations with different stand density in the 0–20 cm layer (A), 20–40 cm layer (B), and 40–60 cm layer (C). The error bar presents the standard error (n = 3; p < 0.05). LD, MD and HD represented low density, middle density and high density.
Forests 14 01412 g003
Figure 4. Cumulative SOC derived CO2 emission rate in control (A) and cellulose addition (B) of larch plantations with different stand density. Bars represent the means with standard error in the error bar (n = 3), different letters represent significant differences among stand densities in the same layer (p < 0.05). LD, MD and HD represented low density, middle density and high density.
Forests 14 01412 g004
Table 1. Fine root biomass, C concentration, N concentration, C/N ratio, Cmic, Nmin, Nmin/Cmic ratio, DOC and pH value for the incubation samples in the larch plantation with different stand density. Dates are presented as means with standard error in parentheses (n = 3); different letters represent significant differences among stand densities in the same layer (p < 0.05).
LayerDensityFine Root Biomass
(g m−2)
C
(mg g−1)
N
(mg g−1)
C/NCmic
(μg g−1)
Nmin
(μg g−1)
Nmin/Cmic
(10−2)
DOC
(μg g−1)
pH
0–20 cmLD128.98 b (28.03)31.21 a (6.48)3.04 a (0.59)10.20 a (0.51)230.48 a (10.77)18.56 a (1.98)8.05 b (1.32)51.41 c (3.14)5.01 a (0.06)
MD165.53 ab (23.36)32.07 a (5.88)3.04 a (0.53)10.55 a (0.41)189.50 b (25.83)19.56 a (2.14)10.84 b (2.19)59.36 b (2.91)5.29 a (0.14)
HD187.16 a (26.18)30.44 a (5.70)2.88 a (0.48)10.50 a 0.24)128.32 c (15.92)19.40 a (2.70)15.12 a (3.06)73.66 a (4.31)5.20 a (0.06)
20–40 cmLD43.96 b (9.74)10.62 a (1.84)1.11 a (0.17)9.51 a (0.44)39.04 a (3.51)17.14 a (1.42)43.90 c (4.12)44.53 b (3.37)4.79 a (0.13)
MD49.96 ab (11.43)11.33 a (1.92)1.15 a (0.10)9.74 a (0.82)30.32 b (2.18)15.84 a (2.07)52.24 b (6.18)50.59 b (2.41)5.00 a (0.13)
HD69.98 a (16.57)7.81 a (2.53)0.83 a (0.27)9.43 a (0.21)26.27 b (1.83)16.94 a (0.95)64.48 a (5.60)57.38 a (1.86)5.01 a (0.03)
40–60 cmLD12.03 b (5.84)3.63 a (0.57)0.42 a (0.05)8.69 b (0.26)9.22 a (0.70)3.21 a (0.35)34.82 c (3.53)33.60 b (4.19)4.76 a (0.16)
MD14.37 b (4.26)5.99 a (1.81)0.68 a (0.20)8.73 b (0.67)8.95 a (0.71)4.70 a (0.39)52.51 b (5.81)34.13 b (3.79)5.06 a (0.10)
HD22.11 a (5.22)5.86 a (0.87)0.61 a (0.13)9.87 a (0.80)6.38 b (0.57)4.99 a (0.53)78.21 a (8.38)60.43 a (9.71)5.07 a (0.03)
Note: LD, MD and HD represented low density, middle density and high density.
Table 2. Activity of extracellular enzymes (SOC normalized) of larch plantations after 46 days of incubation. Data are presented as means with standard error in parentheses (n = 3). Different letters represent significant differences among stand densities in the same treatment and asterisk represents the significant effect of treatment compare to control (p < 0.05). The unit of enzyme activity was expressed as μmol g−1C h−1.
LayerTreatmentDensityβ-gluN-acetβ-xylβ-cellophotyrarg
0–20 cmControlLD500.01 a (29.67)240.78 a (20.45)116.95 a (10.49)85.76 a (16.29)1983.20 a (167.84)185.00 b (27.82)258.69 b (28.46)
MD859.12 a (103.54)216.54 a (36.29)128.66 a (11.13)105.40 a (15.35)1570.11 a (421.56)350.67 a (13.8)595.59 a (5.04)
HD622.26 a (30.63)304.82 a (21.31)134.91 a (6.25)95.47 a (14.03)1861.63 a (150.35)211.06 b (35.93)340.14 b (43.30)
CelluloseLD3710.13 b (170.85) *2759.40 a (218.98) *791.96 a (36.43) *715.70 a (166.82) *18,159.09 a (521.17) *243.48 b (12.38)427.36 b (39.77) *
MD4543.38 a (486.78) *1389.09 c (153.62) *724.97 a (58.73) *446.70 b (68.65) *10,902.76 b (885.14) *390.96 a (43.05)730.36 a (32.98)
HD3373.42 b (193.90) *2192.40 b (123.31) *680.28 a (57.45) *443.14 b (65.57) *11,712.99 b (1748.08) *306.82 b (27.64) *516.48 b (24.72)
20–40 cmControlLD1807.84 b (191.85)1123.05 a (143.49)672.21 a (32.80)327.02 a (19.60)12,301.62 a (368.78)146.48 a (13.97)242.27 a (46.96)
MD2792.59 a (427.59)1362.95 a (60.06)824.95 a (68.19)387.71 a (44.86)12,557.36 a (273.12)203.45 a (20.54)295.42 a (32.47)
HD1650.74 b (197.79)1193.27 a (132.94)663.68 a (121.98)402.52 a (93.86)13,397.28 a (648.90)142.85 a (60.85)183.01 a (71.83)
CelluloseLD2075.58 a (343.62)1475.58 b (87.90) *636.04 b (15.64)158.18 c (45.61) *14,279.66 b (541.38) *167.46 a (42.64)410.46 b (21.73)
MD2027.89 a (116.52) *1719.33 b (134.22) *674.19 b (22.14)387.48 b (16.55)14,303.86 b (298.03)153.76 a (18.98)256.73 c (61.66)
HD2229.84 a (116.12) *2085.64 a (160.47) *2049.15 a (64.08) *939.41 a (47.07) *25,002.57 a (773.87) *176.89 a (5.07)1460.92 a (85.52) *
40–60 cmControlLD1639.56 a (130.29)1955.34 a (114.28)687.46 b (163.97)560.03 a (63.29)13,030.01 a (1537.30)45.10 b (24.8)900.74 a (58.51)
MD1490.02 a (225.11)1649.26 a (55.68)467.42 b (18.13)367.09 b (33.36)11,220.70 a (138.31)98.86 a (12.12)941.19 a (62.18)
HD2298.75 a (154.64)1017.12 b (313.84)1051.88 a (95.55)690.48 a (51.53)13,987.43 a (926.54)118.59 a (8.06)948.92 a (53.64)
CelluloseLD1014.58 b (308.63)693.71 b (269.16) *730.09 a (365.97) *270.27 b (70.27) *7295.34 c (3647.68) *67.78 a (11.42)576.35 a (182.81) *
MD1653.36 a (107.32)1528.03 a (62.80)817.26 a (90.73) *269.87 b (48.03)16,227.29 a (1004.07) *124.14 a (10.82)227.89 b (38.91) *
HD1826.48 a (101.26)1376.07 a (43.9)717.67 a (19.00) *514.15 a (72.46)11,286.67 b (579.34) *106.03 a (23.08)495.64 a (51.44) *
Note: LD, MD and HD represent low density, middle density and high density. β-glu for β-glucosidase, N-acet for N-acetyl-β-glucosaminidase, β-xyl for β-xylosidase, β-cello for β-cellobiosidase, pho for acid phosphatase, tyr for tyrosine-aminopeptidase, arg for arginine-aminopeptidase.
Disclaimer/Publisher’s Note: The statements, opinions and data contained in all publications are solely those of the individual author(s) and contributor(s) and not of MDPI and/or the editor(s). MDPI and/or the editor(s) disclaim responsibility for any injury to people or property resulting from any ideas, methods, instructions or products referred to in the content.

