Article

Impacts of Forest Management on the Biodiversity and Sustainability of Carya dabieshanensis Forests

1
School of Forestry & Landscape Architecture, Anhui Agricultural University, Hefei 230036, China
2
College of Civil and Architecture Engineering, Chuzhou University, Chuzhou 239000, China
*
Author to whom correspondence should be addressed.
These authors contributed equally to this work.
Forests 2023, 14(7), 1331; https://doi.org/10.3390/f14071331
Submission received: 2 June 2023 / Revised: 27 June 2023 / Accepted: 27 June 2023 / Published: 28 June 2023

Abstract

:
Natural secondary Carya dabieshanensis forests comprise the natural wealth of the Dabie Mountains, which maintain the ecological balance of this region and enhance the incomes of farmers. However, forest ecosystems are being increasingly challenged due to increasing long-term anthropogenic development and management. Elucidating the impacts of management intensity and duration on the diversity and stability of vegetation communities in natural secondary Carya dabieshanensis forests is of great significance toward achieving sustainable forest management. For this study, we compared the effects of three forest management intensities (no management (CK), extensive management (EM), and intensive management (IM)), and five management durations (0, 3, 8, 15, and 20 y) on species diversity and the stability of vegetation communities (trees, shrubs, and herbaceous layers) of a Carya dabieshanensis forest. Our results revealed that the diversity of the vegetation communities continued to decline following the onset of management activities. The diversity, dominance, evenness, and richness indices of the vegetation communities decreased by 53.37%–62.77%, 46.04%–59.17%, 32.58%–53.55%, and 50.18%–51.30%, respectively, after 20 y of forest management. Intensive management translated to species diversity loss more so than extensive management. All vegetation communities of the forest stands under study were generally unstable; however, the stability they did have was not at risk under greater management intensity and duration, and neither did greater species diversity enhance it. This study provides new evidence to support the non-synchronicity of species diversity and community stability in forest resident vegetation communities. Since the species diversity and structural composition of tree layers have a positive effect on community stability, so we suggest that both extensive and intensive forest lands need to retain or replant more tree species other than Carya dabieshanensis.

1. Introduction

Biodiversity is an essential foundation for ecosystem sustainability, and plays an important role in maintaining the structural stability and functional complexity of ecosystems [1,2], and to some extent reflects their productivity. The study and protection of biodiversity has become a critical task that aligns with the development of human destiny [3].
Forests cover more than 30% of the land area worldwide and are home to most terrestrial biodiversity on Earth. They play irreplaceable roles for the protection of ecosystem diversity and maintaining species richness [4]. A recent study revealed that protecting and enhancing the diversity of forest vegetation, particularly tree diversity, can promote soil carbon and nitrogen storage, as well as improve carbon capacities and soil nitrogen fertility [3]. A meta-analysis showed that on a global scale, the diversity of plant species increased the soil microbial biomass, fungal–bacterial biomass ratio, and respiration in terrestrial ecosystems [5].
The diversity of vegetation community species in forests is an essential indicator of their succession stages, which sustains ecosystem functions at certain spatial and temporal scales [2]. The stability of plant communities is a comprehensive reflection of their structures and functions, which mirrors the anti-disturbance capacity of forests and their ability to recover community structures after further disturbances. Thus, the investigation of community stability is useful toward understanding the status quo and succession law of vegetation communities [6,7].
In recent years, forest degradation and the loss of species diversity have been occurring at an alarming rate [4]. The species diversity and stability of forest ecosystems are impacted by multiple factors (e.g., global climate change, anthropogenic disturbances, genetic variations of populations, topography, and soil, etc.). Species diversity and community stability in the subtropical forest ecosystems of China are also affected by stand structures, climate, and slope [8]. Among them, stand structure plays a decisive role in community stability, where complex tree structures directly influence the ability and utilization efficacy of light [9]. Rainfall fluctuations indirectly affect community stability by modifying productivity, while slope indirectly impacts stability by shaping species composition and richness [10]. In the Amazon Rainforest, climate change is driving the transition of tree communities to large species; however, changes in tropical tree community biodiversity lag behind climate change. As this lagging effect persists, Amazon forests are likely to be increasingly dominated by less adapted trees, which threatens biodiversity and carbon sequestration [11]. The stability of differently aged forests is variable; however, the primary productivity of old growth patches remains relatively stable. This is because the abundant sub-canopy in the lower canopy can compensate for the biomass loss induced by canopy aging and the climatic environment. Since younger forests are comprised of fast-growing, light-loving species, their species composition is constantly changing, and productivity stability is low [12]. It has been reported that the “niche complementarity effect” between species has an important impact on community stability. When the traits between species are different, this can stimulate the community to secure more resources, reduce intraspecific competition, and improve community stability [13]. A meta-analysis showed that on a global scale, plant species diversity increased the soil microbial biomass, fungal–bacterial biomass ratio, and respiration in terrestrial ecosystems [8]. Earlier studies indicated that higher genetic diversity in a population enhanced the stability of its communities, while genetic variations buffered the impacts of environmental changes on its development by improving the adaptive capacities of species [14,15].
Typically, moderate disturbances (harvesting, grazing) often reduce forest biomass but may increase species richness [16]. Anthropogenic disturbances modify the heterogeneity and availability of light and substrates to some degree. Forest thinning can provide opportunities for certain light-loving, albeit less representative species, while the removal of upper vegetation may increase the risk of soil erosion [17,18]. Cyclical understory activities have varying impacts on plant diversity. For example, periodic understory vegetation clearance might lead to the complete loss of some species [19], and also indirectly reduce the diversity of understory plants by exacerbating the loss of soil available phosphorus [13]. Rotational grazing can improve understory vegetation structures in terms of species diversity and increase coverage, while enhancing soil fertility to some extent [20]. Therefore, the impacts of anthropogenic activities on the stability and species diversity of forest vegetation are not always destructive; thus, more consideration should be given to the mode, intensity, and duration of forest management [21,22]. It is of great value to explore the co-effects of species diversity and stability of forest vegetation on time series and management intensity, as well as the relationships between the diversity and stability of community species to protect and guide sustainable forest management.
Many techniques may be used for the assessment of biodiversity, including sample surveys, hyperspectral image estimation, model estimation, and rapid ecological assessment (REA). From the perspective of the applicability of a given method, hyperspectral image estimation and model estimation are more suitable for large-scale applications and require richer databases [23,24]. REA do not require species identification, which greatly improves work efficiencies; however, the selection of variables used and the skills of field workers have higher requirements, and often necessitate professional training [25]. Sample surveys are basic methods that are extensively used in the study of species diversity in forest ecosystems worldwide. Although this work is time consuming and laborious, it provides accurate data for species and is universally applicable [2,26]. At present, there are two main strategies for the determination of community stability. One strategy involves the use bioecological methods to assess stability by quantifying the compositions of tree community species, age structures, and distribution patterns [8,12]. A second approach involves the use of quantitative ecological methods, such as the optimized M. Godron stability measurement method, community stability index, etc. [27,28]. Between them, the M. Godron stability measurement method has lower data requirements and has a more flexible discrimination of community stability; thus, it is widely used.
Carya dabieshanensis is prevalent in the Dabie Mountains of China, where its natural secondary forest is primarily distributed across the Dabie Mountains of subtropical Northern China. This species has flourished on a large scale over the last 20 years due to the rich nutritional value and high-quality taste of its fruit [29]. To enhance fruit yields, fertilization, as well as the regular removal of understory vegetation and miscellaneous trees (other than Carya dabieshanensis) have been the most common management methods used by operators [30]. More than 20 years of forest management have modified the original stand structures, as many species have disappeared in this community. Furthermore, the diversity of forest vegetation and sustainable management capacities in this area are facing challenges.
This study aims to elucidate the impacts of forest management intensity and duration on the diversity of vegetation species and community stability. Furthermore, to determine how the biodiversity of this area might be protected and maintained to sustain its unique stand community structures and ecological functions. To this end, we established 45 fixed plots in a natural secondary Carya dabieshanensis forest area. The diversity of tree, shrub, and herbaceous plant species in the plot communities was enumerated, and the stability of the community structures was quantified. We hypothesized that: (1) With increased management intensity and duration, the diversity of plant species in the natural secondary forest of Carya dabieshanensis continually decreases; (2) Intensive management has a greater effect on the stability of vegetation communities in the natural secondary Carya dabieshanensis forest than does extensive management; (3) The diversity of vegetation species plays a decisive role in community stability.

2. Materials and Methods

2.1. Study Area

The study site is situated in the Dabie Mountain Forest Area, Tiantianzhai Town, and Guanmiao Township, in Jinzhai County, of Anhui Province, China (Figure 1, Table S1). This region is home to a humid subtropical monsoon climate with average temperatures that range from 26 °C in summer to 2 °C in winter, an altitude of 150–1353 m, and average annual precipitation of 1300 mm [30]. The soil thickness ranges from 30–100 cm, is mainly yellow-brown loam (70% medium loam and sandy loam), and slightly acidic (pH 4.5–6.5), with a slope of 20°–30°. The primary tree layer in the forest area is Carya dabieshanensis, accompanied by small quantities of Cunninghamia lanceolata, Castanea mollissima, and Fortunearia sinensis. Due to the regular removal of understory vegetation, there is a negligible shrub layer, with Diospyros lotus and Lindera glauca being the more common species, while Duchesnea indica, Erigeron annuus, Aster tataricus, and Stellaria chinensis are the dominant herbs. All study plots were established on shady and semi-shady slopes at altitudes of from 550 to 850 m.
Referring to the definition of management strategies in other regions of bamboo forest, chestnut forest, and crop planting areas, we divided the management strategy of the natural secondary Carya dabieshanensis forest into three categories (unmanaged, extensive management, and intensive management) [31,32,33]. The unmanaged model was referred to as CK, as it could be seen as blank processing in terms of administration duration and management intensity. In the unmanaged stands, farmers only picked fruit in autumn and were not engaged in any other management activities. In extensively managed and intensively managed forest stands, during the first year of management activity, all trees except for Carya dabieshanensis were cleared from the forest. Subsequently, the differences in management included the number of times the understory cover was cleared each year, and whether fertilization was applied. Among them, in the extensively managed stands, the understory vegetation was cleared using a brush cutter in August each year without fertilization. In the intensively managed forest area, a brush cutter was used twice in June and August to clear the understory vegetation, and compound fertilizer (N: P2O5: K2O = 13:5:7) was applied (375 kg·hm−2) in June and August of each year. Organic fertilizer (organic matter content 45%) was applied (1500 kg·hm−2) once a year, from November to December.
Before 2002, none of the sites we chose had any human management activities. Next, we selected five time periods (0 y (CK), 3 y, 8 y, 15 y, and 20 y) as the durations of the management time series according to the actual onset of these activities.

2.2. Sampling Design

In August 2022, based on the information provided by local operators, a total of nine forest areas (CK, EM-3, EM-8, EM-15, EM-20, IM-3, IM-8, IM-15, and IM-20) were surveyed, and five duplicate plots were established in each forest area, for a total of 45 plots. For each plot, 20 m × 20 m subplots were randomly established and included in the tree layer vegetation survey, which involved measuring and recording the species name, DBH (diameter at breast height), height, and crown width of all trees (DBH > 5 cm, height ≥ 6 m). In each tree subplot, three 5 m × 5 m shrub layer plots were set diagonally, for a total of 135 shrub plots, wherein all names, populations, heights, and crown widths of all shrubs were measured and recorded (e.g., all woody plants with a ground diameter of ≤5 cm, 5 m > height ≥ 0.3 m, where the ground diameter refers to the thickness of the stem at 10 cm aboveground). A total of ten 1 m × 1 m herbaceous layer sample plots (all vascular plants with heights of <0.3 m) were set diagonally in each tree subplot, for a total of 450 herb plots, for which the names, populations, and coverage of the herbaceous species where identified, measured, and recorded.

2.3. Data Analysis

The stand species diversity α was characterized by the species richness combined with the diversity, dominance, and evenness indices. The Margalef richness index (S) of each forest layer species was expressed by the species number, diversity was expressed by the Shannon–Wiener diversity index (H) and Simpson dominance index (D), while the species Pielou evenness was calculated based on the H and S indices (J).
Margalef   richness   index : R = S
Shannon Wiener   diversity   index :   H = i = 1 S P i l n P i
Simpson   dominance   index : D = 1 i = 1 S N i N i 1 N N 1
Pielou   evenness   index : J = H l n   S
where S represents the total number of species in the plot; Pi is the proportion of the ith species to the total number of individuals, that is, Pi = Ni/N; Ni is the number of individuals of the ith species; and N is the total number of individuals of all species in the plot.
R C = α R t + β R s + γ R h
H C = α H t + β H s + γ H h
D C = α D t + β D s + γ D h
J C = α J t + β J s + γ J h
where RC, HC, DC, and JC are the Margalef richness, Shannon–Wiener diversity, Simpson dominance, and Pielou evenness indices of plant communities, respectively. α, β, and γ are the given weight coefficients for trees (t), shrubs (s), and herbs (h) determined as 0.50, 0.25, and 0.25, respectively [2,34,35].
An improved M. Godron [27] stability assay was employed to calculate the community stability [2]. The reciprocal cumulative percentage of the total number of species in the community, and the relative frequency accumulation percentage of species occurrence were used to simulate the curve equation, respectively. In addition, we used a straight-line equation (y = 100 − x) that intersected the smooth curve, where the closer the intersection point was to the stable point (20, 80), the more stable the community. The converse meant an unstable community. The Euclidean distance (d) between the intersection coordinates and the stable point coordinates indicates the community stability status.
All data analysis was performed using R 4.1.3 and Excel 2016; α diversity was calculated using the “vegan” package and plotted with the “ggplot2” package. One-Way ANOVA was used to compare the effects of management intensity and duration on vegetation community α diversity, and LSD tests were performed on the diversity of vegetation community α for each forest stand. Differences in the β diversity of vegetation communities in various stands were compared through primary coordinate analysis (PCoA). The “adonis” function in the “vegan” package was used to perform permutational multivariate analysis of variance (PerMANOVA) for the composition of plant communities in the tree, shrub, and herbaceous layers. For PerMANOVA analysis, the Bray-Curtis difference matrix was used to summarize the species composition, with 999 permutation tests to determine statistical significance. Finally, linear fitting was employed to observe the coupling relationship between α diversity and community stability for each forest layer.

3. Results

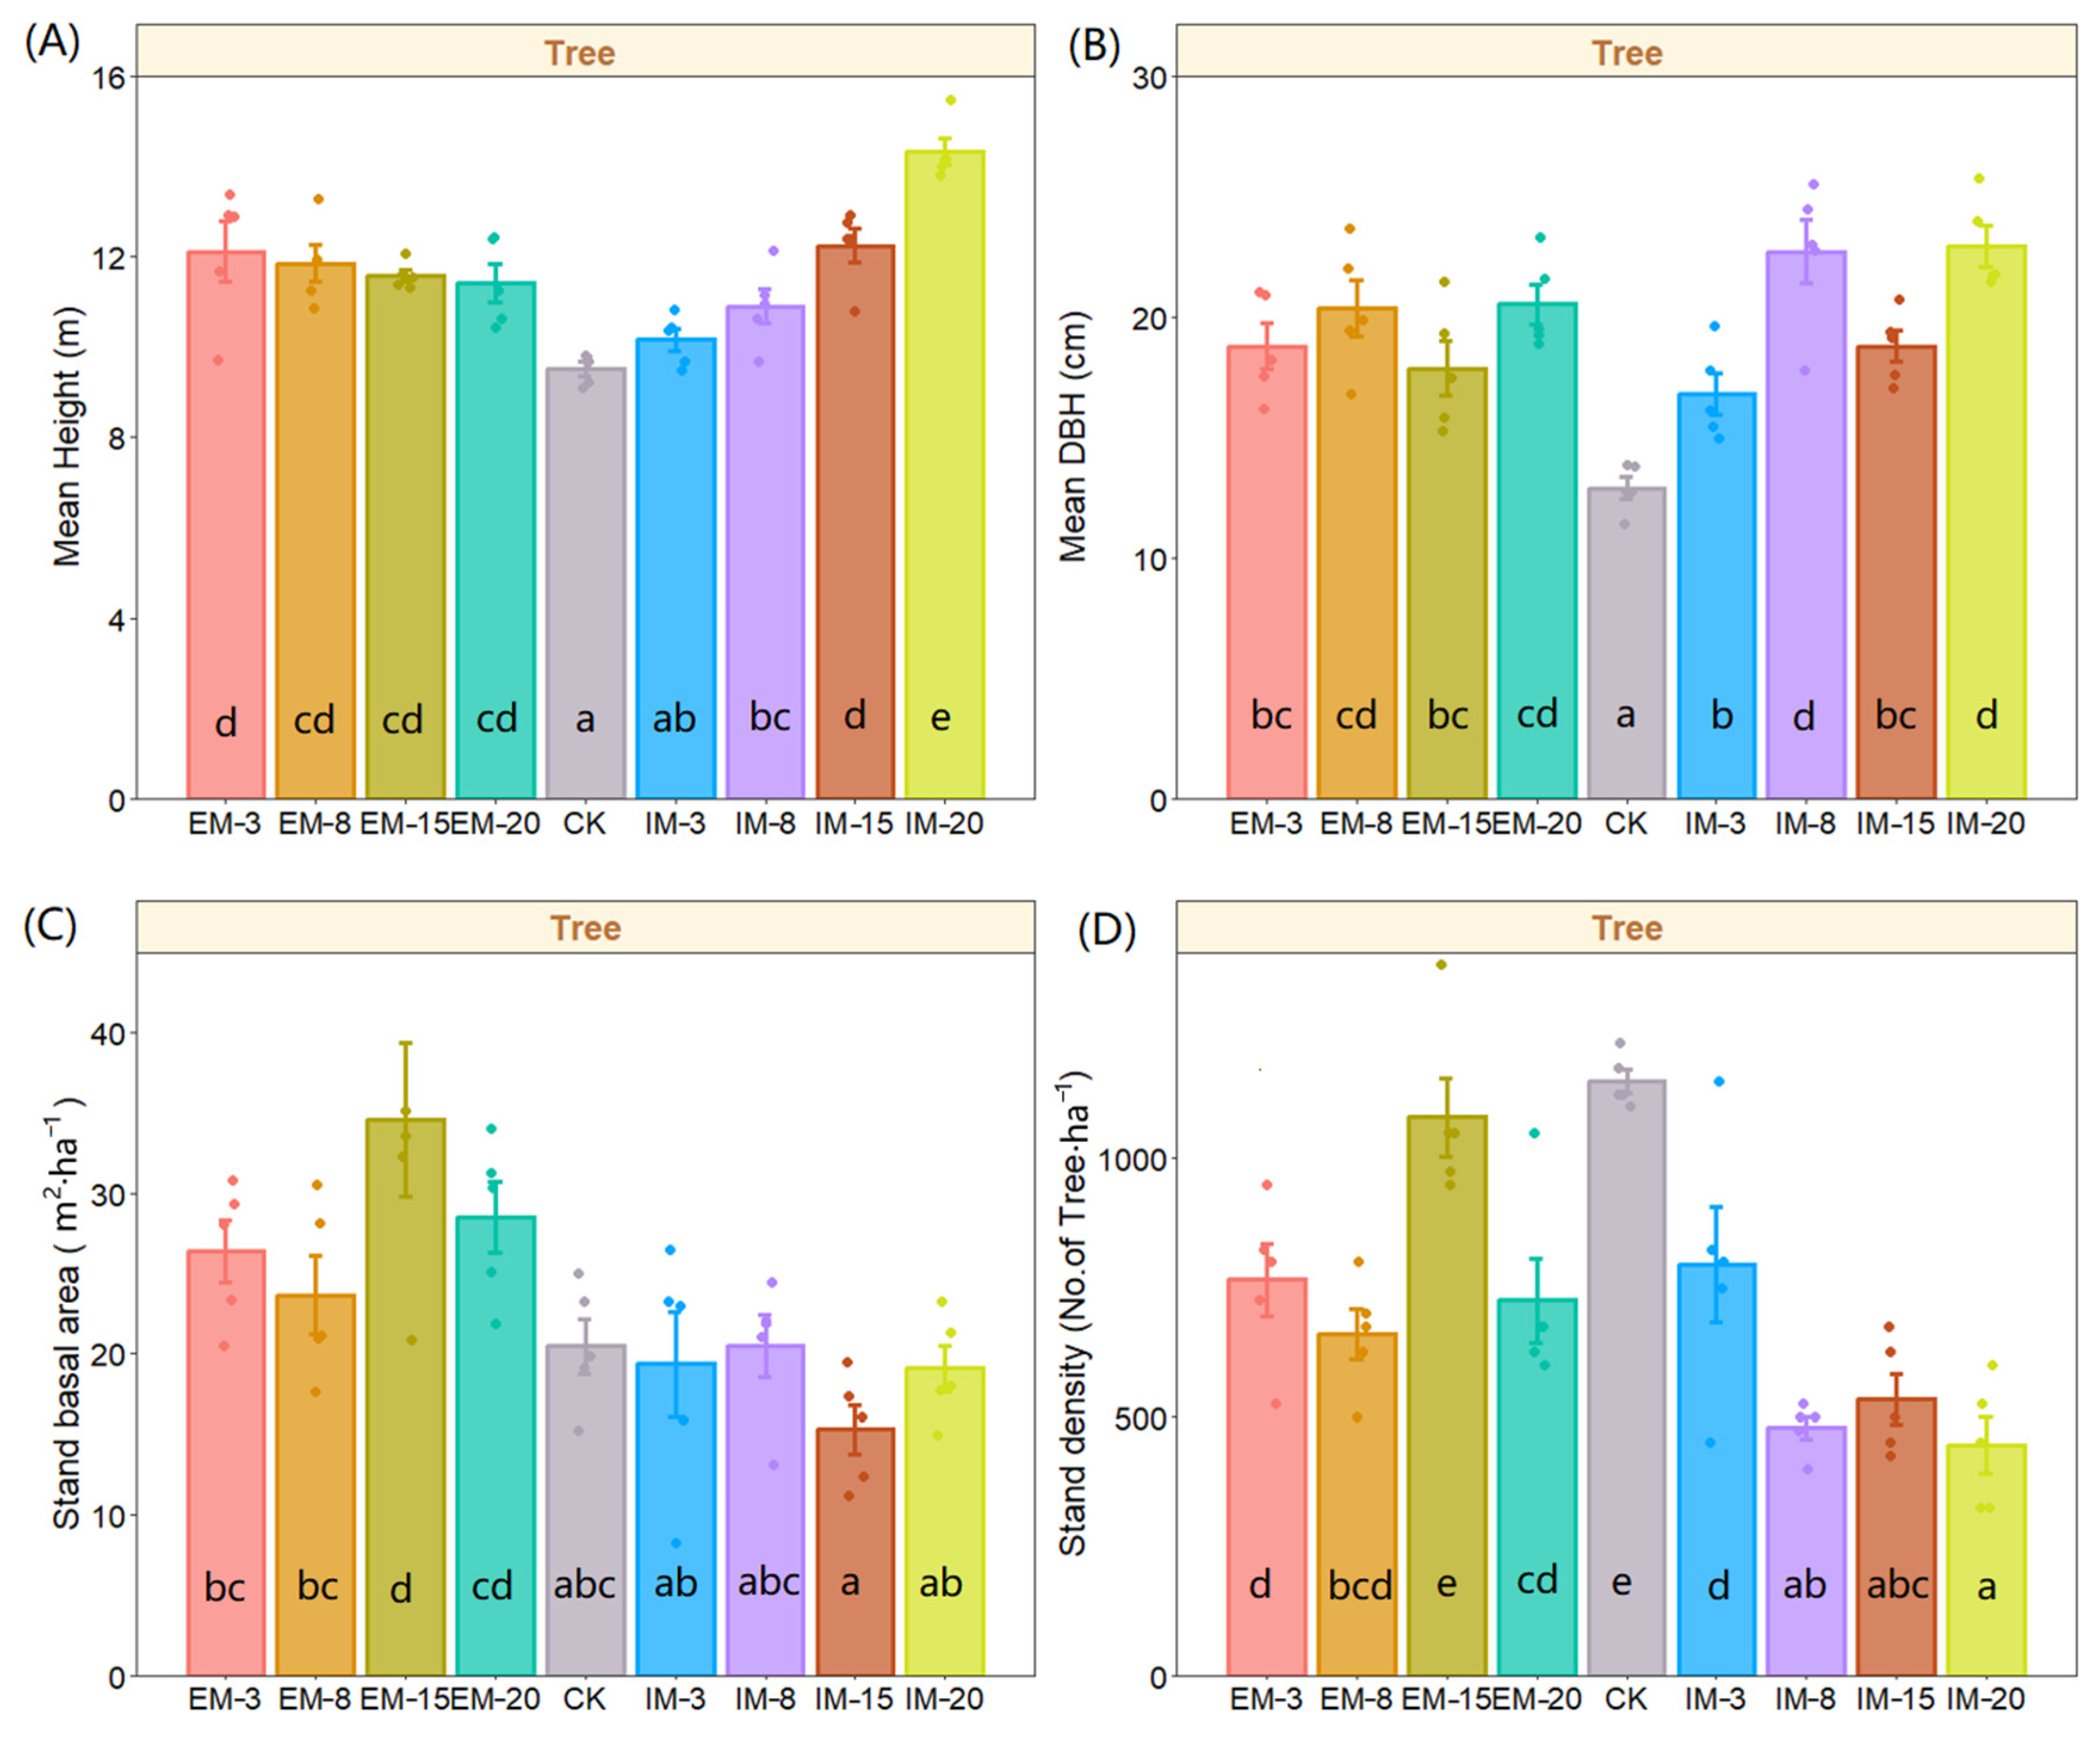
3.1. Effects on Stand Characteristics

The management intensity and duration had significant impacts on the stand characteristics of the natural secondary Carya dabieshanensis forest (Table 1). Multiple comparisons revealed that the mean breast diameter and average tree height of the forest stands increased significantly following management measures (p < 0.05). However, the average density of the forest stands was generally lower than that of CK (Figure 2). There were no significant differences in the average breast-height diameters of Carya dabieshanensis stands under different operating intensities during the same operational timeframe. The average tree height of Carya dabieshanensis forests under intensive management increased with prolonged management duration. After 20 years of intensive management, it was significantly higher than that of the average tree height under the extensive management model (21.35%). The stand basal area and stand density of extensively managed forests were almost all higher than those of intensively managed forests for the same management duration.

3.2. Effects on the α Diversity Index of Species for Each Forest Layer

The management intensity and duration significantly impacted the diversity of vegetation community species (Table 2, Figure 3). The α diversity of species in each forest layer was significantly lower than that of CK (p < 0.05) under the two management intensities. The diversity and richness indices gradually decreased with management duration, but increased under extensive management. Under intensive management, the community species diversity decreased sharply and remained at a low level for a prolonged period. The diversity of vegetation community species dropped to similarly low levels under both management intensities 20 years after the onset of management activities. Compared with CK, after 20 years of extensive and intensive management, the diversity, dominance, evenness, and richness indices of vegetation communities decreased by 53.37%–62.77%, 46.04%–59.17%, 32.58%–53.55%, and 50.18%–51.30%, respectively.
The α diversity of species in the various vegetation layers of the Carya dabieshanensis forest was significantly affected by the management intensity and duration (Table 3). Compared with CK, regardless of the management mode, subversive changes in the vegetation species diversity of the tree layer occurred. Of these, changes in the species diversity of the tree layer under intensive management was the most significant (p < 0.05), where the management behavior led to a sharp decline in species diversity (Figure 4). The species diversity of the shrub layer under different management durations varied under the two management intensities. It was worthy of note that in the early stages of extensive management (EM-3 and EM-8), the species diversity, dominance, and richness indices of the shrub layer were significantly higher than those for CK. Furthermore, the diversity and richness indices of the extensively managed forests were significantly higher than those of the intensively managed forests under the same management durations. Compared with CK, there were no significant changes in the diversity of the shrub layer species at the onset of intensive management (save for the richness index). Variations in the α diversity of herbaceous vegetation species with management duration were essentially identical under the two management intensities. The diversity of the herbaceous layer species increased three years following the initiation of management activities, albeit they decreased steadily under prolonged management duration. In general, higher management intensities accelerated this change.

3.3. Effects on Species β Diversity at All Levels

The results of nonparametric multivariate variance analysis (perMANOVA) based on a distance matrix indicated that for distinct tree species, there were significant differences in the composition of plant species in the tree (p < 0.001), shrub (p < 0.001), and herbaceous (p < 0.001) layers of natural secondary Carya dabieshanensis forests in the Dabie Mountains under different management intensities and durations (Table 4).
The results of a post-hoc comparisonsof species composition of the forest layers of different forest stands revealed that management activities led to significant differences between the compositions of vegetation community species and CK in each forest layer (p < 0.05). Except for the early stages of management (EM-3 and IM-3), there were significant differences in the species composition of the tree layers under different management intensities and the same management periods (p < 0.05) (Table S2). The species compositions of the shrub and herbaceous community layers obviously changed, and there were significant differences between them across the nine different stands (p < 0.05). This indicated that changes in the management intensity and duration altered the compositions of shrub and herbaceous community species layers to some extent.
The results of principal coordinate analysis (PCoA) revealed that the cumulative explanation rate of the differences in community species composition in the tree layer under different management intensities and durations was 74.52%. The species composition of the CK in the tree layer differed significantly from that of the other stands, which also implied that management behavior had a strong influence on the species composition of the tree layer (Figure 5). The interpretation rates of the shrub and herbaceous layers were lower in the first two axes (31.8% and 43.3%, respectively), which indicated that the species composition of the shrub and herb layer in each stand remained uncertain, even under the same management intensity and duration. Within the 95% confidence interval, the distance between the stands under intensive and extensive management gradually increased with prolonged management. Based on the differences in species composition between stands (Table S2), the succession direction of community structures and the dominant species of each community was differentiating.

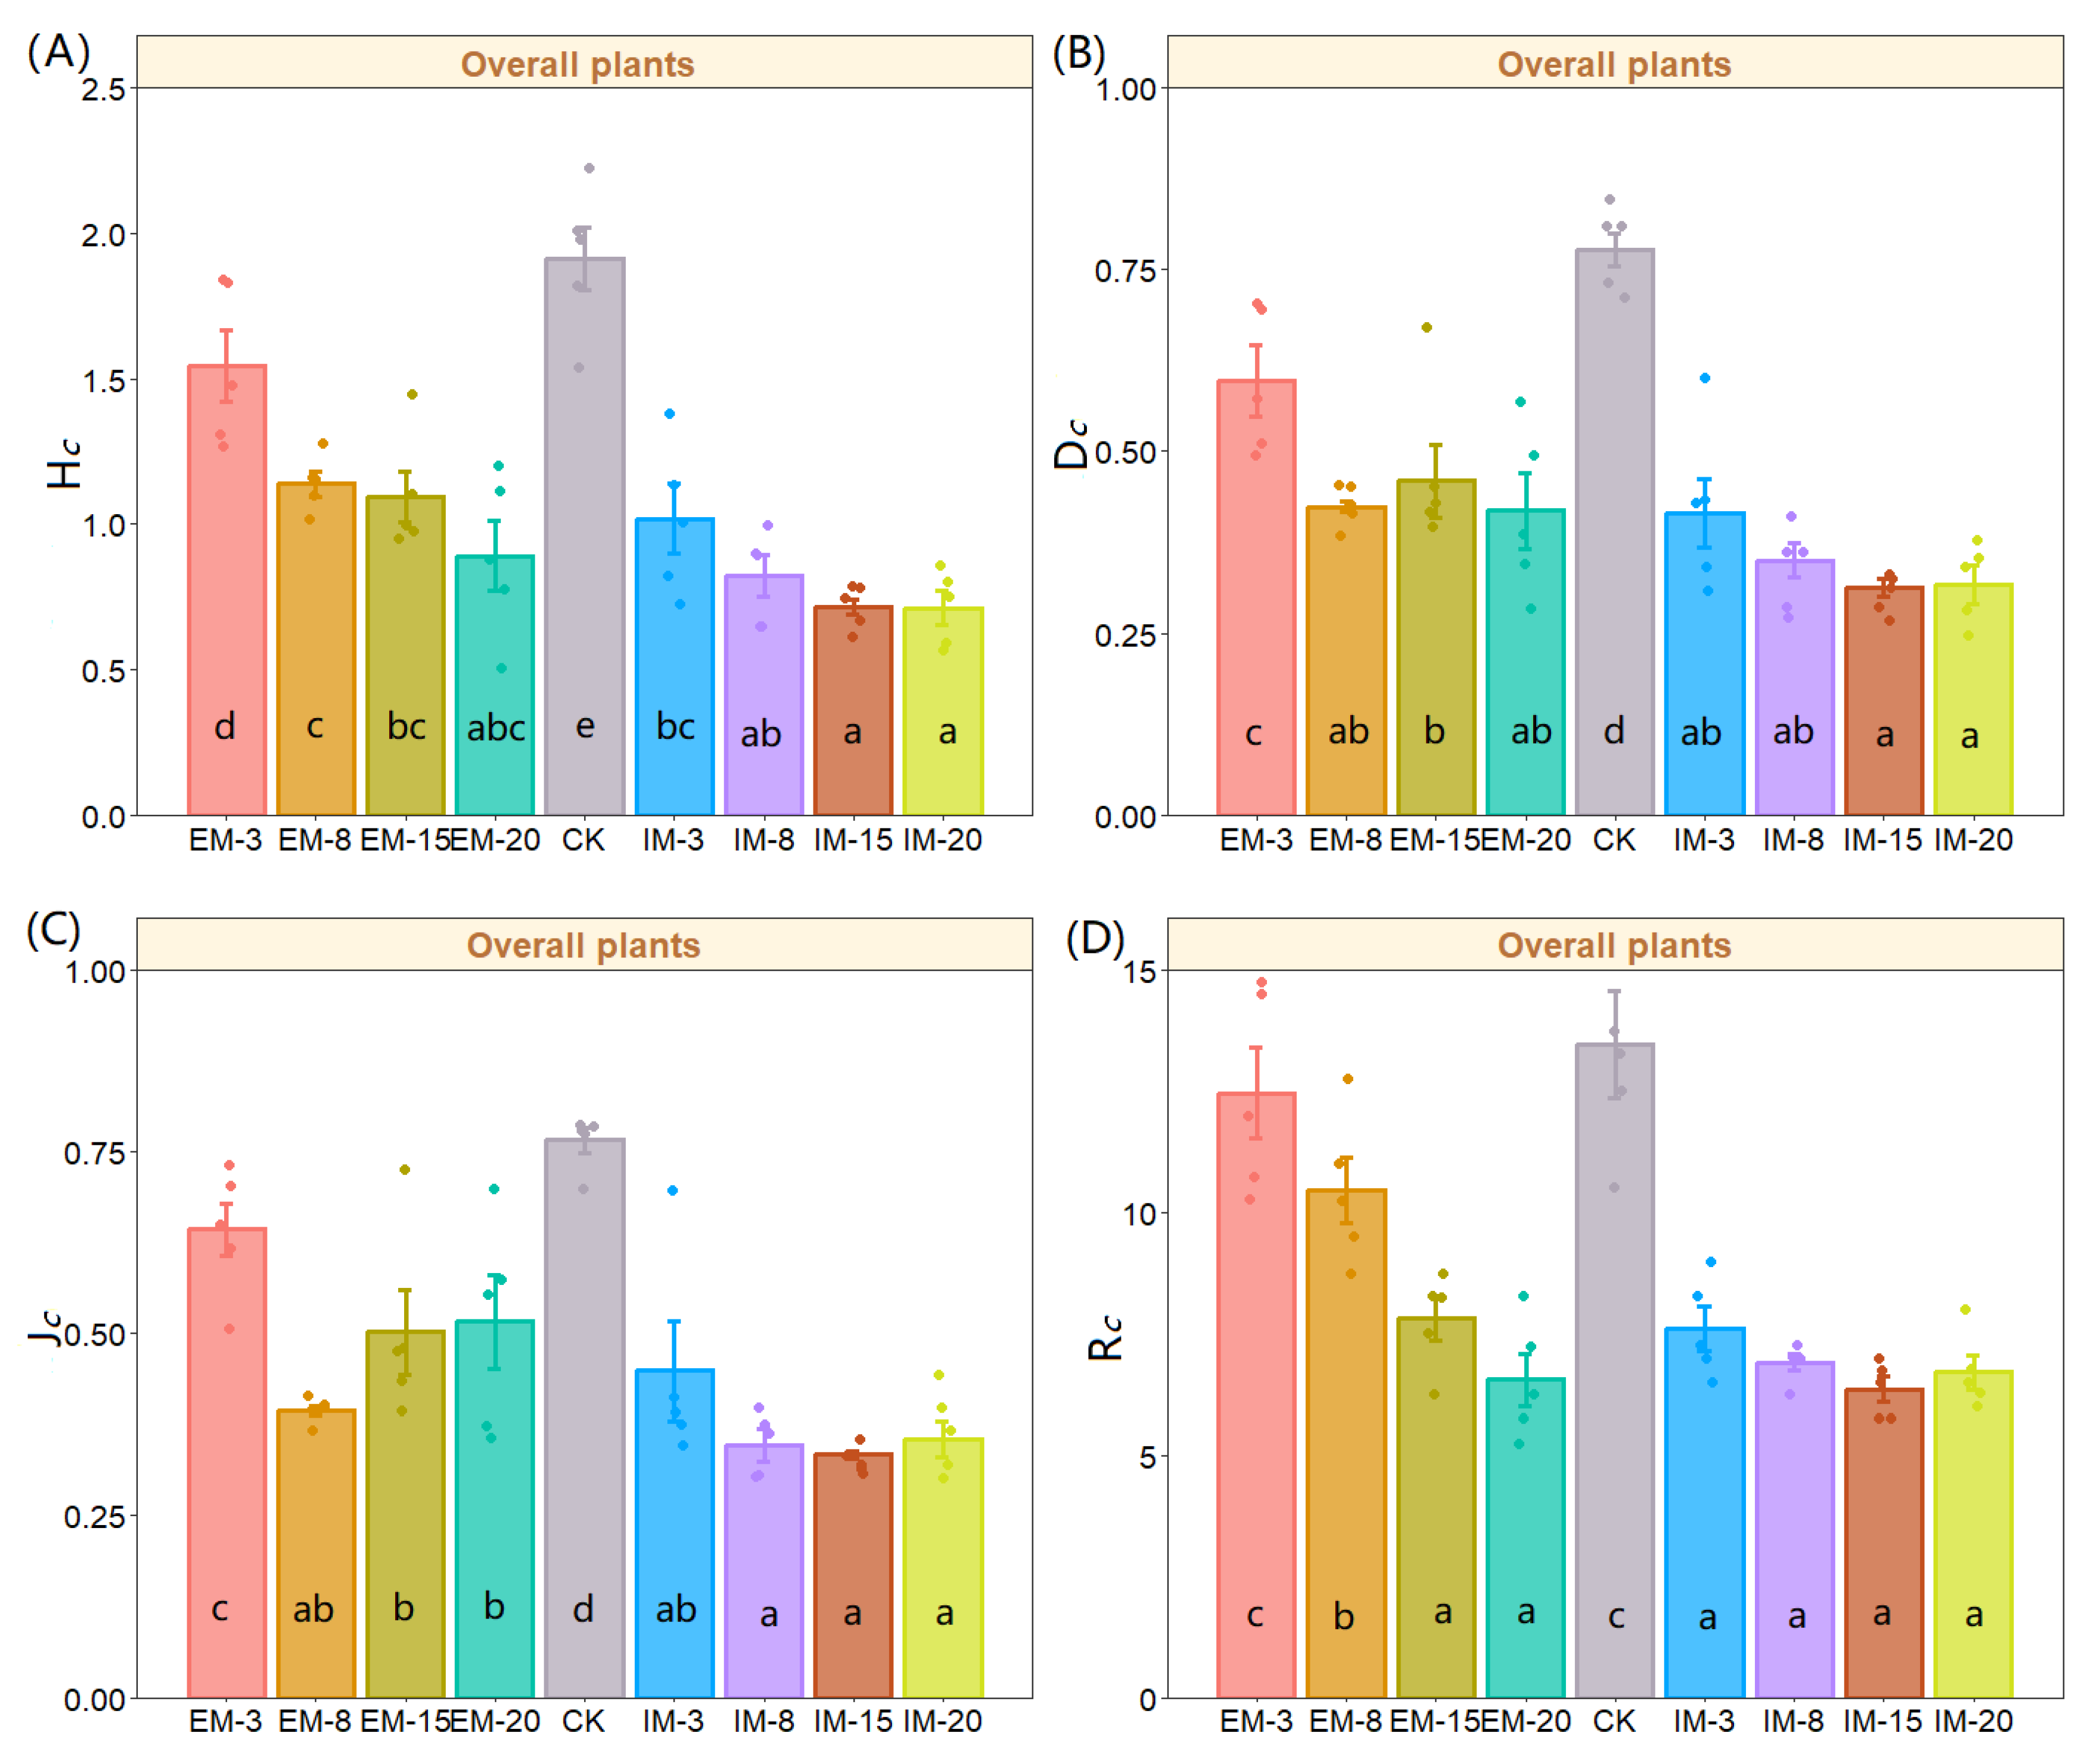
3.4. Effects on Community Stability

The Euclidean distance (d) between the model crossover point (x, y) and the ideal stable point (20, 80) varied under different management intensities and durations (Figure 6). The model intersection of the CK vegetation community was closest to the stable point (d = 12.841), followed by EM-20 (d = 13.138). The model intersections of all forest stands with management activities were different degrees distant from the stable point (Table 5). The degrees of stability of the stand vegetation communities were as follows: CK > EM-20 > IM-20> IM-8 > EM-3 > IM-15 > EM-15 > IM-3 > EM-8. In this study, continuous forest management activities led to a general decrease in the stability of vegetation communities. Compared with CK, the damage to community stability in the early stages of management activities was more serious. It is worth noting that no changes in vegetation community stability correlated with management intensity and duration were found in the nine stands under study.

4. Discussion

4.1. Vegetation Community Species Diversity

The versatility and ecosystem services of forest ecosystems benefit from the high biodiversity of vegetation communities [36]. Many studies have shown that anthropogenic forest management activities are the key factor that affects vegetation community species diversity and succession [37,38]. Contingent on multiple factors, including management objectives, location, intensity, and duration, some forests will exhibit a significant decline in species diversity following disturbances. However, they can recover over a relatively short period, or even become more robust. Other forests do not fully recover, as the disturbances may be too strong or last too long, which leads to a sharp decline in community species diversity [39,40].
In this study, vegetation community species diversity reflected different changes following the occurrence of forest management activities and was lower than CK regardless of the management intensity and duration. It was clear that management practices such as deforestation, understory vegetation removal, and fertilization led to the decline or even loss of certain species in the area. However, under lower management intensity (extensive management), the diversity of vegetation community species slowly and steadily decreased (Figure 3). Intensive management led to a rapid decline in vegetation community species diversity, but it remained relatively stable at a low level over a long period of time, which was consistent with the results of other studies [2,41]. According to Hrivnak [42], the competition between plants for soil and light resources is the main driving force that modifies plant species diversity and composition. The felling of miscellaneous trees other than Carya dabieshanensis will lead to a sharp decrease in the species diversity of the tree layer. Nevertheless, these trees will provide light and soil resources for the shrub and herbaceous layers, and some sun-loving herbs and shrubs may develop. Changes in the forest canopy drives the diversity of herb and shrub species in the early stages of management, which does not decrease or even increases [43,44]. However, under prolonged forest management, several neutral or shade-loving herbs will gradually withdraw from the community, leading to a steady decline in species richness (Figure 4).
Although the understory vegetation (herb and shrub layers) was cleared with equal intensity, the changes in species richness varied between the shrub and herb layers, which may have been attributable to variations in their capacities to self-recover. Herbaceous plants have a robust vitality and can restore coverage in a short time after being disturbed. The capacity of shrubs to recover was not as good as that of herbs, where continuous logging compressed their habitat, which led to a more rapid decline in the richness and species diversity of the shrub layer in contrast to the herb layer [45]. Several studies have suggested that community species diversity generally decreases with the greater intensity and frequency of disturbances [42,46]. Denser understory vegetation clearance in intensively managed forests accelerated species replacement in vegetation communities. Fertilization increased the competition for nutrients between species, which further intensified the competitiveness of dominant species between populations. This eventually led to the long-term supremacy of some dominant species in the shrub and herbaceous layers [45]. Furthermore, it has been suggested that structural changes in the tree layer will affect soil porosity, soil nutrients, and surface runoff to indirectly affect the diversity of community species [2,47]. Consequently, further attention is warranted to learn whether changes in the soil characteristics of forest lands under different management intensities and durations drive those of species diversity in the vegetation communities of Carya dabieshanensis forests.

4.2. Vegetation Community Stability

The stability of forest ecosystem communities is generally considered as a key indicator of community anti-interference ability and resilience [48,49]. The relationship between community stability and species diversity has always been controversial. Many early researchers believed that species diversity had a positive impact on vegetation community stability, where the higher the species richness the stronger the community stability. This was purported to be because increased species diversity made the energy flows and material circulation in the community more complex [50,51,52]. However, a growing body of research has revealed that community diversity and stability are not simply positively correlated, as complex interspecific relationships may be more unstable than simple systems [7,53,54]. Studies have revealed that the influence of species dominance on community stability is greater than the number of species. This phenomenon is attributed to the uneven contribution of each species to community stability, where the increase in the number of species does not necessarily promote community stability [13,55]. Pillar’s [56] research showed that the maintenance effect of species diversity on community stability derived from the insurance effect of functional redundancy. The spatial stability of plant communities is closely related to the supply capacity of land resources, while community functional redundancy is correlated with community stability, but not species diversity or redundancy [57].
In this study, changes in species diversity did not have a significant impact on community stability, and continuous forest management led to a steady decline in species diversity; however, this was not consistent with the changes in community stability. Species diversity and community stability were also inconsistent between different forest layers (Figure 7). Community stability was weakly negatively correlated with α diversity in the shrub and herbaceous layers, but weakly positively correlated with α diversity in the tree layer. However, the ecological mechanisms behind this phenomenon are not well understood; thus, we suspected that this may have been related to the uncertainty of interspecific relationships. Some scholars believe that community stability is primarily determined by the proportion of dominant species in the community, and to a lesser extent is affected by the species richness [58]. The long-term natural succession of stands in unmanaged forests has kept the dominant species in the community relatively stable for a long time, where human management activities have once again upset this balance. In new vegetation communities, the increased complexity of interspecific relationships leads to more intense interspecific competition, which results in unstable communities [59]. As the dominant population of community succession gradually dominates and remains relatively constant, community stability is improved; thus, there is no diversity–stability relationship. In this study, except for CK, the other stands were practically single species forests, where the relationship between species diversity and community stability in the tree layer confirmed that mixed forests had higher stability than single species stands [52,60].

5. Conclusions

By studying the species diversity and stability of vegetation communities in natural secondary Carya dabieshanensis forests under different management intensities and durations, we were able to draw the following conclusions:
  • Long-term forest management led to a continuous decline in species diversity in the plant communities of natural secondary forests in Dashan Mountain, which was expedited compared with intensive management. Community species diversity at both management intensities generally stabilized after 15 years, which did not align with our first hypothesis.
  • Since there was no evidence that community species diversity translated to community stability, and intensive management did not lead to lower community stability under the same management durations, we rejected Hypotheses 2 and 3.
Finally, we believed that forest management activities would lead to a decline in community species diversity, although this did not reduce community stability. In this area, more attention may be required to focus on the coupling mechanism of community functional diversity and community stability and the driving role of the microenvironment on biodiversity and community stability. We recommend that operators appropriately retain or replant additional tree species to improve the species richness of the tree layer, which may be conducive to improving stand structures and community stability.

Supplementary Materials

The following supporting information can be downloaded at: https://www.mdpi.com/article/10.3390/f14071331/s1, Table S1: Study site data; Table S2: Comparison of species composition of various forest layers under different management intensities and durations.

Author Contributions

Conceptualization, H.L. and S.F.; methodology, C.H.; software, C.H. and C.F.; formal analysis, Y.M.; investigation, Y.T. and X.M.; resources, H.L. and S.F.; data curation, F.Y.; writing—original draft preparation, C.H.; writing—review and editing, S.F.; visualization, C.H.; supervision, H.L. All authors have read and agreed to the published version of the manuscript.

Funding

This research was funded by Natural Science Foundation of Anhui Province (grant number 2108085MC110); Key Research Program of Anhui Provincial Department of Education (grant number KJ2019A0218, KJ2021A1100); and Special Major Science and Technology Project of Anhui Province (202103a06020007).

Data Availability Statement

Not applicable.

Acknowledgments

We thank Bihai Zhan (Forest Station of Guanmiao Township), Longlong Fu, Yuanhai Zhang (Forestry Administration of Jinzhai County), Xiaoxiang Ma, Xiaoliang Ren, Xinxin Tian, and Yuuhua Wu (Anhui Agricultural University) for their support in the collection of field data.

Conflicts of Interest

The authors declare no conflict of interest.

References

  1. Vellend, M.; Baeten, L.; Becker-Scarpitta, A.; Boucher-Lalonde, V.; McCune, J.L.; Messier, J.; Myers-Smith, I.H.; Sax, D.F. Plant Biodiversity Change Across Scales During the Anthropocene. Annu. Rev. Plant Biol. 2017, 68, 563–586. [Google Scholar] [CrossRef] [PubMed] [Green Version]
  2. Wu, Z.L.; Zhou, C.J.; Zhou, X.N.; Hu, X.S.; Gan, J.B. Variability after 15 Years of Vegetation Recovery in Natural Secondary Forest with Timber Harvesting at Different Intensities in Southeastern China: Community Diversity and Stability. Forests 2018, 9, 16. [Google Scholar] [CrossRef] [Green Version]
  3. Chen, X.; Taylor, A.R.; Reich, P.B.; Hisano, M.; Chen, H.Y.H.; Chang, S.X. Tree diversity increases decadal forest soil carbon and nitrogen accrual. Nature 2023, 618, 94–101. [Google Scholar] [CrossRef] [PubMed]
  4. Kermavnar, J.; Eler, K.; Marinsek, A.; Kutnar, L. Post-harvest forest herb layer demography: General patterns are driven by pre-disturbance conditions. For. Ecol. Manag. 2021, 491, 13. [Google Scholar] [CrossRef]
  5. Chen, C.; Chen, H.Y.H.; Chen, X.; Huang, Z. Meta-analysis shows positive effects of plant diversity on microbial biomass and respiration. Nat. Commun. 2019, 10, 1332. [Google Scholar] [CrossRef] [Green Version]
  6. MacDonald, R.L.; Chen, H.Y.H.; Bartels, S.F.; Palik, B.J.; Prepas, E.E. Compositional stability of boreal understorey vegetation after overstorey harvesting across a riparian ecotone. J. Veg. Sci. 2015, 26, 733–741. [Google Scholar] [CrossRef]
  7. Vakili, M.; Shakeri, Z.; Motahari, S.; Farahani, M.; Robbins, Z.J.; Scheller, R.M. Resistance and Resilience of Hyrcanian Mixed Forests Under Natural and Anthropogenic Disturbances. Front. For. Glob. Change 2021, 4, 14. [Google Scholar] [CrossRef]
  8. Ouyang, S.; Xiang, W.; Gou, M.; Chen, L.; Lei, P.; Xiao, W.; Deng, X.; Zeng, L.; Li, J.; Zhang, T.; et al. Stability in subtropical forests: The role of tree species diversity, stand structure, environmental and socio-economic conditions. Glob. Ecol. Biogeogr. 2020, 30, 500–513. [Google Scholar] [CrossRef]
  9. Forrester, D.I.; Rodenfels, P.; Haase, J.; Hardtle, W.; Leppert, K.N.; Niklaus, P.A.; von Oheimb, G.; Scherer-Lorenzen, M.; Bauhus, J. Tree-species interactions increase light absorption and growth in Chinese subtropical mixed-species plantations. Oecologia 2019, 191, 421–432. [Google Scholar] [CrossRef] [PubMed]
  10. Mazzochini, G.G.; Fonseca, C.R.; Costa, G.C.; Santos, R.M.; Oliveira, A.T.; Ganade, G. Plant phylogenetic diversity stabilizes large-scale ecosystem productivity. Glob. Ecol. Biogeogr. 2019, 28, 1430–1439. [Google Scholar] [CrossRef]
  11. Esquivel-Muelbert, A.; Baker, T.R.; Dexter, K.G.; Lewis, S.L.; Brienen, R.J.W.; Feldpausch, T.R.; Lloyd, J.; Monteagudo-Mendoza, A.; Arroyo, L.; Alvarez-Davila, E.; et al. Compositional response of Amazon forests to climate change. Glob. Change Biol. 2019, 25, 39–56. [Google Scholar] [CrossRef] [Green Version]
  12. Dolezal, J.; Fibich, P.; Altman, J.; Leps, J.; Uemura, S.; Takahashi, K.; Hara, T. Determinants of ecosystem stability in a diverse temperate forest. Oikos 2020, 129, 1692–1703. [Google Scholar] [CrossRef]
  13. Jiang, L.M.; Sattar, K.; Lu, G.H.; Hu, D.; Zhang, J.; Yang, X.D. Different contributions of plant diversity and soil properties to the community stability in the arid desert ecosystem. Front. Plant Sci. 2022, 13, 969852. [Google Scholar] [CrossRef] [PubMed]
  14. Yuan, L.; Gao, Y.; Mei, Y.; Liu, J.; Kalkhajeh, Y.K.; Hu, H.; Huang, J. Effects of continuous straw returning on bacterial community structure and enzyme activities in rape-rice soil aggregates. Sci. Rep. 2023, 13, 2357. [Google Scholar] [CrossRef] [PubMed]
  15. Ali, A.; Yan, E.R. The mediation roles of intraspecific and interspecific functional trait diversity for linking the response of aboveground biomass to species richness across forest strata in a subtropical forest. Ecol. Indic. 2018, 85, 493–501. [Google Scholar] [CrossRef]
  16. Thom, D.; Seidl, R. Natural disturbance impacts on ecosystem services and biodiversity in temperate and boreal forests. Biol. Rev. Camb. Philos. Soc. 2016, 91, 760–781. [Google Scholar] [CrossRef] [PubMed]
  17. Su, X.; Zheng, G.; Chen, H.Y.H. Understory diversity are driven by resource availability rather than resource heterogeneity in subtropical forests. For. Ecol. Manag. 2022, 503, 9. [Google Scholar] [CrossRef]
  18. Tsai, H.-C.; Chiang, J.-M.; McEwan, R.W.; Lin, T.-C. Decadal effects of thinning on understory light environments and plant community structure in a subtropical forest. Ecosphere 2018, 9, 14. [Google Scholar] [CrossRef] [Green Version]
  19. Freeman, J.E.; Jose, S. The role of herbicide in savanna restoration: Effects of shrub reduction treatments on the understory and overstory of a longleaf pine flatwoods. For. Ecol. Manag. 2009, 257, 978–986. [Google Scholar] [CrossRef]
  20. Nobilly, F.; Atikah, S.N.; Yahya, M.S.; Jusoh, S.; Cun, G.S.; Norhisham, A.R.; Tohiran, K.A.; Zulkifli, R.; Azhar, B. Rotational cattle grazing improves understory vegetation biodiversity and structural complexity in oil palm plantations. Weed Biol. Manage. 2022, 22, 13–26. [Google Scholar] [CrossRef]
  21. Hou, X.Y.; Liu, S.L.; Cheng, F.Y.; Su, X.K.; Dong, S.K.; Zhao, S.; Liu, G.H. Variability of environmental factors and the effects on vegetation diversity with different restoration years in a large open-pit phosphorite mine. Ecol. Eng. 2019, 127, 245–253. [Google Scholar] [CrossRef]
  22. Koncz, P.; Vadasz-Besnyoi, V.; Csatho, A.I.; Nagy, J.; Szerdahelyi, T.; Toth, Z.; Pinter, K.; Foti, S.; Papp, M.; Balogh, J.; et al. Carbon uptake changed but vegetation composition remained stable during transition from grazing to mowing grassland management. Agric. Ecosyst. Environ. 2020, 304, 11. [Google Scholar] [CrossRef]
  23. Braun, A.C.; Koch, B. Estimating impacts of plantation forestry on plant biodiversity in southern Chile-a spatially explicit modelling approach. Environ. Monit. Assess. 2016, 188, 564. [Google Scholar] [CrossRef]
  24. Medina, O.; Manian, V.; Chinea, J.D. Biodiversity assessment using hierarchical agglomerative clustering and spectral unmixing over hyperspectral images. Sensors 2013, 13, 13949–13959. [Google Scholar] [CrossRef] [Green Version]
  25. Medeiros, H.R.; Torezan, J.M. Evaluating the ecological integrity of Atlantic forest remnants by using rapid ecological assessment. Environ. Monit. Assess. 2013, 185, 4373–4382. [Google Scholar] [CrossRef]
  26. Ngo Bieng, M.A.; Delgado-Rodriguez, D.; Vilchez-Mendoza, S.; Lopez-Sampson, A.; Garcia, E.; Sepulveda, N.; Somarriba, E. Tree diversity in a tropical agricultural-forest mosaic landscape in Honduras. Sci. Rep. 2022, 12, 18544. [Google Scholar] [CrossRef] [PubMed]
  27. Godron, M. Some aspects of heterogeneity in grasslands of Cantal. Stat. Ecol. 1972, 3, 397–415. [Google Scholar]
  28. Dovciak, M.; Halpern, C.B. Positive diversity-stability relationships in forest herb populations during four decades of community assembly. Ecol. Lett. 2010, 13, 1300–1309. [Google Scholar] [CrossRef] [PubMed]
  29. Li, J.; Zeng, Y.; Shen, D.; Xia, G.; Huang, Y.; Huang, Y.; Chang, J.; Huang, J.; Wang, Z. Development of SSR Markers in Hickory (Carya cathayensis Sarg.) and Their Transferability to Other Species of Carya. Curr. Genom. 2014, 15, 357–379. [Google Scholar] [CrossRef] [PubMed] [Green Version]
  30. Huang, C.; Fu, S.; Ma, X.; Ma, X.; Ren, X.; Tian, X.; Tong, Y.; Yuan, F.; Liu, H. Long-term intensive management reduced the soil quality of a Carya dabieshanensis forest. Sci. Rep. 2023, 13, 5058. [Google Scholar] [CrossRef]
  31. Ni, H.J.; Su, W.H.; Fan, S.H.; Chu, H.Y. Effects of intensive management practices on rhizosphere soil properties, root growth, and nutrient uptake in Moso bamboo plantations in subtropical China. For. Ecol. Manag. 2021, 493, 11. [Google Scholar] [CrossRef]
  32. Li, Y.F.; Zhang, J.J.; Chang, S.X.; Jiang, P.K.; Zhou, G.M.; Shen, Z.M.; Wu, J.S.; Lin, L.; Wang, Z.S.; Shen, M.C. Converting native shrub forests to Chinese chestnut plantations and subsequent intensive management affected soil C and N pools. For. Ecol. Manag. 2014, 312, 161–169. [Google Scholar] [CrossRef]
  33. Das, D.; Dwivedi, B.S.; Datta, S.P.; Datta, S.C.; Meena, M.C.; Dwivedi, A.K.; Singh, M.; Chakraborty, D.; Jaggi, S. Long-term differences in nutrient management under intensive cultivation alter potassium supplying ability of soils. Geoderma 2021, 393, 16. [Google Scholar] [CrossRef]
  34. Tie-Liang, S.; Feng, Z.; Jin-Tun, Z. Plant diversity of forest community in zhuweigou of lishan mountain nature reserve. Chin. J. Plant Ecol. 2002, 26, 46–51. (In Chinese) [Google Scholar]
  35. Wu, Z.-l.; Zhou, X.-n.; Zheng, L.-f.; Hu, X.-s.; Zhou, C.-j. Species diversity and stability of natural secondary communities with different cutting intensities after ten years. J. For. Res. 2011, 22, 205–208. [Google Scholar] [CrossRef]
  36. Norden, N.; Chazdon, R.L.; Chao, A.; Jiang, Y.H.; Vilchez-Alvarado, B. Resilience of tropical rain forests: Tree community reassembly in secondary forests. Ecol. Lett. 2009, 12, 385–394. [Google Scholar] [CrossRef]
  37. Thorn, S.; Bassler, C.; Svoboda, M.; Muller, J. Effects of natural disturbances and salvage logging on biodiversity–Lessons from the Bohemian Forest. For. Ecol. Manag. 2017, 388, 113–119. [Google Scholar] [CrossRef]
  38. Walter, C.A.; Adams, M.B.; Gilliam, F.S.; Peterjohn, W.T. Non-random species loss in a forest herbaceous layer following nitrogen addition. Ecology 2017, 98, 2322–2332. [Google Scholar] [CrossRef] [PubMed] [Green Version]
  39. Cole, E.; Newton, M.; Bailey, J.D. Understory vegetation dynamics 15 years post-thinning in 50-year-old Douglas-fir and Douglas-fir/western hemlock stands in western Oregon, USA. For. Ecol. Manag. 2017, 384, 358–370. [Google Scholar] [CrossRef] [Green Version]
  40. Zheng, Y.; Fan, S.; Guan, F.; Xia, W.; Wang, S.; Xiao, X. Strip Clearcutting Drives Vegetation Diversity and Composition in the Moso Bamboo Forests. For. Sci. 2022, 68, 27–36. [Google Scholar] [CrossRef]
  41. Li, B.; Zeng, T.; Ran, J.H.; Yue, B.S.; Zhang, M.; Shang, T.; Zhu, D.H. Characteristics of the early secondary succession after landslides in a broad-leaved deciduous forest in the south Minshan Mountains. For. Ecol. Manag. 2017, 405, 238–245. [Google Scholar] [CrossRef]
  42. Hrivnak, R.; Bosela, M.; Slezak, M.; Lukac, M.; Svitkova, I.; Gizela, J.; Hegedusova, K.; Hrivnak, M.; Kliment, J.; Knopp, V.; et al. Competition for soil resources forces a trade-off between enhancing tree productivity and understorey species richness in managed beech forests. Sci. Total Environ. 2022, 849, 157825. [Google Scholar] [CrossRef]
  43. Williams, L.J.; Butler, E.E.; Cavender-Bares, J.; Stefanski, A.; Rice, K.E.; Messier, C.; Paquette, A.; Reich, P.B. Enhanced light interception and light use efficiency explain overyielding in young tree communities. Ecol. Lett. 2021, 24, 996–1006. [Google Scholar] [CrossRef] [PubMed]
  44. Mensah, S.; du Toit, B.; Seifert, T. Diversity-biomass relationship across forest layers: Implications for niche complementarity and selection effects. Oecologia 2018, 187, 783–795. [Google Scholar] [CrossRef] [PubMed]
  45. Kitagawa, R.; Ueno, M.; Masaki, T. Initial effects of thinning and concomitant disturbance on the understory woody community in Japanese cedar plantation. J. For. Res. 2018, 23, 120–128. [Google Scholar] [CrossRef]
  46. Monarrez-Gonzalez, J.C.; Gonzalez-Elizondo, M.S.; Marquez-Linares, M.A.; Gutierrez-Yurrita, P.J.; Perez-Verdin, G. Effect of forest management on tree diversity in temperate ecosystem forests in northern Mexico. PLoS ONE 2020, 15, e0233292. [Google Scholar] [CrossRef]
  47. Zhang, C.; Xie, G.; Fan, S.; Zhen, L. Variation in vegetation structure and soil properties, and the relation between understory plants and environmental variables under different Phyllostachys pubescens forests in southeastern China. Environ. Manag. 2010, 45, 779–792. [Google Scholar] [CrossRef] [PubMed]
  48. Sebald, J.; Thrippleton, T.; Rammer, W.; Bugmann, H.; Seidl, R. Mixing tree species at different spatial scales: The effect of alpha, beta and gamma diversity on disturbance impacts under climate change. J. Appl. Ecol. 2021, 58, 1749–1763. [Google Scholar] [CrossRef]
  49. Gong, C.; Tan, Q.; Liu, G.; Xu, M. Impacts of tree mixtures on understory plant diversity in China. For. Ecol. Manag. 2021, 498, 7. [Google Scholar] [CrossRef]
  50. Tilman, D.; Reich, P.B.; Knops, J.M. Biodiversity and ecosystem stability in a decade-long grassland experiment. Nature 2006, 441, 629–632. [Google Scholar] [CrossRef]
  51. Morin, X.; Fahse, L.; de Mazancourt, C.; Scherer-Lorenzen, M.; Bugmann, H. Temporal stability in forest productivity increases with tree diversity due to asynchrony in species dynamics. Ecol. Lett. 2014, 17, 1526–1535. [Google Scholar] [CrossRef]
  52. Schnabel, F.; Schwarz, J.A.; Danescu, A.; Fichtner, A.; Nock, C.A.; Bauhus, J.; Potvin, C. Drivers of productivity and its temporal stability in a tropical tree diversity experiment. Glob. Change Biol. 2019, 25, 4257–4272. [Google Scholar] [CrossRef] [PubMed]
  53. May, R.M. Stability and Complexity in Model Ecosystems. IEEE Trans. Syst. Man Cybern. 1978, 8, 779. [Google Scholar] [CrossRef]
  54. Jansen, V.A.A.; Kokkoris, G.D. Complexity and stability revisited. Ecol. Lett. 2003, 6, 498–502. [Google Scholar] [CrossRef]
  55. Sasaki, T.; Lauenroth, W.K. Dominant species, rather than diversity, regulates temporal stability of plant communities. Oecologia 2011, 166, 761–768. [Google Scholar] [CrossRef]
  56. Pillar, V.D.; Blanco, C.C.; Muller, S.C.; Sosinski, E.E.; Joner, F.; Duarte, L.D.S. Functional redundancy and stability in plant communities. J. Veg. Sci. 2013, 24, 963–974. [Google Scholar] [CrossRef]
  57. Kang, S.; Ma, W.; Li, F.Y.; Zhang, Q.; Niu, J.; Ding, Y.; Han, F.; Sun, X. Functional Redundancy Instead of Species Redundancy Determines Community Stability in a Typical Steppe of Inner Mongolia. PLoS ONE 2015, 10, e0145605. [Google Scholar] [CrossRef]
  58. Yu, Q.S.; Rao, X.Q.; Chu, C.J.; Liu, S.P.; Lin, Y.B.; Sun, D.; Tan, X.P.; Hanif, A.; Shen, W.J. Species dominance rather than species asynchrony determines the temporal stability of productivity in four subtropical forests along 30 years of restoration. For. Ecol. Manag. 2020, 457, 11. [Google Scholar] [CrossRef]
  59. Allesina, S.; Tang, S. Stability criteria for complex ecosystems. Nature 2012, 483, 205–208. [Google Scholar] [CrossRef] [Green Version]
  60. Guo, Z.W.; Wang, X.P.; Fan, D.Y. Ecosystem functioning and stability are mainly driven by stand structural attributes and biodiversity, respectively, in a tropical forest in Southwestern China. For. Ecol. Manag. 2021, 481, 10. [Google Scholar] [CrossRef]
Figure 1. Location of the study area and experimental design.
Forests 14 01331 g001
Figure 2. Stand characteristics under different management intensities and durations. (A) Mean stand height, (B) mean stand diameter at breast height, (C) stand basal area, (D) stand density. The significance level was p < 0.05; 95% confidence interval for mean. Letters indicate variations between different treatments. EM−3, EM−8, EM−15, EM−20, IM−3, IM−8, IM−15, IM−20, and CK, respectively, represent three years of extensive management, eight years of extensive management, 15 years of extensive management, 20 years of intensive management, three years of intensive management, eight years of intensive management, 15 years of intensive management, 20 years of intensive management, and unmanaged. The same applies below.
Forests 14 01331 g002
Figure 3. Species α diversity of vegetation communities under different management intensities and durations. (A) Overall plant Shannon–Wiener diversity index, (B) overall plant Simpson dominance index, (C) overall plant Pielou evenness index, (D) overall plant Margalef richness index. The significance level was p < 0.05; 95% confidence interval for mean. Letters indicate variations between different treatments.
Forests 14 01331 g003
Figure 4. Species α diversity in various forest layers under different management intensities and durations. (AC) Shannon–Wiener diversity index in each forest layer, (DF) Simpson dominance index in each forest layer, (GI) Pielou evenness index in each forest layer, (JL) Margalef richness index in each forest layer. The significance level was p < 0.05; 95% confidence interval for mean. Letters indicate variations between different treatments.
Forests 14 01331 g004
Figure 5. Species β diversity in various forest layers under different management intensities and durations. (A) Community β diversity in the tree layer, (B) community β diversity in the shrub layer, (C) community β diversity in herbaceous layer.
Forests 14 01331 g005
Figure 6. Changes in vegetation community stability under different management intensities and durations. (A) Community stability in unmanaged forests, (BE) community stability after 3, 8, 15, and 20 y of extensive management, (FI) community stability after 3, 8, 15, and 20 y of intensive management. d, Euclidean distance between the intersection coordinates of the community stability model (x, y) and the ideal stability coordinates (20, 80). Yellow line, ideal stable point coordinates; green line, plot stability point coordinates; red line, the fitted curve of the relative frequency of species accumulation to the inverse of the cumulative total.
Forests 14 01331 g006
Figure 7. Relationships between community stability and species diversity. (A) Relationships between different forest layers and community stability of Shannon–Wiener diversity index, (B) relationships between different forest layers and community stability of Simpson dominance index, (C) relationships between different forest layers and community stability of Pielou evenness index, (D) relationships between different forest layers and community stability of Margalef richness index.
Forests 14 01331 g007
Table 1. Effects of management intensities and durations on Carya dabieshanensis forest characteristics.
dfSum of SquaresMean SquaresFp-Value
Mean tree heightBetween Groups875.2629.40813.287***
(m)Within Groups3625.4890.708
Mean tree DBHBetween Groups8384.05348.00710.596***
(cm)Within Groups36163.0984.531
Stand basal areaBetween Groups81380.824172.6035.211***
(m2 · ha−1)Within Groups361192.49333.125
Stand densityBetween Groups82,452,777.800306,597.20014.256***
(trees · ha−1)Within Groups36774,250.00021,506.940
Note: ***, correlation is significant at the 0.001 level.
Table 2. Effects of management intensities and durations on α diversity of Carya dabieshanensis forest vegetation communities in Dabie Mountains.
dfSum of SquaresMean SquaresFp-Value
Overall plantsHCBetween Groups86.4080.80119.104***
Within Groups361.5090.042
DCBetween Groups80.8880.11116.850***
Within Groups360.2370.007
JCBetween Groups80.8610.10812.945***
Within Groups360.2990.008
RCBetween Groups8295.46136.93319.262***
Within Groups3669.0251.917
Note: ***, correlation is significant at the 0.001 level.
Table 3. Effects of management intensities and durations on α diversity of different forest layers in a Carya dabieshanensis forest.
dfSum of SquaresMean SquaresFp-Value
TreeHBetween Groups812.6431.58024.906***
Within Groups362.2840.063
DBetween Groups82.3950.29919.85***
Within Groups360.5430.015
JBetween Groups82.9000.36316.576***
Within Groups360.7870.022
RBetween Groups8300.17837.52221.647***
Within Groups3662.4001.733
ShrubHBetween Groups88.3011.0388.563***
Within Groups364.3620.121
DBetween Groups80.3790.0473.991**
Within Groups360.4270.012
JBetween Groups80.1440.0182.722*
Within Groups360.2380.007
RBetween Groups8792.40099.0515.477***
Within Groups36230.4006.400
HerbHBetween Groups84.2910.5364.488**
Within Groups364.3020.120
DBetween Groups80.3430.0433.405**
Within Groups360.4530.013
JBetween Groups80.2770.0352.782*
Within Groups360.4480.012
RBetween Groups8470.80058.8509.543***
Within Groups36222.0006.167
Note: H, D, J, and R are the Shannon–Wiener diversity index, Simpson dominance index, Pielou evenness index, and Margalef richness index of tree layer, shrub layer, and herb layer. *, correlation is significant at the 0.05 level; **, correlation is significant at the 0.01 level; ***, correlation is significant at the 0.001 level.
Table 4. Effects of different management intensities and durations on vegetation community compositions.
dfSum of SquaresR2Fp-Value
TreeBetween Groups81.1210.5144.756***
Within Groups361.0600.486
ShrubBetween Groups87.1820.4814.178***
Within Groups367.7350.519
HerbBetween Groups86.9900.5896.460***
Within Groups3611.8601.000
Note: ***, correlation is significant at the 0.001 level.
Table 5. Stability of vegetation communities under different management intensities and durations.
Management Intensity and DurationEquationsR2(x, y)d
CKy = −0.0144 × 2 + 2.17x + 200.961(29.08, 70.93)12.841
EM-3y = −0.0129 × 2 + 2.07x + 16.40.985(31.36, 68.64)16.065
EM-8y = −0.0117 × 2 + 2x + 140.992(32.88, 67.12)18.215
EM-15y = −0.0127 × 2 + 2.08x + 14.30.988(32.06, 67.94)17.055
EM-20y = −0.0148 × 2 + 2.25x + 15.70.986(29.29, 70.71)13.138
IM-3y = −0.00992 × 2 + 1.75x + 21.40.99(32.36, 67.64)17.480
IM-8y = −0.012 × 2 + 1.91x + 22.90.971(30.27, 69.73)14.524
IM-15y = −0.0116 × 2 + 2.93x + 18.70.99(31.73, 68.27)16.589
IM-20y = −0.0106 × 2 + 1.73x + 290.978(29.35, 70.65)13.223
Disclaimer/Publisher’s Note: The statements, opinions and data contained in all publications are solely those of the individual author(s) and contributor(s) and not of MDPI and/or the editor(s). MDPI and/or the editor(s) disclaim responsibility for any injury to people or property resulting from any ideas, methods, instructions or products referred to in the content.

