
The Role of Abrasion Resistance in Determining Suitability of Low-Density Plantation Timber for Engineered Flooring


Abstract
:1. Introduction
2. Materials and Methods
2.1. Material Origins
- Sawmill A provided the timber boards for sawlog E. nitens and regrowth E. obliqua, as well as veneers. E. obliqua is the dominant Eucalyptus species of the three and is marketed as Tasmanian Oak (E. obliqua, E. delegatensis and E. regnans). E. obliqua is commonly used for flooring, and is harvested from native and regenerated forests [22];
- Sawmill B processed the fibre-managed E. nitens boards;
- Sawmill C locally manufactured an E. nitens plywood, which was used as a substrate in one of the engineered flooring prototypes. This prototype included an E. nitens veneer (Sawmill A) on top. The E. nitens veneers were randomly selected from a commercial production line specialised in producing 0.6 mm veneers. In order to understand the potential of using veneers, and to test their performance in flooring and their in-state capabilities, the developed engineered flooring prototype consisted of a 1.2 mm-thick top layer, which was obtained by laminating two 0.6 mm veneers together. The veneers were produced by slicing, and were laminated onto an E. nitens plywood substrate by hot-pressing with a polyvinyl acetate (PVA) glue.
2.2. Abrasion Resistance Test Using Taber Abraser Method
2.3. Statistical Analysis
3. Results and Discussion
4. Conclusions
Author Contributions
Funding
Data Availability Statement
Acknowledgments
Conflicts of Interest
References
- Khademibami, L.; Shmulsky, R.; Snow, D.; Sherrington, A.; Montague, I.; Ross, R.J.; Wang, X. Wear Resistance and Hardness Assessment of Five US Hardwoods for Bridge Decking and Truck Flooring. For. Prod. J. 2022, 72, 8–13. [Google Scholar] [CrossRef]
- Knapic, S.; Machado, J.S.; Pereira, H. Properties of cork oak wood related to solid wood flooring performance. Constr. Build. Mater. 2012, 30, 569–573. [Google Scholar] [CrossRef]
- Németh, R.; Molnárné Posch, P.; Molnár, S.; Bak, M. Performance evaluation of strip parquet flooring panels after long-term, in-service exposure. Drewno 2014, 57, 119–134. [Google Scholar]
- Welzbacher, C.; Brischke, C.; Rapp, A.; Koch, S.; Hofer, S. Performance of thermally modified timber (TMT) in outdoor application–durability, abrasion and optical appearance. Drv. Ind. 2009, 60, 75–82. [Google Scholar]
- Brischke, C.; Ziegeler, N.; Bollmus, S. Abrasion Resistance of Thermally and Chemically Modified Timber. Wood Ind. Drv. Ind. 2019, 70, 71–76. [Google Scholar] [CrossRef]
- Armstrong, F. Timbers for flooring. Forest Product Research. Bulletin 1957, 40, 31. [Google Scholar]
- Harper, F. The abrasion resistance of flooring materials: A review of methods of testing. Wear 1961, 4, 461–478. [Google Scholar] [CrossRef]
- Ohtani, T.; Kamasaki, K.; Tanaka, C. On abrasive wear property during three-body abrasion of wood. Wear 2003, 255, 60–66. [Google Scholar] [CrossRef]
- Youngquist, W.; Munthe, B.P. The Abrasive Resistance of Wood as Determined with the US Navy Wear-Test Machine; U.S. Department of Agriculture Forest Service, Report No. R1732; USDA Forest Service, Forest Products Laboratory: Madison, WI, USA, 1948. [Google Scholar]
- ASTM D 2394; Standard Methods for Simulated Service Testing of Wood and Wood-Base Finish Flooring. American Society for Testing and Materials (ASTM): Conshohocken, PA, USA, 2017.
- Brischke, C.; Iseler, N.; Meyer, L.; Sawyer, G. Testing the mechanical resistance of timber used for construction in the marine environment. Int. Wood Prod. J. 2014, 5, 39–49. [Google Scholar] [CrossRef]
- Swaczyna, I.; Kedzierski, A.; Tomusiak, A.; Cichy, A.; Rozanska, A.; Policinska-Serwa, A. Hardness and wear resistance tests of the wood species most frequently used in flooring panels. Ann. Wars. Univ. Life Sci. SGGW For. Wood Technol. 2011, 76, 82–87. [Google Scholar]
- Coelho, M.U.; Del Menezzi, C.; Souza, M. Abrasion resistance of Pinus wood subjected to thermomechanical treatments. Pro Ligno 2017, 13, 94–100. [Google Scholar]
- Wentzel, M.; González-Prieto, Ó.; Brischke, C.; Militz, H. Physico-Mechanical Properties of Thermally Modified Eucalyptus nitens Wood for Decking Applications. Wood Ind. Drv. Ind. 2019, 70, 235–245. [Google Scholar] [CrossRef] [Green Version]
- Sepliarsky, F.; Acuña, L.; Balmori, J.-A.; Martínez, R.D.; Spavento, E.; Keil, G.; Casado, M.; Martín-Ramos, P. Modeling of Falling Ball Impact Test Response on Solid, Veneer, and Traditional Engineered Wood Floorings of Several Hardwoods. Forests 2022, 13, 167. [Google Scholar] [CrossRef]
- Grubîi, V.; Johansson, J. Performance of multi-layered wood flooring elements produced with sliced and sawn lamellas. Pro Ligno 2019, 15, 166–172. [Google Scholar]
- Neyses, B.; Sandberg, D. A new methodology to select hardwood species for wooden products. Wood Mater. Sci. Eng. 2015, 10, 344–352. [Google Scholar] [CrossRef]
- Hague, J. Utilisation of Plantation Eucalypts in Engineered Wood Products; Forest and Wood Products Australia: Melbourne, Australia, 2013. [Google Scholar]
- Blacklow, P. An Exploration of Pre and Post-Stressed Timber Forms Utilising Plantation-Grown Eucalypt Timber. PhD Thesis, University of Tasmania, Tasmania, Australia, 2016. [Google Scholar]
- Blackburn, D.P. Improving Eucalyptus nitens for Sawn-Board, Veneer and Paper Products. PhD Thesis, University of Tasmania, Tasmania, Australia, 2012. [Google Scholar]
- Derikvand, M.; Kotlarewski, N.; Lee, M.; Jiao, H.; Nolan, G. Characterisation of physical and mechanical properties of unthinned and unpruned plantation-grown Eucalyptus nitens H. Deane & Maiden lumber. Forests 2019, 10, 194. [Google Scholar]
- Harwood, C. Sawn timber from native forests and plantations in Tasmania. Coop. Res. Cent. For. Bull. 2010, 13. Available online: https://www.crcforestry.com.au/publications/downloads/Bulletin-13-Sawn-timber-properties.pdf (accessed on 10 August 2022).
- Millaniyage, K.; Kotlarewski, N.; Wallis, L.; Taoum, A.; Nolan, G. Janka Hardness Evaluation of Plantation-Grown Eucalyptus nitens for Engineered Flooring Applications. Buildings 2022, 12, 1862. [Google Scholar] [CrossRef]
- Washusen, R.; Harwood, C.; Morrow, A.; Northway, R.; Valencia, J.C.; Volker, P.; Wood, M.; Farrell, R. Pruned plantation-grown Eucalyptus nitens: Effect of thinning and conventional processing practices on sawn board quality and recovery. New Zealand J. For. Sci. 2009, 39, 39–55. [Google Scholar]
- AS 2082; Timber–Hardwood–Visually Stress Graded for Structural Purposes. Standards Australia: Sydney, Australia, 2007.
- AS 2796.2; Timber–Hardwood–Sawn and Milled Products, Part 2: Grade Description. Standards Australia: Sydney, Australia, 1999.
- Derikvand, M.; Nolan, G.; Jiao, H.; Kotlarewski, N. What to do with structurally low-grade wood from Australia’s plantation eucalyptus; building application? BioResources 2017, 12, 4–7. [Google Scholar] [CrossRef] [Green Version]
- Nolan, G.; Greaves, B.; Washusen, R.; Parsons, M.; Jennings, S. Eucalypt Plantations for Solid Wood Products in Australia—A Review ‘If you Don’t Prune it, we Can’t Use it’; Forest & Wood Products Research & Development Corporation: Melbourne, Australia, 2005; Available online: https://eprints.utas.edu.au/7045/ (accessed on 10 August 2022).
- Kotlarewski, N.; Taylor, L.; Booth, P. Embracing natural timber features of plantation hardwood: Material-aware digital workflows in product design and development. In Proceedings of the 52nd International Conference of the Architectural Science Association, Melbourne, Australia, 28 November–1 December 2018. [Google Scholar]
- Riddle, T. A white timber floor. Build. Connect. 2015, 44–45. Available online: https://search.informit.org/doi/epdf/10.3316/informit.256207485215981 (accessed on 6 January 2022).
- ATFA. The Final Appearance; Australian Timber Flooring Association: Shelly Beach, Australia, 2009. [Google Scholar]
- Vörös, Á.; Németh, R. The History of Wood Hardness Tests. In IOP Conference Series: Earth and Environmental Science; IOP Publishing: Bristol, UK, 2020; Volume 505, No. 1, p. 012020. [Google Scholar]
- ASTM D 143; Standard Test Methods for Small Clear Specimens of Timber. American Society for Testing and Materials (ASTM) International: Conshohocken, PA, USA, 2000.
- AS 1720.2; Timber Structures Timber Properties. Standards Australia: Sydney, Australia, 2006.
- Grześkiewicz, M.; Kozakiewicz, P.; Borysiuk, P.; Romanovski, V.; Cichy, A. Influence of top layer density and thickness on hardness of two-layer floor elements. Drew. Pr. Nauk. Doniesienia Komun. 2020, 62, 69–80. [Google Scholar]
- EN 14354; Wood-Based Panels—Wood Veneer Floor Coverings 2017. European Committee for Standardisation (CEN): Brussels, Belgium, 2017.
- AS/NZS 1080.1:2012; Timber—Methods of Test—Moisture Content. Standards Australia: Sydney, Australia, 2012.
- AS/NZS 1080.3:2000; Timber—Methods of test, Method 3: Density. Standards Australia: Sydney, Australia, 2000.
- Ohtani, T.; Kamasaki, K. Effect of microscopic tissue on three-body abrasion in cell structure of wood. Wear 2007, 262, 453–460. [Google Scholar] [CrossRef]
- Rede, V.; Essert, S.; Šokčević, Z. Effects of microstructural orientation on the abrasive wear resistance of subfossil elm wood in three orthogonal planes. Wear 2017, 380, 1–5. [Google Scholar] [CrossRef]
- Mohd-Jamil, A. Janka hardness rating of Malaysian timbers. Timber Technol. Bull. 2016, 58, 6. [Google Scholar]
- Drerup, M.J.; Erdem, I.; Anthony, R.W. Trouble Underfoot—In Situ and Laboratory Investigation of Engineered Wood Flooring. In Proceedings of the Forensic Engineering 2012: Gateway to a Safer Tomorrow, San Francisco, CA, USA, 31 October–3 November 2012; pp. 621–630. [Google Scholar]


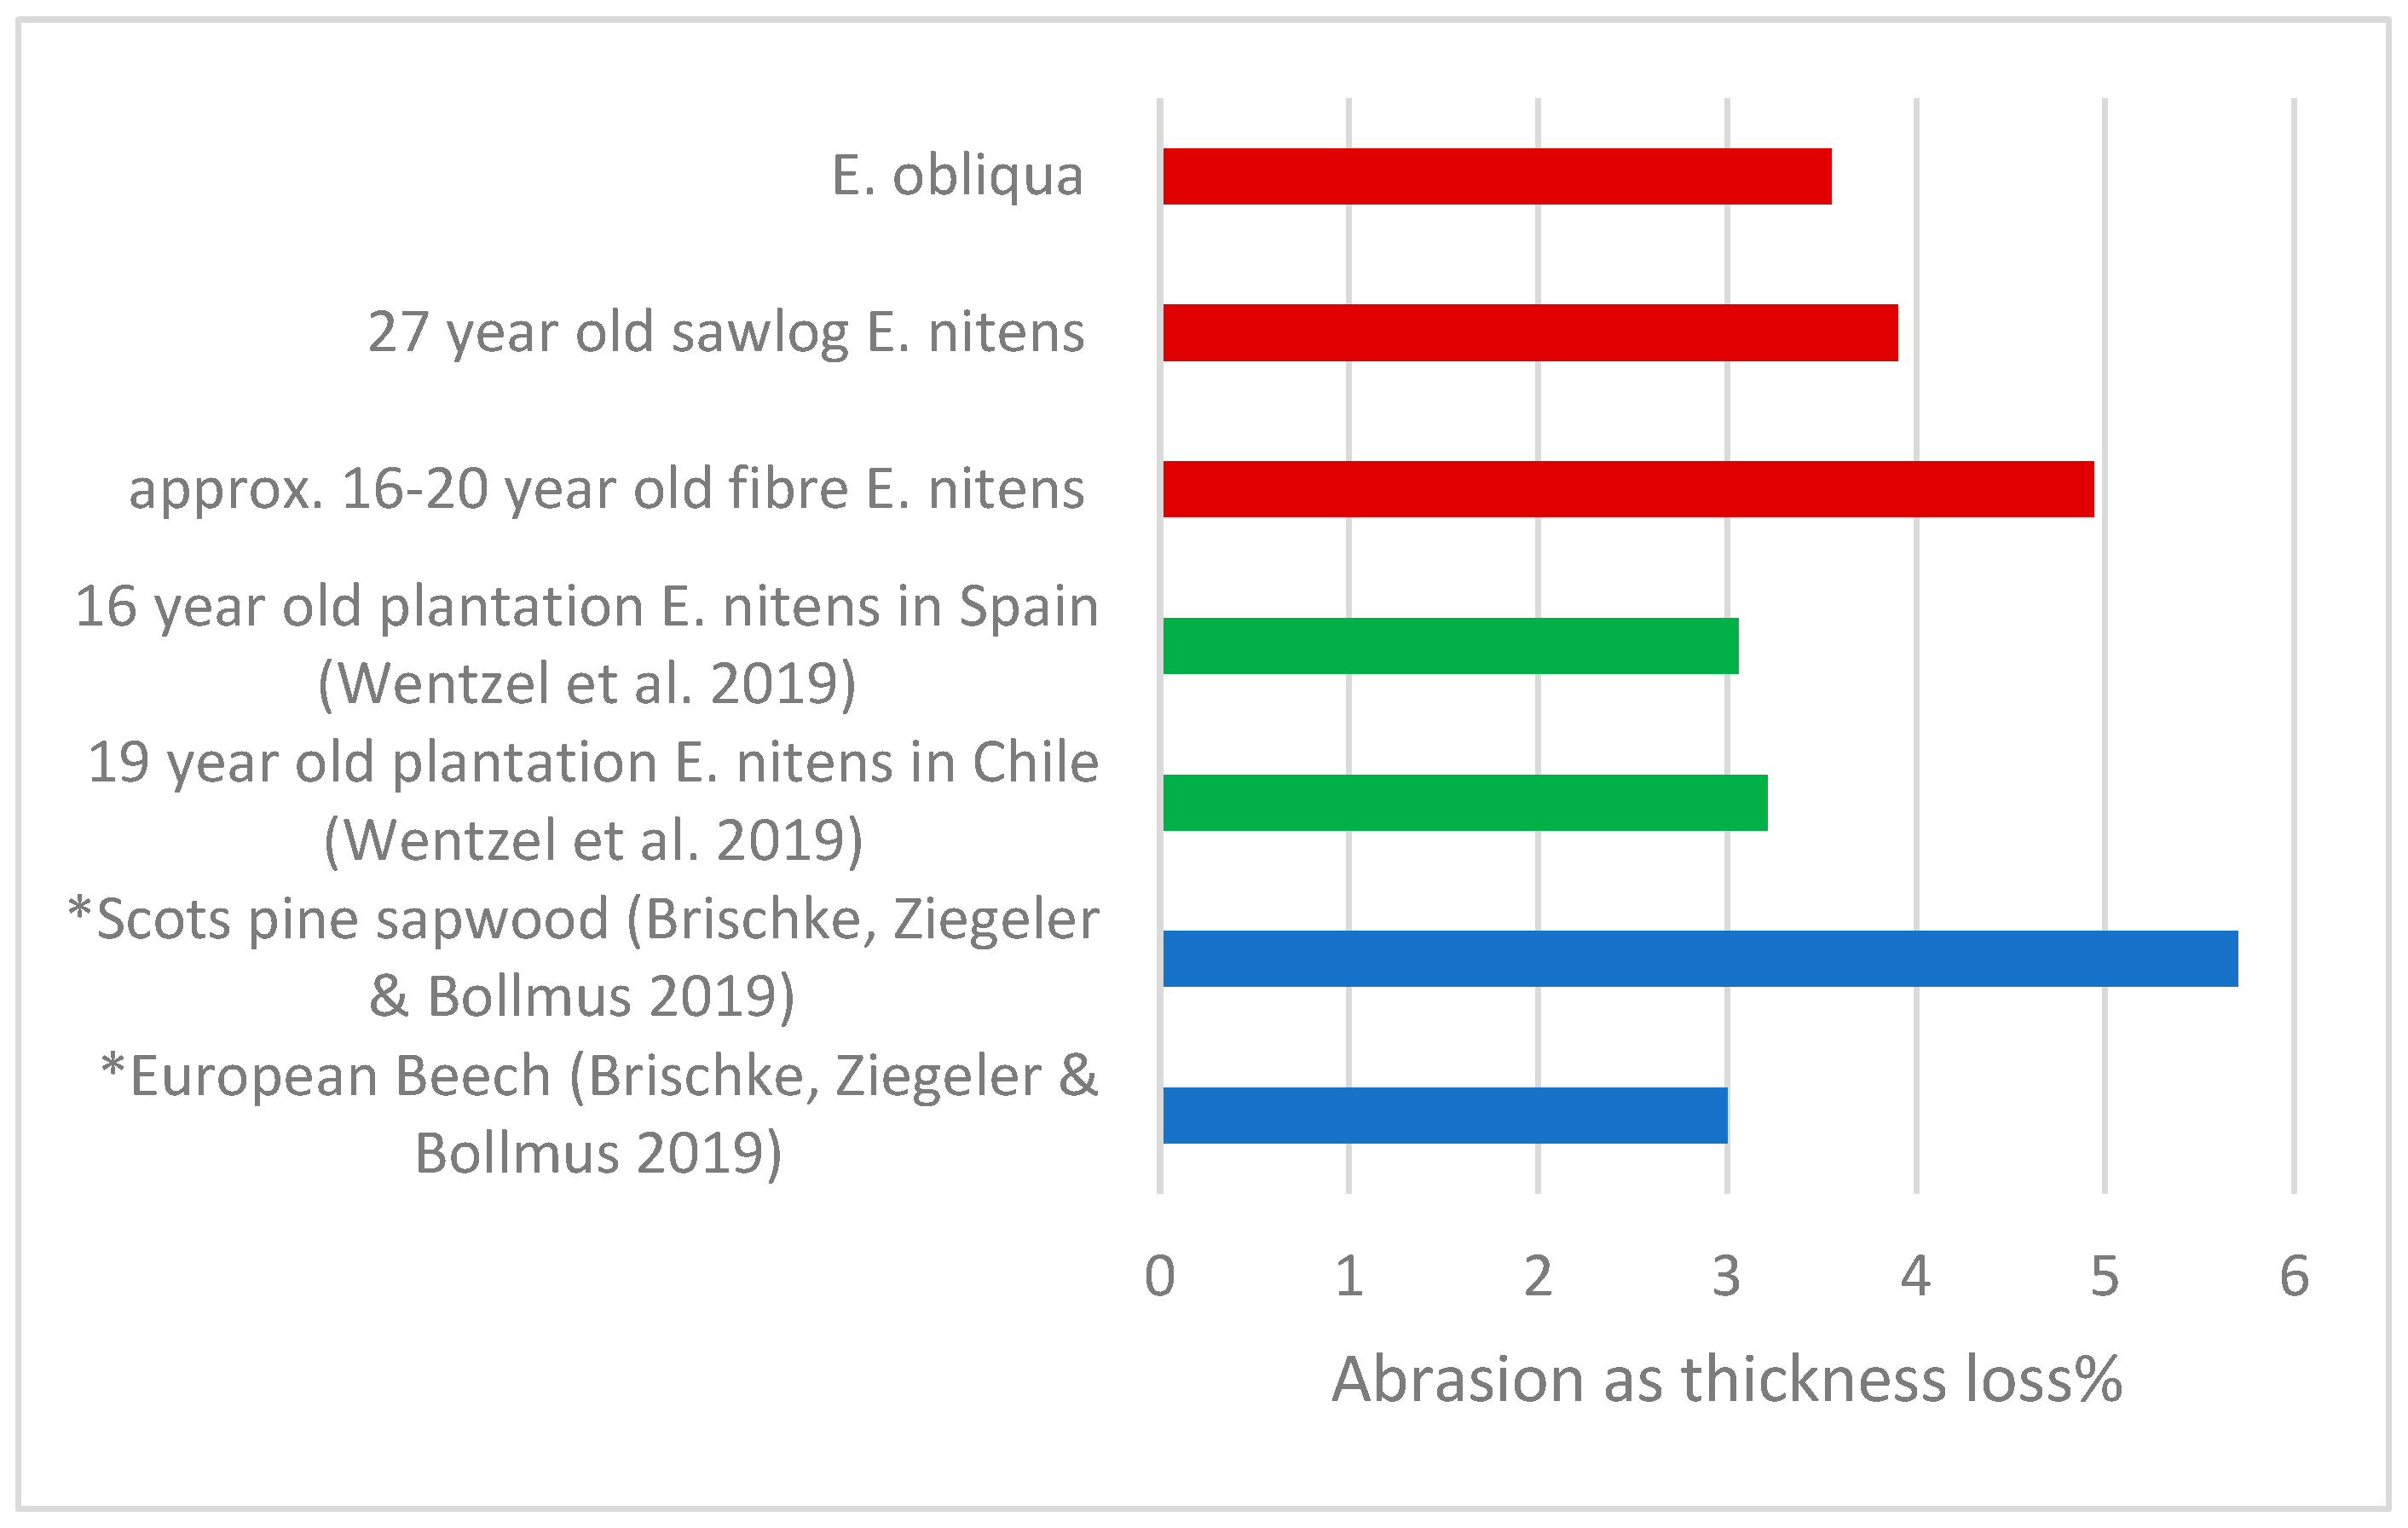
| Reference | Brischke, Ziegeler [5] | Wentzel, González-Prieto [14] | Khademibami, Shmulsky [1] | Swaczyna, Kedzierski [12] | Knapic, Machado [2] |
|---|---|---|---|---|---|
| Standard | EN 438-2 High-pressure decorative laminates (HPL) | EN 438-2 High-pressure decorative laminates (HPL) | ASTM D2394-17 Simulated Service Testing of Wood and Wood-Based Finish Flooring | PN EN ISO 5470-1 Rubber- or plastics-coated fabrics | EN 14354 Wood-based panels and Wood veneer floor coverings |
| Methodology summary | Samples subjected to abrasion with S-42 sanding paper attached to Taber abraser at 60 revolutions per min for 1000 revolutions | Samples subjected to abrasion with S-42 sanding paper attached to Taber abraser at 72 revolutions per min for 1000 revolutions | Specimen mounted on Navy-type wear tester and subjected to 500 rotations under a constant flow of 80 grit aluminum oxide media | Specimens subjected to 1000 revolutions of Taber abraser under 1000 g load | Specimens subjected to destructive action by passing loose aluminum oxide grit under a pair of leather clad brass wheels for 6000 revolutions |
| Measurement used | Thickness loss (%) | Thickness loss (%) | Thickness loss (mm) | Thickness loss (mm) and loss of mass (g) | Thickness loss (%) |
| Species abrasion (density kg/m3 in parentheses) | * European Beech (Fagus sylvatica L.) = 3.0% (725) * Scots pine sapwood (Pinus silvestris L.) = 5.7% (555) | Chile Plantation E. nitens = 3.21% (617) Spain Plantation E. nitens = 3.06% (574) | Sweetgum (Liquidambar styraciflua) = 0.234 mm (602) Hickory (Carya sp.) = 0.212 mm (801) Ash (Fraxinus sp.) = 0.185 mm (682) Red Oak (Quercus sp.) = 0.175 mm (731) White Oak (Quercus sp.) = 0.147 mm (760) | Oak (Quercus sp.) 0.18 mm (606) Fossil Oak (Quercus sp.) = 0.19 mm (595) Pine (Pinus sp.) = 0.28 mm (529) Cherry (Prunus sp.) = 0.17 mm (662) Sycamore Maple (Acer sp.) = 0.17 mm (545) Walnut (Juglans sp.) = 0.14 mm (553) Ash (Fraxinus sp.) = 0.19 mm (550) Mahogany (Swietenia sp.) = 0.23 mm (546) | Limba (Terminalia superba) = 13.5% (499) Mupanda (Brachystegia speciformis) = 3.5% (786) Rodhesian teak (Baikiaea plurijuga) = 2.5% (931) Cork Oak (Quercus suber L.) = 3% (783) |
| Specimen Type | Composition | No of Replicates |
|---|---|---|
| Sawlog E. nitens (27 years old) | Solid | 30 |
| Fibre E. nitens (below 20 years old) | Solid | 30 |
| E. nitens engineered flooring | 1.2 mm-thick sawlog E. nitens veneer top layer Fibre E. nitens plywood substrate | 30 |
| Regrowth forest E. obliqua | Solid | 30 |
| Tasmanian Oak engineered flooring * | 3 mm-thick Tasmanian Oak top layer Rubberwood (Hevea sp.) substrate | 10 |
| Solid Sawlog E. nitens | Solid Fibre E. nitens | Solid E. obliqua | * E. nitens Engineered Flooring | * Tasmanian Oak Engineered flooring | |||||||
|---|---|---|---|---|---|---|---|---|---|---|---|
| MC% | ADD (kg/m3) | ODD (kg/m3) | MC% | ADD (kg/m3) | ODD (kg/m3) | MC% | ADD (kg/m3) | ODD (kg/m3) | ADD (kg/m3) | ADD (kg/m3) | |
| Mean | 11.3 | 630 | 570 | 10.8 | 495 | 445 | 10.3 | 680 | 615 | 885 | 640 |
| SD | 0.91 | 84.10 | 73.59 | 0.50 | 41.17 | 36.58 | 0.47 | 78.58 | 70.31 | 34.93 | 34.70 |
| Min | 9.6 | 460 | 415 | 9.6 | 445 | 400 | 9.5 | 535 | 485 | 800 | 575 |
| Max | 12.9 | 745 | 670 | 11.8 | 630 | 570 | 11.2 | 835 | 760 | 980 | 690 |
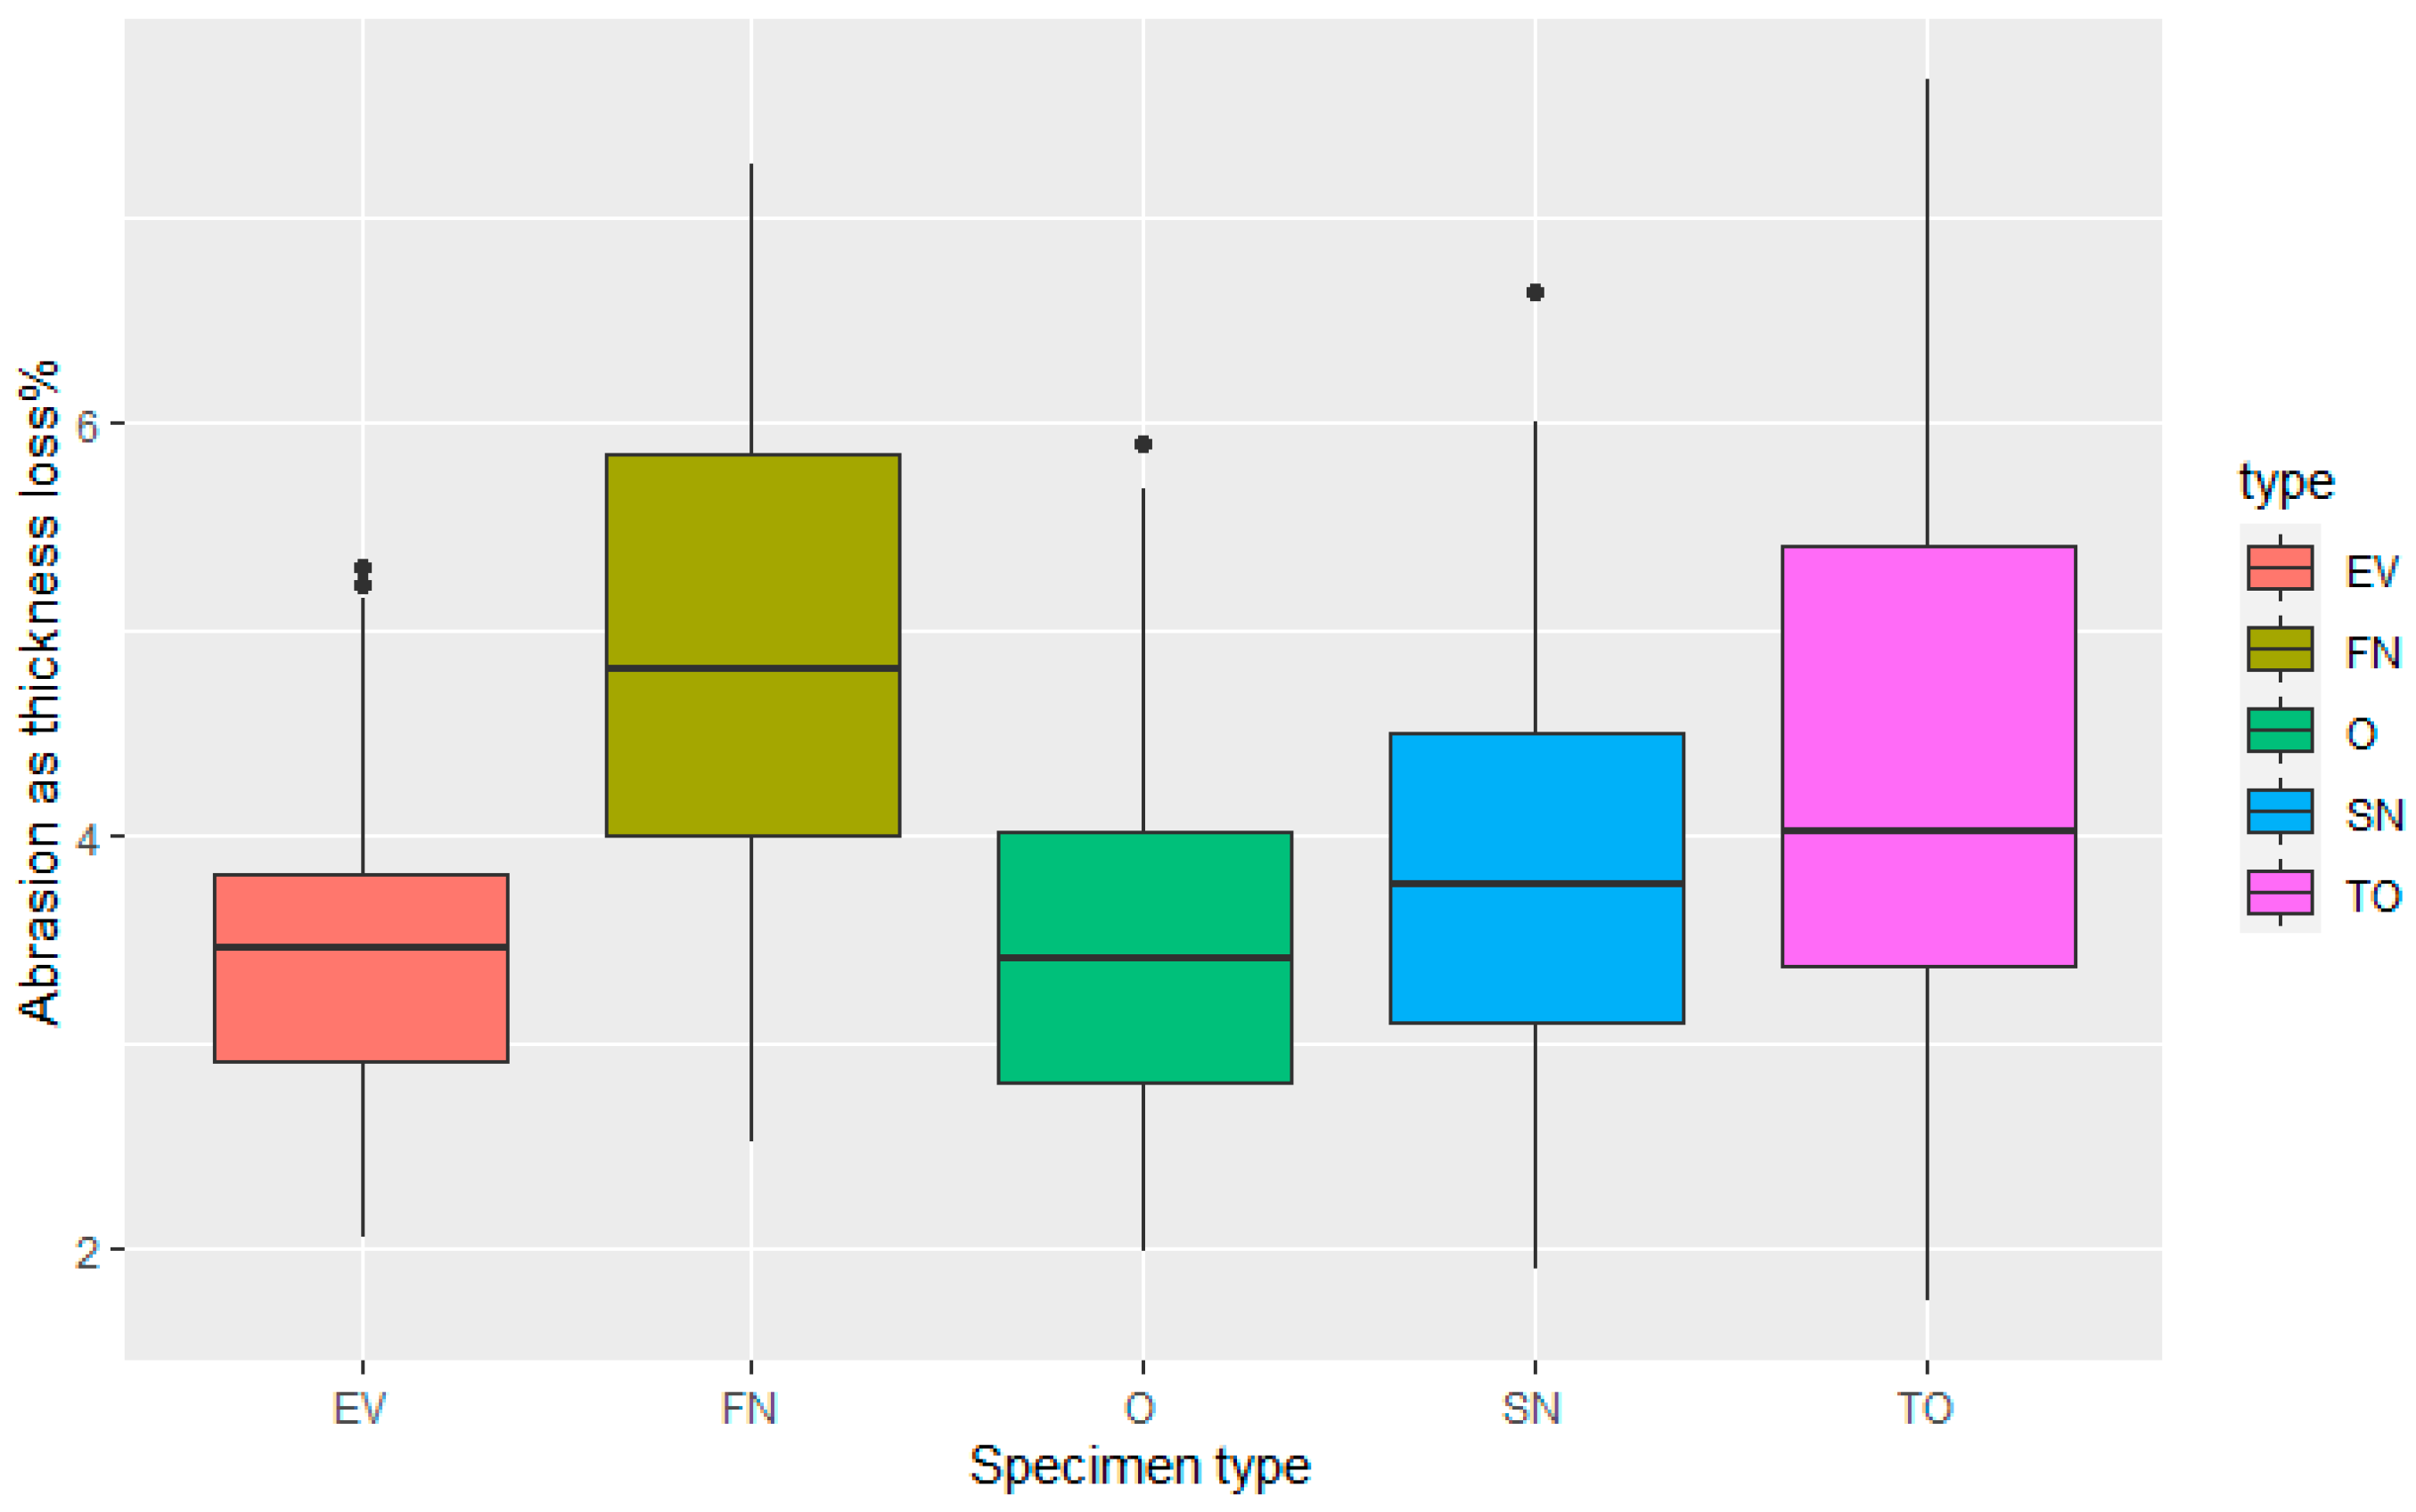
| Specimen | Mean Abrasion ∆t% | Median | SD | COV% | SEM | Min | Max |
|---|---|---|---|---|---|---|---|
| E. nitens veneer engineered flooring (EV) | 3.44 | 3.45 | 0.84 | 24.56 | 0.15 | 2.06 | 5.31 |
| E. obliqua (O) | 3.55 | 3.41 | 1.03 | 28.97 | 0.18 | 1.98 | 5.9 |
| Sawlog E. nitens (SN) | 3.90 | 3.77 | 1.17 | 30.03 | 0.21 | 1.9 | 6.63 |
| Tasmanian Oak engineered flooring (TO) | 4.33 | 4.03 | 1.77 | 40.88 | 0.55 | 1.75 | 7.66 |
| Fibre-managed E. nitens (FN) | 4.94 | 4.80 | 1.27 | 25.8 | 0.23 | 2.52 | 7.25 |
| Different Top Layer Species | Different Thicknesses of Same Species | Other Comparisons | ||||||||
|---|---|---|---|---|---|---|---|---|---|---|
| SN–O | O–FN | SN–FN | TO 1–O 2 | SN 2–EV 3 | FN 2–EV 3 | O–EV | TO–EV | TO–SN | TO–FN | |
| Estimate | 0.354 | −1.392 | −1.038 | 0.782 | 0.463 | 1.501 | 0.108 | 0.891 | 0.427 | −0.610 |
| SE | 0.298 | 0.298 | 0.298 | 0.421 | 0.298 | 0.298 | 0.298 | 0.421 | 0.421 | 0.421 |
| p value | 0.752 | <0.001 * | 0.005 * | 0.339 | 0.522 | <0.001 * | 0.996 | 0.215 | 0.844 | 0.591 |
| Present Study | Surface of Tested Panels * | [23] | ||||
|---|---|---|---|---|---|---|
| Specimen | Abrasion ∆t% | Flooring Prototype Layers | Layer Thickness (mm) | Layer Density (kg/m3) | Janka Hardness (N) | |
| E. nitens veneer engineered flooring | 3.44 |  (EV) | 1. E. nitens veneer | 1.20 | 430 | 6623 |
| 2. E. nitens plywood | 12.00 | 765 | ||||
| 3. E. nitens veneer | 0.60 | 430 | ||||
| E. obliqua | 3.55 |  (O) | 1. Solid E. obliqua | 12.00 | 715 | 5512 |
| Sawlog E. nitens | 3.90 |  (SN) | 1. Sawlog E. nitens | 6.00 | 565 | 4468 |
| 2. Marine plywood | 6.00 | 495 | ||||
| 3. E. nitens veneer | 0.60 | 430 | ||||
| Tasmanian Oak engineered flooring | 4.33 |  (TO) | 1. Prefinished Tasmanian Oak | 3.20 | 627 | 5323 |
| 2. Rubberwood (Hevea) | 11.0 | 587 | ||||
| Fibre-managed E. nitens | 4.94 |  (F) | 1. Fibre E. nitens | 6.00 | 495 | 4188 |
| 2. Marine plywood | 6.00 | 495 | ||||
| 3. E. nitens veneer | 0.60 | 430 | ||||
Disclaimer/Publisher’s Note: The statements, opinions and data contained in all publications are solely those of the individual author(s) and contributor(s) and not of MDPI and/or the editor(s). MDPI and/or the editor(s) disclaim responsibility for any injury to people or property resulting from any ideas, methods, instructions or products referred to in the content. |
© 2023 by the authors. Licensee MDPI, Basel, Switzerland. This article is an open access article distributed under the terms and conditions of the Creative Commons Attribution (CC BY) license (https://creativecommons.org/licenses/by/4.0/).
Share and Cite
Millaniyage, K.; Kotlarewski, N.; Taoum, A.; Wallis, L. The Role of Abrasion Resistance in Determining Suitability of Low-Density Plantation Timber for Engineered Flooring. Forests 2023, 14, 1309. https://doi.org/10.3390/f14071309
Millaniyage K, Kotlarewski N, Taoum A, Wallis L. The Role of Abrasion Resistance in Determining Suitability of Low-Density Plantation Timber for Engineered Flooring. Forests. 2023; 14(7):1309. https://doi.org/10.3390/f14071309
Chicago/Turabian StyleMillaniyage, Kuluni, Nathan Kotlarewski, Assaad Taoum, and Louise Wallis. 2023. "The Role of Abrasion Resistance in Determining Suitability of Low-Density Plantation Timber for Engineered Flooring" Forests 14, no. 7: 1309. https://doi.org/10.3390/f14071309