Article

Morphological Crown Attributes Contributing to Differential Height and Diameter Growth among Families in a Coastal Douglas-Fir Progeny Test: Crown Structural Evidence for Crop Ideotypes

by
Sukhyun Joo
1,*,
Douglas A. Maguire
1,
J. Bradley St. Clair
2,
Terrance Z. Ye
3 and
Keith J. S. Jayawickrama
3
1
Department of Forest Engineering, Resources and Management, College of Forestry, Oregon State University, Corvallis, OR 97331, USA
2
USDA Forest Service, Pacific Northwest Research Station, Corvallis, OR 97331, USA
3
Department of Forest Ecosystems and Society, College of Forestry, Oregon State University, Corvallis, OR 97331, USA
*
Author to whom correspondence should be addressed.
Forests 2023, 14(6), 1263; https://doi.org/10.3390/f14061263
Submission received: 25 May 2023 / Revised: 11 June 2023 / Accepted: 14 June 2023 / Published: 19 June 2023

Abstract

:
Theoretical tree crop ideotypes have long and narrow live crowns with a high total leaf area. This crown form allows more efficient exploitation of site resources, in part by physically occupying less growing space per unit leaf area and by packing a greater number of trees into a given area. Genetic selection for crop ideotypes has been proposed as a strategy for maximizing productivity per unit area in stands managed under intensive silviculture. The primary objective of this study was to test the relationship between the relative growth performance of different families in a Douglas-fir (Pseudotsuga menziesii var. menziesii [Mirb.] Franco) progeny test and morphological crown attributes that conform to a theoretical crop ideotype. The overarching goal was to identify attributes conferring superior height and diameter growth on families and to facilitate the incorporation of these attributes and associated growth mechanisms into hybrid growth models for intensively managed plantations. Crown structural attributes were measured on destructively sampled trees and averaged for the entire crown and each third of live crown length among families. Multivariate analysis revealed that crown attributes averaged over the entire crown performed best for identifying families with different height and diameter growth, followed successively by the bottom, middle, and top crown third. Trees with relatively short branch lengths and steep branch angles tended to have higher total leaf area per unit crown length (TLACL), and this structural attribute showed a strong positive correlation with cumulative diameter growth. The ratio of crown width to crown length (CWL) was moderately and negatively correlated with cumulative height growth. The families displaying the most rapid diameter growth in this progeny test conformed to a theoretical crop ideotype, while those with the most rapid height growth displayed crown attributes with a less obvious relationship to the crop ideotype concept. TLACL implied one possible mechanism driving genetic gain in Douglas-fir families, given its high heritability and strongly positive correlation with growth performance. Incorporating TLACL as an explanatory variable in diameter growth models could at least partly represent different genetic levels. TLACL is less strongly correlated with height growth rate, so incorporating CWL may better represent genetic effects on height growth models.

1. Introduction

A cooperative genetic improvement program for coastal Douglas-fir (Pseudotsuga menziesii var. menziesii [Mirb.] Franco) in the U.S. Pacific Northwest (PNW) started in 1954, with progeny tests now in a third cycle of testing and selection [1,2,3,4]. Most progeny tests are designed with the primary objective of identifying families that exhibit superior volume growth without sacrificing fitness to their targeted biophysical environment. Traits used for selecting superior trees are, therefore, dimensions that determine tree stem volume growth, specifically total height (HT) and diameter at breast height (DBH). A typical progeny test contains trees that are completely interspersed by family origin. In contrast, operational plantations containing genetically improved stock originate from seed lots containing a set of only families with better growth performance in progeny tests [5,6,7]. Selections from progeny tests are often performed at a young age (one-fourth to one-half of the rotation age) using narrow spacing, so crown closure and inter-tree competition are typically prevalent in most stands. It has been repeatedly demonstrated that selection in forest tree improvement programs at around 1/4 to 1/3 of rotation age is economically optimal in terms of net present value added [8]. Most selections are, therefore, indirect and possibly subject to some revision because (1) progeny tests were established to measure the relative growth performance of individual, relatively open-grown trees; (2) the relative performance of young open-grown trees may change as they approach crown closure and the onset of increasingly intense intertree competition; and (3) genetic gain can be overestimated if the measurement takes place after the severe inter-tree competition has taken place [9,10]. However, realized genetic gain trials established for several conifer species confirm that breeding and testing programs deliver significant gains in large-plot trials where elite genotypes are grown together in competition [5,6,7].
Donald [11] introduced the crop ideotype concept and extended the concept to plant breeding and conceptual models of the ideal plant for maximizing yield per unit area [12,13,14]. The crop ideotype concept focuses on yield enhancement attributable to multiple phenotypic attributes of a plant that are expected to produce higher biomass and economic yield in a fixed area and under a fixed biophysical environment. Dickmann [15] and Cannell [16] further expanded the ideotype concept to forests by adopting it as a strategy for the genetic improvement of trees [17,18,19]. The concept of crop ideotype distinguishes three different strategies. The isolation ideotype grows well in an open space without competition and tends to have a wide and long crown but does not grow well under intensive competition. The competition ideotype tends to exploit site resources rapidly and grow large at the expense of neighbors, in part by developing relatively wide crowns. Resource-use efficiency manifest as production per unit occupied area is therefore low for competition ideotypes. In contrast, the crop ideotype exploits resources more efficiently by occupying less growing space and using lesser amounts of most or all resources to achieve the same level of growth as the competition ideotype. The ideal improved stands will theoretically include only families conforming most closely to the crop ideotype by having long but narrow live crowns, more trees per unit area, more leaf area per unit area, higher tree-level and stand-level leaf area index, and consequently greater yield per unit area, especially under intensive silviculture [13,16].
In progeny tests, family selection typically occurs before crown closure; however, some degree of intertree competition has typically commenced as crown closure approaches. The crop ideotype concept might supplement selection criteria based on growth rate because (1) even mild to moderate intertree competition may cause underestimation of tree- and stand-level growth potential of isolation ideotype families; (2) individual trees from competition ideotype families may exhibit superior growth of individual trees at the expense of stand-level growth; (3) competition ideotype families may grow better before crown closure, so earlier selection may cause overestimation of their stand-level growth potential; and (4) the relatively slow growth of crop ideotypes before crown closure may cause underestimation of stand-level performance in crop ideotype plantations due to better resource use efficiency and reduced intertree competition (e.g., progeny tests) [9,20]. Because many of the traits for identifying crop ideotypes are more difficult to measure than height and diameter growth, implementing these concepts in operational tree improvement programs could add substantially to testing costs.
Because wood production in forestry involves a 40–70-year rotation in species like Douglas-fir, forecasts are needed to estimate the yield gains from genetic improvement. Forest growth and yield models have accounted for genetic improvements by adjusting site index or applying genetic-gain multipliers in height and diameter growth rate equations [21,22,23]. Identifying physiological or morphological crown attributes consistent with the crown ideotype concept could not only help explain differences in the tree and stand growth performance among families, but their incorporation into mechanistic growth and yield models offers the potential to facilitate simulation of family combinations that have not or cannot be field tested.
Past work on progeny tests in Douglas-fir provides insight into attributes justifying close focus during tree breeding. St. Clair [24,25] felled sample trees from an 18-year-old progeny test in the Coast Range of Oregon, measured numerous crown and stem attributes in detail on these felled trees, and then examined the genetic and phenotypic correlations between crown structure and stem growth performance. Although these univariate analyses of whole-tree crown attributes were an important first step in identifying traits potentially controlling differential family performance, ecophysiological mechanisms functionally integrate many morphological attributes in complex interactions. Likewise, because crown attributes are intercorrelated, and height and diameter growth are intercorrelated, multivariate analyses offer an alternative and complementary way to identify, explore, and establish general relationships between stem growth and phenotypic tree and crown structure. A multivariate approach acknowledges the complexity among measurable variables without requiring the much deeper level of understanding required to represent functional relationships explicitly in a mechanistic model. In short, morphological crown ideotypes of practical appeal must be identifiable from key sets of multiple attributes that are measurable and relevant to known ecophysiological processes.
The analyses presented here represented continued research on the progeny tests first explored by St. Clair [24,25] to unravel interactions between morphological crown attributes and growth performance, to tentatively infer key mechanisms explaining the differential growth performance of families, and ultimately to incorporate these mechanisms into growth models. Unlike the univariate analyses conducted by St. Clair [24,25], our study advances this research using a multivariate approach to analyze the intercorrelations between these crown attributes from each crown third. The specific objectives of the multivariate analyses below were (1) to test whether Douglas-fir families differ concerning morphological crown attributes in one or more thirds of live crown length; (2) to identify crown attributes that are relevant to the crop ideotype concepts; (3) to quantify the strength of relationships between crop ideotype attributes and growth performance of Douglas-fir families; and (4) identify several heritable morphological crown attributes that could be incorporated into individual-tree growth models to represent mechanisms driving genetic improvement and resulting differences in stand-level growth performance of alternative combinations of families.

2. Materials and Methods

2.1. Experimental Design and Data Collection

The dataset was previously described by St. Clair [24,25]. In brief, trees were sampled in an 18-year-old Douglas-fir progeny test established in 1974 in the Coast Range near Newport, Oregon. The plantation was established using 1-year-old seedlings planted at a 2.4 × 3.0 m spacing. No new data were collected for this analysis. Site productivity was high, so trees were competing for several years or more before the first measurements in this analysis were taken. The experimental design was a randomized block design. Two half-sibs from each of the 20 open-pollinated parents were randomly selected from each of the six blocks containing the full set of families available in the progeny test. Seedlings from the same family were planted in separate blocks to control for local environmental variation (e.g., slope), but all blocks were located at the same site.
The crown radii in the north and south directions were measured before felling each of the 240 sample trees in 1991. Height, diameter at breast height (DBH), and live crown length were measured on the felled trees, and distances from the tip of the tree to the first and fifth whorls were measured to estimate the last 1- and 5-year height increments. The base of the live crown was defined as the first whorl with live branches in at least three of four quadrants around the stem. A whorl for sample branches was chosen to represent the top, middle, and bottom third of the live crown length, usually whorls 2, 4, and 7 from the tip of the tree. The following dimensions were recorded for each sample whorl: number of branches, stem diameter (~20 cm below the whorl), and crown width at the height of the whorl (horizontal distance between the tips of two longest live branches on each side of the sample whorl). The length, basal diameter (8 cm from the stem), and average vertical angle (angle in degrees between the vertical axis of the main stem and line connecting the point of insertion to the midpoint of the branch at half length) were measured on only the largest live branches in each sample whorl. Random samples of needles were collected from each crown third and brought to the laboratory to determine the projected leaf area. All live branches were removed from each crown third and weighed fresh. Two live whorl branches were randomly cut from each sample whorl, weighed fresh in the field, and taken to the laboratory to determine branch and foliage dry weights and branch leaf area. A stem disk at 1.3 m from the ground was taken to the laboratory, the four cardinal directions were marked on the disk, and the ring widths on these four axes were averaged to estimate the last 1- and 5-year diameter increments. Field data were collected from January to March 1991.
The sample branches were reweighed fresh in the lab, oven-dried for about 3 days, and needles were then separated from the branches. Both needles and the woody part of each sample branch were weighed (nearest 0.1 g). Dry-to-fresh weight ratios of foliage and the woody part of each sample branch were computed, as was the ratio of fresh foliage weight to fresh woody weight for sample branches. Dry weights of foliage and woody components in each crown third were then estimated as the product of the total fresh weight of the respective crown third, the ratio of total fresh foliage or woody weight to total branch fresh weight for branch samples from that crown third, and the ratio of total dry weight to total fresh weight of foliage or wood material from all sample branches from that crown third. Single-sided projected leaf area (nearest 0.01 cm2) was measured on 60 needles from each crown third using an electronic area meter. These 60 needles were then dried and weighed (nearest 0.001 g) to compute specific leaf area (SLA) as the projected area ratio to dry weight of each 60-needle sample. The total leaf area for each crown third was estimated by multiplying SLA for the crown third by the total foliage dry weight of that crown third.

2.2. Selection of Morphological Crown Attributes and Growth Performance

A wide array of crown attributes was measured; however, only morphological crown attributes related to the crop ideotype concept were selected for this study (Table 1). Branch length, total leaf area, and crown width were divided by stem diameter below the sample whorl or below crown base whorl for tree attributes to adjust for family differences in tree size. Whorl branch angle was divided by relative crown height to adjust for systematic differences in the light environment experienced by different crown thirds. Four ratios were selected to represent crown attributes potentially associated with the crop ideotype: branch length to stem diameter at whorl (BLR), crown width to crown length (CWL), and branch angle to relative crown height (BARCH). Specific leaf area (SLA) and total leaf area per unit crown length (TLACL) were selected to represent light attenuation and vertical foliage density, respectively, relative to the crop ideotype concept [15,19]. Cumulative height growth and diameter growth to plantation age 18 years and last 1- and 5-year increments in height and diameter were selected as the most relevant growth performance variables (Table 2).

2.3. Data Structure and Adjustments

Each individual tree was considered a sample unit. Five matrices were created, including four crown matrices and one growth performance matrix as follows: top crown matrix (240 trees × 5 crown attributes), middle crown matrix (240 trees × 5 crown attributes), bottom crown matrix (240 trees × 5 crown attributes), whole-tree crown matrix (240 trees × 5 crown attributes), and one growth performance matrix (240 trees × 5 growth variables) (Table 1 and Table 2).
Because all the matrices contained dimensions with different units (Table 1 and Table 2), crown attributes and growth variables were standardized by dividing by their standard deviation before outlier analysis, and all the multivariate analyses were performed. The outlier analyses for the four crown matrices and the growth matrix were performed in PC-ORD version 7.04 [26] with the Euclidean distance method. There were 8 to 12 trees exceeding two standard deviations across all matrices. The outlier trees were all growing slower or faster than the rest of the sample trees, but the heights and DBHs were reasonable for their age, so the outlier trees were retained in the matrices.
The Dust Bunny Index (DBI) [27] was applied to measure the degree to which the data distribution departed from multivariate normality (0.5 = multivariate normal, 1 = strongest dust bunny) and skewness of the four crown matrices and the growth performance matrix were checked with the Euclidean distance method using PC-ORD. The four crown matrices were characterized by 0.360 to 0.499 DBI and 0.5 to 1.7 average skewness, while the performance matrix was characterized by 0.330 DBI and −0.1 average skewness. The scatter plots showed the linearity among crown attributes, indicating that transformations of variables were not needed and that the matrices were amenable to methods assuming multivariate normality.

2.4. Data Analysis

Because the DBI, average skewness, and scatter plots indicated that crown attribute variables and growth variables satisfied assumptions of linear relationships between variables and multivariate normality, Principal Component Analysis (PCA) was used to describe patterns in the crown attributes concerning growth performance gradients in each crown section. The PCA was run in PC-ORD, setting correlation coefficients as the cross-products matrix and calculating scores for crown attributes using a distance-based biplot.
Permutation-based multivariate analysis of variance (PERMANOVA) [28] was used to test whether families differed in crown attributes. The linear relationships between variables and the low skewness of the crown attribute distributions confirmed that PERMANOVA was an appropriate approach. The main difference between multivariate analysis of variance (MANONVA) and PERMANOVA is that the total sum of squares in PERMANOVA is calculated directly from the distances among data points, while in MANOVA, the total sum of squares is calculated from the distances between data points and the mean [26,28]. PERMANOVA was run in PC-ORD using the Euclidean distance measure, the block was used as the blocking factor, and family was used as the grouping variable. Pseudo F-values and p-values in PERMANOVA were based on the randomization test [28] to determine how family growth differences could be explained by top, middle, bottom, and whole crown attributes.
Redundancy analysis (RDA) [29,30] was used to test if the various measures of growth performance (response variables defined above) were related to crown attributes (explanatory variables defined above) from each crown third separately. The PCA found the best orthogonal linear functions of the variables for explaining as much of the original variation in the variables as possible, ranked axes by their importance, and then facilitated the interpretation of the major axes regarding the relative importance of the original variables. For PCA in this study, we used crown attributes as response variables and then overlaid the principal components of the crown attributes on growth performance variables. In this approach, the growth performance variables did not affect the results of the PCA. In contrast, RDA depended on the explanatory variables included in the analysis. Specifically, RDA found the linear functions of growth performance variables (response variables) and separate linear functions of the crown attribute variables (explanatory variables) with the strongest correlations. RDA is, therefore, an appropriate method for identifying the linear function of crown attributes that have the strongest predictive power for the set of growth variables used in this analysis. The crown variables identified could be incorporated into growth models in a linear, nonlinear, or more complex mechanistic form, but RDA tested their importance in a more general multivariate context [31]. The marginal testing method was performed to test the significance of the individual canonical axes in RDA [32]. Cumulative percent of the variation explained by the first two axes identified crown attributes of a given crown third or the whole crown that yielded the strongest linear combination as evaluated by multivariate correlation with a corresponding linear combination of growth performances. The significance and importance of crown attributes were tested using the ‘anova’ function in the ‘vegan’ R package (ver. 2.5-2) using R (ver. 3.5.0) [33] and then comparing pseudo F-values and p-values of crown attributes.
The most relevant crown attributes for understanding the mechanisms driving family differences must not only offer strong predictive power for growth but also be demonstrated to have relatively high heritability. Individual-tree heritability ( h i 2 ) of crown attributes was estimated as h i 2 = σ a 2 / σ p 2 , where σ a 2 was additive genetic variance and σ p 2 was phenotypic variance. Additive genetic variance ( σ a 2 ) was estimated as 3 σ f 2 and phenotypic variance ( σ p 2 ) was estimated as σ f 2 + σ b 2 + σ b f 2 + σ e 2 , where σ f 2 , σ b 2 , σ b f 2 , and σ e 2 were the estimated variance components of family, block, block × family, and residual effects, respectively [34]. Family-mean heritability ( h f 2 ) was estimated as h f 2 = σ f 2 /   ( σ f 2 + σ b f 2 b + σ e 2 b n ) , where b was the number of blocks and n was the number of trees planted per block [34,35,36]. Heritability estimates ( h i 2 and h f 2 ) for amalgamations of crown attributes were computed using PCA1 and PCA2 scores to identify the crown third that exhibited the most robust genetic influence. Note that because this research was performed at a single location, individual-tree heritability, and family-mean heritability might be overestimated if there are genetic × environment interactions in crown and growth attributes. ASReml-R (ver. 4) [37] was used to estimate variance components and heritabilities.

3. Results

3.1. Family Differences in Morphological Crown Attributes

The permutation-based multivariate analysis of variance (PERMANOVA) indicated a significant family effect on crown attributes consistent with the crop ideotype concept. Crown attributes in all crown thirds and at the entire crown level showed significant differences (p < 0.01) among families, but whole-tree crown variables showed the strongest crown structural differences (Table 3). Crown structural differences among families were strongest for the bottom crown third, followed by the middle and top thirds.
Structural attributes of the entire crown showed the highest individual-tree and family-mean heritability, in general, compared to each of the crown thirds separately (Table 4 and Table 5). For most crown attributes, family-mean heritabilities were higher than individual-tree heritabilities. One crown attribute, i.e., total leaf area per unit crown length (TLACL), consistently displayed the highest individual-tree heritability in all crown thirds and at the whole-tree crown level relative to other crown structural attributes (Table 4). Among crown thirds, the bottom third showed the greatest genetic influences, followed by the middle and top crown thirds (Table 5).

3.2. Relationships among Crown Attributes

3.2.1. Top Crown

The ordination for the top crown third resulted in a 2-dimensional solution using the stopping rule referred to as the broken-stick eigenvalue [38], with 51.7% of the variance explained by the first two axes (Table 5). Axis 1 showed a strong negative correlation with CWL1 (r = −0.72) and BARCH1 (r = −0.65) in the top crown third but positively correlated with BLR1 (r = 0.58). CWL1 and TLACL1 were closely related to each other in 2-dimensional space, indicating that a tree with a relatively wide crown for a given length of the top crown third also tended to have higher leaf area per unit crown length in this crown section (Figure 1a and Table 6). BARCH1 supported this result because branches with relatively wider branch angles (from vertical) tended to have a wider crown width-to-length ratio (CWL1), as indicated by its similar correlation with lower values on Axis 1. The strong negative correlation of SLA1 with Axis 2 (r = −0.93) indicated that this principal component was primarily a measure of SLA1.

3.2.2. Middle Crown

The ordination for the middle crown third resulted in a 2-dimensional solution (again using the broken-stick eigenvalue stopping rule), with 55.4% of the variance explained by the first two axes (Table 5). CWL2 (r = −0.79) and BARCH2 (r = −0.80) strongly correlated with Axis 1, indicating that the first principal component was the primary measure of CWL2 and BARCH2. These variables were negatively correlated with Axis 1, reinforcing that larger branch angles (from vertical) tended to produce wider crown widths for a given length of the middle crown third; however, a different pattern from the top crown section emerged, indicating that trees with wider branch angle and wider crown width per unit length of the middle crown section showed relatively low foliage density, TLACL2 (Figure 1b and Table 6). In this progeny test, trees with a relatively low branch angle (closer to vertical) in the middle crown section tended to have higher total leaf area per crown length, and a middle crown section with shorter branch lengths tended to have a larger leaf area per unit crown length. Axis 2 showed a strong negative correlation with BLR2 (r = −0.85) and a moderately positive correlation with TLACL2 (r = 0.54) in the middle crown third.

3.2.3. Bottom Crown

The first two axes from the principal component analysis explained 55.5% of the variance in crown attributes from the bottom crown third (Table 5). The crown shape variables, including CWL3 (r = −0.82), BLR3 (r = −0.67), and BARCH3 (r = −0.66), exhibited a strong correlation with Axis 1. In contrast, the foliage variables, such as TLACL3 (r = 0.82) and SLA3 (r = 0.61), demonstrated a strong correlation with Axis 2 (Figure 1c and Table 6). These results suggest that crown shape variables vary together, and foliage variables vary together, but the two groups vary independently. For example, trees with wider crown width at the bottom crown tended to have branches with longer lengths and wider angles (from vertical), and trees with higher total leaf area per crown length tended to have higher specific leaf area.

3.2.4. Whole-Tree Crown

The ordination for attributes of the entire crown resulted in a 2-dimensional solution with 52.0% of the variance explained by the first two axes (Table 5). Total crown attributes CWLX (r = −0.81), and BLRX (r = −0.68) were strongly correlated with Axis 1 (Figure 1d and Table 6). The whole crown attribute TLACLX was the primary attribute contributing to Axis 2 (r = 0.93). Trees with longer BLRX and higher BARCHX tended to have lower leaf area density per unit crown length, TLACLX. In this study, trees with relatively sharp branch angles (more vertical) tended to have greater total leaf area per crown length.

3.3. Relationships between Crown Attributes and Growth Performance

Relationships between crown attributes and growth performance were tested with RDA using growth performance variables as the response vector and crown attributes as explanatory variables. Whole-tree crown attributes yielded the strongest RDA model (three axes) for explaining the multivariate variation in growth performance. The next successively strongest models relied on crown attributes from the bottom, middle, and top crown thirds (Table 7). This result was similar to the PERMANOVA results, i.e., whole-tree crown attributes were most significantly different among families, followed by attributes of the bottom, middle, and top crown thirds (Table 3). Across all crown sections, Axis 1 was positively correlated with all growth variables, although most strongly with DBH-related variables, while Axis 2 was strongly correlated with HTINC1 and HTINC5 (Figure 2).

3.3.1. Top Crown

In the top crown third, all crown variables contributed significantly (p < 0.05) to the first three RDA axes explaining 20.1% of the variance in growth performance (Table 7). The variable representing vertical foliage density, TLACL1, showed a positive correlation (r = 0.37) with Axis 1 (axis with strong loading of both DBH-related variables and cumulative height growth over 18 years), while SLA1 and CWL1 showed weaker and negative correlations (r = −0.27 and r = −0.13, respectively). Regarding Axis 2 (with stronger relative loading of DBH growth relative to height growth), moderately negative correlations emerged for vertical foliage density (TLACL1; r = −0.30), crown slenderness (CWL1; r = −0.26), and specific leaf area (SLA1; r = −0.16) (Figure 2a).

3.3.2. Middle Crown

In the middle crown third, all variables except BLR2 contributed significantly (p < 0.05) to the first three RDA axes that explained 35.1% of the variance in growth performance (Table 7). Vertical foliage density, TLACL2, was the only middle crown variable positively correlated with Axis 1 (r = 0.64). Specific leaf area (SLA2) and slenderness ratio (CWL2) showed the highest negative correlations (r = −0.33 and r = −0.30, respectively) with Axis 1 (Figure 2b). The crown slenderness ratio in the middle crown third (CWL2) showed the strongest correlation with Axis 2 (r = −0.22). Correlations were different in univariate analysis, where vertical foliage density (TLACL2) was positively correlated with HTINC1 (r = 0.15) and HTINC5 (r = 0.11).

3.3.3. Bottom Crown

In the bottom crown third, all variables contributed significantly (p < 0.05) to the first three RDA axes that explained 35.5% of the variance of growth performance (Table 7). Vertical foliage density in the bottom crown third, TLACL3, was positively correlated (r = 0.51) with Axis 1, while other variables showed a negative correlation (−0.34 ≤ r ≤ −0.20) with Axis 1 (Figure 2c). Among alternative attributes of the bottom crown third, BARCH3 (r = 0.21) and CWL3 (r = 0.20) showed the strongest correlations with Axis 2.

3.3.4. Whole-Tree Crown

For the entire tree crown, all variables contributed significantly (p < 0.05), and 46.9% of the variance of growth performance was explained by the first 3 axes (Table 7). Again, leaf area density per unit crown length, TLACLX (r = 0.66), was the only whole-tree crown variable positively correlated with Axis 1, while all other variables showed a negative correlation (−0.32 ≤ r ≤ −0.06) with Axis 1 (Figure 2d, Table 7). CWLX (r = −0.32) showed the strongest correlation with Axis 2 among whole-tree crown variables. The branch angle in the given relative crown height (BACRH) and branch length relative to stem diameter below whorl (BLR) showed a negative correlation with DBH18, DBHINC1, and DBHINC5; however, those two variables were very weakly related to the first two axes in the RDA ordination (cutoff r2 = 0.05) in all crown sections except the bottom crown third (Figure 2 and Table 8).
Among all selected crown attributes at the whole-tree crown level, three that were expected to serve as indicators of the crop ideotype—TLACLX, BLRX, and CWLX—showed high to moderate heritability, indicating that these crown attributes could potentially represent family differences in growth models (Table 7). TLACLX and CWLX showed particularly high pseudo F-values, indicating that these two variables are important for predicting growth performance (Table 9).

4. Discussion

Crop ideotype studies in various tree species have most commonly been based on univariate analyses determining how crown attributes affect the attainable stem volume of trees and/or stands, i.e., specifically by the correlation between a potential predictor variable and response variable. Because crown attributes are intercorrelated, and all crown attributes function simultaneously to affect growth performance, characterizing the combined patterns of crown attributes and growth rates among families in a progeny test should provide insight into heritable attributes to target during family selections. Growth performance has been represented by total stem volume at a given age in many studies, but partitioning stem volume growth into height and diameter growth components sharpens insight into biophysical and ecophysiological mechanisms conferring growth advantages. In this study, we had the opportunity to investigate family differences not only in whole-tree crown attributes but also within-tree variation in crown structure. Crown attributes for incorporation into growth models can be identified by determining the variability in crown attributes, their heritability, and the extent to which heritable attributes relate to family differences in growth performance can help identify crown attributes and model structures that can facilitate realistic simulation of growth differences among families identified as superior in progeny tests.
Structural attributes in each third of the live crown length and the entire crown showed significant differences among families, with whole-tree crown variables showing the biggest crown structural differences (see Table 3). Similar differences in crown structure have been reported at the family level in numerous tree species; however, few studies have tested whether detected differences were attributable to a finer scale difference in specific crown segments. King et al. [39] reported a significant genetic difference in branch length relative to total height, and Vargas–Hernandez et al. [40] reported significant differences in the number of branches, branch length, and branch angle among open-pollinated and full-sib families of Douglas-fir seedlings. Total leaf area per crown length (TLACL) appears to be the most important morphological crown attribute differentiating families due to its high heritability (see Table 4). Gould et al. [41] detected significant differences among families in crown width relative to DBH, branch length relative to adjacent stem cross-sectional area, and leaf area relative to branch length in high-density Douglas-fir plantations representing pure-family deployment trials. Likewise, a significant amount of genetic variation in crown length, maximum crown diameter, crown volume, foliage biomass, vertical foliage distribution, crown shape, branch longevity, and specific leaf area was found among families of outplanted loblolly pine [42,43,44,45]. McGarvey et al. [46] identified potential functional links between crown attributes and growth rates at the family level by confirming that fast-growing families of loblolly and slash pine had higher leaf area and light-saturated net photosynthesis than slow-growing families.
Among crown thirds, the bottom third showed the biggest structural differences and genetic influences, followed by the middle and top crown thirds (see Table 3 and Table 5). Greater variation and genetic influence of family origin in the bottom third might indicate the ability of some families to better adapt to cumulative effects of light interception in the upper and middle crown thirds. Kuuluvainen [47] reported that trees with relatively narrow crowns allow a greater amount of light penetration into the lower crown section. Ishii and Wilson [
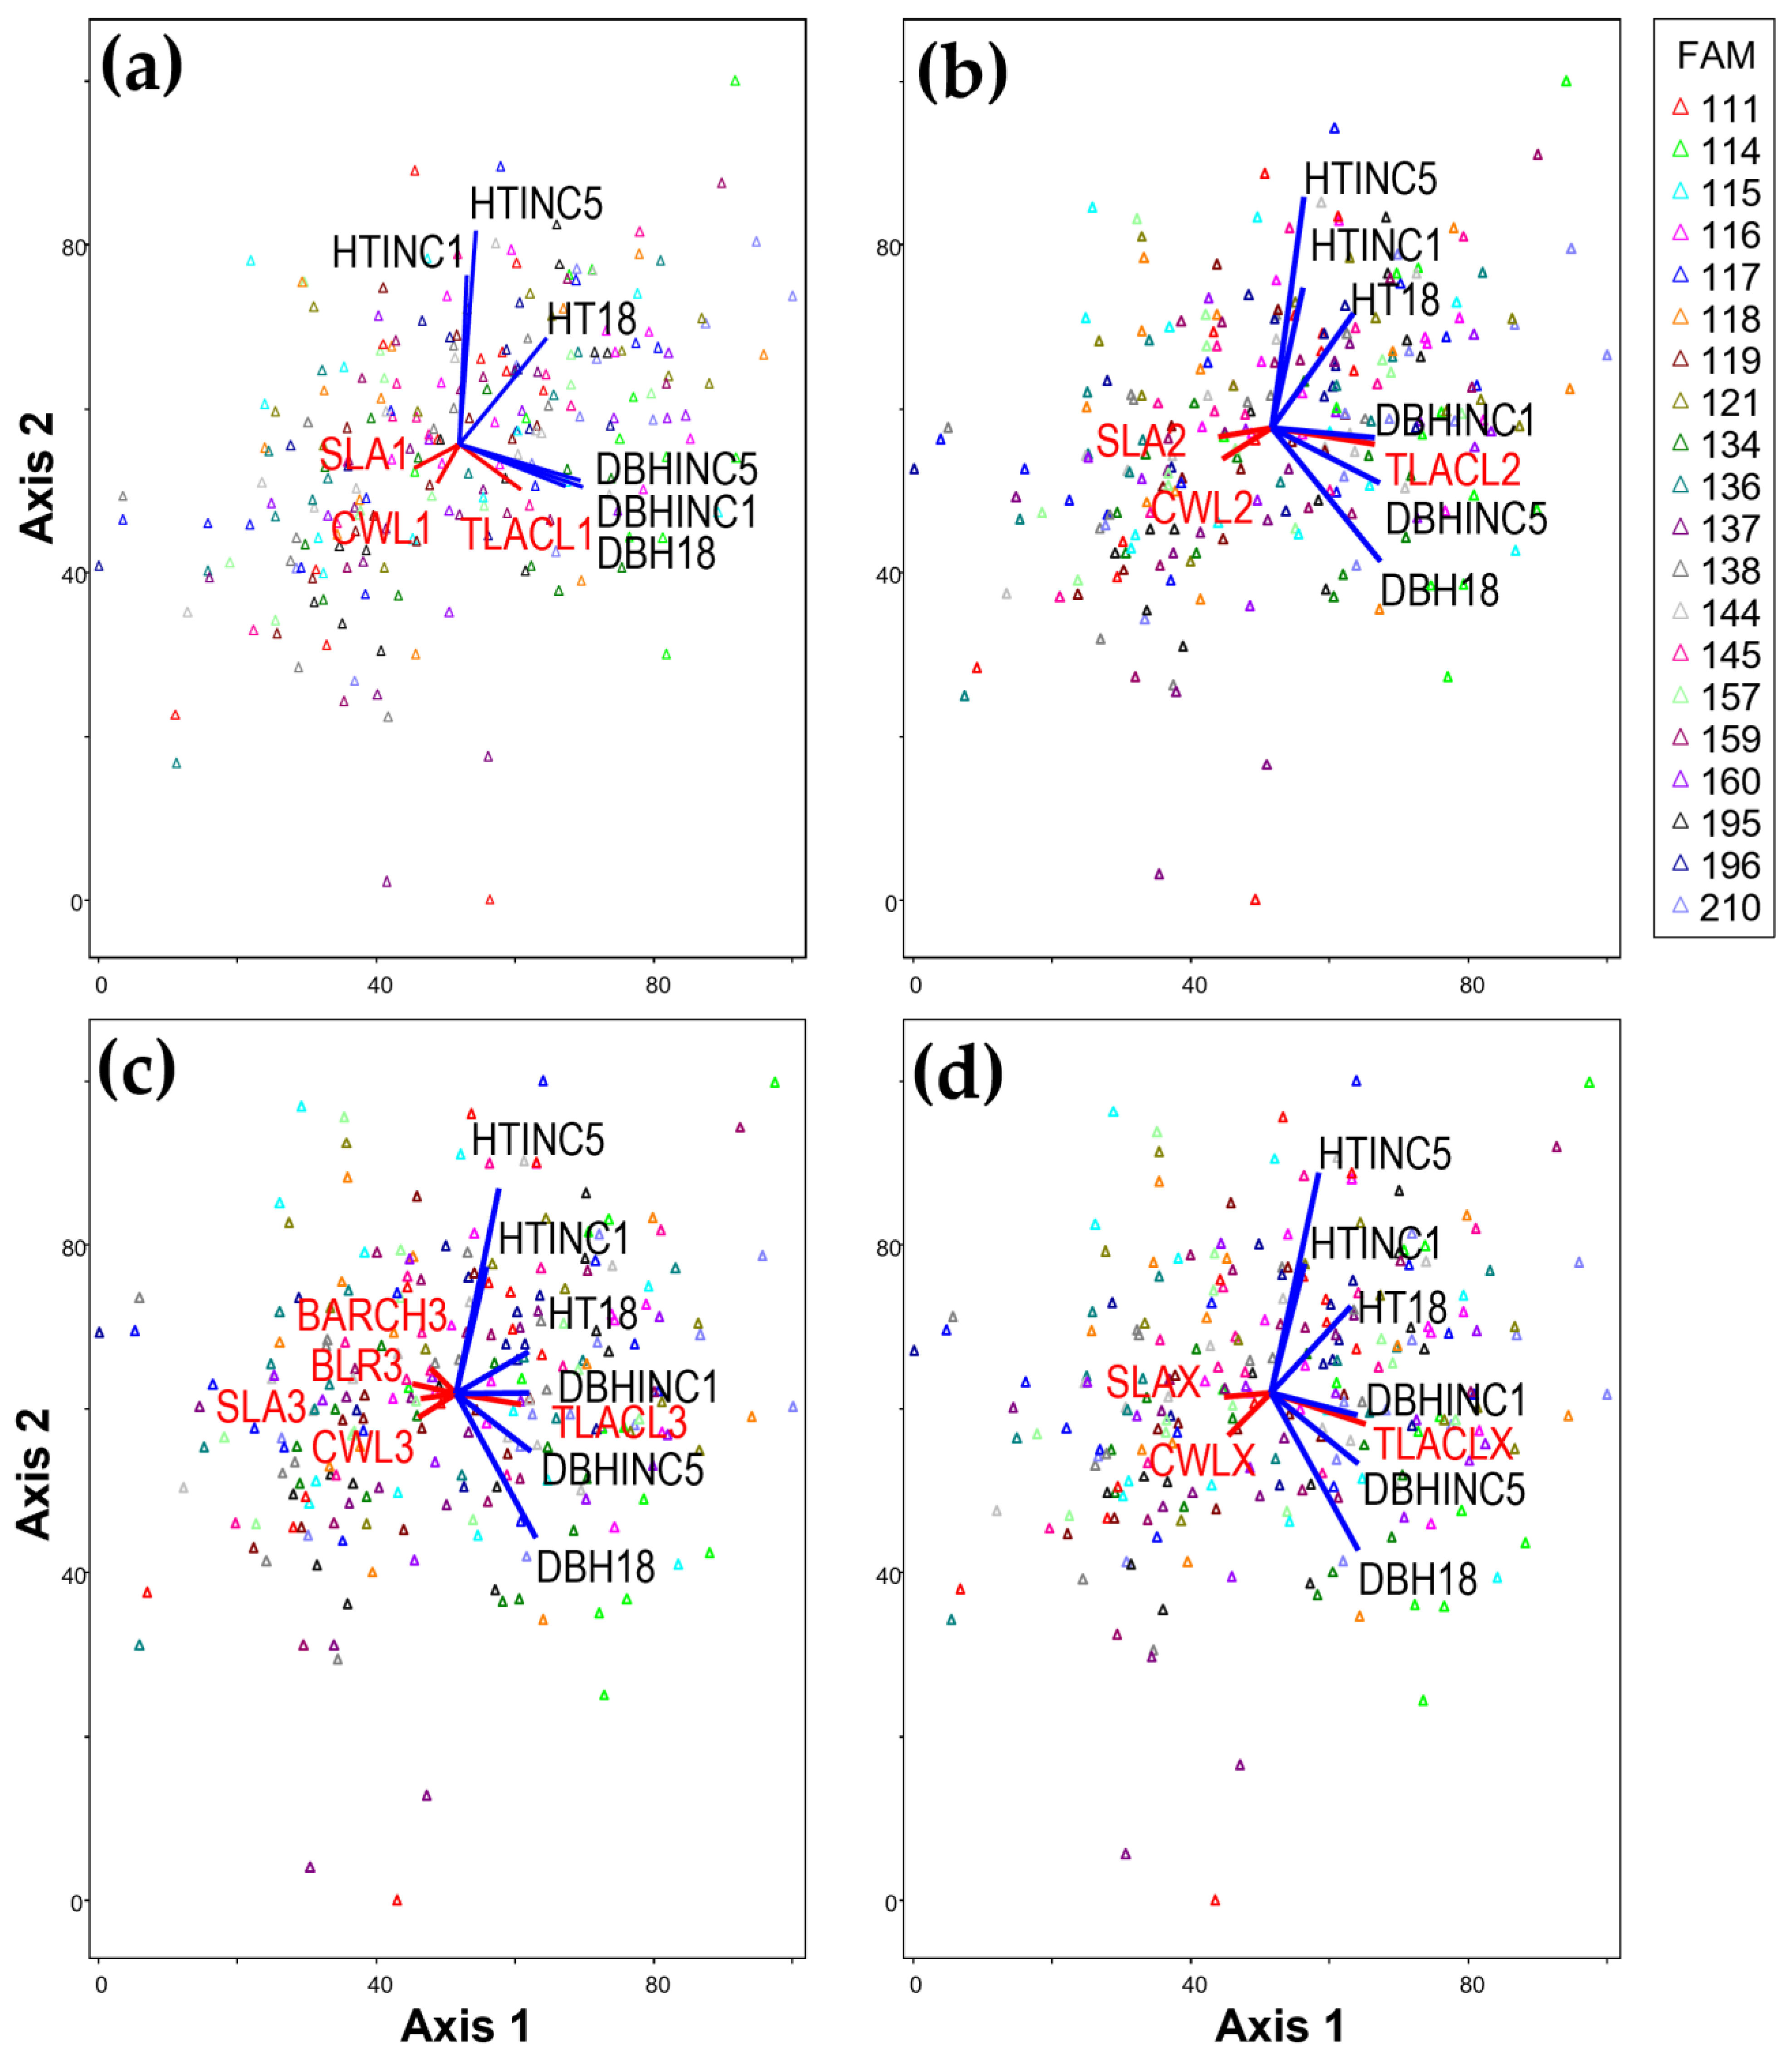
48] reported that variations in branch length and branch diameter were relatively small in the upper crown but increased in the lower crown in old-growth Douglas-fir. In the progeny test examined in this analysis, trees with a relatively steep branch angle (low angle from vertical, i.e., closer to vertical) and shorter branch lengths in the middle crown section tended to have higher total leaf area per crown length. However, in the top third of the crown, trees with relatively wider crown width tended to have greater total leaf area per crown length (
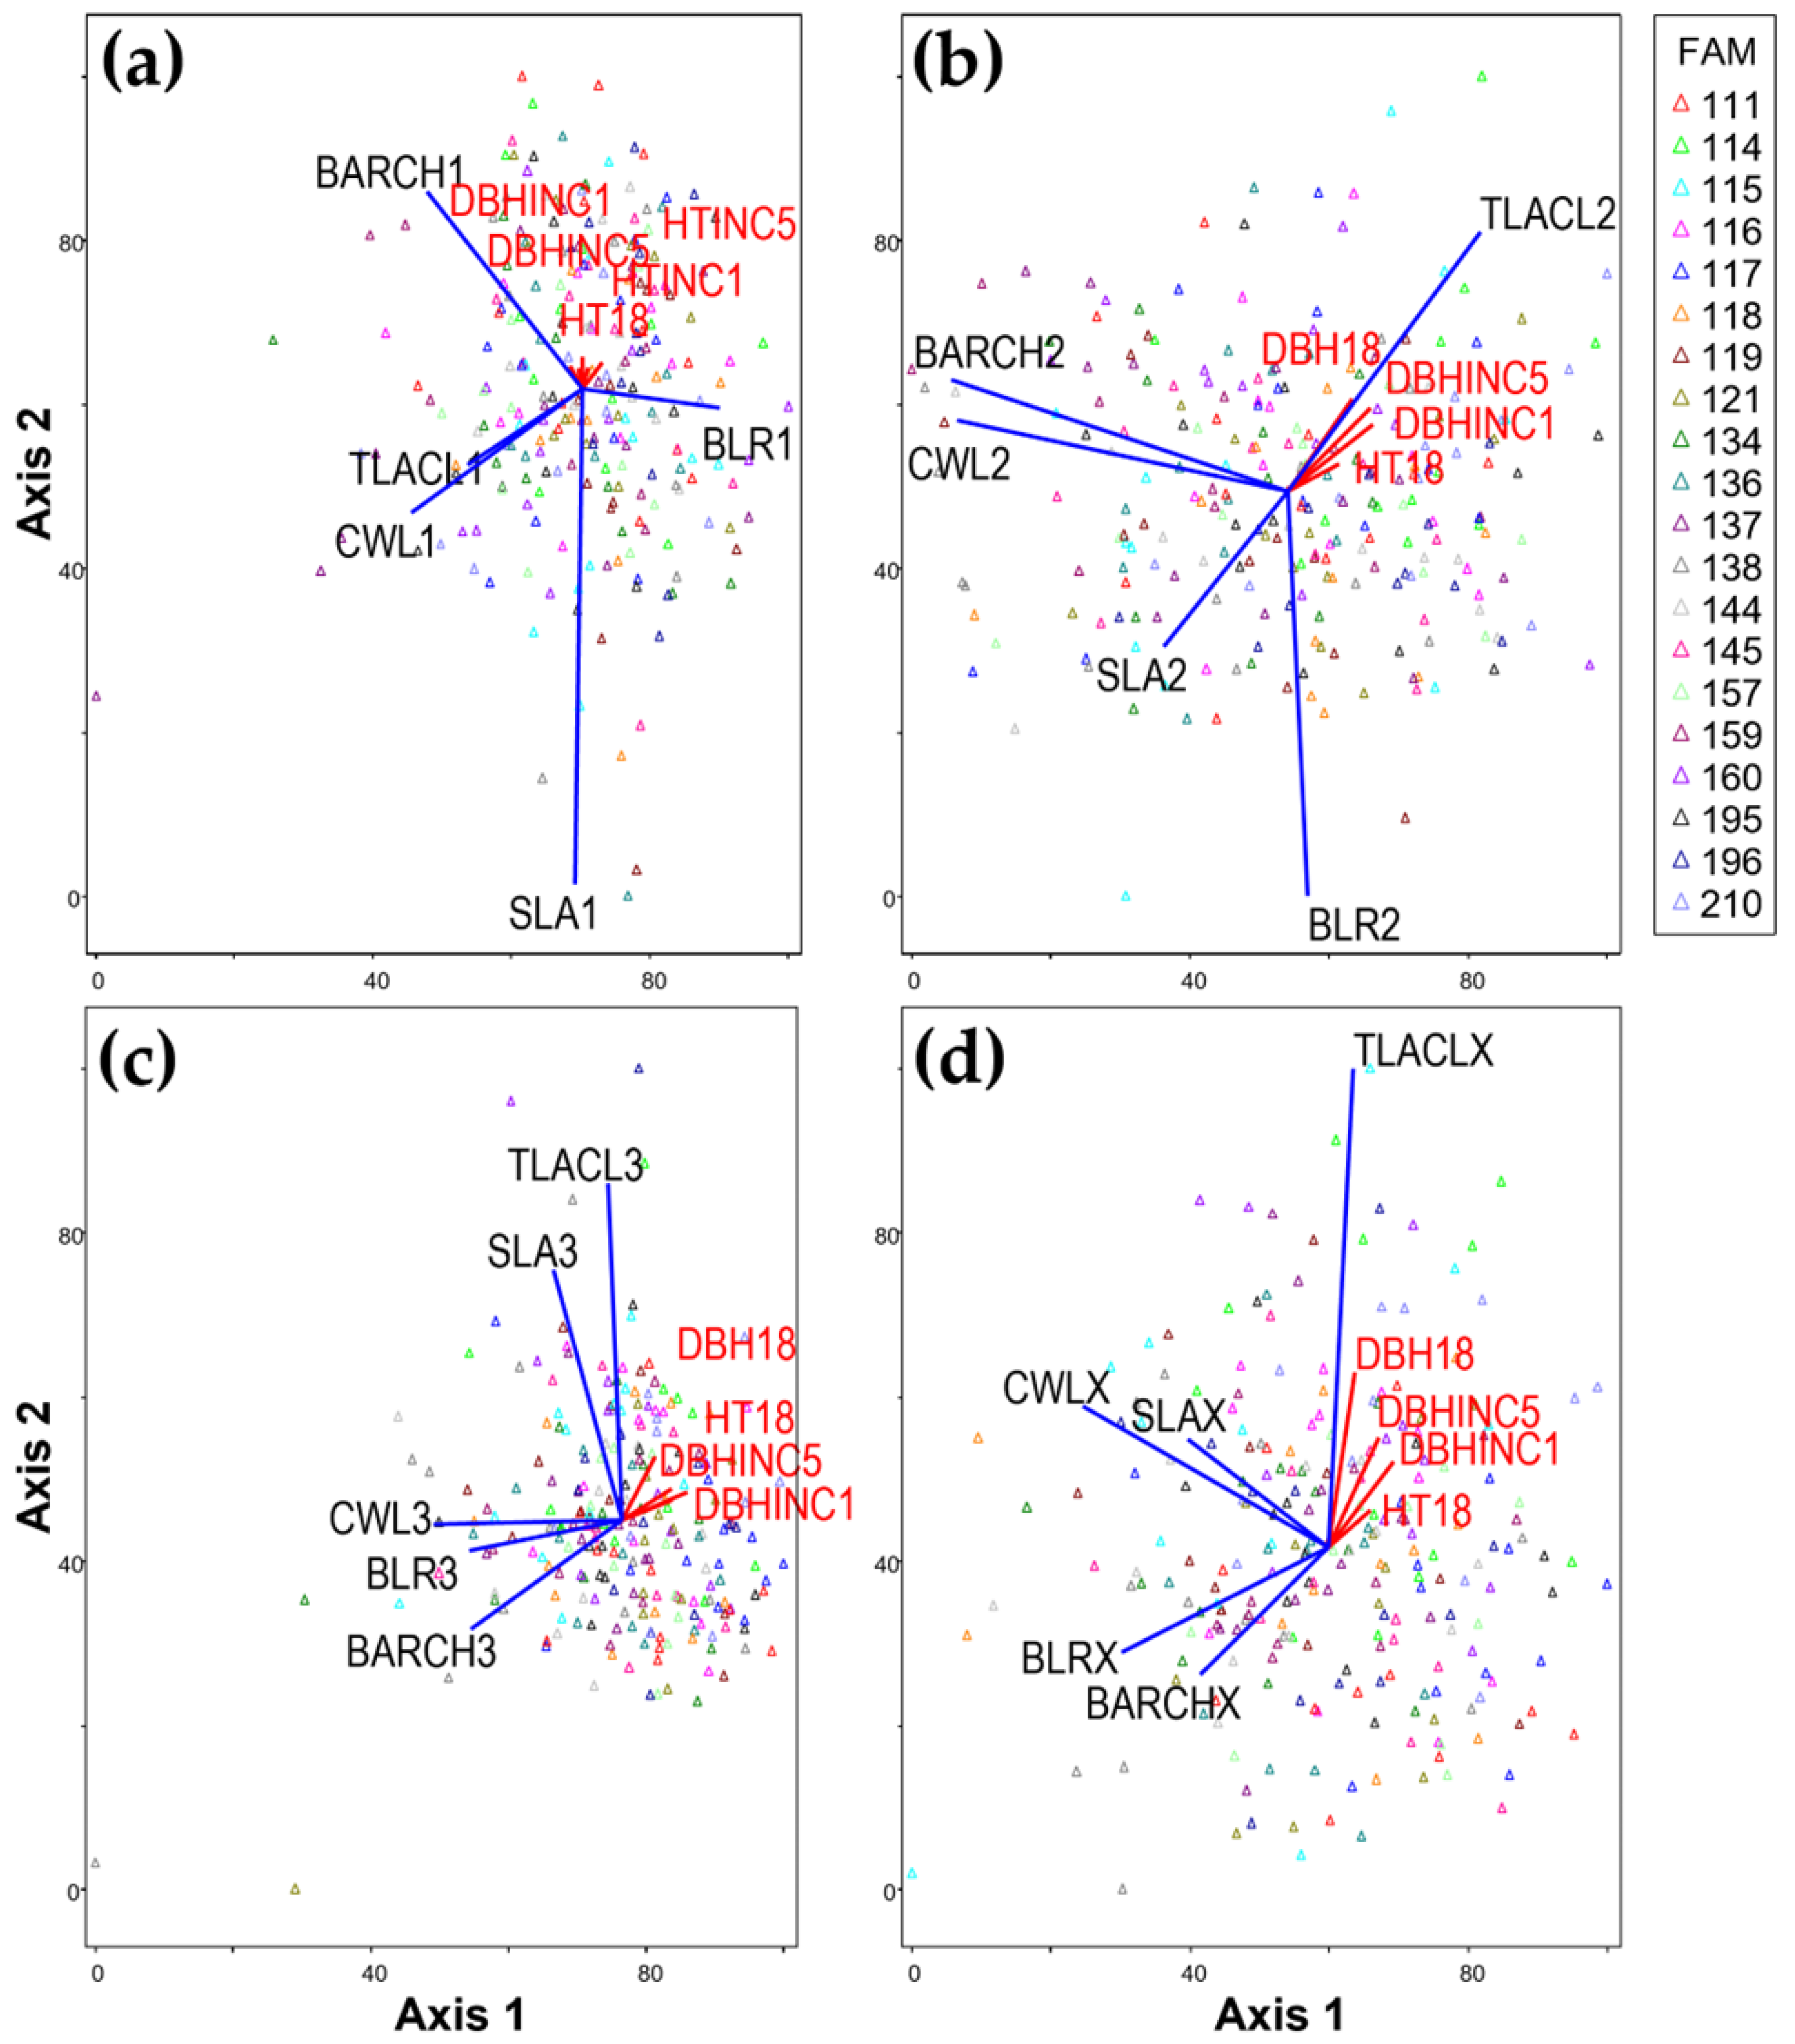
Figure 1a,b). The more umbrella shape implied by this latter pattern would be expected for trees and families with relatively slow height growth, short relative height in the stand, and therefore a poorer light environment [49]. In an analysis of Douglas-fir trees from southwestern Oregon, Hann [50] verified that dominant trees had a more conic profile, and understory trees were more parabolic in shape.
Branch angles tend to increase from the top to the crown base in Norway spruce [47] and Douglas-fir [51]. King et al. [39] reported that branch angle differs among Douglas-fir families. In this study, trees with relatively steep branch angles (more vertical) tended to have greater total leaf area per crown length, probably due to branch angle effects on effective leaf area [52] and a resulting increase in average light interception per unit leaf area [53]. However, the heritabilities for branch angle at a given relative crown height were low in all crown thirds and for the entire crown ( h i 2 = 0.01 − 0.08; h f 2 = 0.01 − 0.53). In contrast, branch angle had moderate heritabilities in Scots pine ( h i 2 = 0.22) [54], in Norway spruce ( h i 2 = 0.44; h f 2 = 0.65) [55], and in slash pine h i 2 = 0.33) [56].
Site index (e.g., [57]) remains a widely applied measure of site productivity in forest management. This measure relies on the pattern of past height growth rates in dominant and codominant trees on a given site, and height growth equations in growth models are typically constructed to provide height growth rates consistent with site index estimates (e.g., [58]). In the top crown section, Axis 2 explained 5.0% of the variation in 1-year and 5-year height increments (HTINC1 and HTINC5, respectively), while in the middle and bottom crown thirds, Axis 2 explained only 2.2% and 2.9%, respectively (Table 7). In these progeny tests, some variability in height growth was probably initiated and eventually accentuated by family differences in the measured crown attributes. Still, many potentially relevant variables like light availability, apical dominance, relative vigor of primary branches near the top of trees (e.g., [59]), and many others relevant to ecophysiological processes were not. Unfortunately, the latter class of variables cannot easily be applied in large-scale progeny testing and simulation of stand dynamics and stand growth.
In contrast to height growth, the total leaf area per crown length (TLACL) in all crown sections showed a strong positive correlation with diameter growth (DBHINC1, DBHINC5, and DBH18). Many studies have reported that whole-tree total leaf area or foliage biomass is correlated with sapwood cross-sectional area at breast height [60,61,62] and with DBH [63,64]. The former relationship is consistent with the pipe model theory [65] and the physiological balance between transpiring leaf area and the cross-sectional area of conducting stem tissue. The latter allometric relationship has long been recognized [66,67,68] as the functional relationship between total foliage amount and stem diameter growth [69] and even cross-sectional stem increment at a given height on the stem (Pressler [70] as cited in [69]). Relationships among total leaf area, crown width, crown shape, and stem growth have previously been analyzed in Norway spruce [47] and Scots pine [71]. Stemwood production per unit crown projection area was found higher in narrow-crowned trees, presumably partly because light could penetrate deeper into the inner and lower crown. In intensively managed plantations with uniform spacing, trees with a given height and diameter but lower CWL might intercept more solar radiation than those with a higher CWL [72].
Specific leaf area (SLA; cm2/g) in conifer species generally has increased from top to bottom of the crown and decreased with foliage age [63,73,74,75,76]. In this study, trees with larger DBH18, DBHINC1, DBHINC5, and higher social positions were negatively correlated with SLA in 2-dimensional RDA ordination. Other studies similarly have shown that increasing light exposure to leaves has led to lower SLA (i.e., greater specific leaf weight (g/cm2)) relative to shaded leaves [77,78]. The change in leaf structure causing these patterns in SLA has been related to needle thickness [79] and the number of palisade layers that can be sustained by differing intensities of incident photosynthetically active radiation (PAR) [80]. Although some studies have found that tree size in Douglas-fir was only weakly related to tree-average SLA [66,76], the influence of relative social position on tree-average SLA is much weaker than the within-crown trend with increasing depth into the crown. Fast-growing families in loblolly pine showed greater SLA than slow-growing families in the fourth growing season [45]; however, as would be expected, tree-average SLA was lower in families that also had greater foliage mass. The apparent difference from the Douglas-fir progeny test is probably due to the greater shade tolerance of Douglas-fir and perhaps lower genetic variability in the upper limit of SLA under increasing within-crown shade.
The weak negative correlation between DBH-related variables and both branch angle at a given relative crown height (BACRH) and branch length relative to stem diameter below whorl (BLR) was consistent with Campbell’s [81] findings that branch angle and length were not significantly correlated with stem volume. In contrast to results from the Douglas-fir progeny tests (Table 4), Birot and Christophe [82] reported that the branch angle in Douglas-fir had a high heritability (h2 = 0.49).
In this study, we found that fast-growing trees had higher TLACL. Highly heritable TLACL was strongly correlated with DBH growth and moderately correlated with height growth (Figure 2 and Table 4). This relationship may indicate a functional relationship; specifically, higher total leaf area per unit crown length in genetically superior families probably implies great light capture. TLACLX could profitably be incorporated into a diameter growth model to simulate family growth differences. In contrast, for a height growth model, TLACLX may not be sufficient to represent family differences. It is also possible that TLACLX is not appropriate for predicted height growth because the two are confounded; i.e., trees may exhibit lower TLACLX if faster growth causes greater distances between branches. TLACLX, in fact, had a weakly negative correlation with axes representing height increments (Table 8). Crown attributes indicating less total leaf area, wider branch angles, and longer branch length might be more important for predicting height increment, but they also may result from rather than cause more rapid growth (Table 8 and Figure 2). For modeling height growth, therefore, including other crown attributes such as CWLX in addition to TLACLX might better represent family differences, particularly if superior families have larger total leaf area for a given crown length and a lower ratio of crown width to crown length.

5. Conclusions

The multivariate analyses suggested that trees with relatively short branches and steeper branch angles tend to have higher total leaf area per unit crown length. This result may help confirm and quantify the crop ideotype concept by confirming that trees with narrow crown width, longer crown length, relatively shorter branch length, steeper branch angle, and higher total leaf area relative to crown length seem capable of greater volume growth. Theoretically, a given area may be able to carry more of these crop ideotype trees. To the extent that these crown attributes are heritable, the diameter growth rate on the trees from this progeny test conforms to the crop ideotype concept. In contrast, crop ideotype attributes had a less obvious link to the height growth rate. All crown thirds showed significant differences in crown structure among Douglas-fir families. Still, whole-tree crown attributes showed the biggest differences among families, followed successively by bottom, middle, and top crown thirds. Total leaf area per unit crown length (TLACL) could represent at least one of the mechanisms driving genetic gain in Douglas-fir families based on its high heritability and strong positive correlation with growth performance. If families could be indexed by either an empirical construct for TLACL and/or an associated process (e.g., light absorption and/or carbon allocation), they could represent potential gains from genetic improvement in diameter growth models. TLACL is less strongly correlated with height growth rate, so incorporating crown width relative to crown length may give better predictions for genetic effects on height growth.
For further research, a detailed comparison of total leaf area or foliage biomass between fast-growing and slow-growing families is needed. In particular, a comparison of shoot length, number of buds, needle size by age distribution, and needle density and retention would give a better understanding of differences in total leaf area or foliage biomass between fast-growing and slow-growing families. Progeny tests include a large number of genotypes, so field trials for all possible combinations of potential crop ideotypes would be prohibitive. However, incorporating crown structural attributes into our growth models may enhance our ability to simulate the growth implications of novel combinations of heritable traits that cannot be field tested.

Author Contributions

Methodology, S.J., D.A.M. and T.Z.Y.; formal analysis, S.J.; data curation, J.B.S.C. and S.J.; writing—original draft preparation, S.J.; writing—review and editing, D.A.M., S.J., J.B.S.C., T.Z.Y. and K.J.S.J.; supervision, D.A.M. All authors have read and agreed to the published version of the manuscript.

Funding

The Center for Intensive Planted-forest Silviculture (CIPS) at Oregon State University funded Sukhyun Joo during his dissertation research.

Data Availability Statement

Data sharing not applicable.

Conflicts of Interest

The authors declare no conflict of interest.

References

  1. Howe, G.T.; Jayawickrama, K.J.S.; Cherry, M.L.; Johnson, G.; Wheeler, N. Breeding Douglas-fir. In Plant Breeding Reviews; Janick, J., Ed.; John Wiley & Sons: Hoboken, NJ, USA, 2006; Volume 27, pp. 245–353. [Google Scholar]
  2. Jayawickrama, K.J.S.; Ye, T.Z.; Truong, H. Northwest Tree Improvement Cooperative (NWTIC) Annual Report; Department of Forest Ecosystems and Society, College of Forestry, Oregon State University: Corvallis, OR, USA, 2017; pp. 1–32. [Google Scholar]
  3. Silen, R.R.; Wheat, J.G. Progressive tree improvement program in coastal Douglas-fir. J. For. 1979, 77, 78–83. [Google Scholar]
  4. Lipow, S.R.; Johnson, G.R.; Claiff, J.B.S.; Jayawickrama, K.J. The role of tree improvement programs for ex situ gene conservation of coastal Douglas-fir in the Pacific Northwest. For. Genet. 2003, 10, 111–120. [Google Scholar]
  5. Carson, S.D.; Garcia, O.; Hayes, J.D. Realized gain and prediction of yield with genetically improved Pinus radiata in New Zealand. For. Sci. 1999, 45, 186–200. [Google Scholar]
  6. St. Clair, J.B.; Mandel, N.; Jayawickrama, K. Early realized genetic gains for coastal Douglas-fir in the northern Oregon Cascades. West. J. Appl. For. 2004, 19, 195–201. [Google Scholar] [CrossRef] [Green Version]
  7. Ye, T.Z.; Jayawickrama, K.J.S.; St Clair, J.B. Realized gains from block-plot coastal Douglas-fir trials in the northern Oregon Cascades. Silvae Genet. 2010, 59, 29–39. [Google Scholar] [CrossRef] [Green Version]
  8. Ye, T.Z.; Jayawickrama, K.J.S. Early selection for improving volume growth in coastal Douglas-fir breeding programs. Silvae Genet. 2012, 61, 186–198. [Google Scholar] [CrossRef] [Green Version]
  9. Martin, T.A.; Johnsen, K.H.; White, T.L. Ideotype development in southern pines: Rationale and strategies for overcoming scale-related obstacles. For. Sci. 2001, 47, 21–28. [Google Scholar]
  10. St. Clair, J.B.; Adams, W.T. Relative family performance and variance structure of open-pollinated Douglas-fir seedlings grown in three competitive environments. TAG Theor. Appl. Genet. 1991, 81, 541–550. [Google Scholar] [CrossRef]
  11. Donald, C.M. The breeding of crop ideotypes. Euphytica 1968, 17, 385–403. [Google Scholar] [CrossRef]
  12. Donald, C.M. A barley breeding programme based on an ideotype. JAS 1979, 93, 261–269. [Google Scholar] [CrossRef]
  13. Donald, C.M.; Hamblin, J. The biological yield and harvest index of cereals as agronomic and plant breeding criteria. Adv. Agron. 1976, 28, 361–405. [Google Scholar] [CrossRef]
  14. Donald, C.M.; Hamblin, J. The convergent evolution of annual seed crops in agriculture. Adv. Agron. 1983, 36, 97–143. [Google Scholar] [CrossRef]
  15. Dickmann, D.I. The ideotype concept applied to forest trees. In Attributes of Trees as Crop Plants; Cannell, M.G.R., Jackson, J.E., Eds.; Institute of Terrestrial Ecology: Huntington, UK, 1985; pp. 89–101. [Google Scholar]
  16. Cannell, M.G.R. Improving per hectare forest productivity. In Proceedings of the Fifth North American Forest Biology Workshop, Gainesville, FL, USA, 13–15 March 1978; pp. 120–148. [Google Scholar]
  17. Cannell, M.G.R. Biological opportunities for genetic improvement in forest productivity. In Proceedings of the Ecology of Even-Aged Forest Plantations; Institute of Terrestrial Ecology: Edinburgh, UK, 1979; pp. 119–144. [Google Scholar]
  18. Dickmann, D.I. Role of physiology in forest tree improvement. Silva Fenn. 1991, 25, 248–256. [Google Scholar] [CrossRef] [Green Version]
  19. Dickmann, D.I.; Gold, M.A.; Flore, J.A. The ideotype concept and the genetic improvement of tree crops. Plant Breed. Rev. 1994, 12, 163–193. [Google Scholar]
  20. Martin, T.A.; Dougherty, P.M.; Topa, M.A.; McKeand, S.E. Strategies and case studies for incorporating ecophysiology into southern pine tree improvement programs. South. J. Appl. For. 2005, 29, 70–79. [Google Scholar] [CrossRef] [Green Version]
  21. Buford, M.A.; Burkhart, H.E. Genetic improvement effects on growth and yield of loblolly pine plantations. For. Sci. 1987, 33, 707–724. [Google Scholar]
  22. Gould, P.; Johnson, R.; Marshall, D.; Johnson, G. Estimation of genetic-gain multipliers for modeling Douglas-fir height and diameter growth. For. Sci. 2008, 54, 588–596. [Google Scholar]
  23. Gould, P.J.; Marshall, D.D. Incorporation of genetic gain into growth projections of Douglas-fir using ORGANON and the forest vegetation simulator. West. J. Appl. For. 2010, 25, 55–61. [Google Scholar] [CrossRef] [Green Version]
  24. St. Clair, J.B. Genetic variation in tree structure and its relation to size in Douglas-fir. I. Biomass partitioning, foliage efficiency, stem form, and wood density. Can. J. For. Res. 1994, 24, 1226–1235. [Google Scholar] [CrossRef]
  25. St. Clair, J.B. Genetic variation in tree structure and its relation to size in Douglas-fir. II. Crown form, branch characters, and foliage characters. Can. J. For. Res. 1994, 24, 1236–1247. [Google Scholar] [CrossRef]
  26. McCune, B.; Mefford, M. PC-ORD: Multivariate Analysis of Ecological Data; Version 7; MjM Software Design: Gleneden Beach, OR, USA, 2016; p. 34. [Google Scholar]
  27. McCune, B.; Root, H.T. Origin of the dust bunny distribution in ecological community data. Plant Ecol. 2015, 216, 645–656. [Google Scholar] [CrossRef]
  28. Anderson, M.J. A new method for non-parametric multivariate analysis of variance. Austral Ecol. 2001, 26, 32–46. [Google Scholar] [CrossRef]
  29. ter Braak, C.J. Canonical community ordination. Part I: Basic theory and linear methods. Ecoscience 1994, 1, 127–140. [Google Scholar] [CrossRef]
  30. van Wijngaarden, R.P.; van Den Brink, P.J.; Voshaar, J.H.O.; Leeuwangh, P. Ordination techniques for analysing response of biological communities to toxic stress in experimental ecosystems. Ecotoxicology 1995, 4, 61–77. [Google Scholar] [CrossRef]
  31. McCune, B.; Grace, J.B.; Urban, D.L. Analysis of Ecological Communities; MjM Software Design: Gleneden Beach, OR, USA, 2002; Volume 28, p. 300. [Google Scholar]
  32. Legendre, P.; Oksanen, J.; Ter Braak, C.J. Testing the significance of canonical axes in redundancy analysis. Methods Ecol. Evol. 2011, 2, 269–277. [Google Scholar] [CrossRef]
  33. R Core Team. R: A Language and Environment for Statistical Computing; R Foundation for Statistical Computing: Vienna, Austria, 2018; Version 3.5.0.; Available online: http://www.R-project.org/ (accessed on 29 September 2018).
  34. Falconer, D.S.; Mackay, T.F.C. Introduction to Quantitative Genetics; Longman: New York, NY, USA, 1996; p. 464. [Google Scholar]
  35. Baker, R.J. Selection Indices in Plant Breeding; CRC Press, Inc.: Boca Raton, FL, USA, 1986; p. 218. [Google Scholar]
  36. Isik, F.; Holland, J.; Maltecca, C. Genetic Data Analysis for Plant and Animal Breeding; Springer International Publishing: Cham, Switzerland, 2017; p. 400. [Google Scholar]
  37. Butler, D.; Cullis, B.; Gilmour, A.; Gogel, B.; Thompson, R. ASReml-R Reference Manual Version 4; VSN International Ltd.: Hemel Hempstead, UK, 2017; p. 176. [Google Scholar]
  38. Jackson, D.A. Stopping rules in principal components analysis: A comparison of heuristical and statistical approaches. Ecology 1993, 74, 2204–2214. [Google Scholar] [CrossRef]
  39. King, J.N.; Yeh, F.C.; Heaman, J.C.; Dancik, B.P. Selection of Crown Form Traits in Controlled Crosses of Coastal Douglas-fir. Silvae Genet. 1992, 41, 362–370. [Google Scholar]
  40. Vargas-Hernandez, J.; Adams, W.; Joyce, D. Quantitative genetic structure of stem form and branching traits in Douglas-fir seedlings and implications for early selection. Silvae Genet. 2003, 52, 36. [Google Scholar]
  41. Gould, P.J.; St. Clair, J.B.; Anderson, P.D. Performance of full-sib families of Douglas-fir in pure-family and mixed-family deployments. For. Ecol. Manag. 2011, 262, 1417–1425. [Google Scholar] [CrossRef]
  42. Chmura, D.J.; Rahman, M.S.; Tjoelker, M.G. Crown structure and biomass allocation patterns modulate aboveground productivity in young loblolly pine and slash pine. For. Ecol. Manag. 2007, 243, 219–230. [Google Scholar] [CrossRef]
  43. Chmura, D.J.; Tjoelker, M.G. Leaf traits in relation to crown development, light interception and growth of elite families of loblolly and slash pine. Tree Physiol. 2008, 28, 729–742. [Google Scholar] [CrossRef] [Green Version]
  44. Chmura, D.J.; Tjoelker, M.G.; Martin, T.A. Environmental and genetic effects on crown shape in young loblolly pine plantations. Can. J. For. Res. 2009, 39, 691–698. [Google Scholar] [CrossRef]
  45. McCrady, R.; Jokela, E. Growth phenology and crown structure of selected loblolly pine families planted at two spacings. For. Sci. 1996, 42, 46–57. [Google Scholar]
  46. McGarvey, R.C.; Martin, T.A.; White, T.L. Integrating within-crown variation in net photosynthesis in loblolly and slash pine families. Tree Physiol. 2004, 24, 1209–1220. [Google Scholar] [CrossRef] [Green Version]
  47. Kuuluvainen, T. Crown architecture and stemwood production in Norway spruce (Picea abies (L.) Karst.). Tree Physiol. 1988, 4, 337–346. [Google Scholar] [CrossRef]
  48. Ishii, H.; Wilson, M.E. Crown structure of old-growth Douglas-fir in the western Cascade Range, Washington. Can. J. For. Res. 2001, 31, 1250–1261. [Google Scholar] [CrossRef]
  49. Oliver, C.D.; Larson, B.C. Forest Stand Dynamics; John Wiley & Sons, Inc.: New York, NY, USA, 1996; p. 520. [Google Scholar]
  50. Hann, D.W. An adjustable predictor of crown profile for stand-grown Douglas-fir trees. For. Sci. 1999, 45, 217–225. [Google Scholar]
  51. Roeh, R.L.; Maguire, D.A. Crown profile models based on branch attributes in coastal Douglas-fir. For. Ecol. Manag. 1997, 96, 77–100. [Google Scholar] [CrossRef]
  52. Honda, H.; Fisher, J.B. Tree branch angle: Maximizing effective leaf area. Science 1978, 199, 888–890. [Google Scholar] [CrossRef]
  53. Fisher, J.B.; Honda, H. Branch Geometry and Effective Leaf Area: A Study of Terminalia-Branching Pattern. 1. Theoretical Trees. Am. J. Bot. 1979, 66, 633–644. [Google Scholar] [CrossRef]
  54. Velling, P.; Tigerstedt, P. Harvest index in a progeny test of Scots pine with reference to the model of selection. Silva Fenn. 1984, 18, 21–32. [Google Scholar] [CrossRef] [Green Version]
  55. Merrill, R.; Mohn, C. Heritability and genetic correlations for stem diameter and branch characteristics in white spruce. Can. J. For. Res. 1985, 15, 494–497. [Google Scholar] [CrossRef]
  56. Strickland, R.; Goddard, R. Inheritance of branching and crown characteristics in slash pine. In Proceedings of the 8th southern Conference on Forest Tree Improvement, Savannah, GA, USA, 16–17 June 1965; pp. 16–17. [Google Scholar]
  57. King, J.E. Site index curves for Douglas-fir in the Pacific Northwest. In Weyerhaeuser Forestry Paper 8; Forestry Research Center, Weyerhaeuser Company: Centralia, WA, USA, 1966; p. 49. [Google Scholar]
  58. Hann, D.W.; Ritchie, M.W. Height growth rate of Douglas-fir: A comparison of model forms. For. Sci. 1988, 34, 165–175. [Google Scholar]
  59. Rasmussen, H.N.; Veierskov, B.; Hansen-Møller, J.; Nørbæk, R. “Lateral control”: Phytohormone relations in the conifer treetop and the short-and long-term effects of bud excision in Abies nordmanniana. J. Plant Growth Regul. 2010, 29, 268–279. [Google Scholar] [CrossRef]
  60. Grier, C.C.; Waring, R.H. Conifer foliage mass related to sapwood area. For. Sci. 1974, 20, 205–206. [Google Scholar]
  61. Maguire, D.A.; Bennett, W.S. Patterns in vertical distribution of foliage in young coastal Douglas-fir. Can. J. For. Res. 1996, 26, 1991–2005. [Google Scholar] [CrossRef]
  62. Monserud, R.A.; Marshall, J.D. Allometric crown relations in three northern Idaho conifer species. Can. J. For. Res. 1999, 29, 521–535. [Google Scholar] [CrossRef]
  63. Borghetti, M.; Vendramin, G.; Giannini, R. Specific leaf area and leaf area index distribution in a young Douglas-fir plantation. Can. J. For. Res. 1986, 16, 1283–1288. [Google Scholar] [CrossRef]
  64. Espinosa Bancalari, M.; Perry, D.; Marshall, J.D. Leaf area–sapwood area relationships in adjacent young Douglas-fir stands with different early growth rates. Can. J. For. Res. 1987, 17, 174–180. [Google Scholar] [CrossRef]
  65. Shinozaki, K.; Yoda, K.; Hozumi, K.; Kira, T. A quantitative analysis of plant form-the pipe model theory: I. Basic analyses. Jap. J. Ecol. 1964, 14, 97–105. [Google Scholar] [CrossRef]
  66. Bartelink, H. Allometric relationships on biomass and needle area of Douglas-fir. For. Ecol. Manag. 1996, 86, 193–203. [Google Scholar] [CrossRef]
  67. Kittredge, J. Estimation of the amount of foliage of trees and stands. J. For. 1944, 42, 905–912. [Google Scholar]
  68. Gholz, H.L.; Grier, C.; Campbell, A.; Brown, A. Equations for Estimating Biomass and Leaf Area of Plants in the Pacific Northwest; Oregon State University: Corvallis, OR, USA, 1979; p. 39. [Google Scholar]
  69. Assmann, E. The Principles of Forest Yield Study: Studies in the Organic Production, Structure, Increment and Yield of Forest Stands; Pergamon Press: New York, NY, USA, 1970; p. 506. [Google Scholar]
  70. Pressler, M. Das Gesetz der Stammbildung; Arnloldische Buchhandlung: Leipzig, Germany, 1865; p. 153. [Google Scholar]
  71. Kuuluvainen, T.; Kanninen, M. Patterns in aboveground carbon allocation and tree architecture that favor stem growth in young Scots pine from high latitudes. Tree Physiol. 1992, 10, 69–80. [Google Scholar] [CrossRef]
  72. Horn, H.S. The Adaptive Geometry of Trees; Princeton University Press: Princeton, NJ, USA, 1971; p. 144. [Google Scholar]
  73. Del Rio, E.; Berg, A. Specific leaf area of Douglas-fir reproduction as affected by light and needle age. For. Sci. 1979, 25, 183–186. [Google Scholar]
  74. Ishii, H.; Ford, E.D.; Boscolo, M.E.; Manriquez, A.C.; Wilson, M.E.; Hinckley, T.M. Variation in specific needle area of old-growth Douglas-fir in relation to needle age, within-crown position and epicormic shoot production. Tree Physiol. 2002, 22, 31–40. [Google Scholar] [CrossRef] [Green Version]
  75. Smith, R.; Waring, R.; Perry, D. Interpreting foliar analyses from Douglas-fir as weight per unit of leaf area. Can. J. For. Res. 1981, 11, 593–598. [Google Scholar] [CrossRef]
  76. Weiskittel, A.R.; Temesgen, H.; Wilson, D.S.; Maguire, D.A. Sources of within- and between-stand variability in specific leaf area of three ecologically distinct conifer species. Ann. For. Sci. 2008, 65, 103. [Google Scholar] [CrossRef] [Green Version]
  77. Oren, R.; Schulze, E.-D.; Matyssek, R.; Zimmermann, R. Estimating photosynthetic rate and annual carbon gain in conifers from specific leaf weight and leaf biomass. Oecologia 1986, 70, 187–193. [Google Scholar] [CrossRef]
  78. Pierce, L.L.; Running, S.W.; Walker, J. Regional-scale relationships of leaf area index to specific leaf area and leaf nitrogen content. Ecol. Appl. 1994, 4, 313–321. [Google Scholar] [CrossRef] [Green Version]
  79. Niinemets, Ü.; Kull, O. Effects of light availability and tree size on the architecture of assimilative surface in the canopy of Picea abies: Variation in needle morphology. Tree Physiol. 1995, 15, 307–315. [Google Scholar] [CrossRef] [PubMed] [Green Version]
  80. Kramer, P. Physiology of Woody Plants; Academic Press: New York, NY, USA, 2012; p. 826. [Google Scholar]
  81. Campbell, R.K. Phenotypic correlation among branch and upper-crown stem attributes in Douglas-fir. For. Sci. 1963, 9, 444–451. [Google Scholar]
  82. Birot, Y.; Christophe, C. Genetic structures and expected genetic gains from multitrait selection in wild populations of Douglas fir and Sitka spruce. I. Genetic variation between and within populations. Silvae Genet. 1983, 32, 141–151. [Google Scholar]
Figure 1. Growth performance variables (red lines with cutoff r2 ≥ 0.05) overlaid on results from PCA ordinations of sample units in crown attribute space for top crown third (a), middle crown third (b), bottom crown third (c), and entire live crown (d). Sample points are individual trees, and blue lines show correlations of crown attributes with the ordination space. See Table 1 and Table 2 for crown attribute and growth performance abbreviations and descriptions. FAM indicates family in the progeny test.
Forests 14 01263 g001
Figure 2. The RDA ordinations of sample units in growth performance space related to crown attributes as explanatory variables (red lines with cutoff r2 = 0.05): top crown (a), middle crown (b), bottom crown (c), and whole-tree (d). The points are individual trees. The lengths and directions of red and blue lines show a correlation with the ordination. See Table 1 and Table 2 for crown attribute and growth performance abbreviations and descriptions. FAM indicates family in the progeny test.
Forests 14 01263 g002
Table 1. Crown attributes, their definitions, units, and minimum, mean, and maximum values for the trees sampled from progeny tests by St. Clair [24,25]. (Sample size for both live crown third and whole tree attributes = 240).
AttributeDefinitionUnitsMinMeanMax
BLR1Branch length relative to stem diameter at whorl—top crownm/cm0.210.330.46
BLR2Branch length relative to stem diameter at whorl—middle crownm/cm0.200.280.38
BLR3Branch length relative to stem diameter at whorl—bottom crownm/cm0.150.220.31
BLRXAverage branch length relative to average stem diameter at whorlm/cm0.210.270.38
SLA1Specific leaf area—top crowncm2/g39.254.072.4
SLA2Specific leaf area—middle crowncm2/g46.457.778.7
SLA3Specific leaf area—bottom crowncm2/g50.564.696.1
SLAXAverage specific leaf areacm2/g48.158.880.9
TLACL1Total leaf area per crown third length—top crowncm2/m0.200.953.80
TLACL2Total leaf area per crown third length—middle crowncm2/m1.568.6019.8
TLACL3Total leaf area per crown third length—bottom crowncm2/m3.2410.426.7
TLACLXTotal leaf area per crown lengthcm2/m2.126.6413.4
CWL1Crown third width relative to crown third length—top crownm/m0.200.370.96
CWL2Crown third width relative to crown third length—middle crownm/m0.440.701.26
CWL3Crown third width relative to crown third length—bottom crownm/m0.591.101.75
CWLXCrown width relative to crown lengthm/m0.330.470.69
BARCH1Branch angle in given relative crown height—top crown°35.963.5104.5
BARCH2Branch angle in given relative crown height—middle crown°45.6104.1186.2
BARCH3Branch angle in given relative crown height—bottom crown°128.2357.32840
BARCHXAverage branch angle in given average relative crown height°60.2110.7189.6
Table 2. Growth performance variables, definitions, units, minimum, mean, and maximum for the trees sampled from progeny tests by St. Clair [24,25]. (Sample size = 240 trees).
VariableDefinitionUnitMinMeanMax
HT18Cumulative height growth to age 18m9.9014.518.4
DBH18Cumulative diameter growth to breast height at age 18cm8.9018.026.1
HTINC1Last 1-year height growthm0.201.041.70
DBHINC1Last 1-year diameter growth at breast heightcm0.160.721.30
HTINC5Last 5-year height growthm3.805.587.70
DBHINC5Last 5-year diameter growth at breast heightcm2.425.127.86
Table 3. Statistical outcomes from PERMANOVA test of the null hypothesis of no family differences in crown attributes.
Crown SectionSourceDegrees of FreedomSum of SquaresMean SquarePseudo F-Statisticp-Value
TopBlock564.2412.8483.0310.0002
Family19128.116.7431.5910.002
Residual95402.654.238
Total119595.00
MiddleBlock561.5812.3172.9750.0002
Family19140.107.3741.7810.0002
Residual95393.324.140
Total119595.00
BottomBlock5821.1216.4244.2100.0002
Family19142.277.4881.9190.0002
Residual95370.613.901
Total119595.00
Whole-treeBlock5102.5420.5085.7510.0002
Family19153.708.0902.2690.0002
Residual95338.763.566
Total119595.00
Table 4. Estimations of individual-tree narrow sense heritability ( h i 2 ) and family-mean heritability ( h f 2 ) with standard errors.
Crown SectionCrown Attribute h i 2 h f 2
TopBLR10.27 (0.15)0.96 (0.02)
SLA10.08 (0.22)0.87 (0.33)
TLACL10.35 (0.18)0.89 (0.11)
CWL10.12 (0.13)0.65 (0.33)
BARCH1<0.01 (<0.001)<0.01 (<0.001)
MiddleBLR20.19 (0.14)0.79 (0.21)
SLA20.08 (0.31)0.59 (0.44)
TLACL20.31 (0.35)0.88 (0.12)
CWL20.31 (0.16)0.94 (0.13)
BARCH20.08 (3.69)0.53 (2.24)
BottomBLR30.29 (0.16)0.96 (0.02)
SLA30.02 (0.15)0.65 (1.57)
TLACL30.36 (0.47)0.97 (0.04)
CWL30.30 (0.16)0.96 (0.02)
BARCH3<0.01 (0.002)<0.01 (0.18)
Whole-treeBLRX0.36 (0.18)0.95 (0.11)
SLAX0.11 (0.32)0.90 (0.27)
TLACLX0.50 (0.28)0.98 (0.01)
CWLX0.27 (0.15)0.96 (0.02)
BARCHX0.07 (2.29)0.50 (1.51)
Table 5. Percent of variance explained in PCA ordination axes and estimations of individual-tree narrow sense heritability ( h i 2 ) and family-mean heritability ( h f 2 ) with standard errors for PCA1 and PCA2.
Crown SectionAxisVariance Explained (%) h i 2 h f 2
Top130.30.04 (0.11)0.34 (0.72)
221.40.12 (0.12)0.79 (0.33)
Cumulative51.7
Middle131.50.28 (0.17)0.83 (0.15)
223.90.05 (0.12)0.40 (0.57)
Cumulative55.4
Bottom133.20.32 (0.18)0.97 (0.02)
222.30.17 (0.14)0.94 (0.05)
Cumulative55.5
Whole-tree130.20.49 (0.22)0.98 (0.01)
221.80.41 (0.19)0.97 (0.01)
Cumulative52.0
Table 6. Pearson correlations (r) (PCA loadings) between ordination axes and crown attribute and growth performance variables using PCA.
AttributeCrown SectionVariabler
Axis 1Axis 2
Crown attributeTopBLR10.58−0.04
SLA1−0.03−0.93
TLACL1−0.48−0.14
CWL1−0.72−0.23
BARCH1−0.650.37
MiddleBLR20.05−0.85
SLA2−0.30−0.33
TLACL20.460.54
CWL2−0.790.15
BARCH2−0.800.23
BottomBLR3−0.67−0.07
SLA3−0.300.61
TLACL3−0.060.82
CWL3−0.83−0.01
BARCH3−0.66−0.27
Whole−treeBLRX−0.68−0.20
SLAX−0.460.21
TLACLX0.080.93
CWLX−0.810.27
BARCHX−0.42−0.25
Growth performanceWhole−treeHT180.350.30
DBH180.280.65
HTINC10.130.02
DBHINC10.430.46
HTINC50.18−0.01
DBHINC50.380.52
Table 7. Percent of variance explained in RDA ordination axes as growth performance variables (response variables) as a function of crown attribute variables (explanatory variables) and statistical outcomes from a marginal test of canonical axes.
Crown SectionAxisVariance Explained (%)F-Statisticp-Value
Top114.943.70.001
25.014.60.001
Cumulative19.9
Middle132.8118.40.001
22.27.90.01
Cumulative35.0
Bottom132.2116.90.001
22.910.60.002
Cumulative35.1
Whole-tree141.0181.00.001
25.624.60.001
Cumulative46.6
Table 8. Pearson correlations (r) between growth performances, whole-tree crown attributes, and ordination axes using RDA.
Variabler
Axis 1Axis 2
Growth performance
(Response variable)
HT180.890.35
DBH180.87−0.15
HTINC10.510.68
DBHINC10.89−0.02
HTINC50.640.80
DBHINC50.92−0.08
Crown attribute
(Explanatory variable)
BLRX−0.180.19
SLAX−0.32−0.03
TLACLX0.66−0.24
CWLX−0.29−0.32
BARCHX−0.060.22
Table 9. The ANOVA permutation test in RDA for crown attributes.
Crown SectionCrown AttributePseudo Fp-Value
TopBLR12.770.047
SLA17.970.001
TLACL130.540.001
CWL111.310.001
BARCH17.560.003
MiddleBLR20.970.378
SLA214.850.001
TLACL274.770.001
CWL214.390.001
BARCH23.990.017
BottomBLR38.110.001
SLA319.990.001
TLACL369.230.001
CWL318.810.001
BARCH36.250.003
Whole-treeBLRX10.050.002
SLAX17.490.001
TLACLX136.250.001
CWLX47.330.001
BARCHX10.290.002
Disclaimer/Publisher’s Note: The statements, opinions and data contained in all publications are solely those of the individual author(s) and contributor(s) and not of MDPI and/or the editor(s). MDPI and/or the editor(s) disclaim responsibility for any injury to people or property resulting from any ideas, methods, instructions or products referred to in the content.

