Article

Evaluation of Soil Quality in Five Ages of Chinese Fir Plantations in Subtropical China Based on a Structural Equation Model

1
Faculty of Forestry, Central South University of Forestry and Technology, Changsha 410004, China
2
Key Laboratory of State Forestry Administration on Forest Resources Management and Monitoring in Southern Area, Changsha 410004, China
3
National Engineering Laboratory of Applied Technology for Forestry and Ecology in Southern China, Changsha 410004, China
4
College of Arts and Sciences, Saint Xavier University, Chicago, IL 60655, USA
*
Authors to whom correspondence should be addressed.
Forests 2023, 14(6), 1217; https://doi.org/10.3390/f14061217
Submission received: 27 April 2023 / Revised: 9 June 2023 / Accepted: 9 June 2023 / Published: 12 June 2023

Abstract

:
Soil quality evaluation provides necessary and fundamental data and information for understanding the current situation of the soils and for promoting the sustainable use of land resources. In this study, soil quality was assessed by developing a structural equation model (SEM) in five aged Chinese fir plantations, located in the same soil type, with similar site conditions, in Subtropical China. A total of 150 soil samples were taken from the five aged stands of Chinese fir forests: 8-year-old young forests (stand I), 14-year-old middle-aged forests (stand II), 20-year-old near-mature forests (stand III), 26-year-old mature forests (stand VI), and 33-year-old over-mature forests (stand V). Fifteen soil indicators, including soil bulk density (BD), capillary porosity (CP), total capillary porosity (TCP), water holding capacity (WHC), soil organic matter (SOM), total nitrogen (TN), available nitrogen (AN), available phosphorus (AP), available potassium (AK), soil pH, soil acid phosphatase (ACP), invertase (INV), urease (URE), and catalase (CAT), were measured. The SEM was used to determine the weight of each soil indicator, and the soil quality index (SQI) was estimated for the Chinese fir plantations. Results showed that soil physical indicators, such as BD, CP, TCP, WHC, and chemical indicators, including SOM, TN, and AN, significantly degraded in stand II groups compared with the stand I groups, but were significantly recovered in the stand III groups. However, the enzyme activity of soil biological indicators had different patterns with changes in soil physical and chemical properties. The calculated SQI in the studied Chinese fir forests ranged from 0.4084 to 0.7298, which was significantly higher in the stand V and lower in the stand II (middle-aged stand) than in the other four aged stands (p < 0.05). The SEM weight analysis showed that the BD, SOM, and ACP were the most important indicators affecting the physical, chemical, and biological properties of the soils in Chinese fir forests in the study area. This study provided an innovative scientific approach for estimating the weight of SQI in forests and a theoretical basis and practical application for sustainable management of Chinese fir forest ecosystems.

1. Introduction

Soil is an important component in forest ecosystems, providing water, nutrients, and physical support for the growth and development of trees and other forest plants [1]. Soil quality, reflecting the ability of soils to contribute to ecosystem services, directly affects the forest’s productivity, wildlife habitats, ecosystem functioning, and human health [2,3,4]. However, soil quality is a comprehensive concept in terrestrial ecosystems, and the description and interpretation of soil quality may vary in different scientific disciplines and various habitats. Soil quality index (SQI) is a measurable soil parameter that assesses the capacity of a soil to perform a specific function [5]. It is defined as “the minimum set of parameters that, when interrelated, provides numerical data on the capacity of soil to carry out one or more functions”. The most common method for calculating SQI was described by [5], and later, several scientists followed this methodology for different locations and management goals. Thus, selecting suitable indicators and choosing appropriate assessment approaches to accurately measure soil quality have been long-term targets in agricultural, environmental, and soil sciences [6].
A variety of soil quality evaluation approaches have been developed, including the multivariate indicator kriging [7], the integrated soil quality scoring [8], the relative soil quality [9], the soil quality index [10,11], the grey correlation analysis [12], the material element [13], the soil management assessment framework [14], and the fuzzy association rules [15]. Among these attempts, soil quality index (SQI) is a mostly accepted method for assessing soil quality due to its simplicity and quantitative flexibility [16].
In the soil quality index approach, each of the selected soil property indicators are scored and weighted. A scoring function is used to convert the selected soil property indicators into unitless values for quantification. The affiliation, linear, and non-linear methods are commonly used as the scoring function in soil sciences recently [17]. The determination of the weighting of soil property indicators can be divided into two ways: objective weighting method and subjective weighting method. The objective weighting method has been widely used for the principal component analysis [18,19], the rough set method [20], Nemerov index method [21], and Delphi method [22]. The objective weighting method respects the objective authenticity of the original data but relies too much on the internal relationships within the data and rarely considers prior theoretical knowledge [23,24]. The subjective weighting method is mainly adopted for analytic hierarchy process [25,26]. However, the subjective weighting method has a disadvantage of relying on a human’s prior knowledge, which is greatly disturbed by human subjective consciousness [18,20]. In addition, this method rarely considers the interdependence among evaluation indicators. Therefore, it is reasonable and necessary to develop a new method to determine the weights of the soil quality indicators.
The structural equation model (SEM) has been used for simulating the complex relationship in socio-economic systems [27,28]. Soil quality evaluation is a complex system engineering tool which involves many soil indicators, and there are complex relationships among various soil quality indexes [29,30]. The path analysis diagram generated by the SEM can clearly reveal the complex and the inherent logical relationships among various indicators, calculate the path coefficients, and objectively assign weights to the indicators [31,32]. Additionally, SEM fully uses the information of original data, overcoming the influence of multicollinearity and avoiding the subjective errors of index weighting caused by scoring function [27,33].
Chinese fir (Cunninghamia lanceolata (Lamb.) Hook) is one of the most important afforestation tree species. It has more than 1000 years of cultivation history and was widely distributed in subtropical China, due to the advantages of fast growth, high yields, and strong adaptability [34]. However, due to irrational afforestation and forest management practices, such as full reclamation and large-scale clear-cutting, slash and burn cultivation, and monoculture with the large-scale planting of pure Chinese fir plantations in forest communities, have resulted in soil degradation, such as loss in soil nutrients, increase in pests, and decline in soil quality. These impacts seriously affect forest stand growth and sustainable management in Chinese fir forests [33,35]. Therefore, it is urgent to improve the soil quality and soil fertility and to maintain the rapid growth and high yield of Chinese fir plantations for sustainable forest management.
This study aimed to develop an innovative method to precisely assess soil quality in differently aged Chinese fir forests, to enable sustainable management of Chinese fir ecosystems. The objectives of this study were (1) to determine the changes in soil properties in five differently aged stands of Chinese fir plantations, and (2) to develop and use SEM to evaluate the soil quality in the selected Chinese fir forests.

2. Materials and Methods
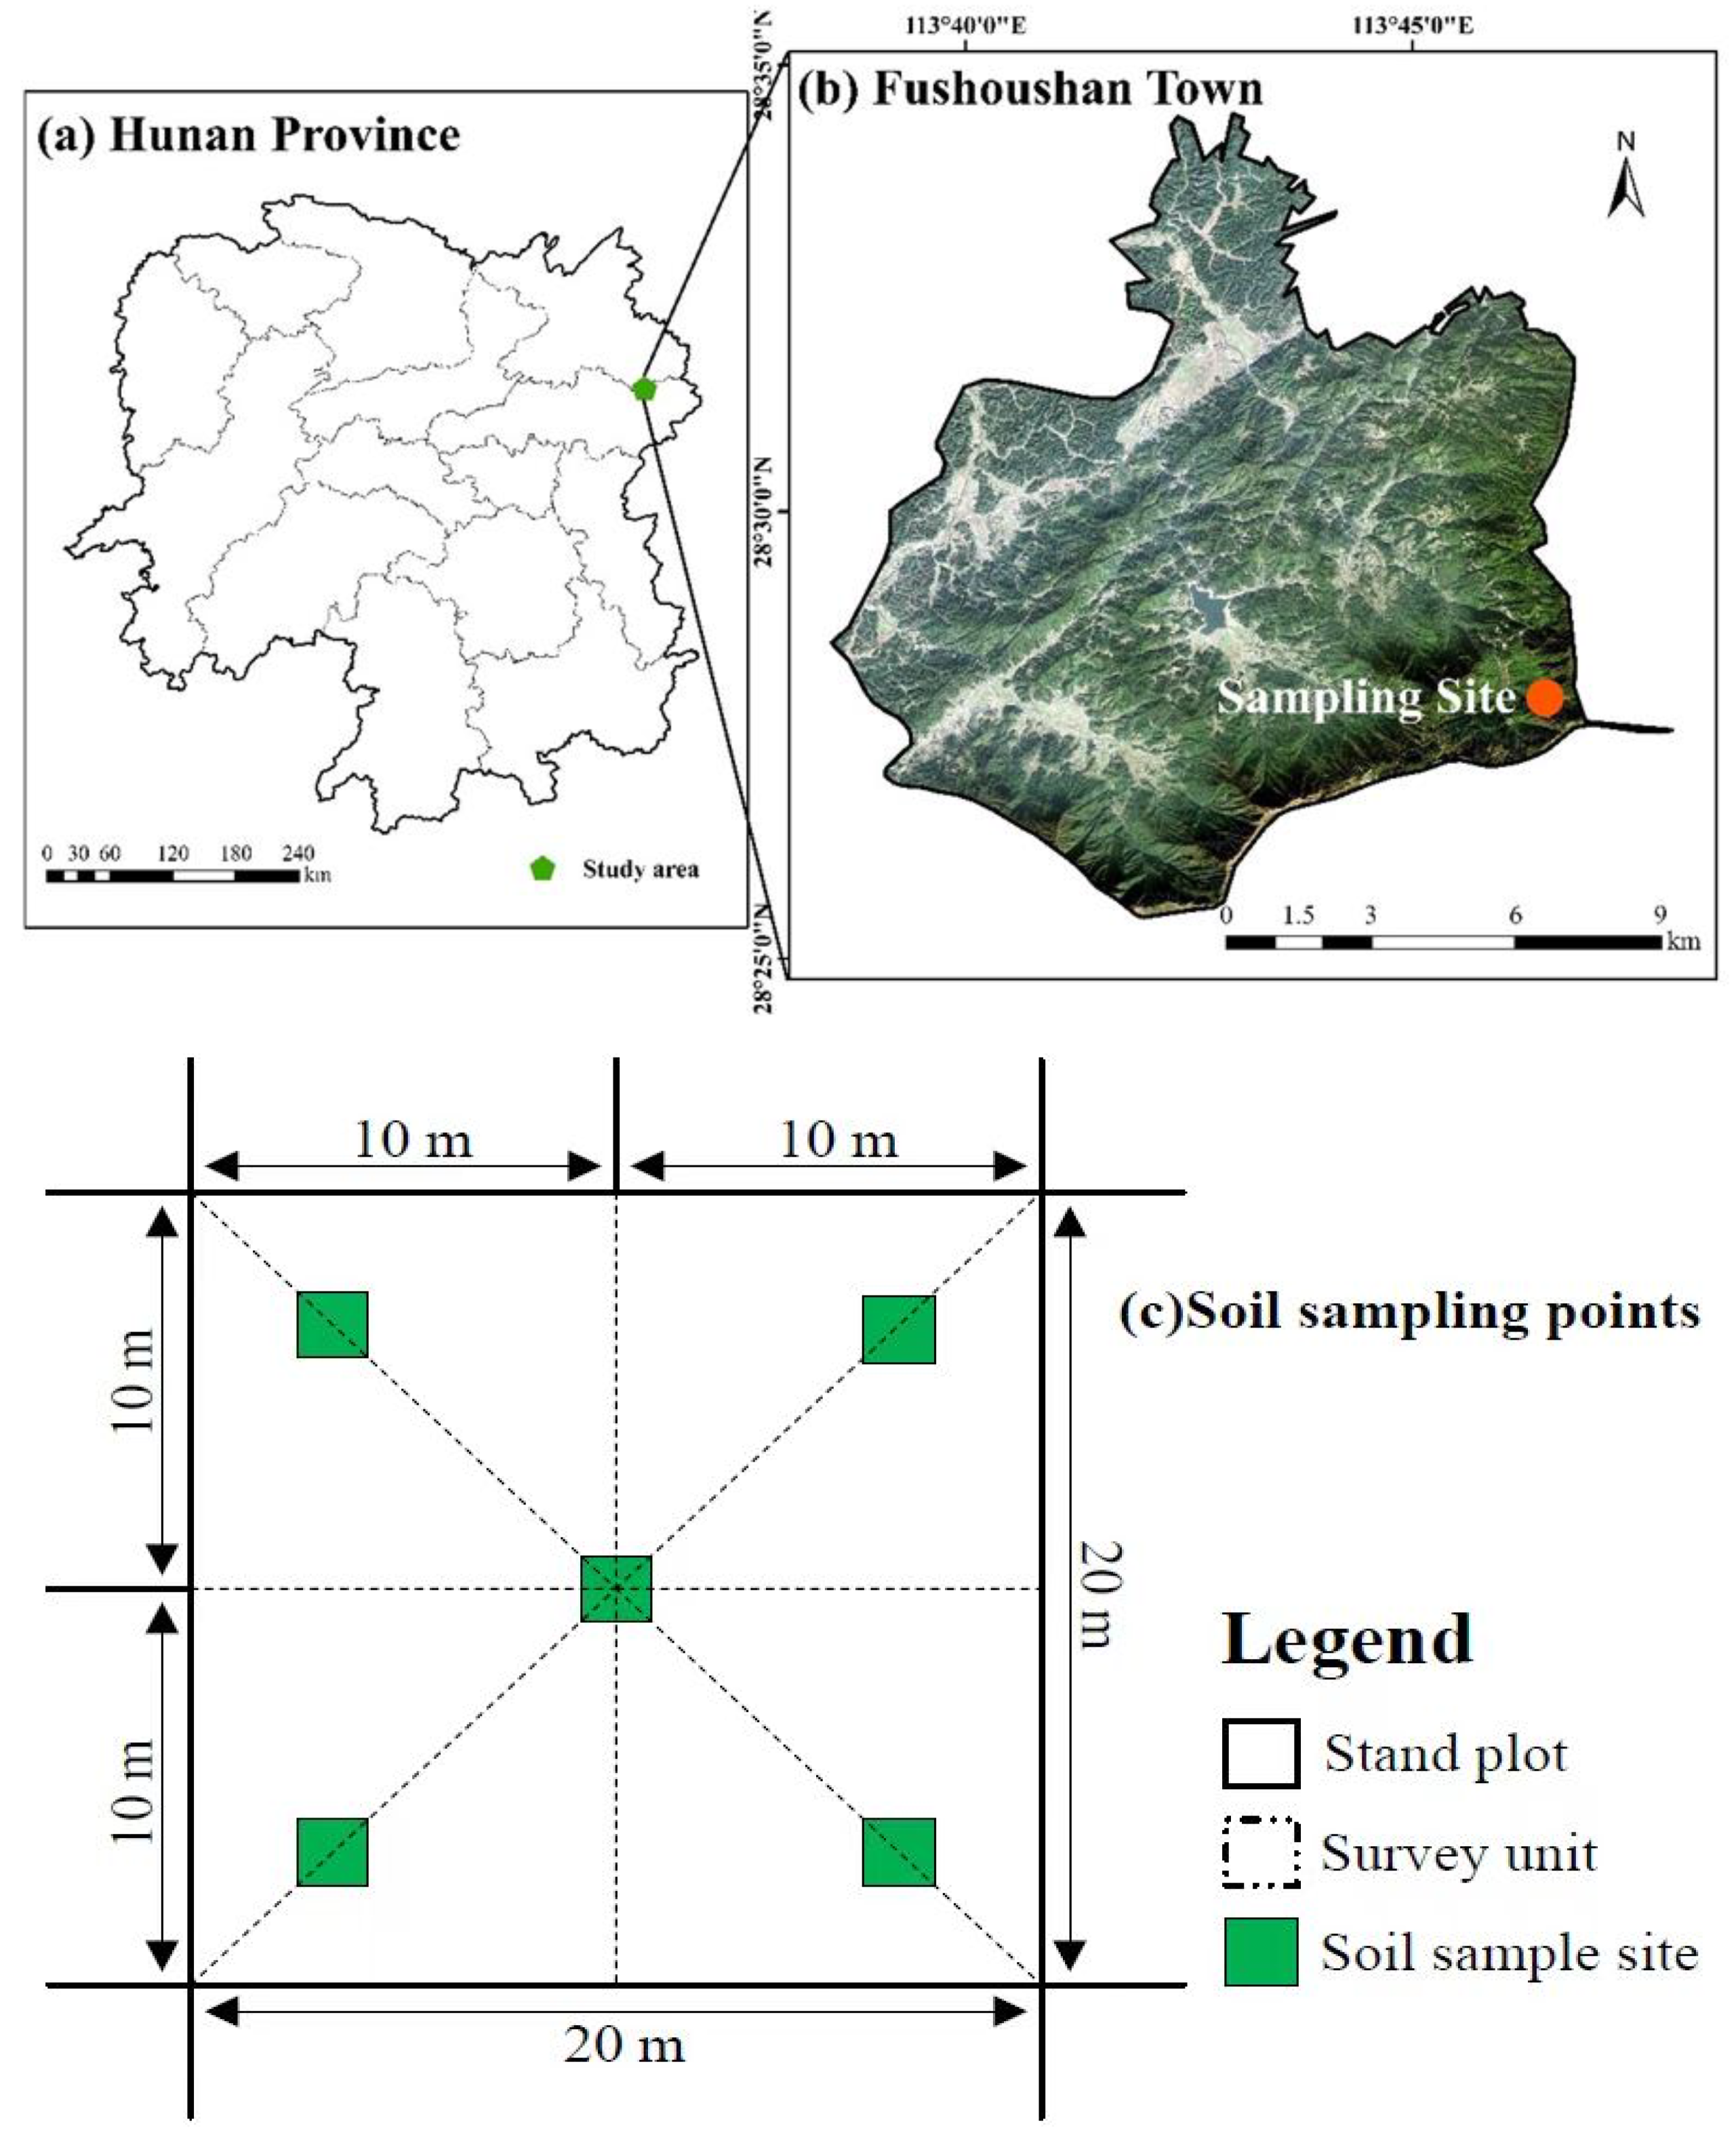
2.1. Study Area

The study was carried out in Fushoushan Town, Pingjiang County, Hunan Province, China (28°03′00″–28°32′30″ N, 113°41′15″–113°45′00″ E) (Figure 1a). The total area of the forest is about 1134 ha, including the public welfare forests of about 914 ha, covered by subtropical evergreen broad-leaved forest vegetation. The slopes of the study area ranged 22–37°. The climate of the study site is a typical subtropical humid monsoon with an annual average temperature and precipitation of 12.1 °C and 2100 mm, respectively. The landform is comprised of hills, with elevation of 835–1573 m. The soil is mountainous yellow loam developed from metamorphic shale and sandstone, with high weathering degree and is slightly acidic with soil pH 4.57. The most dominant tree species in overstory are Chinese fir (Cunninghamia lanceolata (Lamb.) and bamboo (Phyllostachys heterocycle), the dominant shrubs are rhododendron (Rhododendron simsii) and Chinese sumac (Rhus chinensis), and the herbaceous understory is primarily composed of Japanese silvergrass (Miscanthus floridulus) and fern (Pteridophyta).

2.2. Experimental Design and Data Collection

A split-plot design was used in the experiment with the stand age as the main factor and the soil depth as the subfactor. In the study sites, five age groups of Chinese fir plantations with the similar site conditions were selected. They were young (8-year-old, age group I), middle-aged (14-year-old, age group II), near-mature (20-year-old, age group III), mature (26-year-old, age group IV), and over-mature (33-year-old. age group V) stands. The five age groups of Chinese fir plantations were established in 1987, 1994, 2000, 2006, and 2012, respectively. In all, 5 plots of 20 m × 20 m were set up for each of the age groups of Chinese fir stands. Thus, a total of 25 plots were established in the experiment for data collection. The diameters at the breast height (DBH) > 2.0 cm and tree heights of all trees of Chinese fir within the plots were numbered and measured. Triplicate measurements were conducted in the experimental plots. The latest measurement data are shown in Table 1.
Five soil sampling points were set up in an S-shape, distributed throughout each of the sample plots, with similar elevation and slopes (Figure 1c). Soil samples were collected from 0–15 cm and 15–30 cm soil layers by using a soil auger with an inner diameter of 4.5 cm at the sampling point. After removal of plant roots and debris, the soil samples from the five sampling points of the same soil depth in each plot were pooled as one mixed soil sample. Thus, 50 soil samples (5 aged stands × 5 replications × 2 soil depths = 50) were collected in this study. Each soil sample was sealed in a clean plastic bag and brought back into the lab for further processing and analysis. Fresh soil samples were stored in a refrigerator at 4 °C to determine soil enzyme activity. A portion of soil samples was air-dried and screened to determine soil chemical properties. The soil physical properties, including soil bulk density (BD), capillary porosity (CP), non-capillary porosity (NCP), total capillary porosity (TCP), and water holding capacity (WHC), were determined by the ring knife method.
The soil organic matter (SOM) was determined by the potassium dichromate oxidation method; soil total nitrogen (TN) was determined by the Kjeldahl method; soil total phosphorus (TP) was determined by the sodium hydroxidealkaline solution–molybdenumantimony anti-colorimetric method; soil available nitrogen (AN) was determined by using the alkaline diffusion method; soil available phosphorus (AP) was determined by using the sodium bicarbonate leaching molybdenum antimony anti-colorimetric method; soil available potassium (AK) content was determined by using the ammonium acetate leaching–flame photometric method, and the soil pH was determined by using the 1:25 soil–water ratio potentiometric method [36].
The soil urease (URE) activity was determined by using the sodium phenol–sodium hypochlorite chromogenic method; soil invertase (INV) activity was determined by the 3,5-dinitrosalicylic acid chromogenic method; soil acid phosphatase (ACP) activity was determined by using the sodium benzyl phosphate colorimetric method; and soil catalase (CAT) was determined by using the potassium permanganate titration method [37].
In this study, a total of 150 soil samples were used to develop the SEM. The latest 50 soil samples were used to evaluate the soil quality of Chinese fir forests. The characteristics of the Chinese fir forests are shown in Table 1.

2.3. Variable Selection and Model Construction

SEM is a multivariate statistical analysis method for building, estimating, and testing causal models. It includes regression analysis, factor analysis, path analysis, and multivariate analysis of variance and is divided into measurement models and structural models. The formula is as follows [38,39]:
X = Λ x ξ + δ
Y = Λ y η + ε
η = B η + Γ ξ + ζ
Equations (1) and (2) are the measurement model, where X is the measured variable for ξ , Y is the measured variable for η , ξ is the exogenous latent variable, η is the endogenous latent variable, δ   a n d   ε are the measurement error vectors, and Λ x , Λ y are the correlation coefficient matrices for the measured variables X and Y and the latent variables ξ and η . Equation (3) is a structural model that represents the causal relationship between the latent variables, where B denotes the correlation coefficient matrix between the endogenous latent variables, Γ represents the influence of the exogenous latent variable ξ on the endogenous latent variable η , and ζ represents the unexplained error of the model, which is the error in the endogenous latent variable.
Five steps were involved building the SEM, determining the weight of the selected indicators in the SEM, and calculating soil quality: theoretical model construction, model assumptions, data reliability and validity testing, model estimation and testing, and model revision.

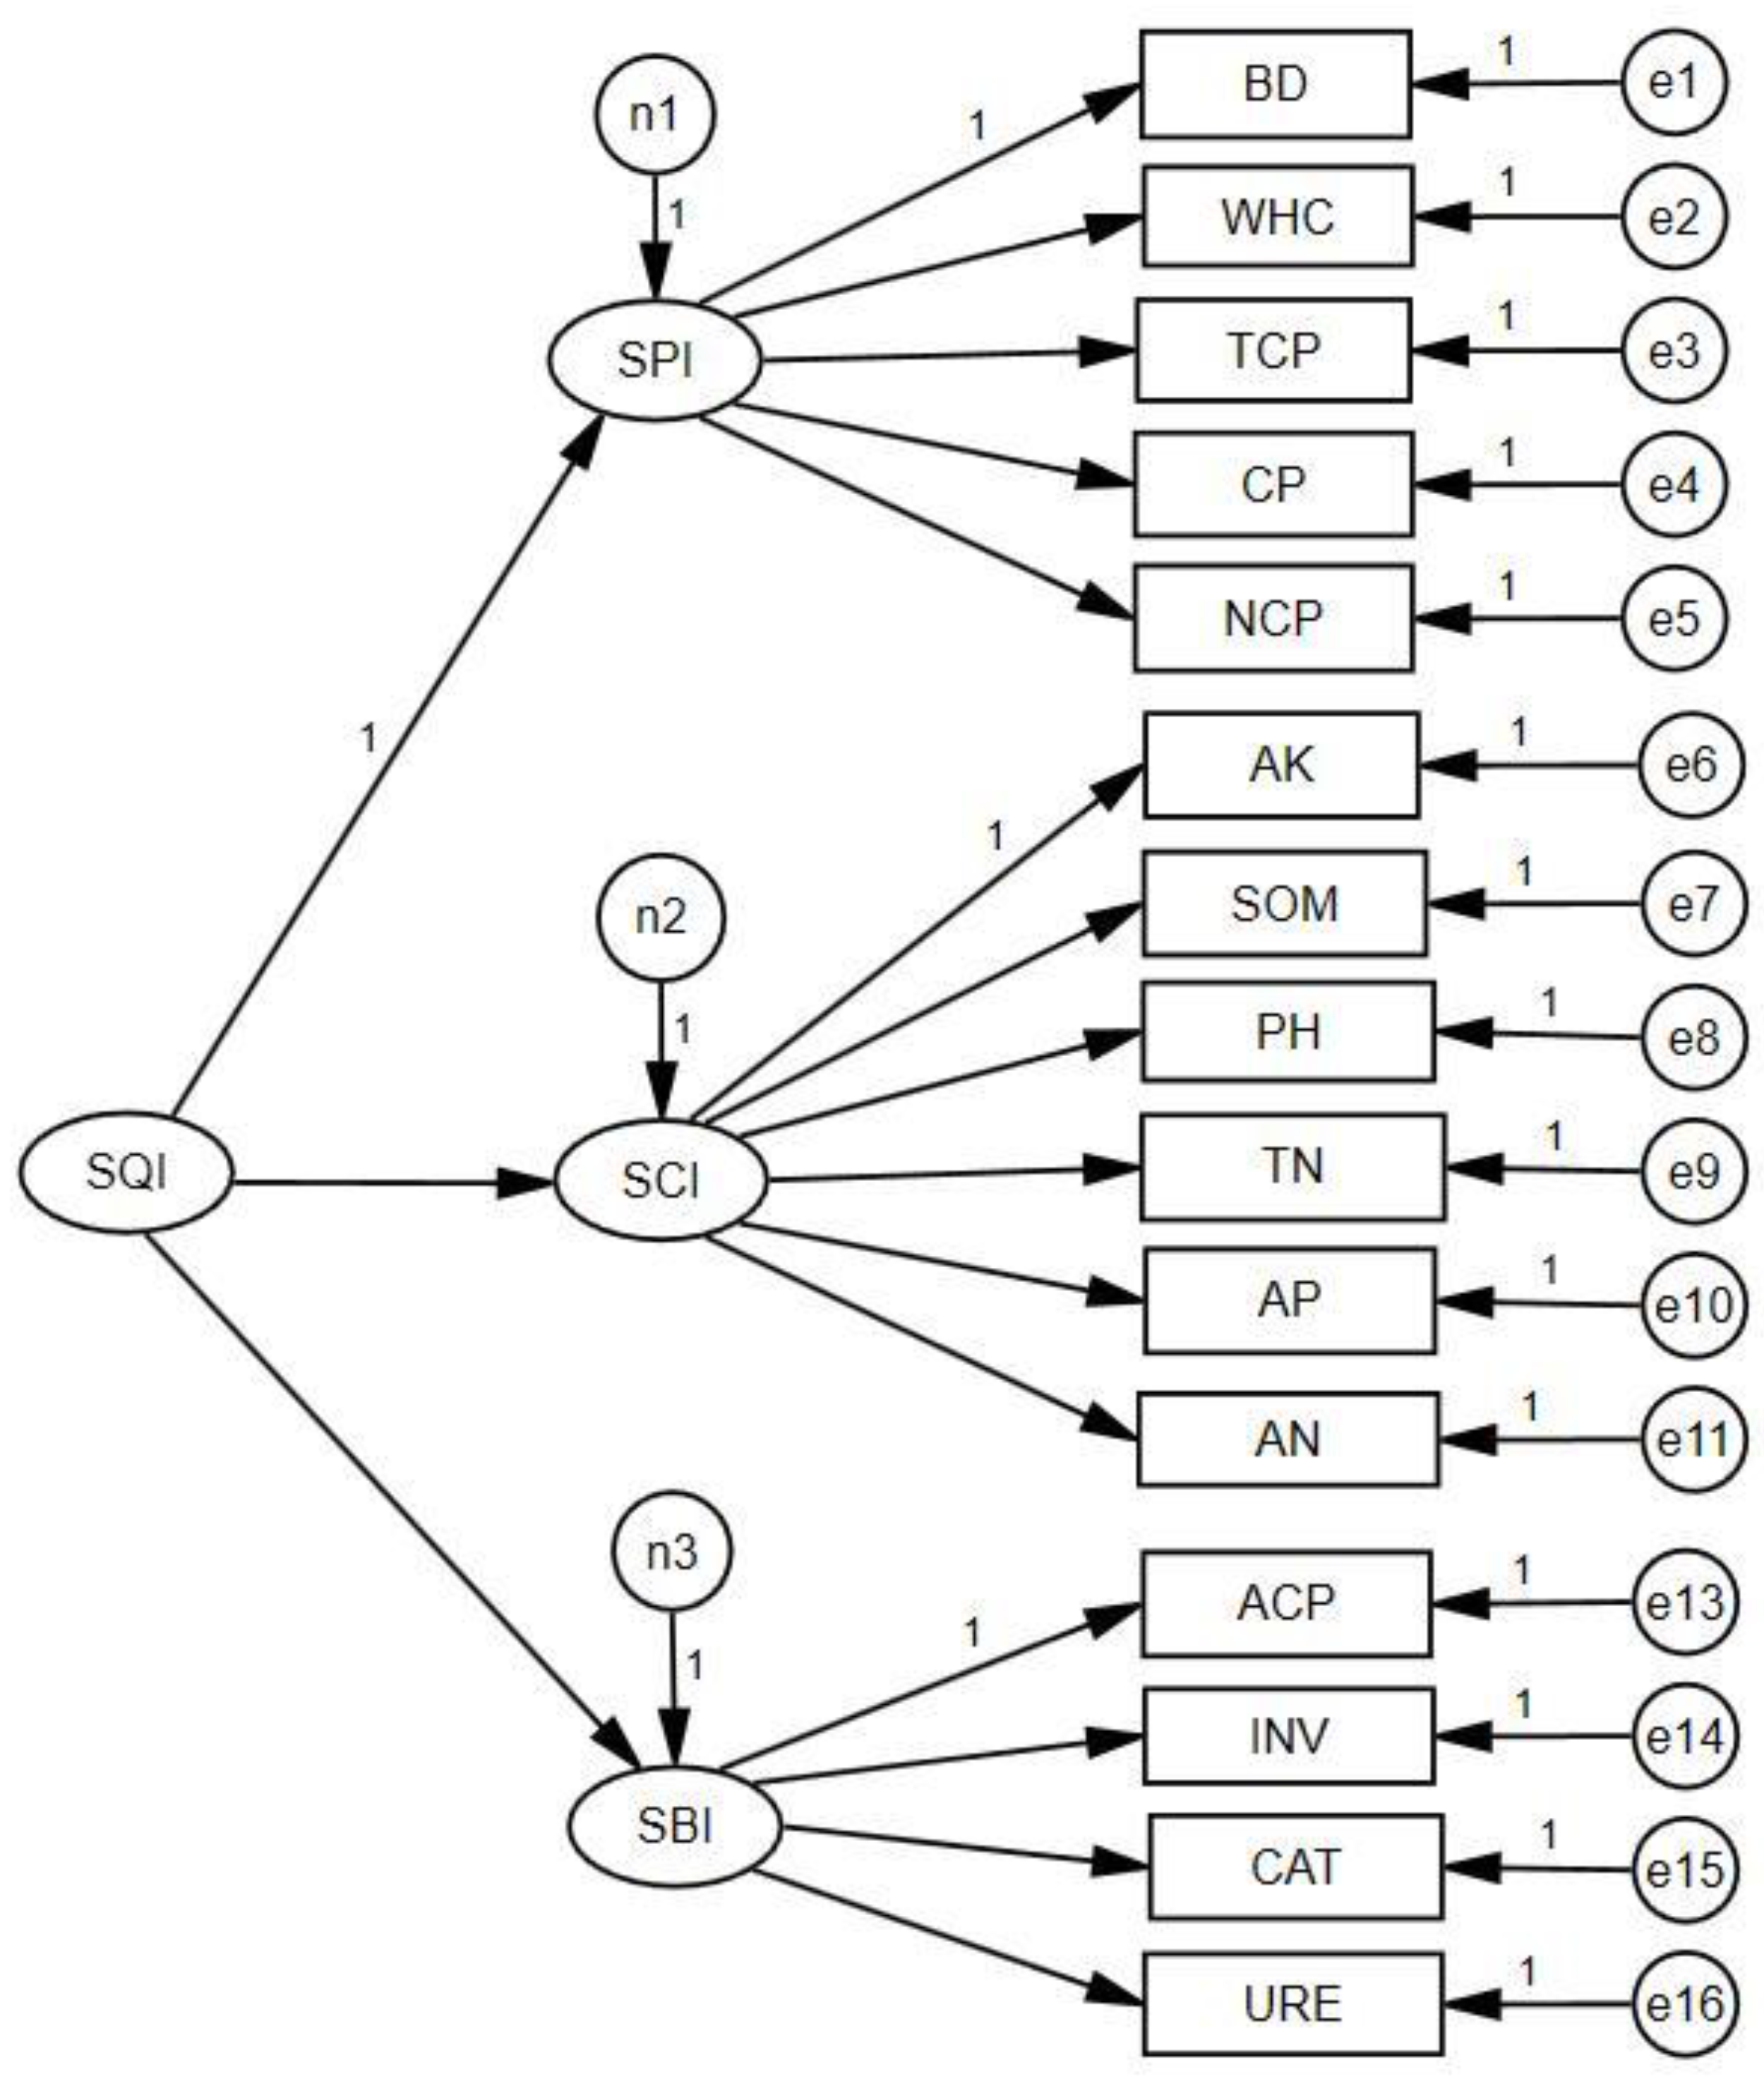
2.3.1. Theoretical Model Construction

The soil quality assessment began with the identification of a comprehensive, valid, reliable, sensitive, repeatable, and acceptable index system [40,41]. Soil quality can be assessed by a variety of physical, chemical, and biological properties because it is combined with soil physical, chemical, and microbial properties, influences soil nutrient cycling, and is sensitive to changes in soil quality [42,43]. In previous studies, the considerations for evaluating forest soil quality have relied on the information of soil chemical and physical properties [29]; however, few studies considered soil microbial and soil enzyme activity indicators [44]. It is important to understand the sensitivity of biological indicators to environmental changes and the effects on soil function and soil processes in determining nutrient availability and productivity of forest ecosystems [45,46]. Soil enzyme activity is often used as a tool to measure the impact of different vegetation restoration strategies on soil quality [47,48].
Soil is one of the principal substrata of life on earth, serving as a reservoir for water and nutrients, as a medium for the filtration and breakdown of injurious wastes, and as a participant in the cycling of carbon and other elements through the global ecosystem [49]. Soil is a dynamic entity, where complex interactions among its biological, chemical, and physical components take place. All these components and properties determine the functions of the soil for different purposes; these functions are included in the concept of “soil quality”. One of the most-used definitions of soil quality is the capacity of soil to function within ecosystem boundaries to sustain biological productivity, maintain environmental quality, and promote plant and animal health. Forest management, including thinning, pruning, forest age, species composition, forest types, fertilization, litter treatments, etc., can have a profound impact on many soil properties, thus indirectly affecting soil quality, which can result in improvements or constraints for productivity of land use and for agricultural sustainability in the long term [49]. Thus, soil physical, chemical, and biological properties were used to determine the forest soil quality indexes (SQI) in this study. Fifteen soil physical, chemical, and biological indicators, such as soil BD, WHC, TCP, CP, NCP, AK, SOM, pH, TN, AP, AN, ACP, INV, CAT, and ACP, were selected as the most important and sensitive indicators for evaluating the forest soil quality [19]. As a result, the soil physical, chemical, and biological properties were considered as the first-order factors, reflected by multiple observation variables, and the 15 soil indicators were considered as the second-order factors for constructing the model. The theoretical model of forest soil quality evaluation was established based on the conduction mechanism (Figure 2).

2.3.2. Model Assumptions

Before the empirical analysis of the model (Figure 2), the following hypotheses were developed based on the existing theories for the evaluation of forest soil quality [6,50,51] (see Table 2).

2.3.3. Data Reliability and Validity

Cronbach’s Alpha is generally considered good when it is >0.8 and is acceptable when it is between 0.5 and 0.8. The Kaiser–Meyer–Olkin (KMO) test was used to test the validity of the data, and it is generally accepted when KMO >0.7 for factor analysis.

2.3.4. Model Estimation and Model Evaluation

Confirmatory factor analysis was performed to test the fitness of the data to the model. This study compared the fitness index (CFI), Tucker–Lewis index (TLI) and normalized fitness index (non-financial institutions) using absolute fitness index χ 2 / d f , root mean square approximation error (RMSEA), and value-added fitness index [39,52,53]. The test results of the absolute index RMSEA were slightly affected by the sample size and had good sensitivity to the hypothetical model with fewer parameters, indicating the trustworthy fitting index. The model fitness was good when the fitting index was <0.05, and model fitness was reasonable when it was <0.08. The TLI, CFI, and NFI were used for estimating model fitness, and the model fitness was good when TLI, CFI, and NFI were greater than 0.90 [54].

2.3.5. Model Modification

After estimating the parameters of the model, when the hypothetical model and the measured data did not meet the fitting requirements, they need to be modified. The modified model was used as the new initial model to be evaluated and was tested again. Finally, the model with the most sufficient theoretical basis, the most practical and the strongest explanatory power was obtained.

2.4. Soil Quality Index (SQI) Calculation Method

The calculation process of SQI was divided into three steps. First, the standard scoring function was used to calculate the index scores. Secondly, the index weights were calculated according to the structural equation model. Finally, the SQI was obtained by weighted summation.
To make each soil indicator comparable with different units, an ascending function (Equation (4)) and a descending function (Equation (5)) were used to calculate the index scores [55]:
f ( x ) = { 0.1 ( x L ) 0.9 × x L U L + 0.1 ( L < x < U ) 1 ( x U )
f ( x ) = { 1 ( x L ) 1 0.9 × x L U L ( L < x < U ) 0.1 ( x U )
where f ( x ) is the score of each evaluation index, x is the measured value of each evaluation index, and U and L are the maximum and minimum values of evaluation index, respectively. For example, NCP, SOM, and ACP are ascending functions, while BD is used for descending functions. pH is an increasing function when soil is acidic and a decreasing function when it is alkaline [10,19].
The corresponding weight of each index was calculated by Equation (6):
W i = c i / i = 1 n c i i = 1 , 2 , 3 n
where W i is the indicator of the weight, c i is the factor loading of the indicator, and n is the number of first-order factor observations. The SQI is calculated according to Equation (7):
S Q I = i = 1 n W i × f i
where f i is the score of each evaluation index.

2.5. Statistical Data Analyses

Statistical tests for the effects of forest age variation on soil nutrient indicators were performed. A two-way analysis of variance (ANOVA) and Duncan’s multiple comparison test were used to analyze the statistical differences between the age groups and the soil layers at the p < 0.05 level. The original data were log-transformed to satisfy the normality and homoscedasticity assumptions of ANOVA. Microsoft Excel 2016 and SPSS 25.0 for Windows were used for statistical data analyses. The SEM was performed using AMOS 24.0 for Windows.

3. Results

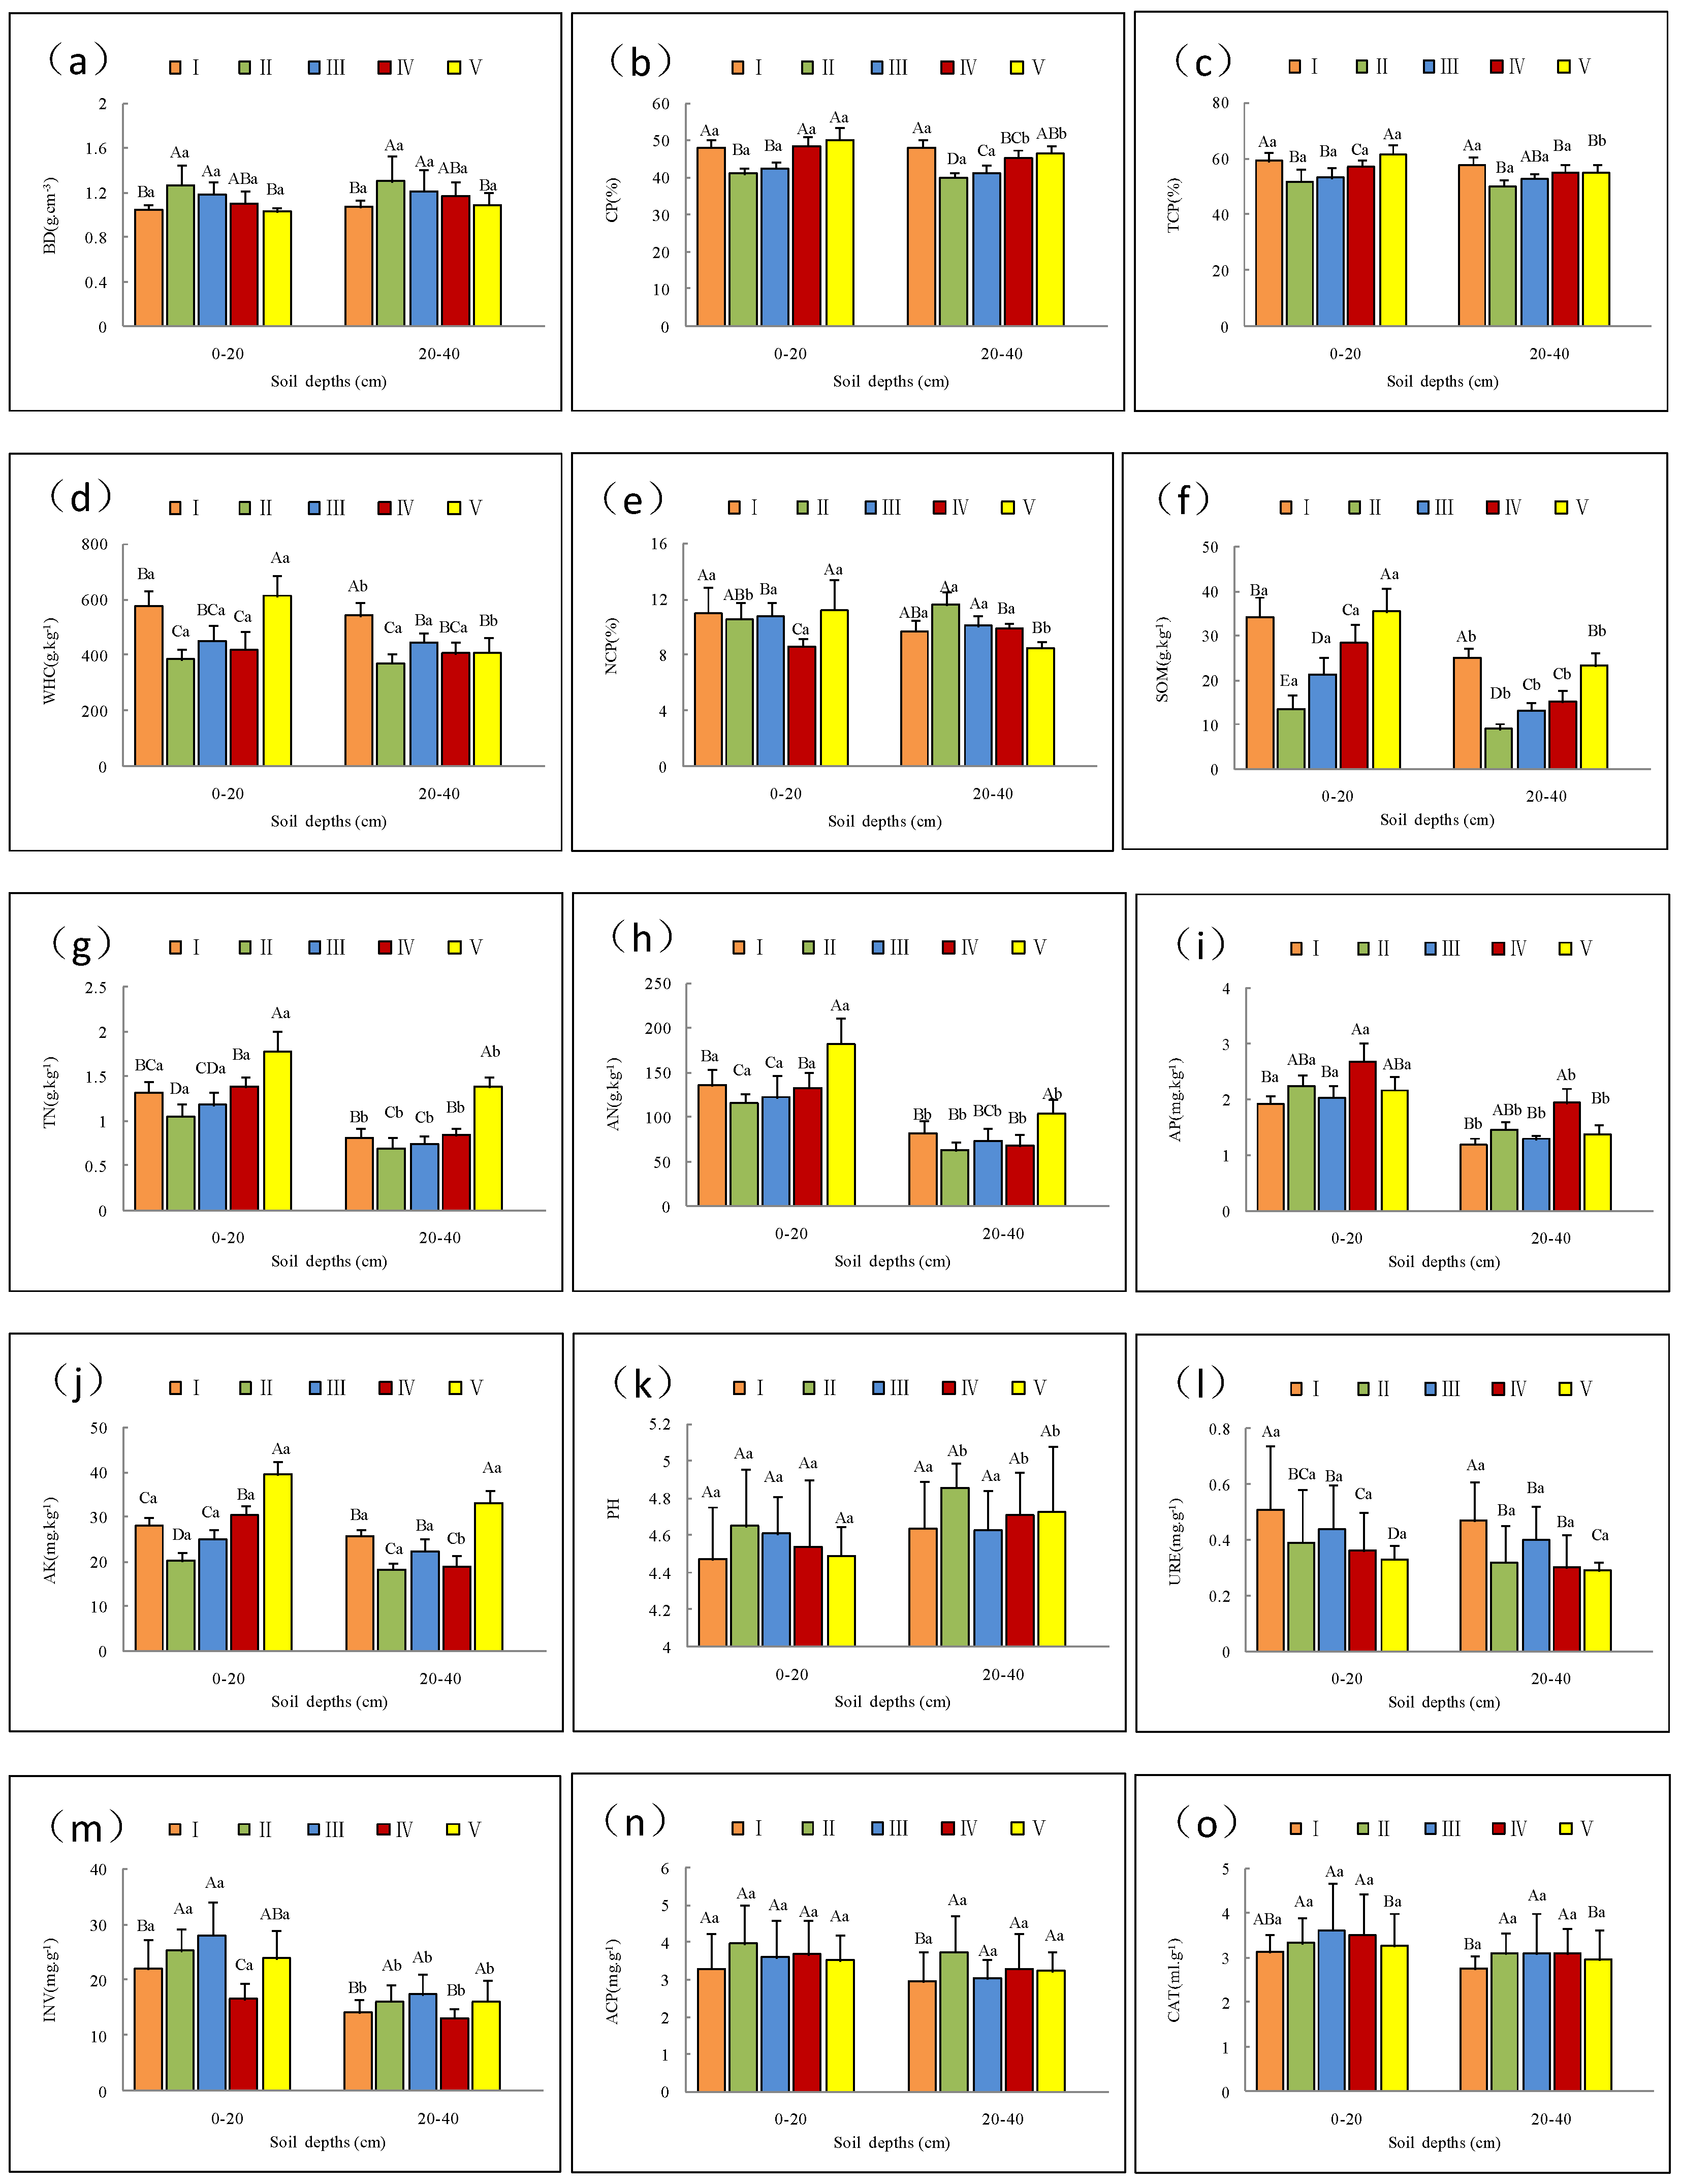
3.1. Analysis of Soil Characteristics of Chinese Fir Forest in Different Age Groups

The test results of 15 soil indicator in 5 age groups of Chinese fir forest are shown in Figure 3.
Soil BDs of stand II and stand III were significantly different from the stand V and stand I (p < 0.05). Soil BD was significantly lower in young stands (stand I) but significantly higher in the middle-aged stands (stand II). Then, soil BD gradually decreased in the near-mature stands (stand III) (Figure 3a). The soil TCP, CP, and WHC of each soil layer were higher in stand I, lower in stand II, and increased gradually in stand III (Figure 3b–d). The surface soil layer (0~20 cm) TCP and CP were significantly different in stand II and stand III from stands I, IV, and V (p < 0.05) (Figure 3b,c). There was no significant difference among the other soil physical indicators between the soil layers (0~20 cm and 20~40 cm), including soil WHC and NCP, in stand I, soil NCP in stand II, soil CP in stand IV, and soil CP, NCP, TCP, and WHC in stand V (p > 0.05) (Figure 3b–e).
Soil SOM, TN, AN, AP, and AK content decreased with increase in the soil depths during the development of Chinese fir forest stands (Figure 3f–j). Soil SOM, TN, and AN content in each soil layer (0~20 cm and 20~40 cm) were higher in stand I, lower in stand II, and then gradually increased in stand III (Figure 3f–h). Soil SOM was significantly different among all stages (p < 0.05) (Figure 3f). Soil AK content in topsoil layer (0~20 cm) showed a trend of decreasing first and then increasing among the five development stages of Chinese fir, and it was slightly different at depth (20~40 cm) (Figure 3j). Soil AP content showed no significant differences among the five stages except that it increased significantly in the transition stage from stand III to stand IV (p < 0.05) (Figure 3i). The soil PH values of the five age groups ranged from 4.47 to 4.86 and had no significant differences among the five stands (Figure 3k).
The activities of URE, INV, ACP, and CAT were higher in the topsoil layer (0~20 cm) than in the subsoil layer (20~40 cm) among the five age groups of Chinese fir stands (Figure 3l–o). The changes in the activity of the same enzyme with soil depth were basically the same in different age groups, but the decrease in different enzyme activities was different. The activity of INV decreased the most, and the difference among the soil layers (0–20 cm, 20–40 cm) were significantly different among age groups (p < 0.05) (Figure 3m).

3.2. Structural Equation Model for Forest Soil Quality Evaluation

3.2.1. Reliability and Validity of Modeling Data

All the Cronbach’s Alpha coefficients and KMO values for latent variables such as soil physical chemical and biological indicators were greater than 0.7 (Table 3), indicating that all data passed the reliability and validity test and met the needs of the structural equation model for forest soil quality evaluation.

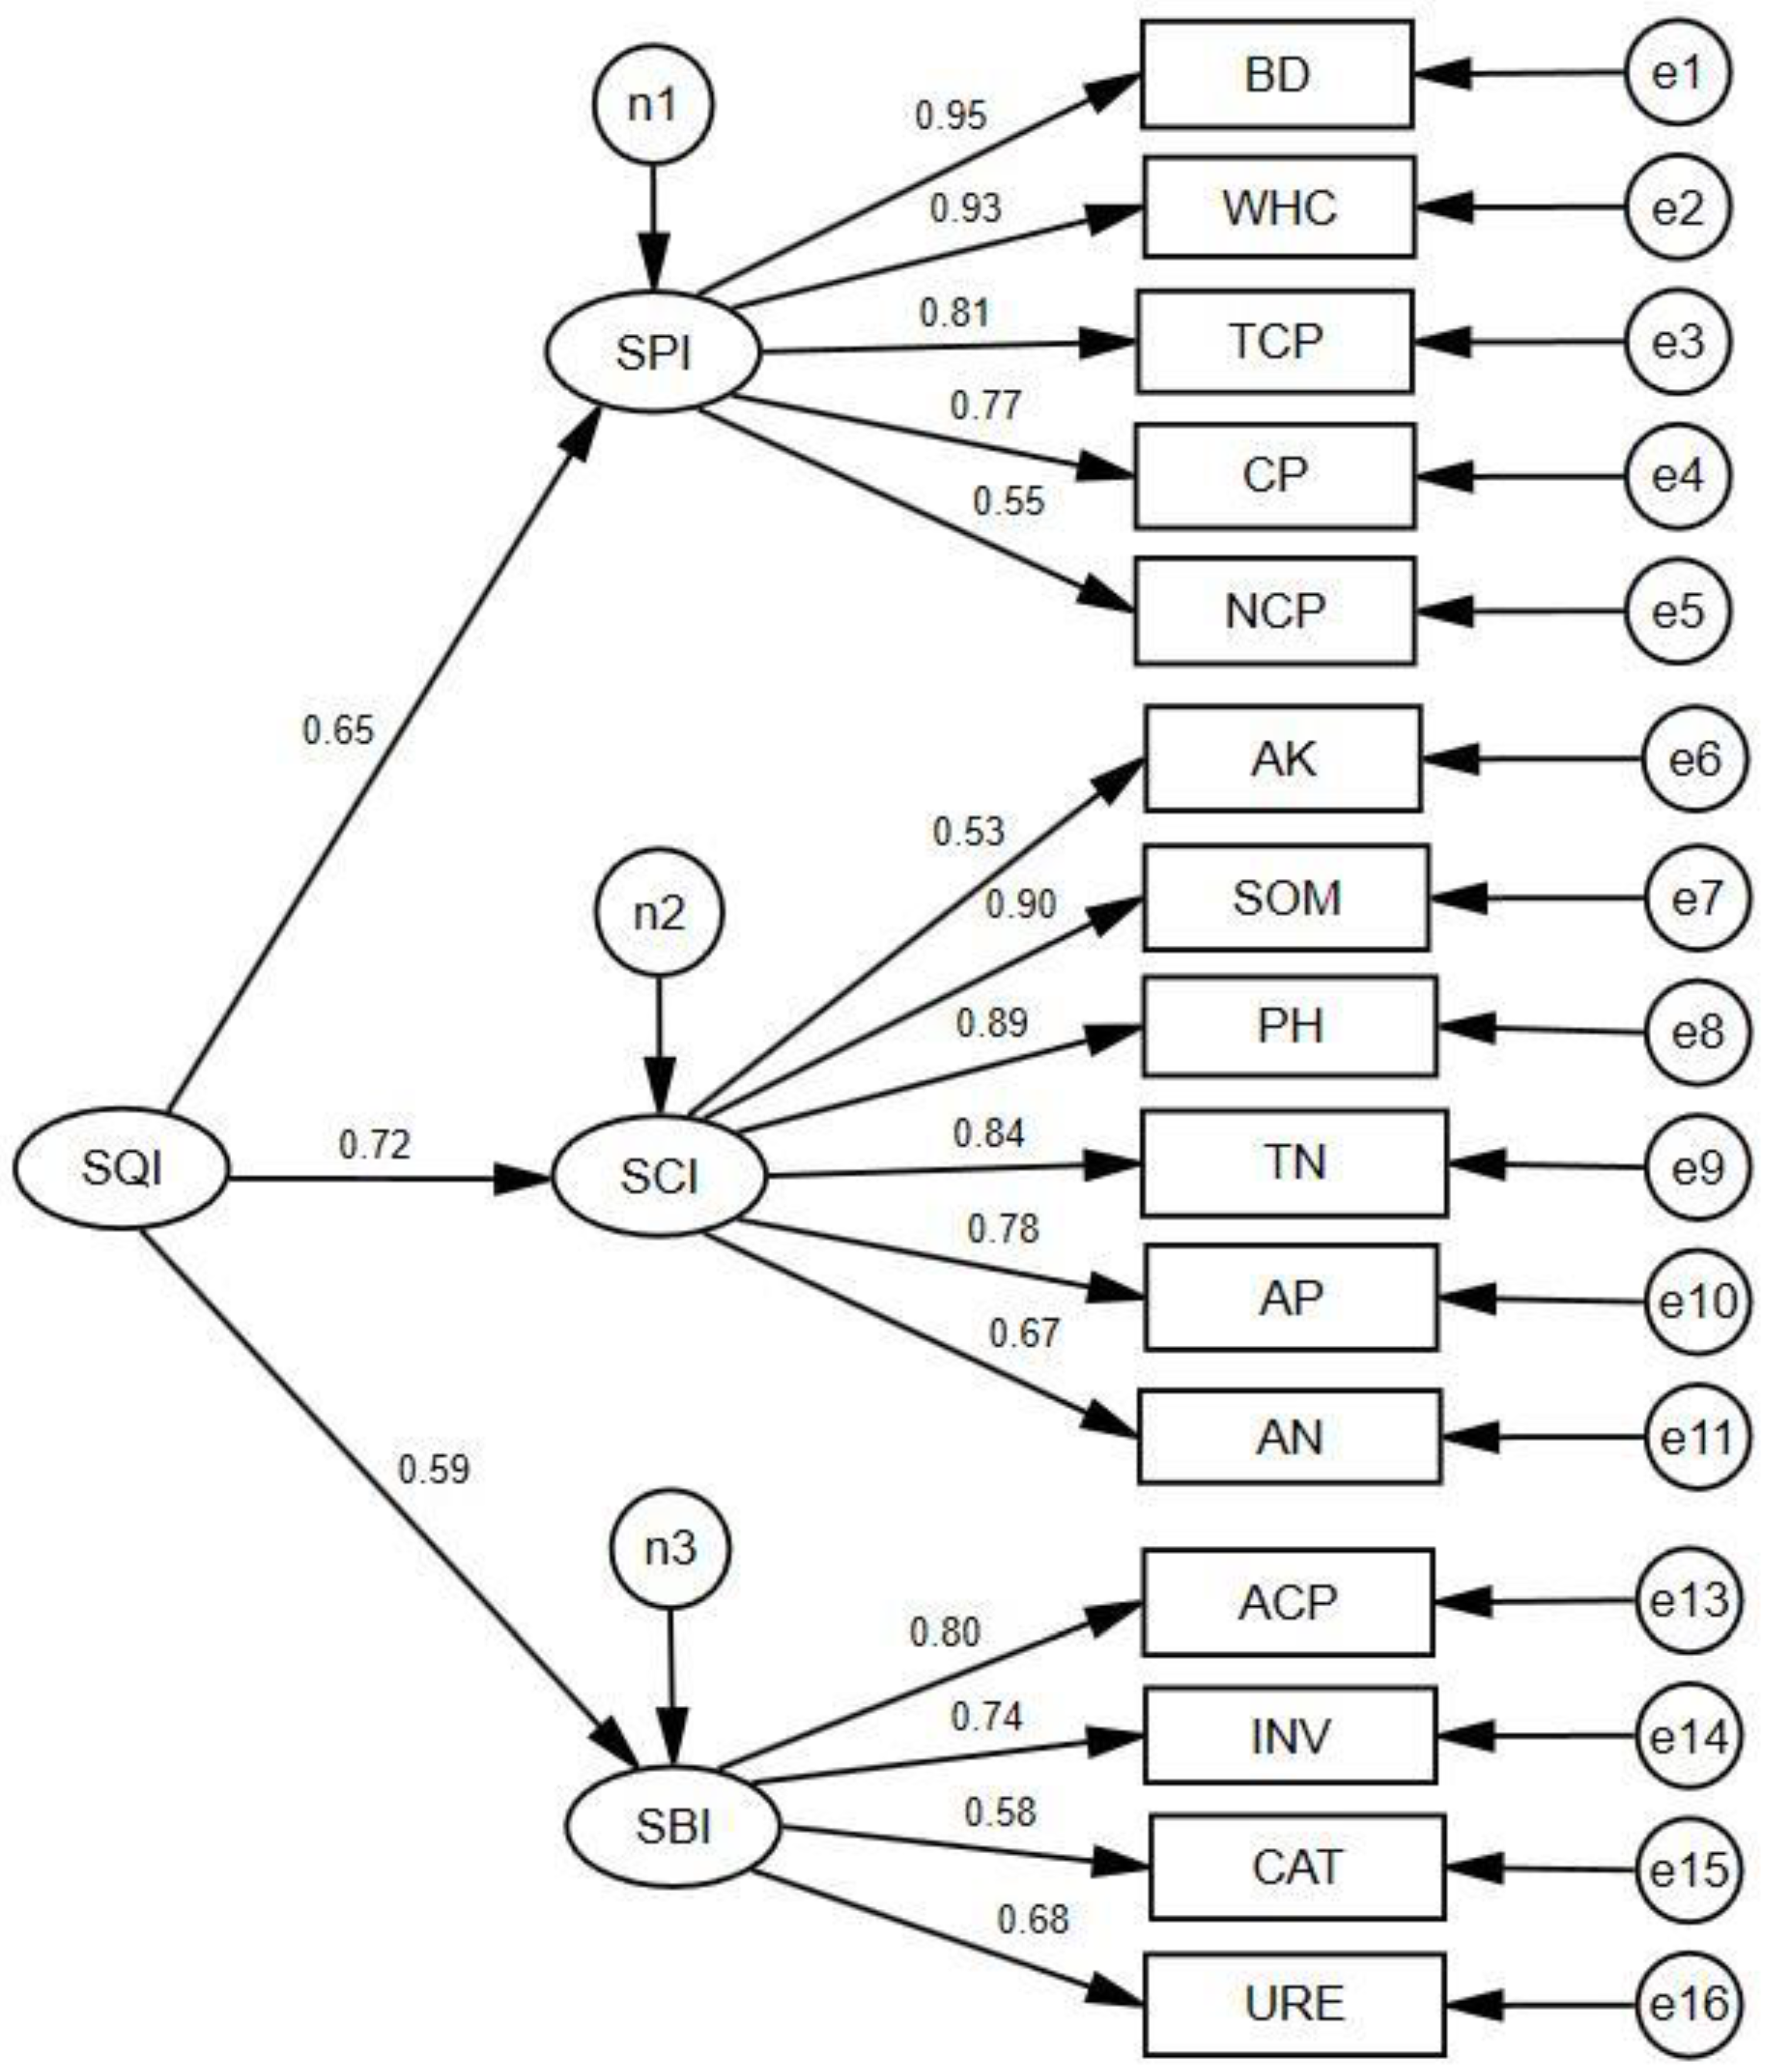
3.2.2. The Fitness of Structural Equation Model for Forest Soil Quality Evaluation

The absolute fitness index was 2.812, which was consistent with the requirements of the model fitness test between 1 and 3. The RMSEA was 0.116 and did not meet the needs of the critical value, with less than 0.08. The fitness indexes of CFI, TLI, and NFI were 0.879, 0.854, and 0.825, respectively. Thus, the model was required to be modified, since all were less than 0.9 [56,57]. The modified value was 1.689, while the CFI, NFI, and TLI were 0.957, 0.912, and 0.938, respectively, and RMSEA = 0.075; thus, the hypothetical model was satisfied with the observed data.
The path analysis of the modified model was shown in Figure 4. The normalized path coefficients of the internal latent variables of soil physical, chemical, and biological properties (i.e., the loadings of the three first-order factors on the model and the second-order factors of forest soil quality) were 0.65, 0.72, and 0.59, respectively. All three factors were found to have a positive relationship with the soil quality, and the above models (in Figure 4) were satisfied with the prior assumptions (in Table 2). The loads of the observed BD, WHC, TCP, CP, and NCP on the internal latent variables of soil physical properties were 0.95, 0.93, 0.81, 0.77, and 0.55, respectively. The loads of the observed variables AK, SOM, pH, TN, AP, and AN on the internal latent variables of soil chemical elements were 0.53, 0.90, 0.89, 0.84, 0.78, and 0.67, respectively. The loads of the observed variables ACP, INV, CAT, and URE on the internal latent variables of soil enzyme activity were 0.80, 0.74, 0.58, and 0.68, respectively. The loads of three first-order factors on the second-order factors of forest soil quality and 15 observed variables all reached statistical significance (p < 0.05).

3.3. Weights Determined by the Structural Equation Model

The weight of soil chemical properties was the largest (0.3674), followed by the weights of soil physical properties (0.3316) and soil biological properties (0.3010) (Table 4). Among the soil physical property indicators, soil BD had the highest weight at 0.2369. Soil WHC and TCP also had weights over 0.2, while NCP had the smallest weight of 0.1372. Among soil chemical property indicators, SOM was the highest weight at 0.1952. The weight of both soil pH and TN exceeded 0.18, and AK had the lowest weight at 0.1150. Among soil biological property indicators, soil ACP had the highest weight at 0.2857. The weights of soil URE and INV were similar, and they were 0.2429 and 0.2643, respectively. CAT had the lowest weight at 0.2071.

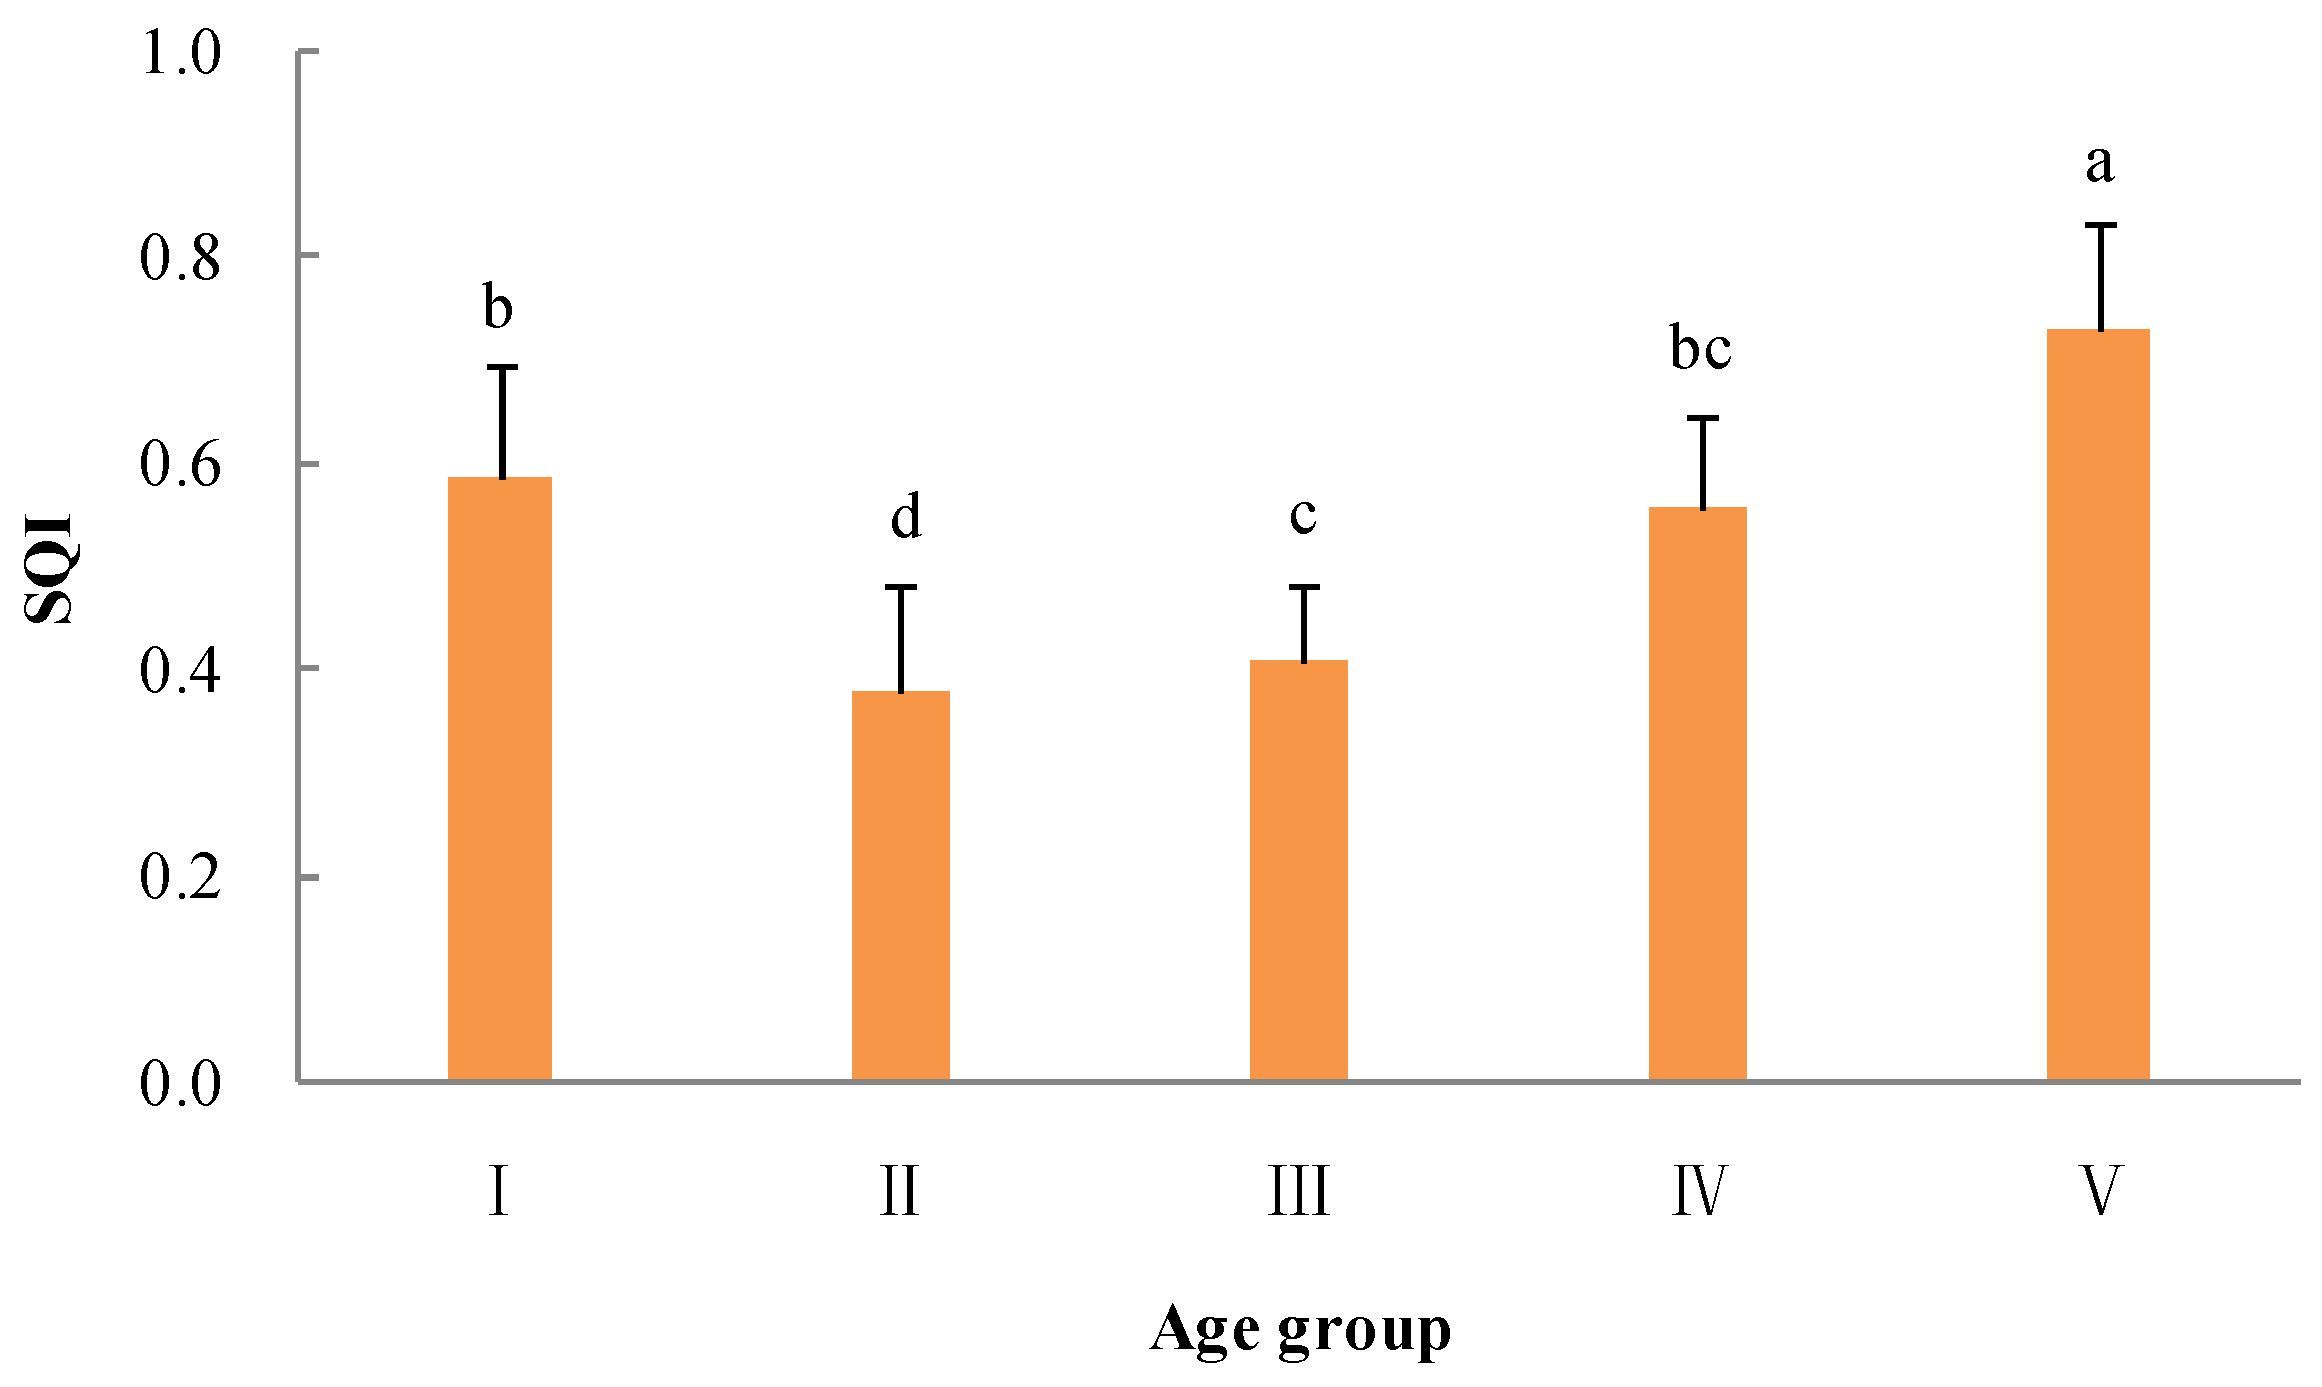
3.4. SQI Evaluation Results

The mean SQI of the five aged Chinese fir plantations decreased in the order stand V (0.7298) > stand I (0.5883) > stand IV (0.5552) > stand III (0.4084) > stand II (0.3783) (Figure 5). The SQI of stand V was significantly higher than that in other four age groups (p < 0.05), while the SQI of stand II was significantly lower than that in the other four age groups (p < 0.05) (Figure 5).

4. Discussion

4.1. Soil Quality Indexes

Soil quality assessment refers to the monitoring and evaluation of soil properties, soil functions, and soil conditions [56]; it is complicated and difficult to target due to the heterogeneity and variability in physical, chemical, and biological properties of different soil types and regions [58,59,60]. Therefore, it is very important to select appropriate evaluation indicators, and the physical, chemical, and biological indicators of soils should be considered at the same time [61,62].
In this study, a total of 15 soil indicators, including physical, chemical, and biological properties, were used for evaluating soil quality in different growth stages of Chinese fir plantations. The results showed that the values of physical indicators BD, CP, TCP, and WHC and chemical indicators SOM, TN, and AN were significantly degraded in the middle-aged forests, but significantly restored when the stands entered the near-mature stages. Most soil physical and chemical indicators in the mature and over-mature forests reached or even exceeded the levels of the young forests. These results were consistent with the findings from previous studies [63,64]. This phenomenon was related to the changes in micro-environments and understory species along the succession of the Chinese fir forests, as well as the different management practices applied in different growth stages of the forests [35,65]. At the young stage, the Chinese fir forests were nursed with good conditions of soil moisture and fertility due to rapid decomposition and mineralization. The thinning and pruning of active forest management evolves over the young stage of Chinses fir plantations [66]. As stand density increases, the tree bole height increases, while the crown amplitude, the leaf area, and leaf area index decrease [67]. The annual diameter growth indicated that the influence of forest floor organic residue removal on tree growth happened between years 7 and 9 after tree replanting [68]. As the forests entered middle-aged stage, the stand canopy was nearly closed, and the competition for water and nutrients was serious among the individual trees. The fast growth of Chinese fir at this stage consumed a large amount of nutrients from soils, leading to a significant degradation in its soil moisture condition and fertility [69,70]. Due to thinning and natural pruning, the hydrothermal conditions in the mature forest stands were gradually improved, soil microorganism compositions and activity increased, and the understory community was restored. This resulted in an increase in the type and amount of organic matter and a significant restoration of soil conditions [71,72,73,74].

4.2. Structural Equation Model for Evaluating Soil Quality

Soil quality often includes soil chemical, physical, and biological indica-tors [62,75,76], and soil quality evaluation was involved in a large amount of data; thus, it is difficult to find out the internal relationship among these complicated data intuitively [30,72]. Therefore, a comprehensive evaluation of soil fertility from the perspective of multiple factors must be performed by mathematical methods [6,77]. In the comprehensive evaluation of soil quality, determining the weights of soil indexes is the key step. Compared with the existing weight-determination methods, using SEM to determine the wights of soil quality index in the present study is an innovative approach. This approach generates a path model by simulating the internal logical relationships of each element that affects forest soil quality, weighting each indicator based on the relationship between soil quality (unmeasurable variables) and soil quality indexes (measurable variables), and then summarizing the weighted values for the evaluation of soil quality [78]. The determination of weights of soil nutrient indicators from the SEM was more reasonable and trustable because it determined the weight of soil nutrient indicators by comprehensively extracting information from the original data and overcame the influence of multicollinearity [79]. However, large amounts of data were required to construct the SEM. It has been recommended that the sampling size of SEM should be more than 10 times than the number of indicators [80], and even 100 or greater than 100 times [81]. Muthén (2002) indicated that sample size for determining the SEM was very complex, and there was not a general rule of thumb [82]. The quantity of the sample size was determined by several factors, such as the degree of freedom; soil physical, chemical, and biological indicators; the observation indicators; experimental design; data multivariate normality; processing and missing data; complexity of model; and other factors. The determination of soil sample size could be achieved by using statistical test force analysis such as Monte Carlo simulation [57]. In this study, 150 soil samples were used to construct the SEM, and the soil sample size was about 10 times the number of indicators, which fully met the modeling requirements from a statistical demand.

4.3. Soil Quality Evaluation Results and Control Factors

In this study, the SQI varied between 0.4084 and 0.7298 among the five age groups of Chinese fir stands, and the SQI was significantly higher in stand V than in the other four age groups (p < 0.05), while the SQI was significantly lower in stand Ⅱ than in the other four age groups (p < 0.05). This phenomenon indicated that different growth stages had significant effects on the soil quality of Chinese fir plantations [83,84]. The results were consistent with findings in previous studies. For example, Wang et al. (2010) found that the contents of SOM, TN, AN, and AK decreased in middle-aged forests and increased significantly in mature forests, reaching a maximum in over-mature Chinese fir forests [65]. Wang et al. (2010) and Wu et al. (2011) reported that soil fertility was highest in mature and over-mature forests and was lowest in middle-aged Chinese fir forests because of nutrient depletion and low nutrient return in young plantations, while high nutrient return exists in mature and over-mature stands [63,64,69]. The weighting analysis showed that soil chemical properties were the most important attributes affecting soil quality, followed by physical properties and biological properties, but the differences among the three properties were greater than 0.3 in our study. This suggested that soil quality depended on a combination of physical, chemical, and biological properties [75,85]. BD was the most important factor among the soil physical properties, and was a sensitive indicator of soil texture, structure, hardness, and organic matter content [86]. In addition, the BD affected soil water permeability, the precipitation infiltration rate, and soil performance in supporting plants [87]. SOM was a major factor among soil chemical properties, as it was a reservoir for soil nutrients and had a significant impact on soil chemical, physical, and biological properties. Thus, SOM content has generally been considered as an important criterion for assessing soil quality in sustainable forest management [88]. ACP was the most important indicator of biological properties; it works as a key enzyme in the soil phosphorus cycle, and its activity has been a good indicator of the mineralization and biological activity of soil organic phosphorus [89,90].

5. Conclusions

In order to evaluate soil quality in Chinese fir plantation forests, 15 soil physical, chemical, and biological indicators were measured in 5 differently aged groups of Chinese fir plantations in subtropical China. An innovative SEM was constructed and used to determine the weights of each soil indicator. After that, the SQIs of Chinese fir forests in the five aged groups were calculated. The SQI of Chinese fir forests ranged between 0.4084 and 0.7298 among the five age groups. The significantly highest SQI was found in stand V (p < 0.05), while the significantly lowest SQI was in stand Ⅱ, compared to other age groups. Soil BD, SOM, and ACP were the most important indicators of the soil properties in Chinese fir stands. Our results suggest that the SQI estimated from the SEM could comprehensively evaluate soil quality in forest ecosystems and should be considered as the main indicator for sustainable forest management practice. The study provided a scientific insight into soil fertilization of forest management during different growth stages of Chinese fir plantations.

Author Contributions

Conceptualization, X.C. and W.Y.; data curation, X.C.; formal analysis, X.C.; funding acquisition, X.C. and W.Y; investigation, Y.M. and Z.Z.; methodology, X.C.; project administration, X.C. and W.Y; resources, X.C., Y.M. and Z.Z; supervision, W.Y. and Y.P.; visualization, X.C.; writing—original draft, X.C.; writing—review & editing, W.Y. and Y.P. All authors have read and agreed to the published version of the manuscript.

Funding

This research was funded by General Program of Natural Science Foundation of Hunan Province, China (2023JJ30991), and Joint Funds of the National Natural Science Foundation of China (U21A20187).

Data Availability Statement

Not applicable.

Conflicts of Interest

The authors declare no conflict of interest.

References

  1. FAO. The State of the World’s Forests 2018-Forest Pathways to Sustainable Development. Rome. BY-NC-SA 3.0 IGO. 2018. Available online: http://www.fao.org/state-of-forests/en/ (accessed on 16 April 2022).
  2. Doran, J.W.; Parkin, T.B. Defining and assessing soil quality. In Defining Soil Quality for a Sustainable Environment; Soil Science Society of America: Madison, WI, USA, 1994; Volume 35, pp. 3–21. [Google Scholar] [CrossRef] [Green Version]
  3. Sharma, K.L.; Mandal, U.K.; Srinivas, K.; Vittal, K.P.R.; Mandal, B.; Grace, J.K.; Ramesh, V. Long-term soil management effects on crop yields and soil quality in a dryland Alfisol. Soil Till. Res. 2004, 83, 246–259. [Google Scholar] [CrossRef]
  4. Zhang, Y.H.; Xu, X.L.; Li, Z.W.; Liu, M.X.; Xu, C.H.; Zhang, R.F.; Luo, W. Effects of vegetation restoration on soil quality in degraded karst landscapes of southwest China. Sci. Total. Environ. 2019, 650, 2657–2665. [Google Scholar] [CrossRef] [PubMed]
  5. Andrews, S.S.; Karlen, D.L.; Cambardella, C.A. The soil management assessment framework: A quantitative soil quality evaluation method. Soil Sci. Soc. Am. J. 2004, 68, 1945–1962. [Google Scholar] [CrossRef]
  6. Bünemanna, E.K.; Bongiorno, G.; Bai, Z.G.; Creamer, R.E.; Deyn, G.D.; Goede, R.D.; Fleskens, L.; Geissen, V.; Kuyper, T.W.; Mäder, P.; et al. Soil quality-A critical review. Soil Biol. Biochem. 2018, 120, 105–125. [Google Scholar] [CrossRef]
  7. Smith, J.L.; Halvorson, J.J.; Papendick, R.I. Using multiple-variable indicator kriging for evaluating soil quality. Soil Sci. Soc. Am. J. 1993, 57, 743–749. [Google Scholar] [CrossRef]
  8. Larson, W.E.; Pierce, F.J. The dynamics of soil quality as a measure of sustainable management. Defin. Soil Qual. Sustain. Environ. 1994, 35, 37–51. [Google Scholar] [CrossRef]
  9. Fu, B.J.; Liu, S.L.; Chen, L.D.; Lü, Y.H.; Qiu, J. Soil quality regime in relation to land cover and slope position across a highly modified slope landscape. Ecol. Res. 2004, 19, 111–118. [Google Scholar] [CrossRef]
  10. Andrews, S.S.; Karlen, D.L.; Mitchell, J.P. A comparison of soil quality indexing methods for vegetable production systems in Northern California. Agr. Ecosyst. Environ. 2002, 90, 25–45. [Google Scholar] [CrossRef]
  11. Li, R.R.; Kan, S.S.; Zhu, M.K.; Chen, J.; Ai, X.Y.; Chen, Z.Q.; Zhang, J.J.; Ai, Y.W. Effect of different vegetation restoration types on fundamental parameters, structural characteristics and the soil quality index of artificial soil. Soil Till. Res. 2018, 184, 11–23. [Google Scholar] [CrossRef]
  12. Tang, B.Z.; He, B.H.; Yan, J.M. Gray correlation analysis of the impact of land use type on soil physical and chemical properties in the hilly area of central Sichuan, China. J. Appl. Ecol. 2016, 27, 1445–1452. [Google Scholar] [CrossRef]
  13. Yu, J.; Fang, L.; Cang, D.B.; Zhu, L.; Bian, Z.F. Evaluation of land eco-security in Wanjiang district base on entropy weight and matter element model. Trans. Chin. Soc. Agric. Eng. 2012, 28, 260–266. [Google Scholar] [CrossRef]
  14. Wienhold, B.J.; Karlen, D.L.; Andrews, S.S.; Stott, D.E. Protocol for indicator scoring in the soil management assessment framework (SMAF). Renew. Agr. Food. Syst. 2009, 24, 260–266. [Google Scholar] [CrossRef] [Green Version]
  15. Xue, Y.J.; Liu, S.H.; Hu, Y.M.; Yang, J.F. Soil quality assessment using weighted fuzzy association rules. Pedosphere 2010, 20, 334–341. [Google Scholar] [CrossRef]
  16. Chen, Y.D.; Wang, H.Y.; Zhou, J.M.; Xing, L.; Zhu, B.S.; Zhao, Y.C.; Chen, X.Q. Minimum data set for assessing soil quality in farmland of northeast China. Pedosphere 2013, 23, 564–576. [Google Scholar] [CrossRef]
  17. Yu, P.J.; Han, D.L.; Liu, S.W.; Wen, X.; Huang, Y.G.; Jia, H.T. Soil quality assessment under different land uses in an alpine grassland. Catena 2018, 171, 280–287. [Google Scholar] [CrossRef]
  18. Fathizad, H.; Ardakani, M.A.H.; Heung, B.; Sodaiezadeh, H.; Rahmani, A.; Fathabadi, A.; Scholten, T.; Taghizadeh-Mehrjardi, R. Spatio-temporal dynamic of soil quality in the central Iranian desert modeled with machine learning and digital soil assessment techniques. Ecol. Indic. 2020, 118, 106736. [Google Scholar] [CrossRef]
  19. Shao, G.D.; Ai, J.J.; Sun, Q.W.; Hou, L.Y.; Dong, Y.F. Soil quality assessment under different forest types in the Mount Tai, central Eastern China. Ecol. Indic. 2020, 115, 106439. [Google Scholar] [CrossRef]
  20. Ye, H.C.; Zhang, S.W.; Huang, Y.F.; Zhou, Z.M.; Shen, C.Y. Application of rough set theory to determine weights of soil fertility factor. Sci. Agric. Sin. 2014, 47, 710–717. [Google Scholar] [CrossRef]
  21. Gao, T.; Li, J.R.; Lu, J.; Zheng, W.L.; Chen, J.R.; Wang, J.K.; Duan, F. Soil nutrient and fertility of different slope directions in the Abies georgei var. smithii forest in Sejila Mountain. Acta Ecol. Sin. 2020, 40, 1331–1341. [Google Scholar] [CrossRef]
  22. Zhang, B.; Zhang, Y.; Chen, D.; White, R.E.; Li, Y. A quantitative evaluation system of soil productivity for intensive agriculture in China. Geoderma 2004, 123, 319–331. [Google Scholar] [CrossRef]
  23. Anderson, J.C.; Gerbing, D.W. Structural equation modeling in practice: A review and recommended two-step approach. Psychol. Bull. 1988, 103, 411–423. [Google Scholar] [CrossRef]
  24. Ma, J.; Fan, Z.P.; Huang, L.H. A subjective and objective integrated approach to determine attribute weights. Eur. J. Oper. Res. 1999, 112, 397–404. [Google Scholar] [CrossRef]
  25. Ying, X.; Zeng, G.M.; Chen, G.Q.; Tang, L.; Wang, K.L.; Huang, D.Y. Combining AHP with GIS in synthetic evaluation of eco-environment quality—A case study of Hunan Province, China. Ecol. Model. 2007, 209, 97–109. [Google Scholar] [CrossRef]
  26. Liu, J.; Wu, L.C.; Chen, D.; Li, M.; Wei, C.J. Soil quality assessment of different Camellia oleifera stands in mid-subtropical China. Appl. Soil Ecol. 2017, 113, 29–35. [Google Scholar] [CrossRef]
  27. Laughlin, D.C.; Abella, S.R.; Covington, W.W.; Grace, J.B. Species richness and soil properties in Pinus ponderosa forests: A structural equation modeling analysis. J. Veg. Sci. 2007, 18, 231–242. [Google Scholar] [CrossRef]
  28. Masto, R.E.; Chhonkar, P.K.; Singh, D.; Patra, A.K. Alternative soil quality indices for evaluating the effect of intensive cropping, fertilisation and manuring for 31 years in the semi-arid soils of India. Environ. Monit. Assess. 2008, 136, 419–435. [Google Scholar] [CrossRef] [PubMed]
  29. Qi, Y.B.; Darilek, J.L.; Huang, B.; Zhao, Y.C.; Sun, W.X.; Gu, Z.Q. Evaluating soil quality indices in an agricultural region of Jiangsu Province, China. Geoderma 2009, 149, 325–334. [Google Scholar] [CrossRef]
  30. Griffiths, B.S.; Ball, B.C.; Daniell, T.J.; Hallett, P.D.; Neilson, R.; Wheatley, R.E.; Osler, G.; Bohanec, M. Integrating soil quality changes to arable agricultural systems following organic matter addition, or adoption of a ley-arable rotation. Appl. Soil Ecol. 2010, 46, 43–53. [Google Scholar] [CrossRef]
  31. Doncaster, C.P. Structural equation modeling and natural systems. Fish Fish. 2007, 8, 368–369. [Google Scholar] [CrossRef]
  32. Libório, M.P.; Martinuci, O.D.S.; Laudares, S.; Lyrio, R.D.M.; Machado, A.M.C.; Bernardes, P.; Ekel, P. Measuring intra-urban inequality with structural equation modeling:a theory-grounded indicator. Sustainability 2020, 12, 8610. [Google Scholar] [CrossRef]
  33. Selvaraj, S.; Duraisamy, V.; Huang, Z.J.; Guo, F.T.; Ma, X.Q. Influence of long-term successive rotations and stand age of Chinese fir (Cunninghamia lanceolata) plantations on soil properties. Geoderma 2017, 306, 127–134. [Google Scholar] [CrossRef]
  34. Wu, Z.L. Chinese-Fir China Forestry; Publishing House: Beijing, China, 1984; p. 584. [Google Scholar]
  35. Yang, Y.S.; Guo, J.F.; Chen, G.S.; Xie, J.S.; Gao, R.; Li, Z.; Jin, Z. Carbon and nitrogen pools in Chinese fir and evergreen broadleaved forests and changes associated with felling and burning in mid-subtropical China. Forest Ecol. Manag. 2005, 216, 216–226. [Google Scholar] [CrossRef]
  36. Lu, R.K. Methods of Soil and Agricultural Chemistry Analyses; China Agricultural Science and Technology Press: Beijing, China, 2000. [Google Scholar]
  37. Guan, S.Y. Soil Enzyme and Its Research Methods; Chinese Agricultural Press: Beijing, China, 1986; pp. 295–323. [Google Scholar]
  38. Carpenter, P.J.; Scanlan, T.K.; Simons, J.P.; Lobel, M. A test of the sport commitment model using structural equation modeling. J. Sport Exerc. Psychol. 1993, 15, 119–133. [Google Scholar] [CrossRef]
  39. Grace, J.B. Structural Equation Modeling and Natural Systems. Biometrics 2007, 63, 977. [Google Scholar] [CrossRef]
  40. Nortcliff, S. Standardisation of soil quality attributes. Agric. Ecosyst. Environ. 2002, 88, 161–168. [Google Scholar] [CrossRef]
  41. Arshad, M.A.; Martin, S. Identifying critical limits for soil quality indicators in agro-ecosystems. Agric. Ecosyst. Environ. 2002, 88, 153–160. [Google Scholar] [CrossRef]
  42. Schoenholtz, S.H.; Miegrort, H.V.; Burger, J.A. A review of chemical and physical properties as indicators of forest soil quality: Challenges and opportunities. Forest Ecol. Manag. 2000, 138, 335–356. [Google Scholar] [CrossRef]
  43. Guo, L.L.; Sun, Z.G.; Ouyang, Z.; Han, D.R.; Li, F.D. A comparison of soil quality evaluation methods for Fluvisol along the lower Yellow River. Catena 2017, 152, 135–143. [Google Scholar] [CrossRef]
  44. Qiu, X.C.; Peng, D.L.; Wang, H.B.; Wang, Z.Y.; Cheng, S. Minimum data set for evaluation of stand density effects on soil quality in larix principis-rupprechtii plantations in North China. Ecol. Indic. 2019, 103, 236–247. [Google Scholar] [CrossRef]
  45. Niemeyer, J.C.; Lolata, G.B.; Carvalho, G.M.D.; Silva, E.M.D.; Sousa, J.P.; Nogueira, M.A. Microbial indicators of soil health as tools for ecological risk assessment of a metal contaminated site in Brazil. Appl. Soil Ecol. 2012, 59, 96–105. [Google Scholar] [CrossRef]
  46. Brockett, B.F.T.; Prescott, C.E.; Grayston, S.J. Soil moisture is the major factor influencing microbial community structure and enzyme activities across seven biogeoclimatic zones in western Canada. Soil Biol. Biochem. 2012, 44, 9–20. [Google Scholar] [CrossRef]
  47. Zhang, G.X.; Yu, D.S.; Zhang, Z.Q.; Wang, X.X.; Shi, X.Z. Cultivated land Quality Evaluation Methods Based on Bio-Norm and EO. Sci. Geogr. Sin. 2011, 31, 1012–1018. [Google Scholar] [CrossRef]
  48. Kotroczó, Z.; Veres, Z.; Fekete, I.; Krakomperger, Z.; Tóth, J.A.; Lajtha, K.; Tóthmérész, B. Soil enzyme activity in response to long-term organic matter manipulation. Soil Biol. Biochem. 2014, 70, 237–243. [Google Scholar] [CrossRef]
  49. Delgado, A.; Gómez, J.A. The Soil. Physical, Chemical and Biological Properties. In Principles of Agronomy for Sustainable Agriculture; Villalobos, F., Fereres, E., Eds.; Springer: Cham, Switzerland, 2016; pp. 15–26. [Google Scholar] [CrossRef]
  50. Arshad, M.A.; Coen, G.M. Characterization of soil quality: Physical and chemical criteria. Am. J. Altern. Agric. 1992, 7, 25–31. [Google Scholar] [CrossRef]
  51. Karlen, D.L.; Mausbach, M.J.; Doran, J.W.; Cline, R.G.; Harris, R.F.; Schuman, G.E. Soil quality: A concept, definition and framework for evaluation. Soil Sci. Soc. Am. J. 1997, 61, 4–10. [Google Scholar] [CrossRef] [Green Version]
  52. Tucker, L.R.; Lewis, C. The reliability coefficient for maximum likelihood factor analysis. Psychometrika 1973, 38, 1–10. [Google Scholar] [CrossRef]
  53. Wen, Z.L.; Hou, K.T.; Marsh, H.W. Structural equation model testing: Cutoff criteria for goodness of fit indices and chi- square test. Acta Psychol. Sin. 2004, 36, 186–194. Available online: https://journal.psych.ac.cn/acps/EN/Y2004/V36/I02/186 (accessed on 26 September 2022).
  54. Steiger, J.H. Structure model evaluation and modification: An interval estimation approach. Multivar. Behav. Res. 1990, 25, 173–180. [Google Scholar] [CrossRef] [PubMed] [Green Version]
  55. Armenise, E.; Redmile-Gordon, M.A.; Stellacci, A.M.; Ciccarese, A.; Rubino, P. Developing a soil quality index to compare soil fitness for agricultural use under different managements in the Mediterranean environment. Soil Till. Res. 2013, 130, 91–98. [Google Scholar] [CrossRef]
  56. Legaz, B.V.; Souza DM, D.; Teixeira RF, M.; Antón, A.; Putman, B.; Sala, S. Soil quality, properties, and functions in life cycle assessment: An evaluation of models. J. Clean. Prod. 2017, 140, 502–515. [Google Scholar] [CrossRef]
  57. Wolf, E.J.; Harrington, K.M.; Clark, S.L.; Miller, M.W. Sample Size Requirements for Structural Equation Models: An Evaluation of Power, Bias, and Solution Propriety. Educ. Psychol. Meas. 2013, 76, 913–934. [Google Scholar] [CrossRef] [PubMed]
  58. Shahana, F.; Shaheen, B.; Azra, Y. Assessment of soil quality parameters usingmultivariate analysis in the Rawal Lake watershed. Environ. Monit. Assess. 2016, 188, 533. [Google Scholar] [CrossRef]
  59. Arslan, S. Assessment of groundwater and soil quality for agricultural purposes in Kopruoren basin, Kutahya, Turkey. J. Afr. Earth Sci. 2017, 131, 1–13. [Google Scholar] [CrossRef]
  60. Lin, Y.M.; Deng, H.J.; Du, K.; Li, J.; Li, H.; Chen, C.; Fisher, L.; Wu, C.Z.; HONG, T.; Zhang, G.S. Soil quality assessment in different climate zones of China’sWenchuan earthquake affected region. Soil Till. Res. 2017, 165, 315–324. [Google Scholar] [CrossRef]
  61. Ashwood, F.; Butt, K.R.; Doick, K.J.; Vanguelova, E.I. Interactive effects of composted green waste and earthworm activity on tree growth and reclaimed soil quality: A mesocosm experiment. Appl. Soil Ecol. 2017, 119, 226–233. [Google Scholar] [CrossRef] [Green Version]
  62. Veum, K.S.; Sudduth, K.A.; Kremer, R.J.; Kitchen, N.R. Sensor data fusion for soil health assessment. Geoderma 2017, 305, 53–61. [Google Scholar] [CrossRef]
  63. Zhou, L.L.; Shalom, A.D.D.; Wu, P.F.; He, Z.M.; Liu, C.H.; Ma, X.Q. Biomass production, nutrient cycling and distribution in age-sequence Chinese fir (Cunninghamia lanceolate) plantations in subtropical China. J. For. Res. 2016, 27, 357–368. [Google Scholar] [CrossRef]
  64. Wang, C.Q.; Xue, L.; Dong, Y.H.; Hou, L.Y.; Wei, Y.H.; Chen, J.Q.; Jiao, R.Z. Contrasting effects of Chinese fir plantations of different stand ages on soil enzyme activities and microbial communities. Forests 2019, 10, 11. [Google Scholar] [CrossRef] [Green Version]
  65. Wang, K.Q.; Wang, S.L.; Xu, G.B.; Fan, B. Conversion of secondary broadleaved forest into Chinese fir plantation alters litter production and potential nutrient returns. Plant. Ecol. 2010, 209, 269–278. [Google Scholar] [CrossRef]
  66. Diao, J.; Liu, J.; Zhu, Z.; Wei, X.; Li, M. Active forest management accelerates carbon storage in plantation forests in Lishui, southern China. For. Ecosyst. 2022, 9, 100004. [Google Scholar] [CrossRef]
  67. Jia, Y.Y.; He, Z.M.; Zhou, L.L.; Ma, X.Q.; Wu, P.F.; Zou, X.H.; Liu, Q.Q.; Liu, Y.H. Effects of afforestation density on growth and space utilization of young fir forests. Chin. J. Ecol. 2016, 35, 1177–1181. [Google Scholar] [CrossRef]
  68. Huang, Z.Q.; He, Z.M.; Wan, X.H.; Hu, Z.H.; Fan, S.H.; Yang, Y.S. Harvest residue management effects on tree growth and ecosystem carbon in a Chinese fir plantation in subtropical China. Plant Soil 2013, 364, 303–314. [Google Scholar] [CrossRef]
  69. Wu, Y.L.; Wang, B.; Zhao, C.; Dai, W.; Li, P. Comprehensive evaluationof soils fertility in different developing stages of Chinese Fir Plantations. J. Northwest AF Univ. 2011, 39, 69–75. [Google Scholar] [CrossRef]
  70. Li, H.T.; Zhang, Y.; Wei, Z.C.; Jia, D.D.; Liu, Y.H.; Liu, A.Q. Evaluation on Soil Fertility of Chinese Fir Plantations in Different Development Stages. For. Res. 2017, 30, 322–328. [Google Scholar] [CrossRef]
  71. Lin, K.M.; Yu, X.T.; Huang, B.L.; He, Z.Y. Dynamical characteristics of undergrowthplant diversity in Chinese fir plantations. J. Appl. Ecol. 2001, 7, 13–19. [Google Scholar] [CrossRef]
  72. Qi, R.M.; Li, J.; Lin, Z.A.; Li, Z.J.; Li, Y.T.; Yang, X.D.; Zhang, J.J.; Zhao, B. Temperature effects on soil organic carbon, soil labile organic carbonfractions, and soil enzyme activities under long-term fertilization regimes. Appl. Soil Ecol. 2016, 102, 36–45. [Google Scholar] [CrossRef]
  73. Kim, S.; Li, G.; Han, S.H.; Kim, H.J.; Kim, C.; Lee, S.T.; Son, Y. Thinning affects microbial biomass without changing enzyme activity in the soil of Pinus densiflora Sieb. et Zucc. forests after 7 years. Ann. Forest Sci. 2018, 75, 13. [Google Scholar] [CrossRef] [Green Version]
  74. Ma, J.Y.; Han, H.R.; Zhang, W.W.; Cheng, X.Q. Dynamics of nitrogen and activenitrogencomponents across seasons under varying stand densities in a Larixprincipis-rupprechtii (Pinaceae) plantation. Peerj 2018, 6, e5647. [Google Scholar] [CrossRef] [PubMed] [Green Version]
  75. Sione, S.M.J.; Wilson, M.G.; Lado, M.; González, A.P. Evaluation of soil degradation produced by rice crop systems in a Vertisol, using a soil quality index. Catena 2017, 150, 79–86. [Google Scholar] [CrossRef]
  76. Couic, E.; Grimaldi, M.; Alphonse, V.; Balland-Bolou-Bi, C.; Livet, A.; Giusti-Miller, S.; Sarrazin, M.; Bousserrhine, N. Mercury behaviour and C, N, and P biogeochemical cycles during ecological restoration processes of old mining sites in French Guiana. Environ. Sci. Proc. Imp. 2018, 20, 657–672. [Google Scholar] [CrossRef]
  77. Raiesi, F. A minimum data set and soil quality index to quantify the effect of land use conversion on soil quality and degradation in native rangelands of upland arid and semiarid regions. Ecol. Indic. 2017, 75, 307–320. [Google Scholar] [CrossRef]
  78. Paul, T.E. Healing qualities of creative behavior. Creat. Child Adult Q. 1978, 3, 146–158. [Google Scholar]
  79. Jonsson, M.; Wardle, D.A. Structural equation modelling reveals plant-community drivers of carbon storage in boreal forest ecosystems. Biol. Lett. 2010, 6, 116–119. [Google Scholar] [CrossRef] [Green Version]
  80. Bentler, P.M.; Chou, C.P. Practical issues in structural modeling. Sociol. Method. Res. 1987, 16, 78–117. [Google Scholar] [CrossRef]
  81. Boomsma, A. On the robustness of LISREL (maximum likelihood estimation) against small sample size and non-normality. J. Am. Stat. Assoc. 1984, 79, 480. [Google Scholar] [CrossRef]
  82. Muthén, B.O. Beyond SEM: General Latent Variable Modeling. Behaviormetrika 2002, 29, 81–117. [Google Scholar] [CrossRef] [Green Version]
  83. Ma, X.Q.; Heal, K.V.; Liu, A.Q.; Jarvis, P.G. Nutrient cycling and distributionin different-aged plantations of Chinese fir in southern China. For. Ecol. Manag. 2007, 243, 61–74. [Google Scholar] [CrossRef]
  84. Yu, Y.C.; Yang, J.Y.; Zeng, S.C.; Wu, D.M.; Jacobs, D.F.; Sloan, J.L. Soil pH, organic matter, and nutrient content change with the continuous cropping of Cunninghamia lanceolata plantations in South China. J. Soil Sediment. 2017, 17, 2230–2238. [Google Scholar] [CrossRef]
  85. Marzaioli, R.; Ascoli, R.D.; De Pascale, R.A.; Rutigliano, F.A. Soil quality in a Mediterranean area of Southern Italy as related to different land use types. Appl. Soil Ecol. 2009, 44, 205–212. [Google Scholar] [CrossRef]
  86. Chaudhari, P.R.; Ahire, D.V.; Ahire, V.D.; Chkravarty, M.; Maity, S. Soil bulk density as related to soil texture, organic matter content and available total nutrients of Coimbatore soil. Int. J. Sci. Res. Pub. 2013, 3, 1–8. [Google Scholar]
  87. Tracy, S.R.; Black, C.R.; Roberts, J.A.; Mooney, S.J. Soil compaction: A review of past and present techniques for investigating effects on root growth. J. Sci. Food. Agric. 2011, 91, 1528–1537. [Google Scholar] [CrossRef] [PubMed]
  88. Tanaka, S.; Kendawang, J.J.; Yoshida, N.; Shibata, K.; Jee, A.; Tanaka, K.; Ninomiya, I.; Sakurai, K. Effects of shifting cultivation on soilecosystems in Sarawak, Malaysia IV. Chemical properties of the soils and runoff water at Niah and Bakam experimental sites. Soil Sci. Plant. Nutr. 2005, 51, 525–533. [Google Scholar] [CrossRef]
  89. Rao, M.A.; Violante, A.; Gianfreda, L. Interaction of acid phosphatasewith clays, organic molecules and organo-mineral complexes: Kinetics and stability. Soil Biol. Biochem. 2000, 32, 1007–1014. [Google Scholar] [CrossRef]
  90. Dick, W.A.; Tabatabai, M.A. Significance and Potential Uses of Soil Enzymes; Marcel Dekker: New York, NY, USA, 1992; pp. 95–127. [Google Scholar]
Figure 1. The geographic location of the Fushoushan Town study area is in Pingjiang County, Hunan province in China. (a) The geography of Hunan Province, (b) the geography of Fushoushan Town, and, (c) the soil sampling points.
Forests 14 01217 g001
Figure 2. Theoretical model for evaluating soil quality. SPI: soil physical indicators, SCI: soil chemical indicators, SBI: soil biological indicators.
Forests 14 01217 g002
Figure 3. Changes in physical, chemical, and biological characteristics with soil depth in different age group stands. Note: Different uppercase letters indicate significant differences between the same soil layers in different age groups (p < 0.05), while lower case letters indicate significant differences between different soil layers in the same age group stand (p < 0.05). I: young forest stand; II: middle aged forest stand; III: near mature forest stand; IV: mature stand; V: over mature forest stand. (ao): Number of subgraphs.
Forests 14 01217 g003
Figure 4. The path coefficients of the modified model for the evaluation of soil quality.
Forests 14 01217 g004
Figure 5. The variation in soil quality index (SQI) across different forest aged groups. Lower case letters indicate significant differences (p < 0.05).
Forests 14 01217 g005
Table 1. The environmental characteristics of soil sampling sites.
Age GroupAgeAspect Average SlopeAverage HeightAverage DBHAverage Stand DensityAverage UnderGrowth
(Years) (°)(m)(cm)(Plants·ha−1) (% Cover)
Young forest8Northeast247.29.1302845
Middle aged forest14East238.510.3335917
Near mature forest20East2812.614.4143565
Mature forest26Northeast2613.917.5121978
Over mature forest33East3128.930.6101392
Table 2. The structural equation modeling assumptions for forest soil quality.
NumberHypothetical Content
HlSoil physical properties have significant positive effects on forest soil quality
H2Soil chemical properties have significant positive effects on forest soil quality
H3Soil biological properties have significant positive effects on forest soil quality
Table 3. Sample data reliability and validity test.
Latent VariableNumber of Measured IndicatorsCronbach’s AlphaKaiser–Meyer–Olkin
Soil physical properties50.8950.832
Soil chemical properties60.8690.812
Soil biological properties40.7940.748
Table 4. The weights of soil properties for evaluating soil quality.
Target LayerCode LevelWeightingIndicator LayerWeighting
Soil qualitySPI0.3316BD0.2369
WHC0.2319
TCP0.2020
CP0.1920
NCP0.1372
SCI0.3674AK0.1150
SOM0.1952
PH0.1931
TN0.1822
AP0.1692
AN0.1453
SBI0.3010ACP0.2857
INV0.2643
CAT0.2071
URE0.2429
Disclaimer/Publisher’s Note: The statements, opinions and data contained in all publications are solely those of the individual author(s) and contributor(s) and not of MDPI and/or the editor(s). MDPI and/or the editor(s) disclaim responsibility for any injury to people or property resulting from any ideas, methods, instructions or products referred to in the content.

