Article

Phenotypic Diversity Analysis in Elaeagnus angustifolia Populations in Gansu Province, China

1
College of Forestry, Gansu Agricultural University, Lanzhou 730070, China
2
Wolfberry Harmless Cultivation Engineering Research Center of Gansu Province, Lanzhou 730070, China
*
Author to whom correspondence should be addressed.
Forests 2023, 14(6), 1143; https://doi.org/10.3390/f14061143
Submission received: 25 April 2023 / Revised: 24 May 2023 / Accepted: 29 May 2023 / Published: 31 May 2023

Abstract

:
As a highly resistant urban ornamental plant, Elaeagnus angustifolia L. is often used in dry land, saline-alkali land shelter forest, and landscape horticulture. It is the main windbreak and sand-fixing tree species in Gansu Province, China. The special geographical and climatic environment makes the distribution and growth of E. angustifolia in Gansu Province show different degrees of difference. In order to evaluate the phenotypic diversity of E. angustifolia in different populations and its variation patterns under different geographical and climatic conditions, 35 phenotypic traits (trunk, branch, leaf, and flower related traits) of 90 plants from 10 populations in Gansu Province were measured and analyzed. The results showed the following: (1) E. angustifolia has rich phenotypic variation. The variation is greater among populations. The traits with the largest and smallest coefficients of variation were “under-branch height” and “flower diameter”, respectively. The variation in the Qilihe population was the largest, and the variation in the Ganzhou population was the smallest. The diversity of flowers and leaves is relatively higher. (2) Correlation analysis showed that most of traits were closely related. Leaf traits showed a gradient variation law dominated by altitude and precipitation. Flower traits were affected by the synergistic effects of various geographical and climatic factors. (3) The results of the principal component analysis (PCA) showed that the primary traits affecting the phenotypic diversity of E. angustifolia were leaf size and branch length among the related traits of trunk, branch, leaf, and flower. (4) Cluster analysis showed that 90 E. angustifolia plants were clustered into four clusters that were not completely clustered according to geographical distance and may be randomly affected by genotypic or environmental factors. These results will lay a foundation for further analysis of the genetic mechanism of phenotypic traits of E. angustifolia and also provide a reference for the collection, preservation, and variety improvement of E. angustifolia germplasm resources.

1. Introduction

Phenotypic traits are the most intuitive manifestations of plant growth showing diversity and are affected by their own genetic characteristics and environmental factors [1]. Plant growth reflects the adaptation of genotypes to environmental changes, irreversible changes in long-term stress selection, and new phenotypes after stable inheritance. Therefore, phenotypic variation is often crucial in adaptation and evolution [2]. Phenotypic diversity is an important indicator and main research variable used to measure species diversity. Studying the phenotypic diversity of plants and exploring the differences among species or populations not only helps in understanding the response of plants to the ecological environment, and then exploring their development and evolution [3,4,5], but also contributes to the protection and management of germplasm resources [6], which is of great significance for the introduction and breeding of plants. At the same time, the study of phenotypic traits is also used to define new varieties to be protected. Because the information generated by plant morphological characterization comes from large datasets composed of qualitative and quantitative features, the use of multivariate analysis is particularly suitable for this situation [7]. Among them, correlation analysis, principal component analysis, and cluster analysis are the most common and effective analysis methods in phenotypic diversity research. At present, they have been applied to the phenotypic analysis of many plants, such as Hyphaene compressa, Crataegus orientalis, Citrus microcarpa, etc. [8,9,10].
Gansu Province is located in the western region of China. It is located at the intersection of the upper reaches of the Yellow River and the Loess Plateau, the Qinghai–Tibet Plateau, and the Inner Mongolia Plateau. The topography of Gansu Province is narrow and long, and the landform and climate types are complex and diverse [11]. From southeast to northwest, it extends into a narrow zone of 1600 km. The mountains, plateaus, plains, valleys, deserts, and Gobi are interlaced, and the geographical environment is complex. The climate type spans three thermal zones: subtropical, warm temperate, and temperate zones. The precipitation decreases from more than 600 nm to less than 100 mm in the northwest. The regional differences are obvious, and the biodiversity is also regionally distributed, which makes the distribution and growth of plants show different degrees of difference [12,13]. The genetic diversity of the fruit phenotypic traits of natural populations of Calligonum mongolicum in Gansu Province was studied by Tian et al. It was found that the phenotypic variation degree of 12 natural populations of C. mongolicum was higher, and the phenotypic variation showed a gradient regularity with latitude and longitude variation [14]. Luo et al. studied the phenotypic characteristics and diversity of walnut nuts in Gansu Province. It was found that the walnut resources in this region had rich phenotypic diversity, and the variation among populations was small. The variation within populations was the main source of phenotypic diversity of walnut nuts in Gansu Province. The results of cluster analysis were positively correlated with geographical distance or climatic conditions [15].
Elaeagnus angustifolia L. is a deciduous tree or shrub of Elaeagnus, which is native to southern Europe and Asia [16]. In China, it is mainly distributed in the northwest provinces and western Inner Mongolia. E. angustifolia has the characteristics of wind and sand resistance, salt tolerance, drought resistance, high-temperature resistance, barren resistance, and easy reproduction [17]. It has been a popular shrub for windbreaks and shelterbelts in semi-arid and saline environments because of its adaptability [16]. E. angustifolia also has high ornamental value. It has a unique tree shape, color, and fragrance. Its highly esthetic appearance and life forms favor its use in landscape horticulture (amenity parks and forests, hedges, the greening of streets, and public spaces, etc.) [18]. It is also an economic tree species with multiple functions. Its branches, leaves, flowers, and fruits have the values of development and utilization. At present, it is widely used for food, medicine, papermaking, foraging, wood, and furniture in China. E. angustifolia plays a great role in ensuring stable agricultural harvests, ecological environment maintenance, and landscape construction in Gansu and other places.
As a multifunctional tree species with high ecological, ornamental, and economic value, scholars from various countries have conducted a wide range of research on E. angustifolia. These studies have mainly focused on its pharmacological effects [19], edible value [20], active ingredient extraction [21], and stress resistance [22], etc., and research on the phenotypic traits of E. angustifolia is relatively lacking. In previous studies, Safdari et al. used multivariate analysis to study its phenotypic diversity related to fruit quality in Iran [23]. Zeng et al. conducted a phenotypic diversity analysis and ornamental evaluation of E. angustifolia in Zhangye City, Gansu Province [24]. Xu et al. [25] and Fan et al. [26] analyzed the diversity of germplasm resources of E. angustifolia in Gansu, Inner Mongolia, Ningxia, and other places. However, there is a lack of in-depth research on the comprehensive phenotypic analysis of the plant shape, branches, leaves, and flowers of E. angustifolia and its correlation with environmental factors, which is not conducive to the further exploration of the growth law and ornamental value of E. angustifolia. From long-term field observations, we found that E. angustifolia in Gansu Province has formed a rich resource diversity under a complex geography, climate, and long cultivation history, and different regions have significant phenotypic differences. Therefore, some reasons for the phenotypic diversity of E. angustifolia can be explained by exploring its phenotypic variation, so as to understand the response of E. angustifolia growth to the ecological environment and also provide some basis for the genetic improvement, diversity conservation, and resource management of E. angustifolia [27].
In this study, 10 populations of E. angustifolia in Gansu Province were used as the research object, and 35 phenotypic traits related to the plant shape, branch, leaf, and flower of E. angustifolia were measured and analyzed. Our main objectives are the following: (1) to estimate whether the phenotypic variation mainly comes from within the population or among populations; (2) to understand the variation degree and diversity level of E. angustifolia phenotypes in different environments; and (3) to reveal the relationship between phenotypic variation and geographical and climatic factors. Our research results are of great significance to the establishment of the identification and evaluation system of E. angustifolia germplasm resources and will lay a data foundation for the introduction, development, and directional breeding of high-quality varieties.

2. Materials and Methods
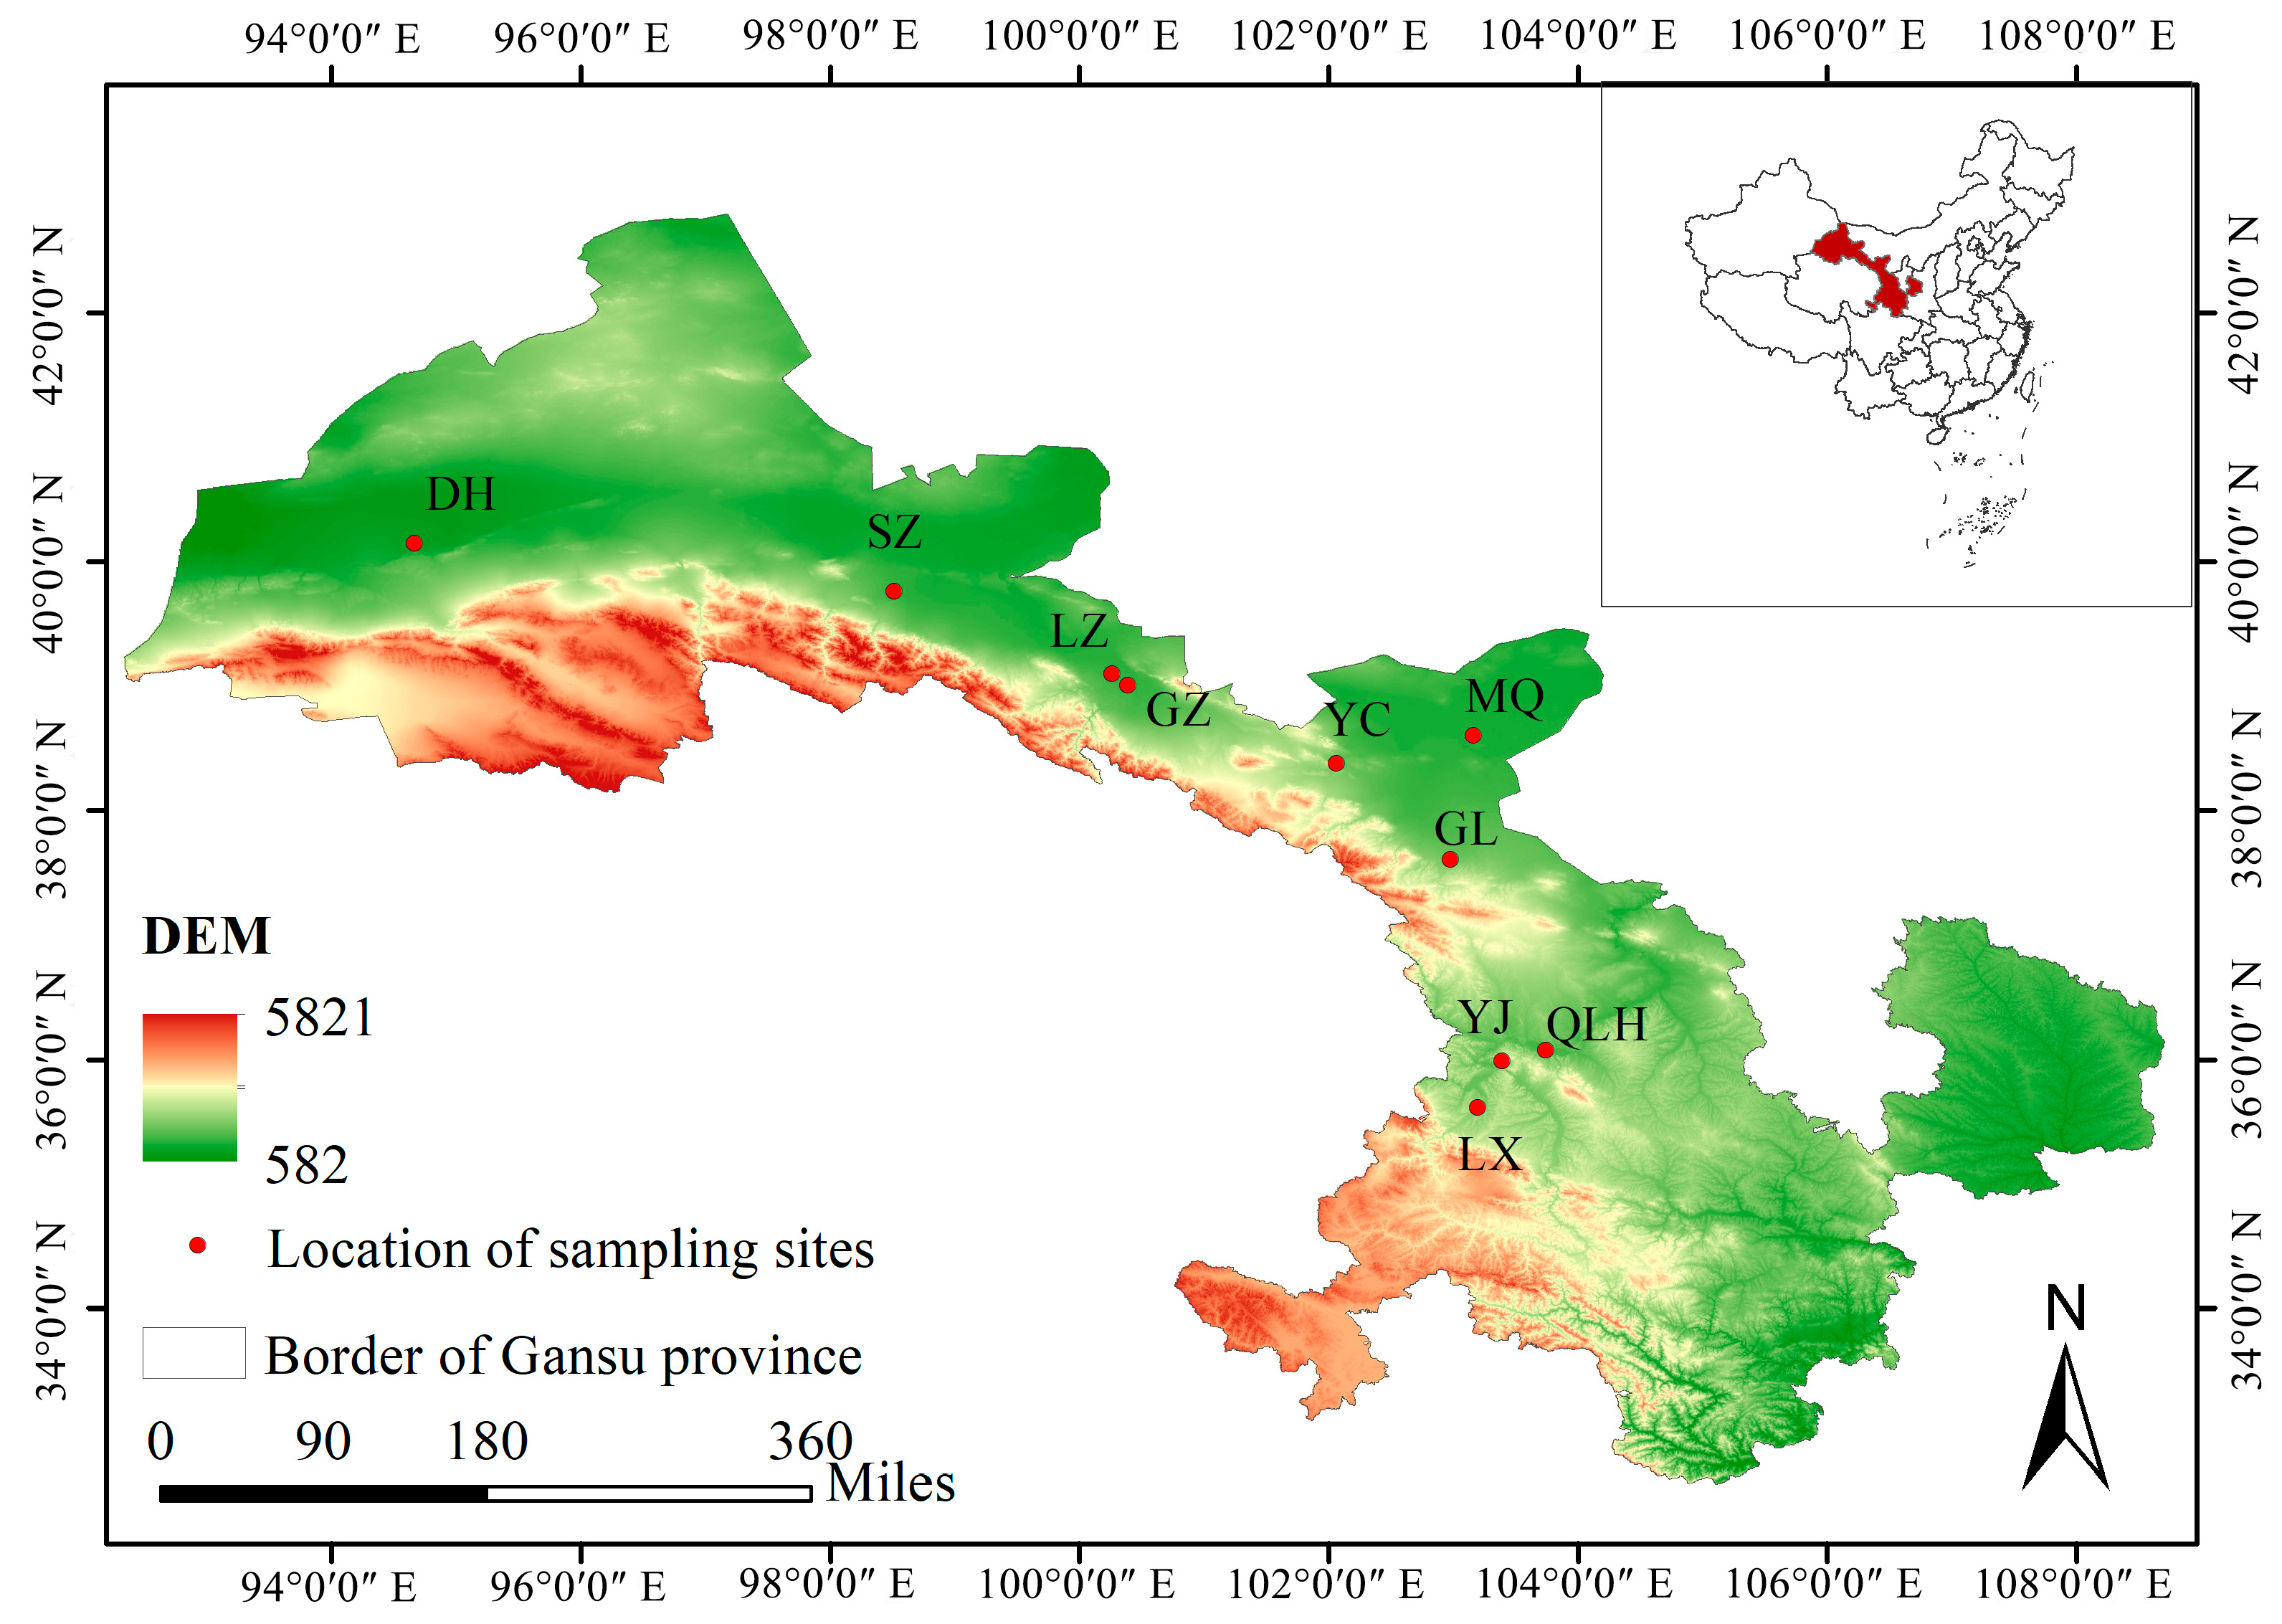
2.1. Plant Material

According to the distribution records of E. angustifolia in the Chinese Virtual Herbarium (http://www.cvh.ac.cn/, accessed on 12 August 2022) and the field investigation, this study selected 10 counties as the research population sites in the areas where E. angustifolia is distributed in Gansu Province. The E. angustifolia in the study area is mostly distributed in the suburbs, roads, or villages, and a small part is distributed in parks or temples. Almost all of these areas, there is soil drought and poor site conditions. In the field investigation, a GPS positioning system was used to obtain the altitude, longitude, and latitude of each group. The climate data were the cumulative average values of 10 county/district meteorological stations in the surrounding area of the sampling points published by the National Meteorological Data of China (http://data.cma.cn/, accessed on 12 August 2022) from 1981 to 2010. The detailed information is shown in Figure 1 and Table 1.
Because of the COVID-19 pandemic, the survey and sampling time of this study were performed from 25 May 2022 to 5 June 2022. In each population, 3–20 plants with normal growth, no obvious defects and diseases and insect pests, and a plant age > 5a were randomly selected as research samples (in principle, the number of samples in each population should have been more than 10, but in some populations, due to the lack of samples or sampling difficulties, the number of samples is less than 10), and the spacing of samples was more than 15 m. The plant height, diameter at breast height, and branch height of the sample plants were measured, respectively. At the same time, 10 groups of complete branches, leaves, and florets were evenly selected from the upper, middle, and lower parts of each sample plant, and the relevant indicators were measured on site.

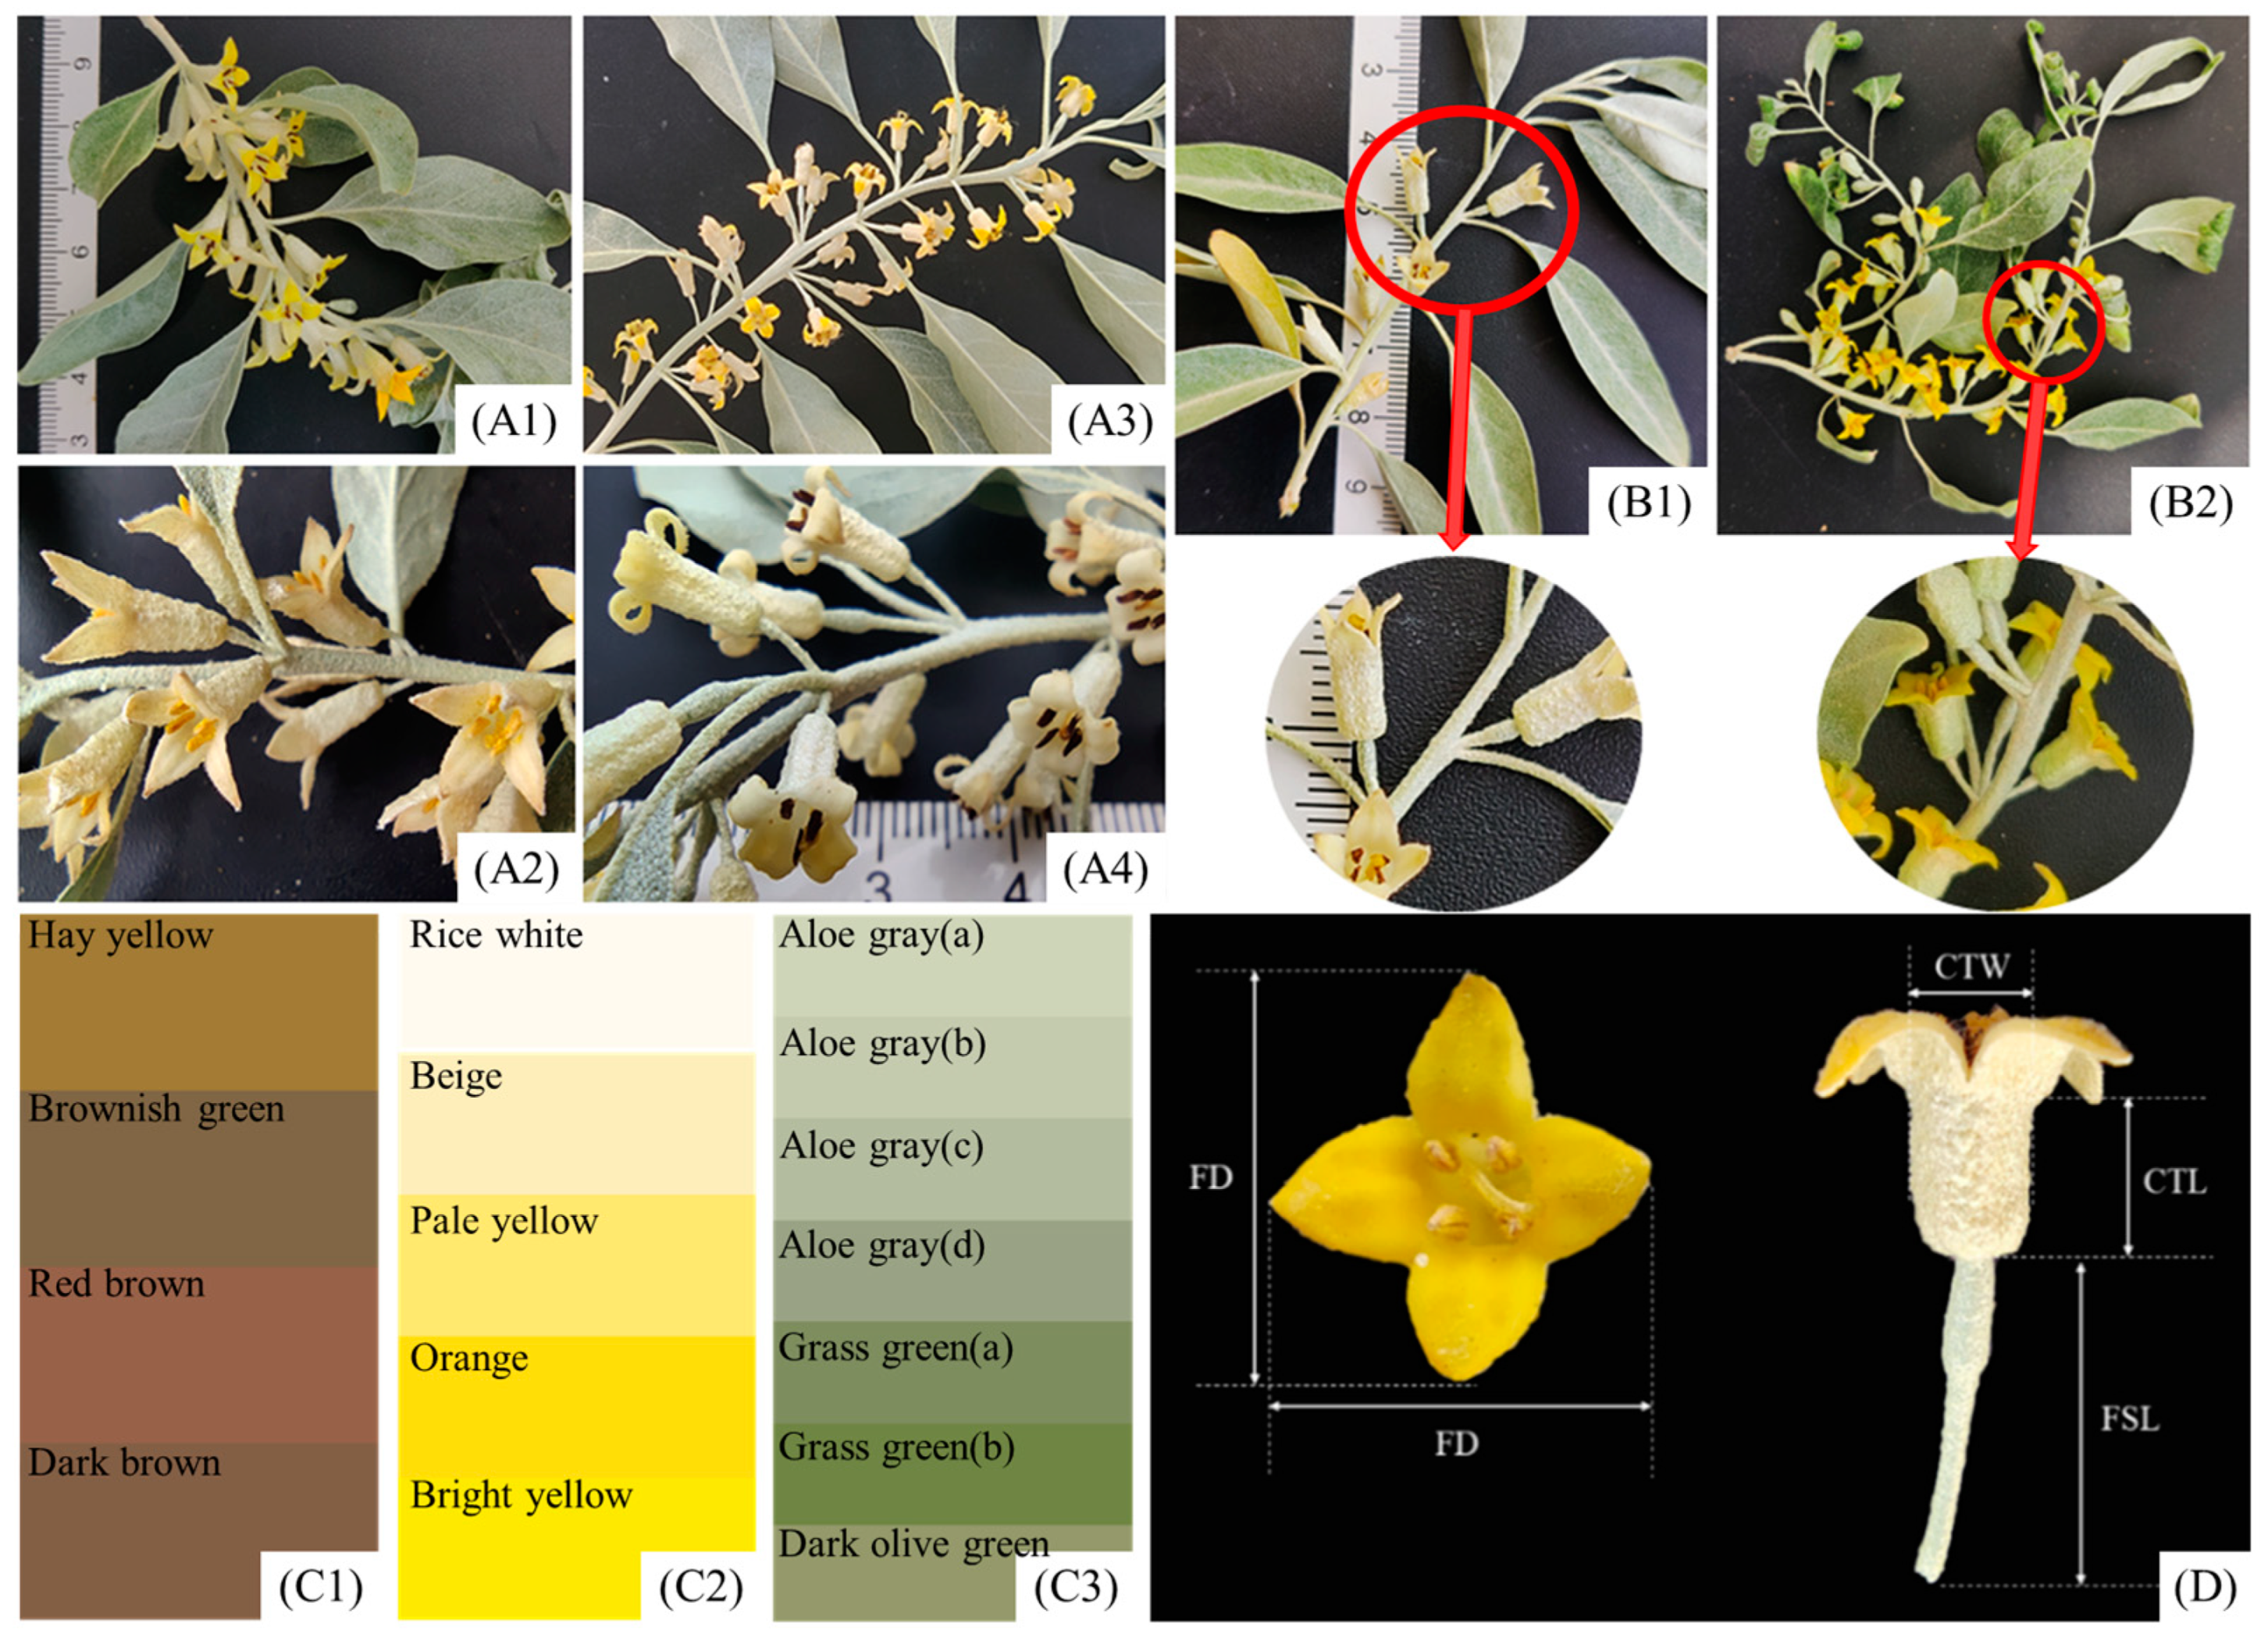
2.2. Morphometric Analysis

The phenotypic traits of E. angustifolia were divided into quantitative traits and quality traits. Quantitative traits, including 21 traits such as tree height, crown diameter, and diameter at breast height, were quantitatively evaluated (Table 2). The qualitative traits included 14 traits such as trunk type, crown roundness, canopy density, and the qualitative evaluation method was used (Table 3).
Tree height was measured by a tree-height-measuring instrument. The crown diameter, diameter at breast height, and under-branch height were measured by a tape measure. The branching number (based on the first branch on the ground), number of flower clusters on annual branches, flower color number, and floret number in the axils of leaves were counted and recorded. Annual branch length, leaf length, leaf width, petiole length, leaf thickness, flower diameter, calyx tube length, calyx tube width, and flower stalk length were measured by a scale and vernier caliper. Leaf area was measured by a leaf area analyzer (WinRhizo; Regent Instruments Inc., Quebec, QC, Canada). Flower color, leaf upper surface color, leaf lower surface color, and branch color were compared and recorded with color cards (Figure 2).

2.3. Statistical Analysis

2.3.1. Analysis of Variance

Statistically significant differences within and among populations were determined by nested analysis of variance. The linear model comprises the following:
Y i j k = μ + τ i + δ j i + ε i j k
Y i j k is the kth observed value of the jth family in the ith population, μ is the total average, τ i is the effect value among populations, δ j i is the random effect value of the individual plant (family) in the population, and ε i j k is the random error [28].

2.3.2. Phenotypic Differentiation Coefficient

The phenotypic differentiation within and among populations was reflected by the phenotypic differentiation coefficient ( V S T ). The formula comprises the following:
V S T = σ t / s 2 σ t / s 2 + σ s 2
σ t / s 2 is the variance component among populations, and σ s 2 is the variance component within the population (family) [27,29].

2.3.3. Descriptive Statistics

Descriptive statistics were performed on the morphometrics of each population using SPSS 20.0 software, including the arithmetic mean (X), standard deviation (SD), Duncan’s multiple comparison, and coefficient of variation (CV) to determine the range of variation [30].
CV = SD / X -

2.3.4. Diversity Index

The diversity index of each trait was calculated by EXCEL2010 software. The Shannon–Wiener index (H′) is a quantitative expression used to describe the degree of variation of trait diversity. The calculation formula is the following:
H = Σ P i × ln P i
H is the diversity index and P i is the effective percentage of the distribution frequency in the ith grade material of a trait. The distribution frequency of quality traits is expressed as the percentage of the number of sample plants at a certain level of traits to the total number of sample plants. The average value and standard deviation of the quantitative traits were calculated, and the obtained quantitative trait data were graded and standardized. According to the total average (X) and standard deviation (SD), they were divided into 10 levels. Among them, level 1 was less than X - – 2SD, level 10 was greater than X - + 2SD, and the difference between each level was 0.5SD [24,31].

2.3.5. Multivariate Analysis

Multivariate statistical methods were used to further determine the structure and differences in the phenotypic traits of E. angustifolia. The correlation between each trait and the correlation between traits and geographical climatic factors were obtained by Pearson’s correlation analysis. Principal component analysis (PCA) was used to reduce the dimension of each index to obtain the key indexes affecting the phenotype of E. angustifolia. Loading plot and biplot analysis were performed according to the obtained PC1, PC2, and PC3. Ward cluster analysis was used to divide the studied samples into different groups, and a circular tree diagram was constructed with the square Euclidean distance as the measurement method [32]. Before the clustering analysis, the original data were processed by Z standardization (STD) to eliminate the influence of different dimensions on the analysis. The above statistical analysis and graphics were completed by SPSS20.0 and Origin 2022 software.

3. Results

3.1. Phenotypic Differences among and within Populations

The variance analysis of E. angustifolia phenotypic traits showed that 29 traits were significantly different among populations (p < 0.01), and only nine traits were significantly different within populations (p < 0.01). It can be seen that most phenotypic traits were widely different among different populations, but there was no significant difference among different plants in the same population (Table 4).
According to the results of the nested variance analysis, the variance components and phenotypic differentiation coefficients of 35 phenotypic traits of E. angustifolia among and within populations were calculated, respectively (Table 4). The phenotypic differentiation coefficients of each trait among populations ranged from 21.29% to 92.59%, with an average of 54.15%. The traits with the largest and smallest phenotypic differentiation coefficient were FNAL and FDD. This shows that the floret number in axils of leaves is more differentiated among populations, while the flower density degree is less differentiated and relatively stable. The average variance components of phenotypic traits among and within populations accounted for 27.28% and 21.49% of the total variation, respectively, indicating that there was a certain degree of variation in the phenotypic traits of E. angustifolia among and within populations, and the variation was greater among populations.

3.2. Variation Degree of Phenotypic Traits

The variation range and degree of 21 quantitative traits of 10 populations are reflected by the mean value, standard deviation, and coefficient of variation (CV) (Table S1 and Table 5). The results show that there was abundant phenotypic variation in the quantitative traits of E. angustifolia.
The variation levels of different populations were different. The average CV of nine in 10 populations was more than 20%. The highest CV was found in the Qilihe population (30.58%), and the lowest was in the Ganzhou population (19.51%), but still close to 20%.
There were also significant differences in the variation levels of different traits. The CV of each trait ranged from 11.05% to 61.61%, with an average of 30.72%. Among them, the trait with the highest CV was under-branch height (UBH) (61.61%). At the same time, the CVs of the diameter at breast height (DBH) (60.87%), leaf area (LA) (46.93%), branching angle (BA) (43.64%), and crown diameter (CrD) (41.64%) were also large, with rich polymorphism and variability. The flower diameter (FD) (11.05%) and calyx tube length (CTL) (12.04%) are the two traits with the smallest CVs and relative stability. In general, the CV of traits related to flowers and leaves was small, while the CV of traits related to trunk shape was large. The CV of the same trait was also significantly different among different populations.

3.3. Diversity Index of Phenotypic Traits

It can be seen from Table 6 that there are different degrees of difference in the distribution frequency of 14 quality traits. Among them, the number of sample plants with a trunk type (TT) of grade 3 accounted for 80.0%, indicating that E. angustifolia was dominated by arbors and less distributed in shrubs within the scope of the investigation. The number of sample plants with 1-level crown roundness (CR) accounted for 55.6%, indicating that the overall plant shape of the sample plants was relatively disordered. The proportions of tree growth vigor (TGV) and flower density degree (FDD) of grade 3 reached 61.1% and 51.1%, respectively. More than half of the tested trees had a higher growth vigor and dense flowers, indicating that E. angustifolia could grow normally in various habitats. Branch thorns (BT) only existed in a small number of samples (34.4%). The dark brown and brownish green branches (BC) accounted for a relatively high proportion (42.2%, 32.2%), and the distribution of flower color (FC), leaf upper surface color (LUSC), leaf lower surface color (LLSC), and speckles on leaves (SL) was small at various levels. In addition, the petal spreading state (PSS) was mainly explanate (77.8%), the leaf shape (LS) was mostly lanceolate (48.9%), and the leaf apex shape (LAS) was mainly acuminate (62.2%).
According to the Shannon–Wiener diversity indexes of the 14 quality traits, the diversity of the different traits was different (Table 6). The diversity indexes ranged from 0.53 to 1.81, with an average of 1.0294. The diversity of leaf upper surface color (LUSC) was the highest (1.81). The diversity of petal spreading state (PSS) was the lowest (0.55). The phenotypic diversity index of 21 quantitative traits ranged from 0.24 to 2.07 (Table 5), with an average of 1.7864. Among them, the diversity of the flower density degree (FDD) was the highest (2.0723). The diversity indexes of leaf length (LL), leaf thickness (LT), leaf shape index (LSI), annual branch length (ABL), ratio of flower cluster number to branch length (RFB), flower diameter (FD), and calyx tube length (CTL) also exceeded 2. The diversity of the floret number in axils of leaves (FNAL) was the lowest (0.2449).
In general, 21 quantitative traits had a high phenotypic diversity, and it was much higher than their quality trait diversity indexes, indicating that the phenotypic quantitative traits of E. angustifolia were relatively more abundant and the quality traits were more stable. From the overall results, the flower and leaf parts of E. angustifolia have a high degree of diversity.

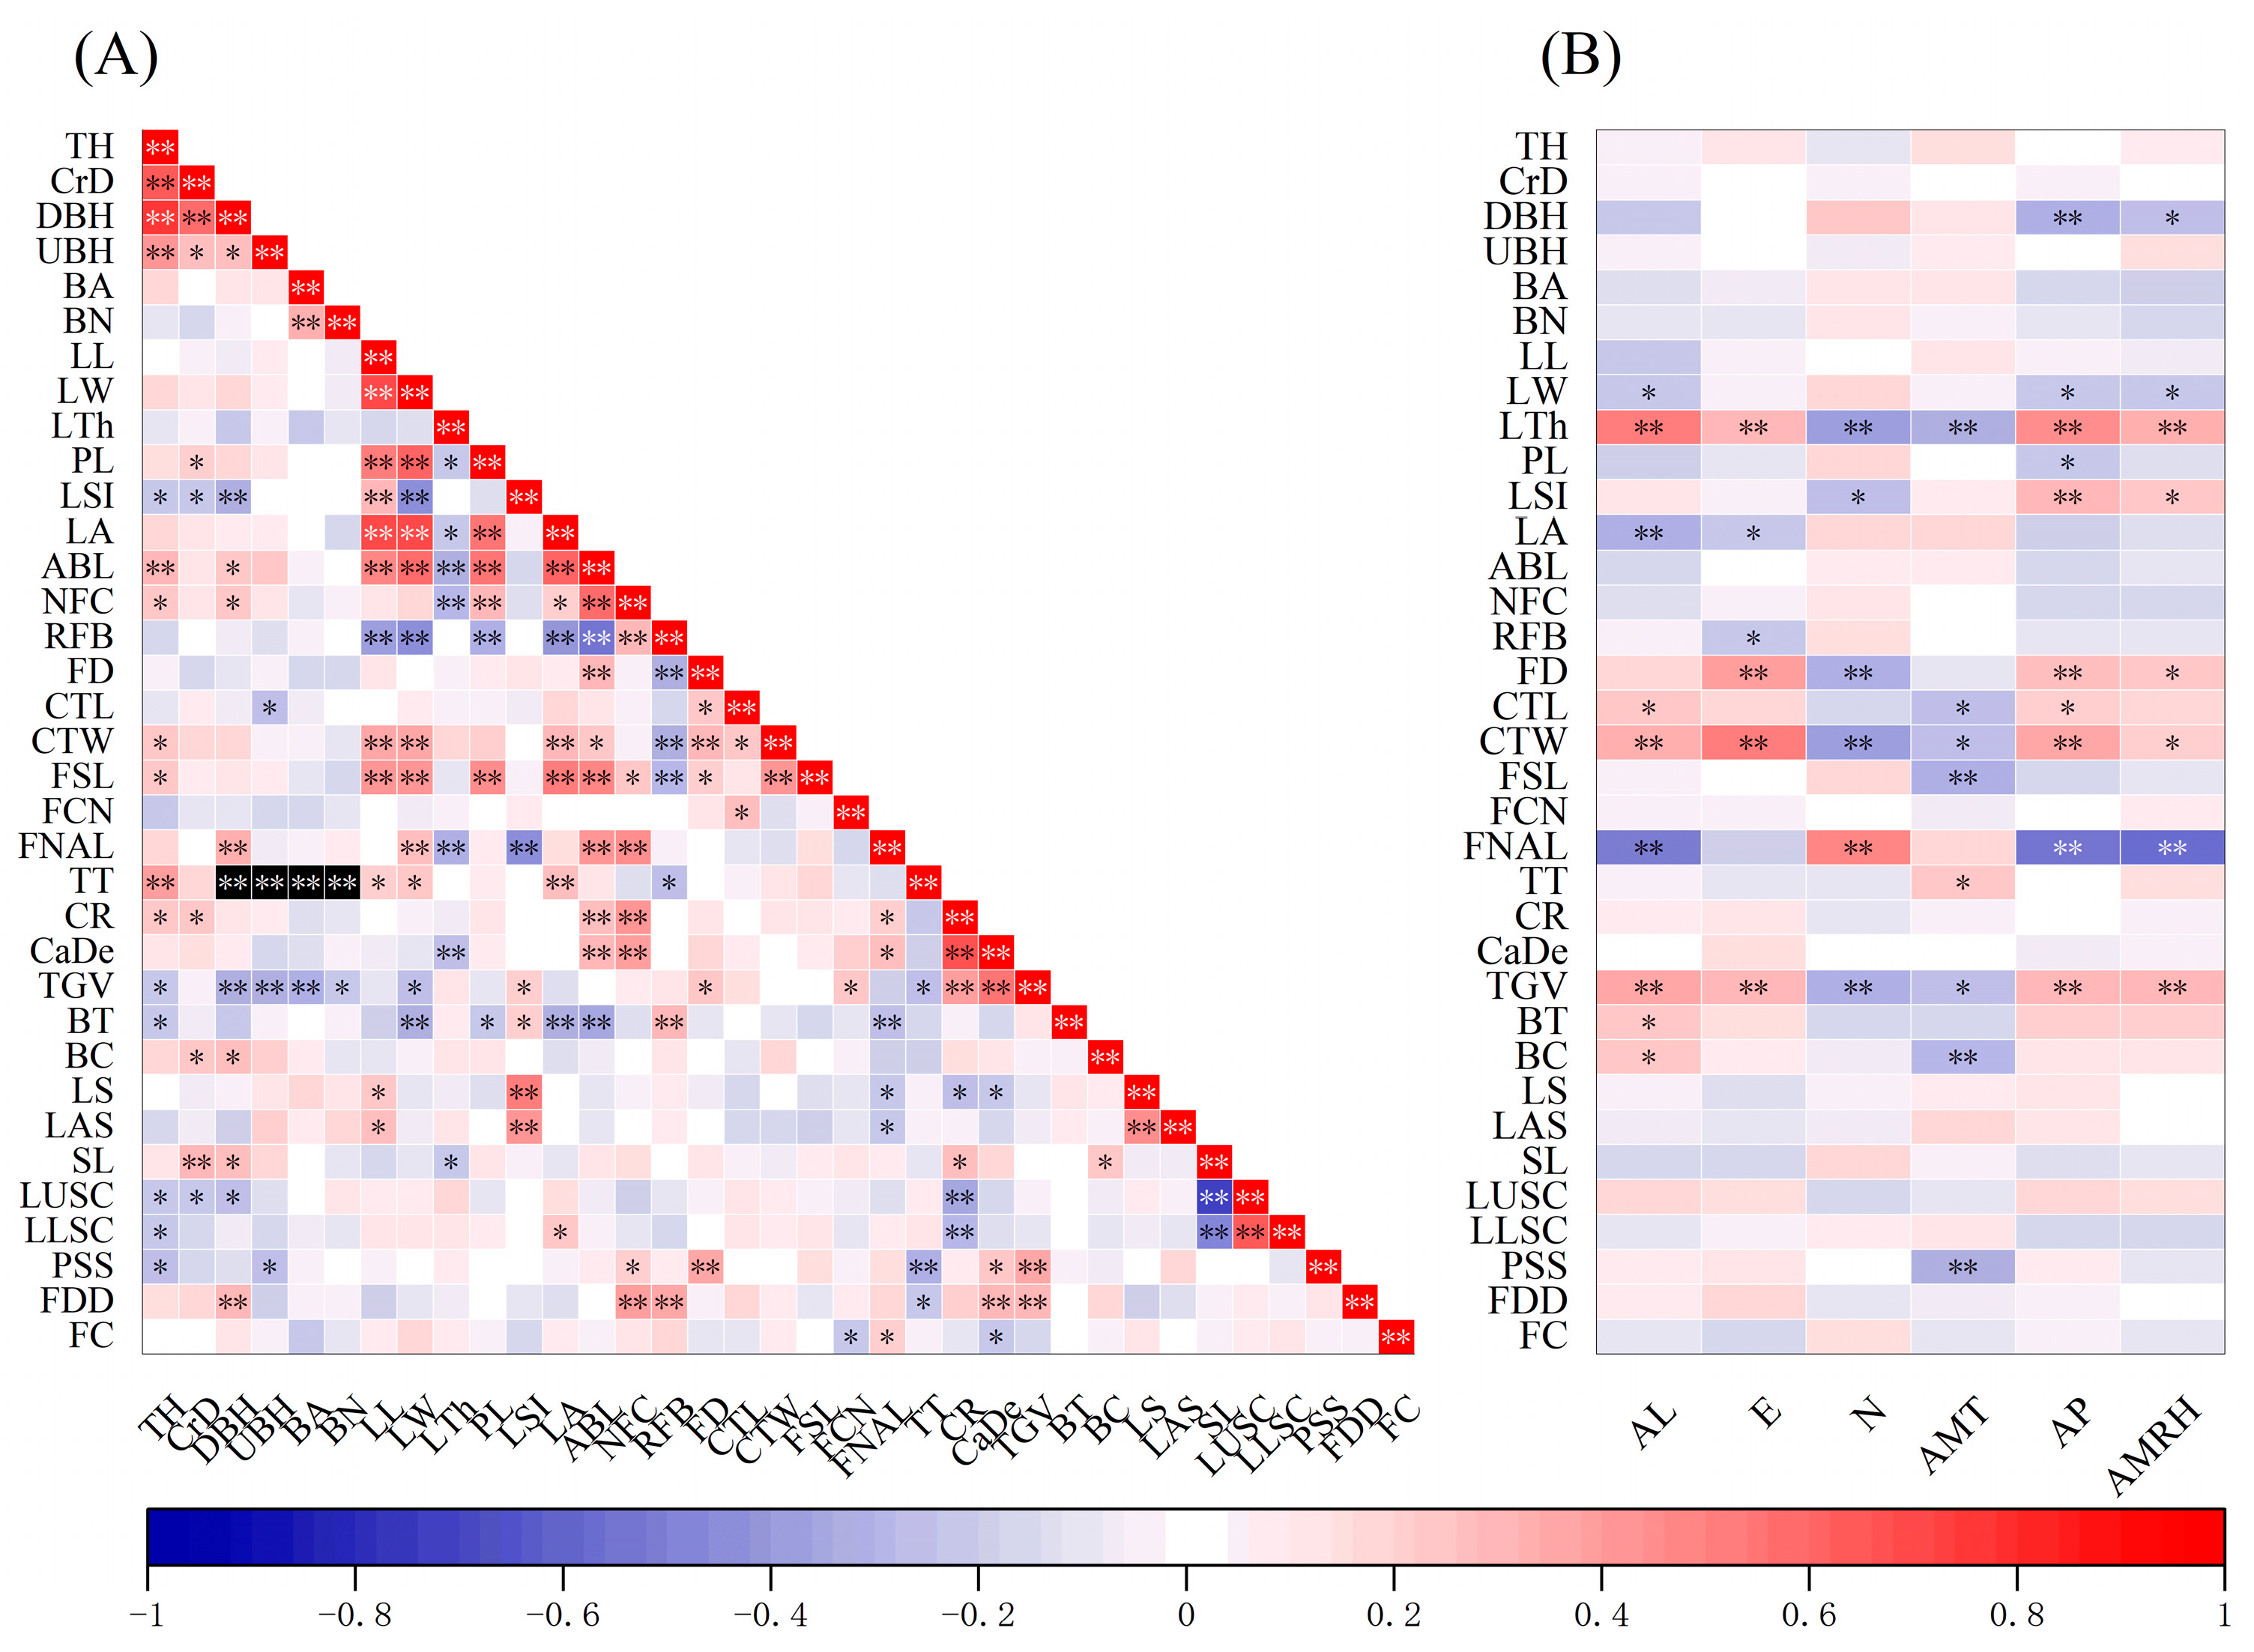
3.4. Correlations among Phenotypic Traits

Pearson’s correlation coefficient was used to show the correlations between traits (Figure 3A, Table S2), and there were different degrees of correlation among 35 phenotypic traits of E. angustifolia. It was found that 84 pairs of traits were significantly correlated (p < 0.01) and 62 pairs of traits were significantly correlated (p < 0.05), including TH, CrD, DBH, and UBH; BA and BN; LL, LW, PL, LA, ABL, CTW, and FSL; ABL, NFC, CR, and CaDe; and LSI, LS, and LAS. At the same time, the following were also positive correlated with each other: between TGV and CR, CaDe; between TH and ABL, TT; between CrD and SL; between FNAL, and DBH, LW, NFC; between FDD and DBH, NFC, RFB, CaDe, TGV; between LUSC and LLSC; and between PSS and FD, TGV (p < 0.01). This shows that these morphological characteristics are mutually reinforcing and a common variation. At the same time, there were significant negative correlations (p < 0.01) between LTh and ABL, NFC, FNAL, CADE; between LSI and DBH, LW, FNAL; between RFB and LL, LW, PL, LA, ABL, FD, CTW, FSL; between TT and PSS; between CR and LUSC, LLSC; between TGV and DBH, UBH, BA; between BT and LW, LA, ABL, FNAL; and between SL and LUSC LLSC.

3.5. Correlation between Phenotypic Traits and Geo-Climatic Factors

Some phenotypic traits of E. angustifolia were strongly correlated with geographical and climatic factors (Figure 3B, Table S2). Among them, LTh, CTW, and TGV were positively correlated with altitude, longitude, annual precipitation, and annual mean relative humidity and negatively correlated with latitude and annual mean temperature. FD was positively correlated with longitude, annual precipitation, and annual mean relative humidity and negatively correlated with latitude. On the contrary, between FNAL and altitude, annual precipitation and annual mean relative humidity showed a significant negative correlation, and latitude showed a significant positive correlation. In addition, there was a significant or extremely significant positive correlation between CTL, BT, BC, and altitude, TT and annual average temperature, LSI, CTL, and annual precipitation, and LSI and annual mean relative humidity. At the same time, there were significant or extremely significant negative correlations between LA, LW, and altitude, LA, RFB, and longitude, LSI and latitude, CTL, FSL, BC, PSS, and annual mean temperature, DBH, LW, PL, and annual precipitation, and DBH, LW, and annual mean relative humidity. The above results show that in the phenotypes of E. angustifolia, the indexes related to leaf and flower parts were affected by geographical and climatic factors to a certain extent, among which precipitation and altitude had a greater influence on the phenotypic traits of E. angustifolia than other factors.

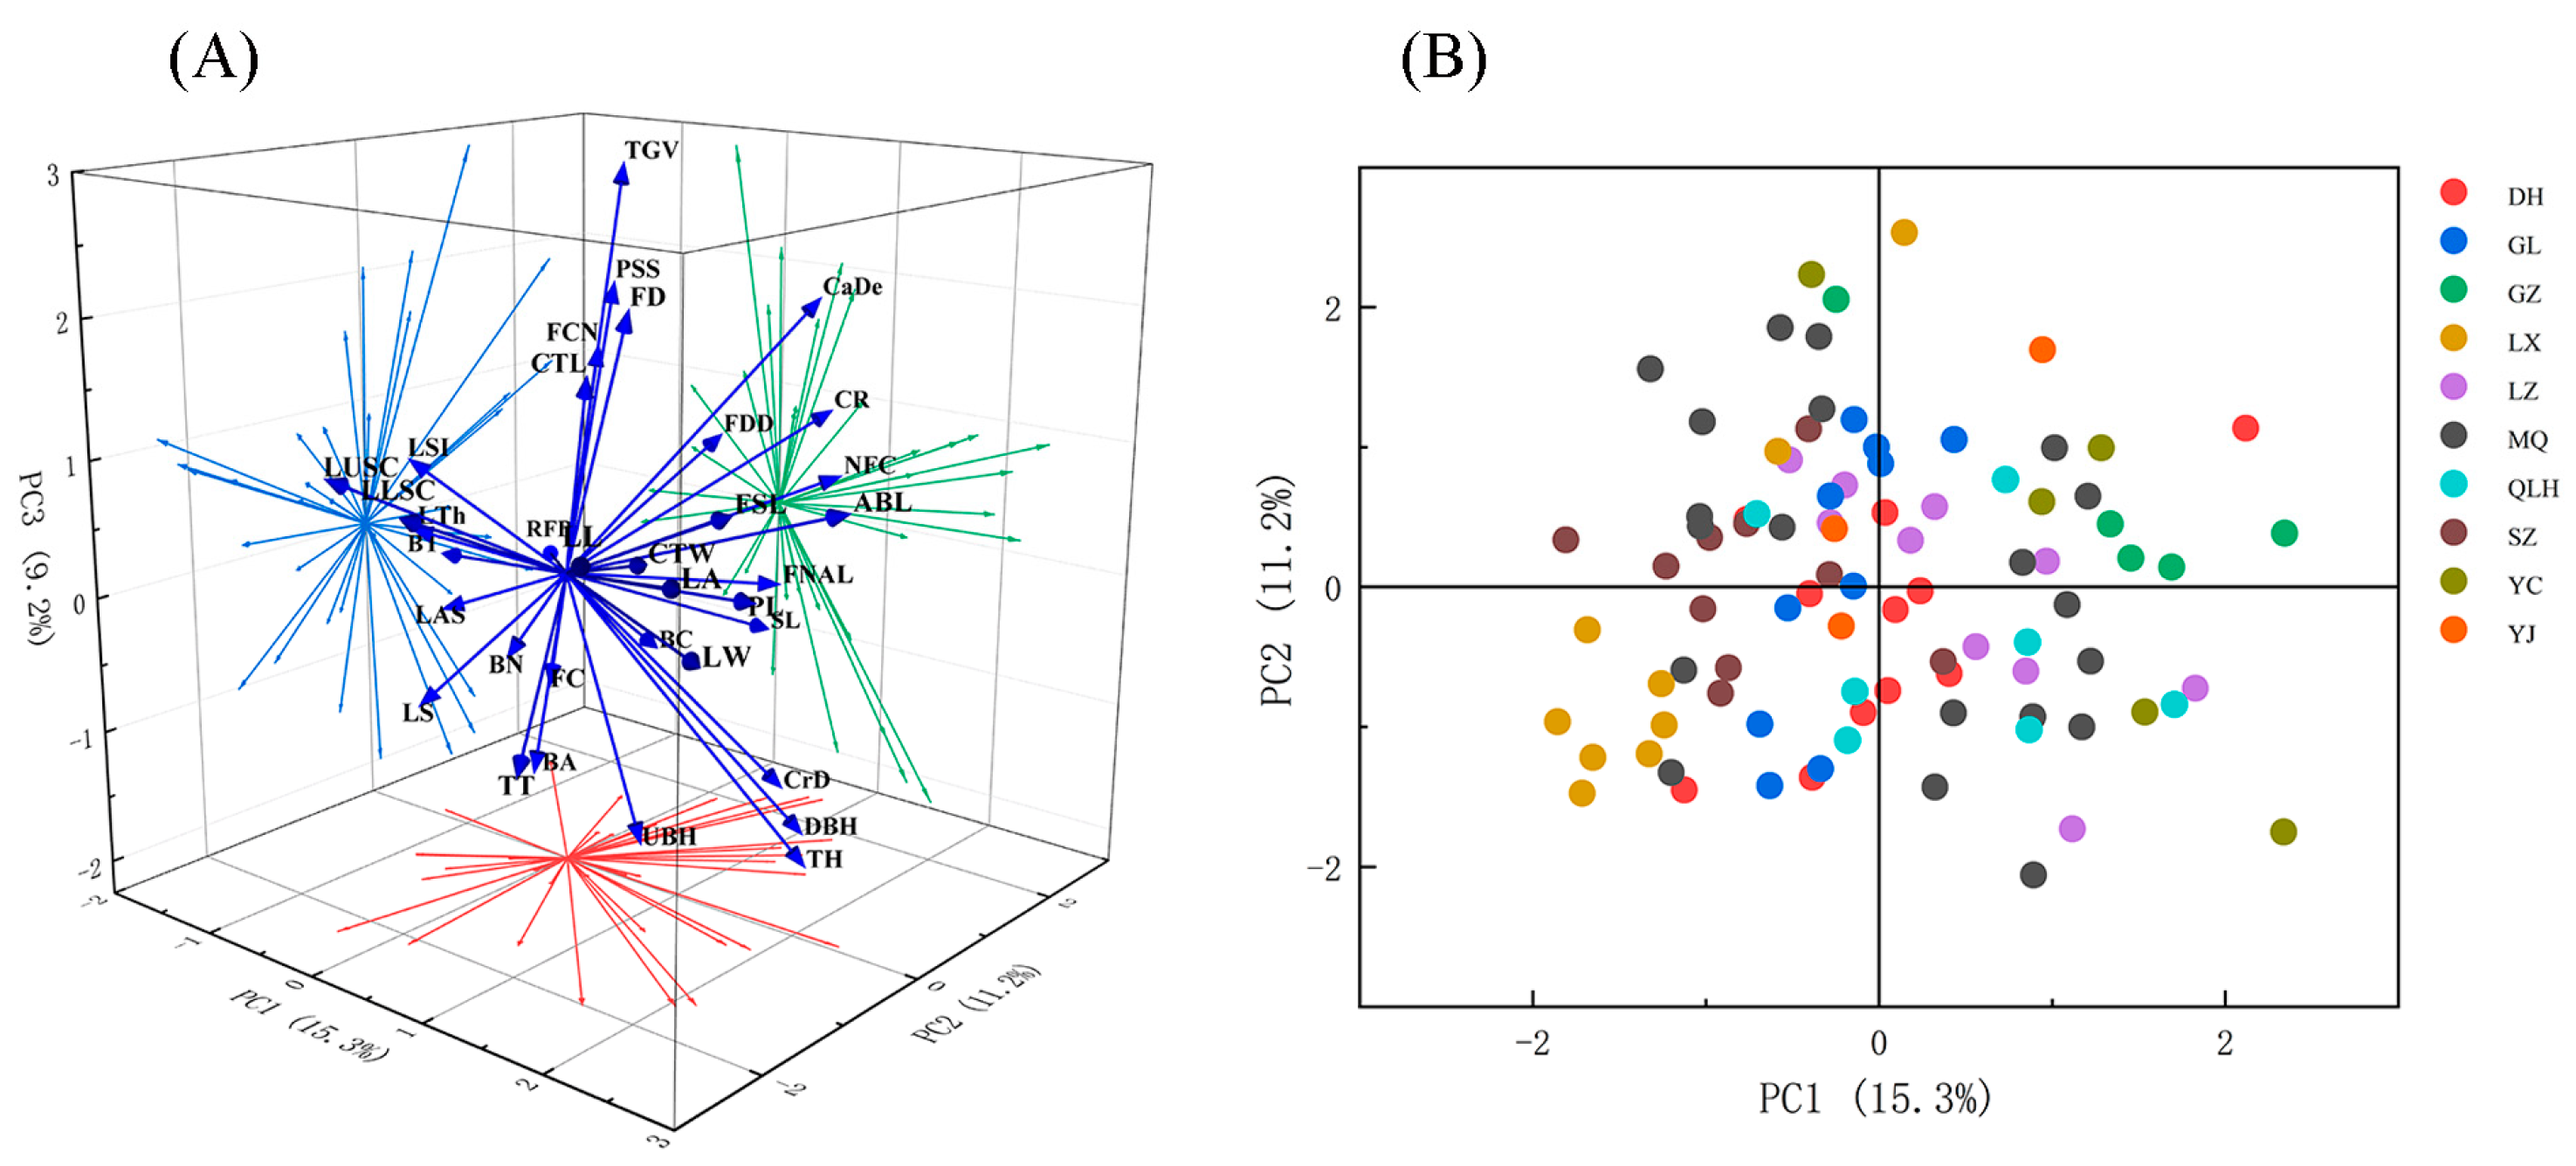
3.6. Principal Component Analysis of Phenotypic Traits

Principal component analysis was used to reduce the dimension of 35 phenotypic traits of E. angustifolia, and the top 11 principal components with the largest proportion were extracted. The eigenvalues were all greater than 1, and the cumulative contribution rate was 72.33%, indicating that these 11 principal components could objectively reflect the basic information of phenotypic traits of E. angustifolia (Table S3, Figure 4A). The contribution rate of PC1 was 15.32%, among which LL, LW, PL, LA, ABL, NFC, RFB, and FSL had higher loading degrees, which mainly reflected the characteristics related to the size of leaf and branch. The contribution rate of PC2 was 11.16%, among which TT, CR, CaDe, SL, LUSC, LLSC, and FDD had higher loading degrees, which mainly reflected the characteristics of canopy growth and leaf color. The contribution rate of PC3 was 9.17%, among which TH, CrD, DBH, UBH, FD, TGV, and PSS had higher loading degrees, which mainly reflected the characteristics related to trunk shape and petal. The contribution rate of PC4 was 7.09%, and the loading degrees of LSI, LS, and LAS were higher, which mainly reflected the characteristics of leaf shape. The resultant seven principal components reflected the characteristics of leaf thickness, calyx size, and main branch, respectively.
The scatter plot constructed according to PC1 and PC2 shows the relationships between samples (Figure 4B). The geographical distribution of different populations had a certain effect on the phenotypic traits of E. angustifolia, and the effects on leaf size and branch traits (PC1) were greater than those of the crown and leaf color traits (PC2). The phenotypic traits of Dunhuang and Yongjing were relatively less affected by geographical factors, while the phenotypic traits of other populations were greatly affected by geographical factors. The samples of Linxia and Ganzhou were more concentrated in the scatter plot, while the sample scatter distribution of Suzhou and Gulang was the closest to consistency. Other population samples were more dispersed.

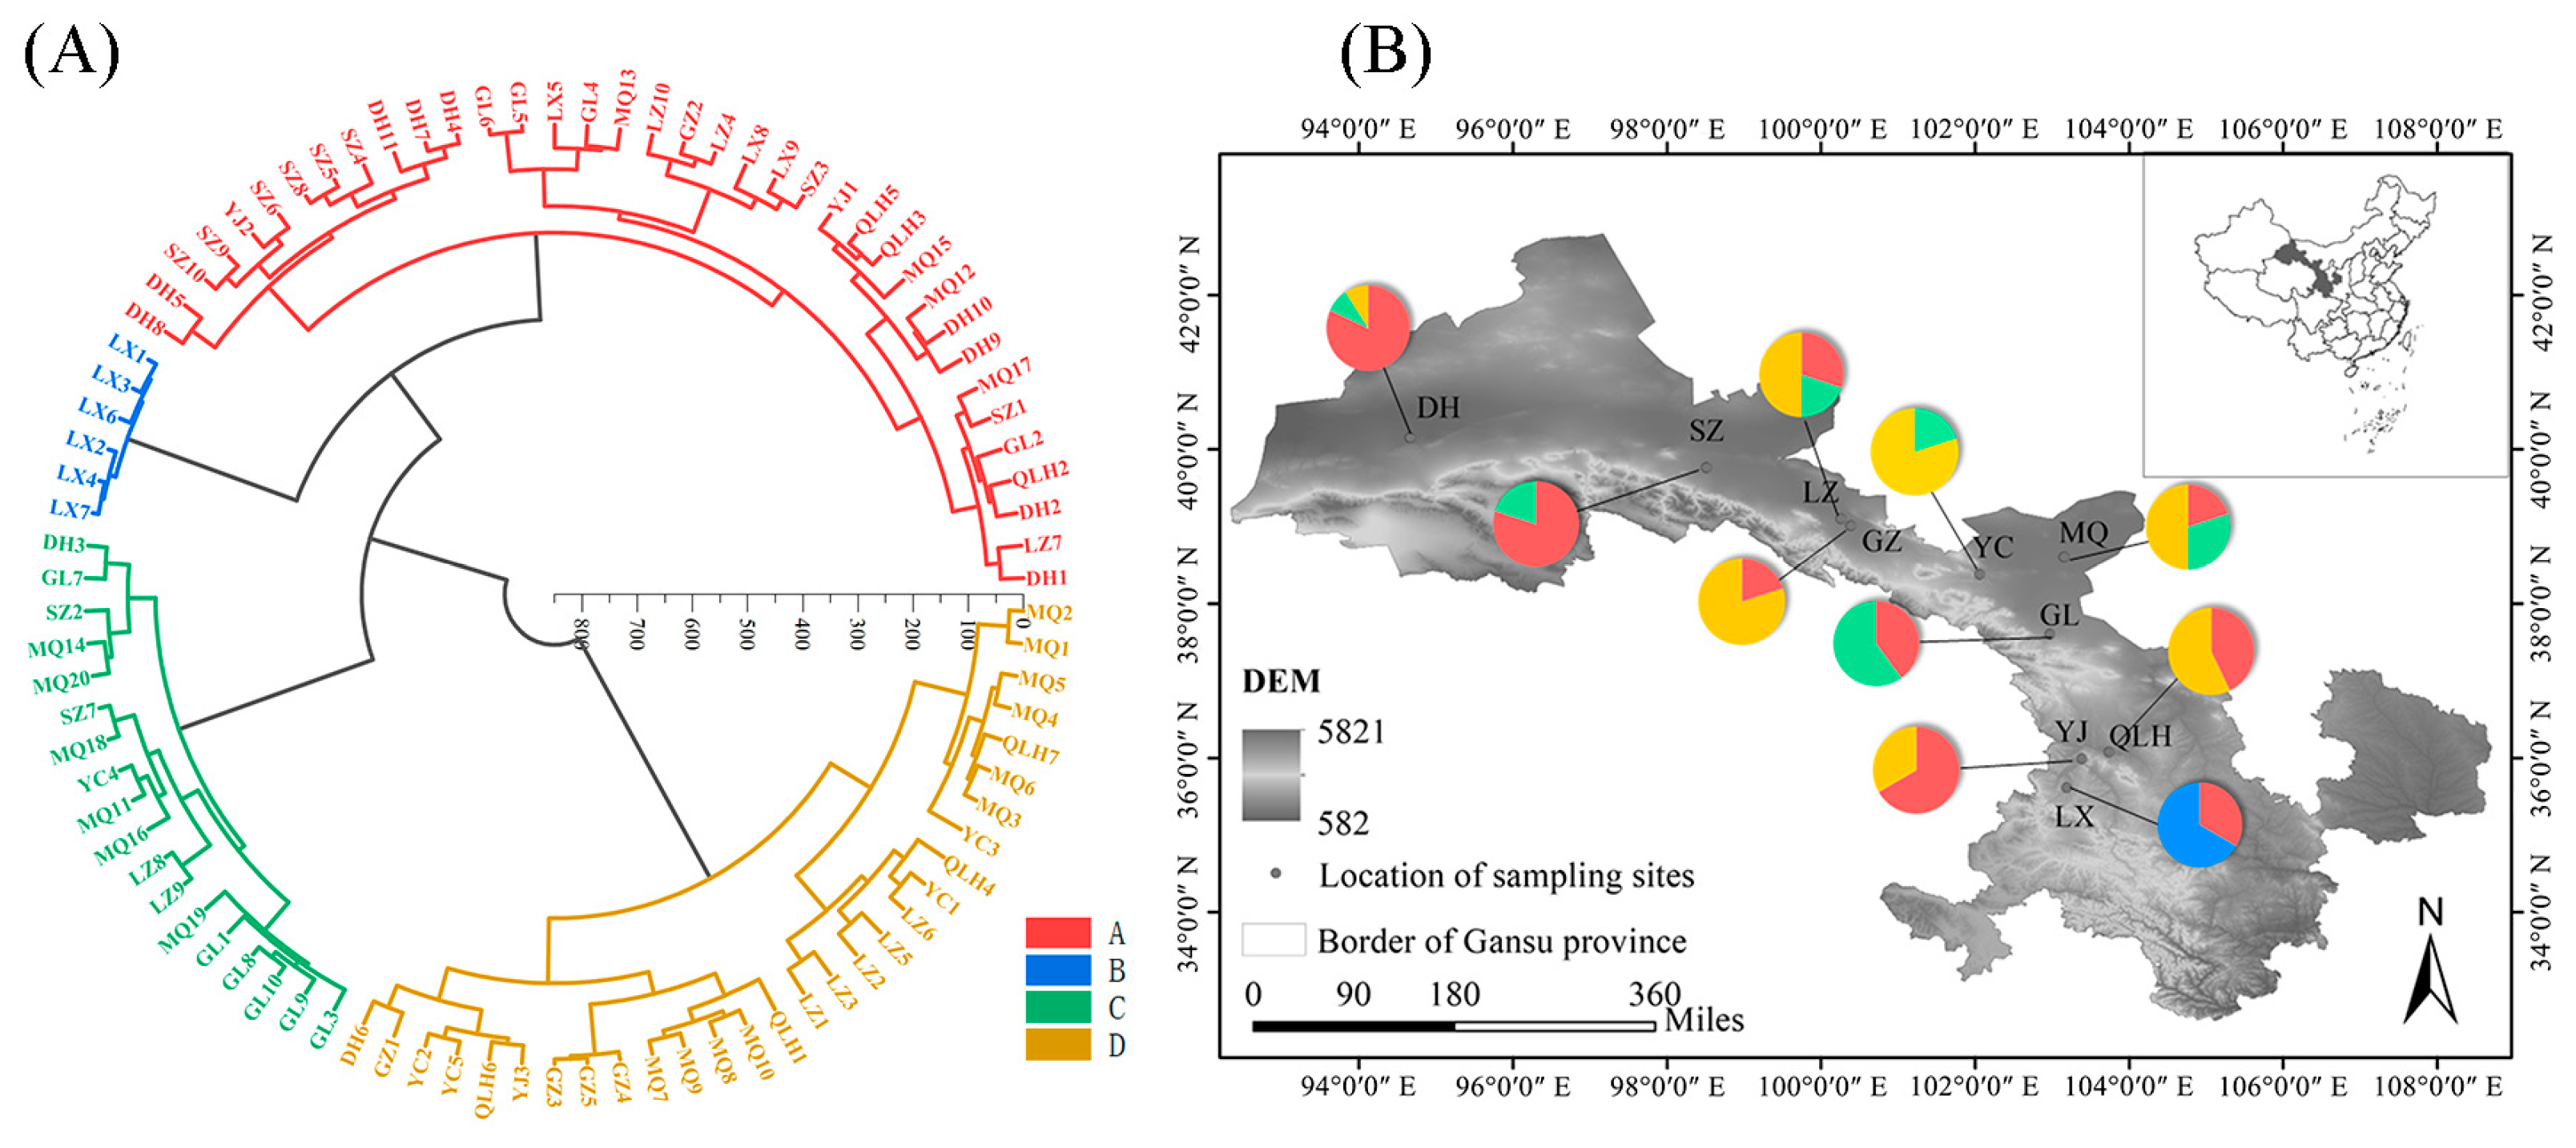
3.7. Cluster Analysis of E. angustifolia Samples

The Ward method was used for cluster analysis based on the squared Euclidean distance, and 90 samples were clustered into four clusters according to their morphological characteristics (Figure 5A, Table S4). Cluster A contains three subclasses, a total of 37 samples, most of which are from Dunhuang, Suzhou, and Yongjing. The flowers of cluster A are small and their branch color is light, but their flower color is the darkest. Cluster B contains six samples, all from Linxia, which are significantly different from other clusters. The characteristics of this cluster are that there is only one floret at each leaf axil, the leaves of the samples are thick, the branches are short, the number of flowers is few, and branch thorns are more abundant. At the same time, the flowers are longer, the petals are all explanate, the flower color and leaf lower surface color are the lightest, and speckles on leaves are less covered, so the leaf upper surface color is the deepest. Cluster C contains 18 samples in two subclasses, mainly from Gulang, Minqin, Linze, Suzhou, Dunhuang, and Yongchang. The samples of this cluster are all shrubs, with a low tree height and crown diameter, high crown roundness and canopy density, dense flowers, most petals curled outward, and dense speckles on the leaf surface, so their leaf color is the lightest. Cluster D contains 29 samples in two subclasses, mainly from Minqin, Ganzhou, Yongchang, Qilihe, and Linze. The tree height, crown diameter, diameter at breast height, and under-branch height of this cluster are higher than those of the other three clusters. There are fewer branch thorns, longer branches, and larger flowers, a larger leaf size and petiole length, and the leaves are closer to oval-shaped.

4. Discussion

In woody plants, especially in widespread species, complex environmental conditions, long-term geographical isolation, and natural selection are likely to cause intraspecific phenotypic variation, and the variation in phenotypic traits is affected by both genetic and environmental factors [33]. E. angustifolia is widely distributed in most areas of Gansu Province, especially in the counties and districts of the Hexi Corridor [34]. There are great differences in altitude, temperature, air pressure, annual precipitation, and soil. The changeable natural conditions and strong regional differences make some traits of E. angustifolia produce genetic differentiation among different populations.
In this study, the phenotypic variation of E. angustifolia was quite rich, and the differences in traits among different populations were extremely significant (p < 0.01), while the differences in most traits within the population were not significant. The phenotypic differentiation coefficient is the percentage of variation among populations in the total variation, reflecting the differentiation of species in traits. The higher the coefficient, the easier the population differentiation. Our study showed that the average phenotypic differentiation coefficient among E. angustifolia populations was 54.15%, indicating that the genetic differentiation degree of phenotypic traits of E. angustifolia was relatively high among populations. This may be due to the large differences in climatic and environmental conditions among the distribution areas of various populations investigated in this study. Moreover, E. angustifolia is mostly scattered in the suburbs and around villages within the natural distribution range. Individual natural populations are relatively intact, but most populations are seriously disturbed by human disturbances, resulting in changes in the natural habitat of E. angustifolia. In addition, the scattered distribution of discontinuous habitats and fewer samples hinder the gene flow among populations, resulting in population differentiation and phenotypic trait variation [35]. In our survey, we found that the floret number in axils of leaves of the other nine populations except the Linxia population was 3, while the floret number in most samples of the Linxia population was only 1, which is the reason for the high differentiation of this trait among populations. We infer that this situation may have been caused by differences in varieties or geographical isolation. However, due to the short length of the annual branch of the Linxia population and the relatively high ratio of flower cluster number to branch length (Table S1), the distribution of each flower cluster on the branches is relatively dense. The differentiation of flower density degree among all populations was low and relatively stable. The average variance component among populations was greater than that within populations, which further indicated that the phenotypic traits of E. angustifolia in Gansu Province varied greatly, and the variation mainly came from populations. The phenotypic variation among populations was higher than that within populations, which was consistent with the results of analyses of Pinus sylvestris [36], Lonicera caerulea [37], and Haloxylon ammodendron [38]. This may be related to the geographical isolation of each population, which hinders the pollination of wind-pollinated plants and the gene exchange among populations and increases the differentiation among populations. The variation among populations reflects the difference between geographical isolation and reproductive isolation, which is an important manifestation of intraspecific diversity [39]. This high phenotypic variation made E. angustifolia have a good selection potential and laid a foundation for later genetic improvements.
The coefficient of variation is an important indicator of the degree of variation in statistics, which can reflect the discrete characteristics of a trait’s value. The larger the value, the greater the dispersion of the trait [40]. The variation levels of 10 populations of E. angustifolia in this study were quite different. The maximum and minimum coefficients of variation were found in the Qilihe population and Ganzhou population, respectively. The reason for the large variation in the Qilihe population may be due to the different distribution environments of the seven samples in the population. Some of them grow near an abandoned train track, and other parts grow on a construction site, resulting in significant phenotypic differences. The reason for the small variation in the Ganzhou population may be that the E. angustifolia is mostly distributed in wetland parks or cultivated as a street tree. After regular irrigation, pruning, and maintenance, the growth of plants is affected by human intervention. In addition, the coefficient of variation among different phenotypic traits was also quite different. The coefficient of variation of 21 quantitative traits ranged from 11.05% to 61.61%. Among them, the variation in under-branch height, diameter at breast height, branch angle, and crown diameter was greater, which may be due to the fact that trunk traits are more susceptible to tree age than other parts. This is similar to the results of the analysis of Quercus gilva by Qin et al. [35]. The traits with a high coefficient of variation have a strong adaptability to their environment and increase their selection opportunities among materials. The traits with low coefficients of variation have a homology and stability among materials [23]. In addition, the coefficient of variation of the leaf area of E. angustifolia was also higher than other traits, which could be explained by the fact that leaf area plays an important role in effective light capture, water balance, and temperature regulation in different habitats [41,42].
Within the scope of our investigation, E. angustifolia is dominated by arbors. The reason for the lesser distribution of shrubs is on the one hand due to historical development and artificial selection. In recent decades, E. angustifolia has been used as a windbreak and in sand-fixing forests, economic forests, and as a garden solitary tree in Northwest China, which makes people plant and use arbors more widely than shrubs [17,43,44,45]. On the other hand, because most of the sample trees selected in this study are more than 10 years old, the older trees are mostly arbors, and the age of shrubs is generally smaller. The proportion of crown clutter is higher, more than half of the surveyed sample plants. Most of the sample plants selected in our survey are individual trees growing independently in a wild natural environment rather than rows or pieces of afforestation trees. Therefore, the growth of crowns and branches is hardly blocked and hindered by surrounding trees. At the same time, it is less affected by human intervention, so the overall crown presents a more natural cluttered state [46]. Dark brown and brownish green branches accounted for a relatively high proportion of their color, while the distribution of some traits of petals and leaves at all levels was small, which may be due to the fact that the branches we investigated were perennial old branches. After a long period of growth and adaptation to the environment, several main colors and states have formed. Florets and leaves are new parts of the year, and because climate change makes them more prone to unstable multiple manifestations, they are more diverse and less distributed at all levels.
As an important index to measure the richness of plant traits, the Shannon–Wiener diversity index is widely used in the evaluation of genetic resources and the analysis of phenotypic diversity [32,47]. According to the study of phenotypic diversity of Prunus mume by Wu et al., the Shannon index reaches 1, which is a high degree of diversity [48]. In this study, the average Shannon index of the quality and quantitative traits of the tested E. angustifolia was greater than 1, and some traits related to flowers and leaves showed a high level of diversity. In the future, the index could be used as a priority for the analysis of phenotypic diversity of E. angustifolia. The diversity of the petal spreading state is low. In our survey, it was found that the four petals of each flower of E. angustifolia generally showed two different states, which were explanate or curled outward (Figure 2A). We speculate that this difference may be due to different varieties, or may be related to the time of flowering. In addition, the outward curling petals are more expanded than the explanate petals. Because the flowers of the deciduous group of Elaeagnus are all hermaphroditic flowers, they are divided into two types: fertile flowers and abortive flowers. The perianth lobes of abortive flowers expand to a small extent, and the perianth lobes of fertile flowers expand to a large extent, which creates very favorable conditions for pollination [49,50]. This study also found that the diversity index of quantitative traits was much higher than that of qualitative traits. Li et al. and Szamosi et al. also obtained consistent results for the morphological traits of blueberry and Cucumis melo germplasm resources [51,52]. The reason for this may be that quantitative traits are greatly affected by germplasm resource types, environmental conditions, genotypes, and other factors, while qualitative traits change only slightly and are relatively more stable. In addition, from the overall analysis results of quantitative traits, the variation in the Shannon index and coefficient of variation (CV) is not consistent. For example, the Shannon index of the flower diameter is the largest (2.0723), while the CV is the smallest (11.05%). The Shannon indexes of the calyx tube length, leaf thickness, and leaf shape are also greater than 2, but the CV is far lower than 20%. The larger the coefficient of variation, the greater the degree of variation of traits; the larger the diversity index, the richer the trait diversity. However, there is no correlation between the two. This study is also consistent with the results of He et al. and Fu et al.’s phenotypic studies on Dendrobium nobile and Salvia splendens [53,54].
The correlation of traits can indirectly achieve the effect of selecting another trait through the selection of one trait, which can improve the selection efficiency of excellent plant varieties and accelerate the process of breeding [55]. The correlation analysis of phenotypic traits of E. angustifolia in Gansu Province showed that the correlation between most traits was significant or extremely significant. This is consistent with the previous research results of Khadivi on E. angustifolia [56]. Correlation analysis has a certain convenience and guidance for the field collection and breeding of E. angustifolia. Because most traits are closely related, researchers can roughly infer the growth trends of other traits related to one trait, which can reduce the blindness of investigation and research to a certain extent [57]. However, the linkage mechanism between these traits is still unclear and may need to be explored from biochemical and molecular perspectives.
Different species have different geographical variation patterns due to their different adaptability and sensitivity to the environment [58]. From this study, it was found that the traits related to the trunk and branch of E. angustifolia were not significantly affected by environmental factors, the leaf traits were mainly affected by altitude and rainfall, and the flower traits were synergistically affected by various geographical and climatic factors. In the appropriate range, under the conditions of high altitude, high longitude, rainy, low latitude, and low temperature, E. angustifolia has higher vitality, thicker leaves, and larger and longer flowers. The size of flowers in hot, dry, and low-altitude areas is smaller. This difference can be explained on the basis of pollinator-mediated selection on the one hand [59,60,61], and on the other hand, because reducing corollas is beneficial for plant growth under harsh conditions [62,63,64]. Relatively wet and fertile soil can make plants produce larger flowers [65]. At the same time, with a decrease in altitude, longitude, and precipitation, the size of E. angustifolia leaves showed an increasing trend. Previous studies have also found that the leaf area of many plants decreases with increasing altitude, while the leaf thickness increases with increasing altitude [66,67]. This is consistent with our findings. Plants can adapt to environmental changes accompanied by a high altitude by reducing their leaf area and increasing their leaf thickness, mesophyll tissue thickness, and stomatal density [68].
In a study of E. angustifolia in Northwest China, Wu pointed out that an altitude of 1000–1700 m is generally suitable for its growth. It is difficult for E. angustifolia to survive in dark and humid mountainous areas or alpine areas with an altitude of more than 2000 m. Our study also further confirms this conclusion; among the 10 populations, the southernmost Linxia County is in the transitional zone between temperate semi-humid and alpine humid areas. The altitude and annual precipitation exceed 2000 m and 500 mm, respectively. E. angustifolia is less distributed in this area, and plants generally show a small diameter at breast height, low canopy density, narrow leaves, short branches, and few flowers. Only one floret grows at each leaf axil. The growth of E. angustifolia may be affected by high altitudes and cold and humid climates. We also found that the growth of E. angustifolia in other areas with lower latitudes and higher altitudes is very rare.
Principal component analysis can reduce the dimension of a dataset, maintain the characteristics of the largest variance contribution in the dataset, and provide the main information on the comprehensive performance of quantitative traits [54]. In this study, the first 11 principal components were extracted from the phenotypic traits of E. angustifolia by principal component analysis, and the cumulative contribution rate reached 72.33%. Among the traits related to the plant shape, branch, leaf, and flower of E. angustifolia, the primary and key traits affecting the phenotypic diversity are the traits related to leaf size and branch length, which is similar to the phenotypic analysis results of E. angustifolia in Zhangye City by Zeng et al. In future investigations and studies, these traits could be used as key observational traits. Principal component analysis also further showed that the phenotype of E. angustifolia was greatly affected by the geographical distribution of different populations. Most of the phenotypic traits of the two populations in Linxia and Ganzhou were stable, while the phenotypes of the two populations in Suzhou and Gulang were closer. The traits of other populations were more abundant and the degree of variation was higher, which may be due to genetic or environmental effects [69].
The purpose of clustering analysis is to classify individuals according to their characteristics. Individuals in a cluster are highly similar to each other, and the inhomogeneity and differences among clusters are the largest [23]. According to the clustering results of E. angustifolia, the geographical distribution of four clusters in 10 populations was obtained (Figure 5B). The 90 samples were not completely clustered according to geographical distance. The distribution of the four clusters was overlapped, but the distribution of the same cluster had a certain degree of similarity, and the variation in phenotypic traits among populations was discontinuous. This shows that geographical distance does not play a key role in the phenotypic differentiation of the studied E. angustifolia population [70]. This may be due to the complex and diverse geographical environment and climate differences in Gansu Province. In addition to the specific phenotypic characteristics, the population also has a specific ecological amplitude and distribution range [71]. The random effects of various specific genotypes or environmental factors often lead to differences in traits between individuals [72]. Among the seven samples in Linxia County, the southernmost part of the survey area, six samples were clustered into cluster B alone, which was most significantly affected by geographical and climatic differences. The distribution of cluster C of shrubby E. angustifolia is relatively concentrated. In the process of the field investigation, it was found that shrubby E. angustifolia is more distributed in Minqin County, Gulang County and surrounding counties than in other regions, mostly in the forms of a shrub forest belt or small windbreak forest. The distribution of cluster A E. angustifolia is relatively loose, from the westernmost Dunhuang to the easternmost Qilihe area, indicating that cluster A may be a transitional group, and the characteristics of each trait in the group are not obvious. The cluster D E. angustifolia is almost entirely distributed in the region of the latitude 36–39° N. In the future, the directional breeding of excellent varieties of E. angustifolia could be carried out based on different uses.

5. Conclusions

The phenotypic variation in different populations of E. angustifolia is rich, and the variation mainly comes from among populations. The phenotypic traits related to plant shape had a large variation, and the phenotypic traits related to flowers and leaves had a small variation. The phenotypic quantitative traits of E. angustifolia were relatively more abundant, the qualitative traits were more stable, and the diversity of flowers and leaves was higher. Within a certain range, with an increase in altitude, longitude, and rainfall, the phenotype of E. angustifolia showed a trend of higher tree vigor, larger and longer flowers, smaller leaves, and thicker leaves. However, excessive altitude and precipitation make it unable to survive and grow poorly. As a topical original study of this species in Gansu Province, the results of our study on the phenotypic trait variation in E. angustifolia will provide a basis for improving the efficiency of population selection, provide a reference for selecting and establishing gene conservation areas and seed collection areas, and is of great significance for accelerating the selection and breeding. In the future, the corresponding varieties of E. angustifolia should be selected for different purposes according to their geographical distribution and utilization direction. For example, the natural growth of individual E. angustifolia plants is arborous when growing independently, and they often form shrubs or small windbreaks when growing in patches. Using the superior plant shape and crown of cluster D in this study and its characteristics of less thorns and larger flowers and leaves, it can be considered as an isolated flower tree species and can also be planted as a street tree in the city. Cluster C can be used as hedge or sparse forest. Its leaf surface scales are dense, and its leaf color is closer to silvery white. It can be compared with green leaf plants in its garden configuration, which is more prominent in landscape. In short, for some varieties with bright and full fruits, no or few spines on branches and long flowering periods should be directionally cultivated to gradually update degraded varieties, to cultivate a set of ornamental and ecological functions as one of the sustainable development of the fine varieties. In addition, the floral scent of E. angustifolia can also be used as a characteristic and function of smell in landscapes. However, at present, the judgment of floral scent in our field investigation can only rely on human perception, lacking objectivity and rigor. Therefore, it has not been added to the analysis of phenotypic diversity. In the subsequent research, more professional instruments will be used to determine the degree of floral scent, to understand the phenotypic diversity and ornamental value of E. angustifolia more comprehensively.

Supplementary Materials

The following supporting information can be downloaded at: https://www.mdpi.com/article/10.3390/f14061143/s1, Table S1: The mean value, standard deviation, and Duncan’s multiple comparison of 21 quantitative traits of Elaeagnus angustifolia from different populations. Table S2: Pearson correlation coefficients between each trait and Pearson correlation coefficients between traits and geographical climatic factors. Table S3: Principal component vectors, eigenvalues, contribution rates, and cumulative contribution rates of the first 11 principal components based on tree means for the 35 traits. Table S4: Descriptive statistics of phenotypic traits of four clusters.

Author Contributions

Methodology, software, and writing—original draft preparation, R.S.; resources, conceptualization, and writing—review and editing, Z.Z.; investigation, N.S. and R.S.; formal analysis and validation, Y.W., Y.M. and Y.L.; data curation, J.D., X.X. and T.L. All authors have read and agreed to the published version of the manuscript.

Funding

This research was funded by the Forestry and Grassland Science and Technology Innovation and International Cooperation Project of Gansu Province (kjcx2021004) (Institutions providing this funding: Gansu Forestry and Grassland Administration), Youth Science and Technology Fund Program of Gansu Province (20JR5RA007) (Institutions providing this funding: Science and Technology Department of Gansu Province), and Research Startup Fund of Gansu Agricultural University (GAU-KYQD-2020-5) (Institutions providing this funding: Gansu Agricultural University).

Data Availability Statement

Not applicable.

Acknowledgments

We would like to express our gratitude to the local forestry managers and the masses for all kinds of support and help during our investigation and sampling process. We also offer our great thanks to Jia Wei and Zizhen Li for their guidance and advice on our writing.

Conflicts of Interest

The authors declare no conflict of interest.

References

  1. Raj, D.; Govindaraju, D.; Orians, C. Genetic variation among pitch pine Pinus rigida families from Walden Woods: Heritability and path analysis of developmental variation of phenotypic traits. Rhodora 2009, 108, 356–369. [Google Scholar] [CrossRef]
  2. Pigliucci, M.; Murren, C.J.; Schlichting, C.D. Phenotypic plasticity and evolution by genetic assimilation. J. Exp. Biol. 2006, 209, 2362–2367. [Google Scholar] [CrossRef]
  3. Donohue, K.; Pyle, E.H.; Messiqua, D.; Heschel, M.S.; Schmitt, J. Adaptive divergence in plasticity in natural populations of Impatiens capensis and its consequences for performance in novel habitats. Evolution 2001, 55, 692–702. [Google Scholar] [CrossRef]
  4. Shirley, L.; Vesk, P. Eucalyptus phylogenetics: How traits, evolution, and the environment influence the distribution of a diverse genus. In Proceedings of the 94th ESA Annual Convention 2009, Albuquerque, NM, USA, 2–7 August 2009. [Google Scholar]
  5. Etterson, J.R. Evolutionary potential of Chamaecrista asciculata in relation to climate change. 1. Clinal patterns of selection along an environmental gradient in the Great Plains. Evolution 2004, 58, 1446–1456. [Google Scholar] [CrossRef]
  6. Han, H.; Li, S.; Gan, X.; Zhang, X. Phenotypic diversity in natural populations of an endangered plant Tetracentron Sinense. Bot. Sci. 2017, 95, 283–294. [Google Scholar] [CrossRef]
  7. Iezzoni, A.F.; Pritts, M.P. Applications of principal component analysis to horticultural research. HortScience 1991, 26, 334–338. [Google Scholar] [CrossRef]
  8. Omire, A.; Budambula, N.L.M.; Neondo, J.; Gituru, R.; Mweu, C. Phenotypic diversity of doum palm (Hyphaene compressa), a semi-domesticated palm in the arid and semi-arid regions of Kenya. Scientifica 2020, 2020, 4920830. [Google Scholar] [CrossRef]
  9. Asheghi, M.S. Phenotypic diversity of Crataegus orientalis subsp. szovitsii (Pojark.) K.I.Chr. population in Markazi Province, Iran. Erwerbs-Obstbau 2022, 64, 69–74. [Google Scholar] [CrossRef]
  10. Xin, Y.-H.; Wu, Y.-X.; Qiao, B.; Su, L.; Xie, S.-Q.; Ling, P. Evaluation on the phenotypic diversity of Calamansi (Citrus microcarpa) germplasm in Hainan island. Sci. Rep. 2022, 12, 371. [Google Scholar] [CrossRef]
  11. Yue, D.X.; Li, Z.Z.; Hui, C. Development trend of Gansu’s ecological footprint and ecological capacity. Acta Bot. Bor-Occid. Sin. 2004, 24, 454–463. [Google Scholar] [CrossRef]
  12. Li, Y.; Li, H. Gansu biodiversity and ecological protection. For. Gansu 2004, 04, 18–20. [Google Scholar]
  13. Li, X.H. Discussion on biodiversity protection in Gansu. For. China 2012, 759, 31. [Google Scholar]
  14. Tian, Y. Study on Fruit Phenotypic Diversity of Natural Population in Calligonum mongolicum in Gansu Province. Master’s Thesis, Gansu Agricultural University, Lanzhou, China, 2013. [Google Scholar]
  15. Luo, H.J.; Li, J.H.; Zhao, S.C.; Wang, L.G. Phenotypic characteristics and diversity of walnut nuts in Gansu Province. China Fruits 2019, 199, 87–92. [Google Scholar] [CrossRef]
  16. Stannard, M.; Ogle, D.; Holzworth, L.; Scianna, J.; Sunleaf, E. History, Biology, Ecology, Suppression and Revegetation of Russian-olive Sites (Elaeagnus angustifolia L.); Plant Materials Technical Note; USDA-Natural Resources Conservation Servic: Boise, ID, USA, 2002. [Google Scholar]
  17. Yu, W.W.; Yan, G.R. Resources and research situation of Elaeagnus spp. J. Tianjin Agric. Univ. 2009, 16, 46–50. [Google Scholar]
  18. Kiseleva, T.I.; Chindyaeva, L.N. Biology of oleaster (Elaeagnus angustifolia L.) at the northeastern limit of its range. Contemp. Probl. Ecol. 2011, 4, 218–222. [Google Scholar] [CrossRef]
  19. Yaghoubi, M.; Alirezalu, K.; Hesari, J.; Peighambardoust, S.H.; Marcinkowska-Lesiak, M.; Barzegar, Y.; Hoseinian-Khosrowshahi, S.R.; Marszałek, K.; Mousavi Khaneghah, A. Application of oleaster leaves (Elaeagnus angustifolia L.) essential oil and natural nanoparticle preservatives in frankfurter-type sausages: An assessment of quality attributes and stability during refrigerated storage. Meat Sci. 2023, 198, 109097. [Google Scholar] [CrossRef]
  20. Çakmakçı, S.; Topdaş, E.F.; Kalın, P.; Han, H.; Şekerci, P.; Köse, L.P.; Gülçin, İ. Antioxidant capacity and functionality of oleaster (Elaeagnus angustifolia L.) flour and crust in a new kind of fruity ice cream. Int. J. Food Sci. Technol. 2015, 50, 472–481. [Google Scholar] [CrossRef]
  21. Ahmadiani, A.; Hosseiny, J.; Semnanian, S.; Javan, M.; Saeedi, F.; Kamalinejad, M.; Saremi, S. Antinociceptive and anti-inflammatory effects of Elaeagnus angustifolia fruit extract. J. Ethnopharmacol. 2000, 72, 287–292. [Google Scholar] [CrossRef]
  22. Chen, C.X.; Xie, X.H.; Wang, Y.P.; Li, J.P.; Xin, J.; Zhu, T.T.; Liu, J.; Chen, M. Effects of salt and drought on the physiological characteristics of Elaeagnus angustifolia L. seedlings. Acta Ecol. Sin. 2019, 39, 4540–4550. [Google Scholar]
  23. Safdari, L.; Khadivi, A. Identification of the promising oleaster (Elaeagnus angustifolia L.) genotypes based on fruit quality-related characters. Food Sci. Nutr. 2021, 9, 5712–5721. [Google Scholar] [CrossRef]
  24. Zeng, Z.H.; Li, Q.W.; Ti, Y.J. Analysis on phenotypic diversity and ornamental of wild Elaeagnus angustifolia from Zhangye City of Gansu Province. J. Plant Resour. Environ. 2021, 30, 12–21. [Google Scholar] [CrossRef]
  25. Xu, J.; Yu, W.Z.; Ni, W.; Mao, Y.F.; Liu, Q.; Shen, X. Diversity of phenotypic traits and fruit quality of Elaeagnus germplasm resources. Northern Hortic. 2016, 373, 20–24. [Google Scholar] [CrossRef]
  26. Fan, Y.C.; Chai, S.S.; Zhang, M.M.; Zhao, X.H.; Shen, X. Phenotypic genetic diversity of Elaeagnus angustifolia resources from Ningxia. Northern Hortic. 2018, 422, 37–43. [Google Scholar]
  27. Wang, C.; Gong, H.; Feng, M.; Tian, C. Phenotypic variation in leaf, fruit and seed traits in natural populations of Eucommia Ulmoides, a relict Chinese endemic tree. Forests 2023, 14, 462. [Google Scholar] [CrossRef]
  28. Brouwers, N.C. Biostatistical design and analysis using R: A practical guide. Austral Ecol. 2012, 37, e19. [Google Scholar] [CrossRef]
  29. Ge, S.; Wang, M.X.; Chen, Y.W. An analysis of population genetic structure of Masson pine by isozyme technique. Sci. Silv. Sin. 1988, 04, 399–409. [Google Scholar]
  30. Sokal, R.; Rohlf, F. Biometry: The Principles and Practice of Statistics in Biological Research. Available online: https://www.researchgate.net/publication/44554870_Biometry_the_principles_and_practice_of_statistics_in_biological_research_Robert_R_Sokal_and_F_James_Rohlf (accessed on 12 August 2022). [CrossRef]
  31. Maughan, P.J.; Saghi Maroof, M.A.; Buss, G.R. Microsatellite and amplified sequence length polymorphisms in cultivated and wild soybean. Genome 1995, 38, 715–723. [Google Scholar] [CrossRef]
  32. Jain, S.; Qualset, C.; Bhatt, G.; Wu, K. Geographical patterns of phenotypic diversity in a world collection of durum wheats. Crop Sci. 1975, 15, 700–704. [Google Scholar] [CrossRef]
  33. Zhao, Y.; Bi, Q.X.; Ju, J.; Yu, D.; Fan, S.Q.; Chen, M.Y.; Cui, Y.F.; Fu, G.H.; Wang, L.B. Geographic variation of seed and seedling growing traits in Xanthoceras sorbifolium. For. Res. 2019, 32, 160–168. [Google Scholar] [CrossRef]
  34. Tu, Z.D.; Chang, Z.F. Investigation of Elaeagnus angustifolia variety resources in Gansu Province. J. Gansu For. Sci. Tech. 1993, 04, 20–23. [Google Scholar]
  35. Qin, Z.K.; Liu, N.; Zhou, X.; Li, Z.H.; Cao, F.L.; Li, H. Phenotypic diversity of Quercus gilva natural populations inmiddle subtropical China. Guihaia 1–20.
  36. Ramírez-Valiente, J.A.; Solé-Medina, A.; Pyhäjärvi, T.; Savolainen, O.; Cervantes, S.; Kesälahti, R.; Kujala, S.T.; Kumpula, T.; Heer, K.; Opgenoorth, L.; et al. Selection patterns on early-life phenotypic traits in Pinus Sylvestris are associated with precipitation and temperature along a climatic gradient in Europe. New Phytol. 2021, 229, 3009–3025. [Google Scholar] [CrossRef] [PubMed]
  37. Li, W.; Wang, P.; Qi, Q.; Zhang, Q.; Gao, X.; Lin, M.; Cui, Y. Phenotypic diversity and variation of Loniceracaerulea populations in the Changbai Mountain alongside the elevation gradient. Pol. J. Environ. Stud. 2020, 30, 705–716. [Google Scholar] [CrossRef]
  38. Liang, S.; Rong, X.; Sai, L.; Chen, J.; Changqing, X.; Caixiang, X.; Tongning, L. Phenotypic variation of seed Traits of Haloxylon ammodendron and its affecting factors. Biochem. Syst. Ecol. 2015, 60, 81–87. [Google Scholar] [CrossRef]
  39. Liu, Z.; Gao, C.; Li, J.; Miao, Y.; Cui, K. Phenotypic diversity analysis and superior family selection of industrial raw material forest species-Pinus Yunnanensis Franch. Forests 2022, 13, 618. [Google Scholar] [CrossRef]
  40. Diao, S.F.; Shao, W.H.; Jiang, J.M.; Dong, R.X.; Sun, H.G. Phenotypic diversity in natural populations of Sapindus mukorossi based on fruit and seed traits. Acta Ecol. Sin. 2014, 34, 1451–1460. [Google Scholar] [CrossRef]
  41. Kidner, C.; Umbreen, S. Why Is Leaf Shape so Variable? Int. J. Plant Dev. Biol. 2010, 4, 64–75. [Google Scholar]
  42. Vidaković, A.; Liber, Z.; Šatović, Z.; Idžojtić, M.; Volenec, I.; Zegnal, I.; Pintar, V.; Radunić, M.; Poljak, I. Phenotypic diversity of almond-leaved pear (Pyrus Spinosa Forssk.) along Eastern Adriatic Coast. Forests 2021, 12, 1630. [Google Scholar] [CrossRef]
  43. Wu, S.H. Elaeagnus angustifolia, an excellent tree species for windbreak and sand fixation in Northwest China. Bull. Biol. 1964, 6, 10–12. [Google Scholar]
  44. Gu, X.J.; Wang, Y.K. Problems and prospects in the development of Elaeagnus angustifolia resources in Minqin County. Jiangxi Agric. 2017, 111, 66. [Google Scholar] [CrossRef]
  45. Zhang, Z.Y. Analysis on the performance and sustainable developmentof Elaeagnus angustifolia in Gaotai County. Agric. Technol. Equip. 2022, 393, 79–81. [Google Scholar]
  46. Ma, L.Q.; Yang, F.Q.; Xu, L. Fractal feature of Elaeagnus angustifolia tree of in Minqin desert. J. Gansu Forestry Sci. Tech. 2016, 41, 27–35. [Google Scholar] [CrossRef]
  47. Petruccelli, R.; Ganino, T.; Ciaccheri, L.; Maselli, F.; Mariotti, P. Phenotypic diversity of traditional cherry accessions present in the Tuscan region. Sci. Hortic. 2013, 150, 334–347. [Google Scholar] [CrossRef]
  48. Wu, G.S.; Sun, L.D.; Hao, R.J.; Shi, W.F.; Zhang, J.; Chen, J.X. Study on the phenotypic diversity of P. mume Sieb.et Zucc. germ plasm resources. J. Anhui Agric. Sci. 2011, 39, 12008–12009+12012. [Google Scholar] [CrossRef]
  49. Yu, W.W.; Wang, X.L.; Li, H.; Yan, G.R. Comparative studies on botanical characters of Elaeagnus moorcroftii Wall. ex Schlecht. and Elaeagnus oxycarpa Schlecht. J. Tianjin Agric. Univ. 2012, 19, 36–38+50. [Google Scholar] [CrossRef]
  50. Wang, P.P. The Variation Pattern of Elaeagnus L. in Xinjiang Based on Morphological Characters. Master’s Thesis, Xinjiang Agricultural University, Urumqi, China, 2015. [Google Scholar]
  51. Li, W.; Wang, P.; Qiqige; Zhang, Q.C.; Huang, B.J.; Xiao, Z.J. Phenotypic diversity analysis of blueberry germplasm resources. J. Beijing For. Univ. 2020, 42, 124–134. [Google Scholar] [CrossRef]
  52. Szamosi, C.; Solmaz, I.; Sari, N.; Bársony, C. Morphological evaluation and comparison of Hungarian and Turkish melon (Cucumis melo L.) Germplasm. Sci. Hortic. 2010, 124, 170–182. [Google Scholar] [CrossRef]
  53. He, T.; Fan, X.L.; Lu, L.; Huang, T.F. Phenotypic trait diversity of Dendrobium nobile from different provenances and their correlations with geographical factors. J. Plant Resour. Environ. 2021, 30, 1–11. [Google Scholar] [CrossRef]
  54. Fu, Q.J.; Li, C.N.; Chen, Y.; Zhao, F.K.; Sun, Y. Analysis of Phenotypic diversity of major Salvia splendens germplasm resources in China. J. Plant Genet. Resour. 2015, 16, 294–299. [Google Scholar] [CrossRef]
  55. Rui, W.J.; Wang, X.M.; Zhang, Q.N.; Hu, X.Y.; Hu, X.H.; Fu, J.J.; Gao, Y.M.; Li, J.S. Genetic diversity analysis of 353 tomato germplasm resources by phenotypic traits. Acta Hortic. Sin. 2018, 45, 561–570. [Google Scholar] [CrossRef]
  56. Khadivi, A. Phenotypic characterization of Elaeagnus angustifolia using multivariate analysis. Ind. Crops Prod. 2018, 120, 155–161. [Google Scholar] [CrossRef]
  57. Norman, P.; Tongoona, P.; Shanahan, P. Determination of tnterrelationships among agr-morphological traits of yams (Discorea spp.) using correrlation and factor analyses. J. Appl. Biosci. 2011, 45, 3059–3070. [Google Scholar]
  58. Zeng, Y.-F.; Zhang, J.-G.; Abuduhamiti, B.; Wang, W.-T.; Jia, Z.-Q. Phylogeographic patterns of the desert poplar in Northwest China shaped by both geology and climatic oscillations. BMC Evol. Biol. 2018, 18, 75. [Google Scholar] [CrossRef]
  59. Miller, R.B. Hawkmoths and the geographic patterns of floral variation in Aquilegia caerulea. Evolution 1981, 35, 763–774. [Google Scholar] [CrossRef]
  60. Steiner, K.E.; Whitehead, V.B.; Johnson, S.D. Floral and pollinator divergence in two sexually deceptive south African orchids. Am. J. Bot. 1994, 81, 185–194. [Google Scholar] [CrossRef]
  61. Johnson, S.D.; Steiner, K.E. Long-tongued fly pollination and evolution of floral spur length in the Disa draconis complex (Orchidaceae). Evolution 1997, 51, 45–53. [Google Scholar] [CrossRef] [PubMed]
  62. Galen, C. Why do flowers vary? BioScience 1999, 49, 631–640. [Google Scholar] [CrossRef]
  63. Galen, C.; Ritland, A.E.K. High and Dry: High and dry: Drought stress, sex-allocation trade-offs, and selection on flower size in the alpine wildflower Polemonium viscosum (Polemoniaceae). Am. Nat. 2000, 156, 72–83. [Google Scholar] [CrossRef]
  64. Carroll, A.B.; Pallardy, S.G.; Galen, C. Drought stress, plant water status, and floral trait expression in fireweed, Epilobium Angustifolium (Onagraceae). Am. J. Bot. 2001, 88, 438–446. [Google Scholar] [CrossRef]
  65. Herrera, J. Flower size variation in Rosmarinus officinalis: Individuals, populations and habitats. Ann. Bot. 2004, 95, 431–437. [Google Scholar] [CrossRef]
  66. Cruz-Maldonado, N.; Weemstra, M.; Jiménez, L.; Roumet, C.; Angeles, G.; Barois, I.; de los Santos, M.; Morales-Martinez, M.A.; Palestina, R.A.; Rey, H.; et al. Aboveground-trait variations in 11 (sub)alpine plants along a 1000-m elevation gradient in tropical Mexico. Alp. Bot. 2021, 131, 187–200. [Google Scholar] [CrossRef]
  67. Huang, W.; Zhong, Y.; Zhang, C.; Ren, M.; Du, Y.; Song, X. Leaf traits and water-use characteristics of Impatiens hainanensis, a limestone-endemic plant under different altitudes in dry and foggy seasons. Water 2022, 14, 139. [Google Scholar] [CrossRef]
  68. Liu, W.; Zheng, L.; Qi, D. Variation in leaf traits at different altitudes reflects the adaptive strategy of plants to environmental changes. Ecol. Evol. 2020, 10, 8166–8175. [Google Scholar] [CrossRef]
  69. Karadeniz, T. Selection of native “Cornelian” cherries grown in Turkey. J. Am. Pomol. Soc. 2002, 56, 164. [Google Scholar] [CrossRef]
  70. Du, Q.; Xu, B.; Gong, C.; Yang, X.; Pan, W.; Tian, J.; Li, B.; Zhang, D. Variation in growth, leaf, and wood property traits of Chinese white poplar (Populus tomentosa), a major industrial tree species in Northern China. Can. J. For. Res. 2014, 44, 326–339. [Google Scholar] [CrossRef]
  71. Cao, D.M.; Zhang, Y.H.; Cheng, X.Q.; Xiang, X.D.; Zhang, L.; Hu, J.J. Genetic variation of leaf phenotypic traits in different populations of Populus cathayana. Sci. Silvae Sin. 2021, 57, 56–67. [Google Scholar] [CrossRef]
  72. Fu, G.; Dai, X.; Symanzik, J.; Bushman, S. Quantitative gene–gene and gene–environment mapping for leaf shape variation using tree-based models. New Phytol. 2017, 213, 455–469. [Google Scholar] [CrossRef]
Figure 1. Geographical distribution of various populations of E. angustifolia. Geo-elevation data were derived from an SRTM DEMUTM 90 M resolution digital elevation in the Geospatial Data Cloud (http://www.gscloud.cn/, accessed on 12 August 2022). ArcGIS 10.7 geographic information analysis software was used for data processing to generate distribution maps.
Forests 14 01143 g001
Figure 2. Legend of some traits of E. angustifolia. (A) PSS—Petal spreading state: explanate (A1,A2); curling outward (A3,A4). (B) FNAL—Floret number in axils of leaves: (B1) 1 floret; (B2) 3 florets. (C) The color of each part of E. angustifolia. (C1) Branch color (C2) Flower color (C3) Leaf color (D) Measurement of floral traits: FD—Flower diameter; CTL—Calyx tube length; CTW—Calyx tube width; FSL—Flower stalk length.
Forests 14 01143 g002
Figure 3. Correlation heat map of phenotypic traits of E. angustifolia. (A) Correlations among 35 phenotypic traits; (B) Correlations between phenotypic traits and geo-climatic factors. ** p < 0.01, * p < 0.05. Black zone: because at least one variable was constant, calculations could not be performed. Geo-climatic factors and phenotypic trait abbreviations are shown in Table 1, Table 2 and Table 3.
Forests 14 01143 g003
Figure 4. Principal component analysis results of phenotypic traits of E. angustifolia. (A) The load of phenotypic traits and its projections on the first three principal component axes. The length of the line represents the size of the load.; (B) Scatter plot of 90 samples based on PC1 and PC2. Phenotypic trait abbreviations are shown in Table 2 and Table 3.
Forests 14 01143 g004
Figure 5. Ward clustering analysis results based on the squared Euclidean distance. (A) Cluster tree of 90 samples; (B) Geographical distribution of 4 groups of E. angustifolia in 10 populations. Phenotypic trait abbreviations are shown in Table 2 and Table 3.
Forests 14 01143 g005
Table 1. Geographical and climatic information and sample sizes of 10 populations.
PopulationSample SizeAltitude
(m, AL)
Longitude (°E, E)Latitude (°N, N)Annual Mean Temperature
(°C, AMT)
Annual
Precipitation
(mm, AP)
Annual Mean
Relative Humidity
(%, AMRH)
Dunhuang (DH)111168.294.6640.149.942.240
Suzhou (SZ)101492.098.5139.757.888.448
Linze (LZ)101453.1100.2639.098.3113.449
Ganzhou (GZ))51515.3100.3839.007.8132.652
Yongchang (YC)51728.7102.0638.375.4211.852
Minqin (MQ)201481.7103.1538.598.8113.244
Gulang (GL)101792.4102.9737.605.7352.351
Qilihe (QLH)71544.5103.7436.0710.5360.060
Yongjing (YJ)31967.3103.3935.989.7273.759
Linxia (LX)92025.1103.1935.617.3501.367
Table 2. Quantitative traits and abbreviations of E. angustifolia.
No.CharacterAbbreviationUnit
1Tree heightTHm
2Crown diameterCrDcm
3Diameter at breast heightDBHcm
4Under-branch heightUBHcm
5Branching angleBA°
6Branching numberBN
7Leaf lengthLLmm
8Leaf widthLWmm
9Leaf thicknessLThmm
10Petiole lengthPLmm
11Leaf shape indexLSI
12Leaf areaLAmm2
13Annual branch lengthABLmm
14Number of flower clusters on annual branchesNFC
15Ratio of flower cluster number to branch lengthRFB
16Flower diameterFDmm
17Calyx tube lengthCTLmm
18Calyx tube widthCTWmm
19Flower stalk lengthFSLmm
20Flower color numberFCN
21Floret number in axils of leavesFNAL
LSI = LL/LW, RFB = NFC/ABL. The “Flower color number (FCN)” is the total number of different flower colors on the same tree.
Table 3. Grading assignment of quality traits of E. angustifolia.
No.CharacterAbbreviationGrading Assignment
1234567
1Trunk
type
TTMulti-trunk shrubsLess trunk shrubsArbor
2Crown roundnessCRMessyModerateRounded
3Canopy
density
CaDeLowMediumHigh
4Tree growth vigorTGVLowMediumHigh
5Branch thornBTPresentAbsent
6Branch colorBCHay yellowBrownish greenRed brownDark brown
7Leaf shapeLSOval-shapedLong ovalOvateLanceolateNarrow lanceolate
8Leaf apex shapeLASObtuseAcuminate
9Speckles on leavesSLLowMediumHigh
10Leaf upper surface colorLUSCAloe gray(a) *Aloe gray(b)Aloe gray(c)Aloe gray(d)Dark olive greenGrass green(a)Grass green(b)
11Leaf lower surface colorLLSCAloe gray(a)Aloe gray(b)Aloe gray(c)
12Petal spreading statePSSExplanateCurling outward
13Flower density degreeFDDLowMediumHigh
14Flower colorFCRice whiteBeigePale
yellow
Bright
yellow
Orange
* The lowercase letters represent different shades of the same color. The level a is the lightest, and the color is deepened from a to d.
Table 4. Variance analysis and phenotypic differentiation coefficients among the E. angustifolia populations.
TraitsF ValueProportion of Variance Components (%)Phenotypic
Differentiation
Coefficients (%)
Among
Populations
Within
Populations
Among
Populations
Within
Populations
Random
Errors
TH4.125 **1.919 **27.5827.0945.3350.45
CrD2.458 **0.822.5015.4662.0459.28
DBH4.075 **1.949 **32.7624.3742.8757.34
UBH3.076 **0.68232.4811.2156.3174.34
BA0.9961.21712.1123.0264.8634.47
BN0.5031.1176.6422.9570.4122.45
LL3.319 **1.75124.0626.8049.1447.31
LW4.416 **2.048 **28.4527.8743.6850.52
LTh4.527 **1.2232.5018.7548.7563.41
PL2.992 **1.1624.4920.0455.4754.99
LSI2.793 **1.43222.1724.0153.8248.01
LA4.824 **1.63632.0422.9545.0258.27
ABL7.656 **1.41643.9417.1638.9071.92
NFC3.849 **2.122 **25.4829.6544.8746.22
RFB2.779 **2.394 **19.0234.5946.3935.48
FD4.658 **0.96334.5915.0950.3269.62
CTL2.574 **0.77623.4214.9161.6761.10
CTW17.57 **4.657 **51.4128.7619.8364.12
FSL5.911 **1.25438.5517.2644.2069.07
FCN2.0310.59520.1812.4767.3561.80
FNAL14.212 **0.53964.235.1430.6392.59
TT2.05 **1.59116.8227.5655.6237.90
CR3.576 **1.0928.2618.1853.5660.85
CaDe2.447 **1.22220.7321.8657.4148.68
TGV3.334 **0.98227.3617.0255.6261.65
BT12.341 **2.288 **51.5320.1628.3071.88
BC2.169 **0.96219.7618.5061.7551.64
LS2.203 **0.8120.6115.9963.4056.31
LAS3.348 **0.94627.6216.4755.9162.65
SL1.9090.93817.8918.5663.5449.09
LUSC1.3481.33812.3125.8061.8932.29
LLSC1.8161.4815.5026.6657.8536.76
PSS11.82 **2.826 **48.1224.2927.5966.45
FDD1.3482.36 **10.2838.0151.7121.29
FC2.316 **1.3319.4623.5956.9545.20
Mean 27.2821.4951.2354.15
** p < 0.01; phenotypic trait abbreviations are shown in Table 2 and Table 3.
Table 5. Coefficients of variation and Shannon–Wiener diversity indexes of phenotypic quantitative traits of E. angustifolia.
TraitsCoefficient of Variation (CV) (%)Diversity
DHSZLZGZYCMQGLQLHYJLXTotal
TH37.9228.2427.6510.4716.5746.4716.5233.0636.6643.4337.121.9570
CrD64.1725.6519.0311.1942.6126.5621.2157.2268.5440.0841.641.7890
DBH60.7621.2826.6415.0925.9258.1570.1395.1775.9876.9060.871.9219
UBH30.9475.8342.9347.8656.1933.0038.6495.4445.4823.3961.611.6802
BA47.2628.0445.2223.8920.3948.3238.0364.4431.7331.4043.641.9106
BN37.9730.8732.2220.3240.0037.6727.2030.6233.3329.7532.791.0927
LL18.4214.5726.3827.6724.6217.6716.4920.2311.5617.8221.822.0415
LW20.3713.1327.5721.9423.0725.0414.5818.437.5514.8123.151.9679
LTh14.6412.3519.6317.039.2519.8116.8014.485.263.5417.932.0265
PL23.4222.3823.9724.6424.7720.6718.4516.627.6710.4023.061.9730
LSI17.2313.7916.568.7314.5618.4518.1215.2012.6820.4517.982.0085
LA46.3624.4036.7246.6346.9641.9023.3635.0412.9325.6146.931.8967
ABL26.1140.2425.5223.3120.7521.8613.8323.2318.2630.3231.652.0228
NFC17.5313.8420.185.2710.7528.4625.3924.3822.0546.4325.911.9858
RFB24.1725.1934.1330.2320.0827.0316.8715.8015.7824.8726.662.0117
FD13.167.479.097.3318.578.868.065.279.124.6811.052.0723
CTL11.7614.4913.2112.637.2610.5310.239.9513.285.6312.042.0556
CTW13.1010.0310.1810.8314.8523.559.6313.3516.759.7319.711.9836
FSL27.9614.0437.4619.8744.7629.8314.6320.1926.0328.6435.551.9125
FCN37.4047.1334.0024.8324.8331.4428.4134.0834.5535.3536.520.9593
FNAL0.000.000.000.000.000.000.000.000.0059.8817.490.2449
Mean28.1323.0025.1619.5124.1327.3921.2730.5824.0627.7730.721.7864
Phenotypic trait abbreviations are shown in Table 2.
Table 6. Frequency distribution of quality traits and Shannon–Wiener diversity indexes of E. angustifolia.
TraitsDistribution Frequency of Each GradeDiversity
1234567
TT11.18.980.00.6378
CR55.623.321.10.9945
CaDe33.336.730.01.0953
TGV8.930.061.10.8773
BT65.634.40.6439
BC5.632.220.042.21.2114
LS26.76.712.248.95.61.3003
LAS37.862.20.6630
SL26.741.132.21.0828
LUSC4.424.417.85.616.721.110.01.8076
LLSC43.344.412.20.9797
PSS77.822.20.5297
FDD20.028.951.11.0236
FC11.127.824.416.720.01.5648
Mean 1.0294
Phenotypic trait abbreviations are shown in Table 3.
Disclaimer/Publisher’s Note: The statements, opinions and data contained in all publications are solely those of the individual author(s) and contributor(s) and not of MDPI and/or the editor(s). MDPI and/or the editor(s) disclaim responsibility for any injury to people or property resulting from any ideas, methods, instructions or products referred to in the content.

