Article

Evaluating Household Welfare in Participation of China’s Natural Forest Protection Program: A Dual Perspective of Income Welfare and Material Welfare

1
College of Economics and Management, Northeast Forestry University, Harbin 150040, China
2
Institute of Economics and Resource Management, Beijing Normal University, Beijing 100875, China
*
Author to whom correspondence should be addressed.
Forests 2023, 14(6), 1140; https://doi.org/10.3390/f14061140
Submission received: 4 March 2023 / Revised: 23 May 2023 / Accepted: 29 May 2023 / Published: 31 May 2023
(This article belongs to the Special Issue Forest, Trees, Human Health and Wellbeing)

Abstract

:
This paper presents novel empirical evidence on the welfare impacts of forest protection programs, focusing on both income and material welfare at the household level. Specifically, we conduct a household survey of 1271 households in forestry communities that participate in the Natural Forest Protection Program (NFPP) in China. The survey data are collected from 56 state forest enterprises (SFEs) across three provinces in China. We employ the Alkire–Foster method to calculate and decompose the material deprivation index based on household income levels. Our analysis reveals that forestry communities exhibit a significant proportion of households in low-income welfare states, comprising nearly one-fourth (25.41%) of the sample. Furthermore, we observe that the percentage of households in a low-material welfare state is nearly one-fifth (21.70%), with 7.79% of households experiencing both low-income and low-material welfare. Importantly, we find that welfare disparities persist across population subgroups based on occupation and geography. In addition, we assess the impact of the NFPP on household welfare outcomes and identify an elite group of technicians residing in urban communities down the hill who experience positive welfare effects from the program. These findings provide critical insights beyond a single welfare dimension and contribute to the growing literature on evaluating forest protection policies. Furthermore, the results offer valuable lessons for designing and implementing forest protection programs in other developing countries.

1. Introduction

In response to the formidable challenges of forest degradation and climate change, various forest protection programs have been implemented by forestry communities worldwide [1,2]. These programs encompass conventional protectionist approaches, such as the creation of protected areas and national parks by governments to control and manage forest resources [3,4], as well as decentralized forest management models through cooperative agreements between governments and local communities or businesses that involve joint and participatory management of forest resources [5,6,7,8]. Unfortunately, in low- and middle-income countries, the inherent conflict between protection and development often impedes the success of forest protection programs in achieving a balance between local forest resource stocks and community welfare [9,10,11]. This issue has far-reaching implications, as approximately 1.6 billion individuals globally rely directly or indirectly on forest resources for their livelihoods [12].
The Natural Forest Protection Program (NFPP), spearheaded by the Chinese government, is among the largest forest conservation initiatives globally in terms of spatial extent and government investment [13]. The present study aims to assess the efficacy of the NFPP, which was instituted in response to a crisis in forest resources that plagued China during the 1980s and 1990s. This crisis was largely precipitated by rampant logging activities, including heavy selective cutting and clear-cutting, by state forest enterprises (SFEs), which had been entrusted with the responsibility of developing and managing natural forest resources between 1949 and 1998 [14,15]. As a consequence, the depletion of natural forest resources in state-owned forest areas, including those located in the upper reaches of the Yangtze River, the middle reaches of the Yellow River, Northeast China, and Inner Mongolia [16,17,18], jeopardized the existence of numerous forestry workers and local forest ecosystems in northeastern China, posing a grave threat to their ecological security [19].
The efficacy of the NFPP in mitigating the ongoing forest resource crisis and promoting the welfare of local forestry communities has become a pressing issue, given the widespread academic interest in evaluating the effectiveness of diverse forest protection initiatives from a welfare perspective [20,21,22,23]. Over the NFPP’s implementation period (2000–2020), strict protection measures, such as logging restrictions and bans, led SFEs to shift their primary focus from “timber logging and processing” to “forest management, nurturing, and afforestation”. Consequently, numerous studies have demonstrated the significant effectiveness of the NFPP in preserving and restoring natural forest resources [18,24,25,26,27]. However, it remains unclear how the participation of forestry community households in the NFPP affects their welfare.
In the extant literature, the inquiry into the efficacy of forest protection programs in addressing the forest resource crisis and promoting the welfare of local forestry communities has primarily concentrated on the following domains (For technical progress in the existing literature around NFPP welfare effect assessment, see Appendix A): (1) assessment of the welfare of households within forestry communities from a unidimensional perspective, wherein household welfare levels are evaluated solely based on economic income [28]. Some scholars have examined the impact of the implementation of NFPP on the income of households employed by SFEs [29,30,31,32], while others have studied the effects of strict protection measures such as logging restrictions and forest nurturing implemented by SFEs during the NFPP implementation on the income of forestry community households [33,34]. (2) Assessment of the welfare of households within forestry communities from a multidimensional perspective. Here, the quality and status of household life are evaluated through the selection of multiple dimensions such as resources, capabilities, or power [35,36,37,38]. Some scholars have employed sustainable livelihood levels [39,40,41] and feasible capability levels [42,43] to measure and define the welfare level of forestry community households, while others have used subjective welfare satisfaction [44] or constructed a household wealth indicator system [45]. (3) Emphasis on vulnerable groups in local forestry communities. This strand of research mainly centers on the measurement and analysis of income poverty [46,47], multidimensional poverty [48], and household vulnerability [49,50] levels within the forestry community household group.
In the extant literature on forest protection programs, two primary limitations have been identified. Firstly, the measurement of household welfare levels in forestry communities is fragmented, with the ongoing debate over whether to adopt a unidimensional or multidimensional perspective [51,52]. Evaluation results based on a single perspective often result in biased conclusions [53]. For instance, lower-income groups are not necessarily in a multidimensional state of poverty, and vice versa [54,55]. Secondly, the issue of distributional heterogeneity of the incentive effects of forest protection programs has not been sufficiently discussed [56]. Compensation mechanisms such as conditional cash transfers [57,58], job provision [59], and community infrastructure investment [8] are typically introduced to generate incentive effects and to prevent conflicts between forest protection and residents’ demands. Distributional heterogeneity pertains to the differentiation of the benefits generated by compensation mechanisms within a group [56], which may not reach disadvantaged groups and may be captured by local elites [1]. In reality, the welfare effects of the NFPP vary among forestry community households owing to their different opportunities for welfare benefits. However, compared to the limited literature that focuses on vulnerable groups in forestry communities, the possibility that the welfare effects of the NFPP may be captured by elite groups has been almost disregarded, which is a significant issue in the field of research on forest protection program welfare effects [60,61,62].
In this paper, we aim to provide additional insights beyond the single welfare perspective and to examine the distributional heterogeneity of welfare effects of NFPP. Specifically, our research question is: What is the overall level of welfare for forestry community households who participated in the NFPP after 20 years, evaluated from both unidimensional and multidimensional welfare perspectives? Additionally, how do the proportion and overlap of low welfare groups vary across different welfare measurement perspectives? Are there any risks of the NFPP’s welfare effects being captured by local elites? To address these issues, this paper selected the Northeast and Inner Mongolia state-owned forest region (NSFR) as the study area, where we evaluated the welfare level of 1271 forestry community households in 2021, covering multiple dimensions of welfare information, such as income, health, energy, living environment, and social relations.
NSFR is composed of state-owned forest areas distributed in three provinces of Heilongjiang, Jilin, and Inner Mongolia, and managed by 87 SFEs. It is not only the core area of NFPP implementation but also the region with the most serious forest resource crisis outbreak, making it an ideal field to evaluate the effectiveness of NFPP. Among the 1271 sample households, they are distributed within the jurisdiction of 56 SFEs, accounting for 64.37% of the total enterprises. We will further elaborate on these issues in the research area section in Section 3.1 Study Area.
The present article is structured as follows. Section 2 provides a thorough review of the implementation context and the consequential effects of the forest protection programs (NFPP), thereby clarifying the research framework. Section 3 outlines the materials and methods adopted in this study. Section 4 presents the analysis based on the statistical outcomes derived from the quantitative data. Ultimately, Section 5 incorporates the discussion and conclusions.

2. Background and Framework

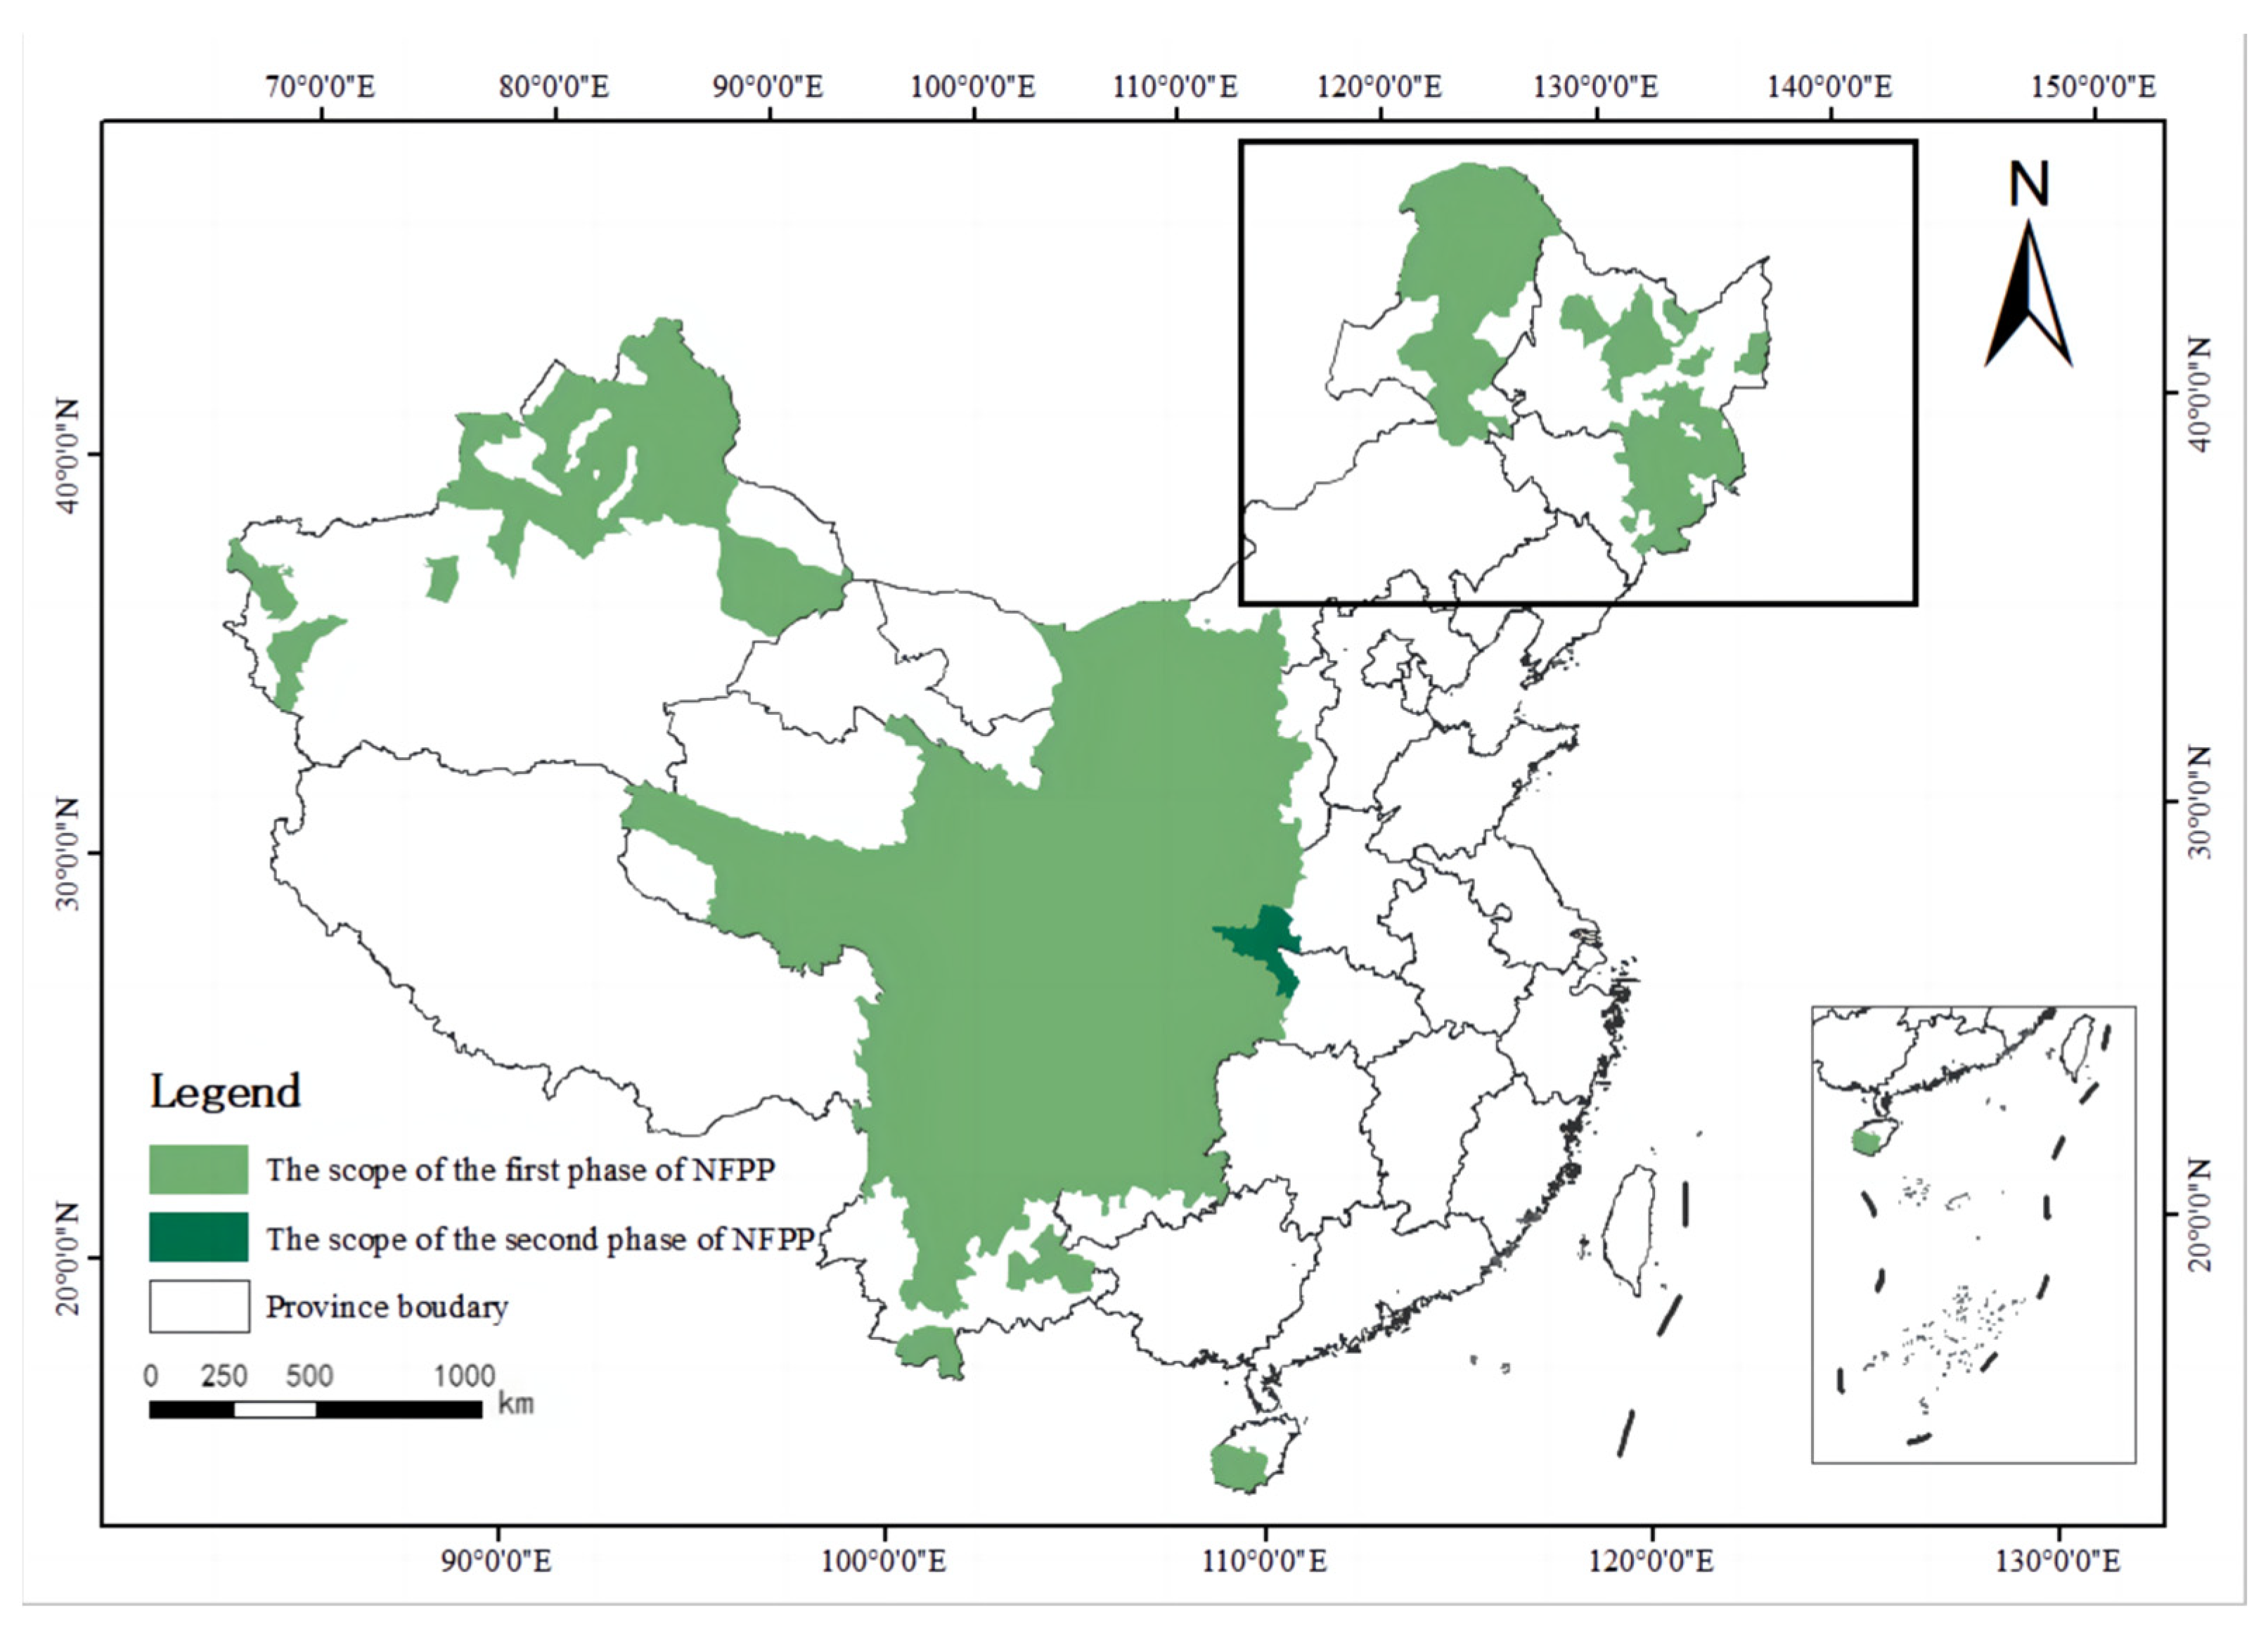
2.1. Implementation and Impacts of China’s Natural Forest Protection Program

The NFPP consists of two distinct phases: Phase I (2000–2010) and Phase II (2010–2020). The program is designed to cover a total of 17 provinces, which are deemed to be key state-owned forest areas. These areas include the upstream of the Yangtze River, the middle and upper reaches of the Yellow River, Northeast China, and Inner Mongolia (see Figure 1). The program aims to achieve the fundamental objectives of protecting and restoring natural forest resources [63] while ensuring and improving the welfare of forestry community households [19]. The NFPP achieves this goal by establishing engineering protection zones and entrusting SFEs to operate in these areas. An innovative operating model has been developed, which involves “central government funding and supervision—state forestry enterprises undertaking and operating—employment and income of forestry community households”.
The operational approach of the NFPP does not adopt a dichotomous selection between the conventional protectionist approaches and the decentralized forest management, but instead integrates both governance ideologies. On the one hand, the establishment of engineering protection zones funded and regulated by the central government embodies the conventional protectionist approaches ideology. In terms of financial resources, the operational funds of NFPP originate solely from the special transfer payment funds provided by the central government, as well as the matching funds from local governments, with the central investment accounting for more than 90%. In terms of regulation, in accordance with the “Forest Law of the People’s Republic of China,” natural forest resources belong to the entire public, while SFEs and participants from forestry communities only possess the management and utilization rights. As the principal founder and owner of the forest resources, the central government exerts comprehensive supervision over the operating plans, employment plans, and investment plans of SFEs. For instance, “The Review and Approval Method of Forest Management Plan for Key State-owned Forest Areas in Northeast China and Inner Mongolia (2017–2022)” [64] distinctly stipulates that the endorsement of the natural forest management plan must be completed by the Forest Resources Management Department of the State Forestry Administration.
On the other hand, decentralized forest management ideology is exemplified by the interactions between the central government and SFEs through agency and commission. The central government retains ownership of natural forest resources while delegating management and utilization rights to SFEs, which become the de facto agents of forest protection and restoration, subject to rigorous scrutiny by the former. In low- and middle-income developing countries, such as Mexico, India, and Guatemala, cooperation mechanisms between the central government and forestry communities are widespread. Forestry communities in these countries enter into long-term cooperation agreements with the national government, leading to the formation of community forestry enterprises (CFEs), which constitute successful examples of decentralized forest management [65,66]. Chinese SFEs may be considered analogous to CFEs, with their “political-enterprise integration” management system enabling them to simultaneously undertake the production function of enterprises and the function of local governments. This means that SFEs are required not only to fulfill the responsibility of devising and implementing forest management plans but also to fulfill the responsibility of providing employment opportunities and promoting community development.
During the implementation period of the NFPP from 2000 to 2020, SFEs took several measures to comply with the regulations. These measures included the utilization of central government transfer payments to implement quota-based logging and logging prohibition measures [67], the resolution of historical debts of enterprises [68], the transfer and resettlement of unemployed personnel [30], and the adjustment of the main business of enterprises [69]. The aforementioned measures have brought about three significant changes: (a) a shift in the operational strategy of natural forest resources, from natural forest development to natural forest protection; (b) a change in the production and operation direction of SFEs, from timber logging and processing to providing forest protection and restoration services; (c) a modification in the employment practices of forestry community households, from engaging in production-related positions such as logging, transportation, and processing provided by SFEs to participating in forest management, nurturing, afforestation, and fire prevention-related positions.
The effects of the aforementioned changes on the welfare of local forestry communities were significant, both directly and indirectly. Prior to the implementation of the NFPP, SFEs made substantial investments in community infrastructure and welfare initiatives (e.g., municipal buildings, communication networks, medical clinics, and educational institutions) to attract local labor and meet the needs of employees. These investments were financed by profits generated from the logging and processing industry. However, following the implementation of the NFPP, SFEs became wholly reliant on central government transfer payments for funding forest protection and restoration tasks, resulting in a lack of incentive for further investment in forestry community infrastructure and welfare projects. Prior to the NFPP, households in forestry communities engaged in various livelihood activities, including timber collection, crop cultivation under the forest canopy, livestock breeding, and forest product harvesting. Nevertheless, after the implementation of the NFPP, SFEs began implementing stringent protection measures, such as restricted logging and logging bans that prohibited local forestry community households from harvesting any trees, including windblown ones, which had a negative impact on the mushroom cultivation industry that relied on sawdust as a raw material.
In essence, the implementation of the NFPP has resulted in various impacts on the welfare of forestry community households, while also ensuring the preservation and restoration of natural forest resources. These impacts include changes in wage income, employment methods, livelihood activities, and living environment. Therefore, to comprehensively assess the overall welfare level of forestry community households participating in the NFPP, it is necessary to evaluate not only the unidimensional welfare represented by the economic income after the implementation of the NFPP, but also the multidimensional welfare that encompasses various aspects such as diet, energy, housing, work, and social interaction. Such an evaluation is necessary to account for the multi-faceted nature of the household welfare concept [70].

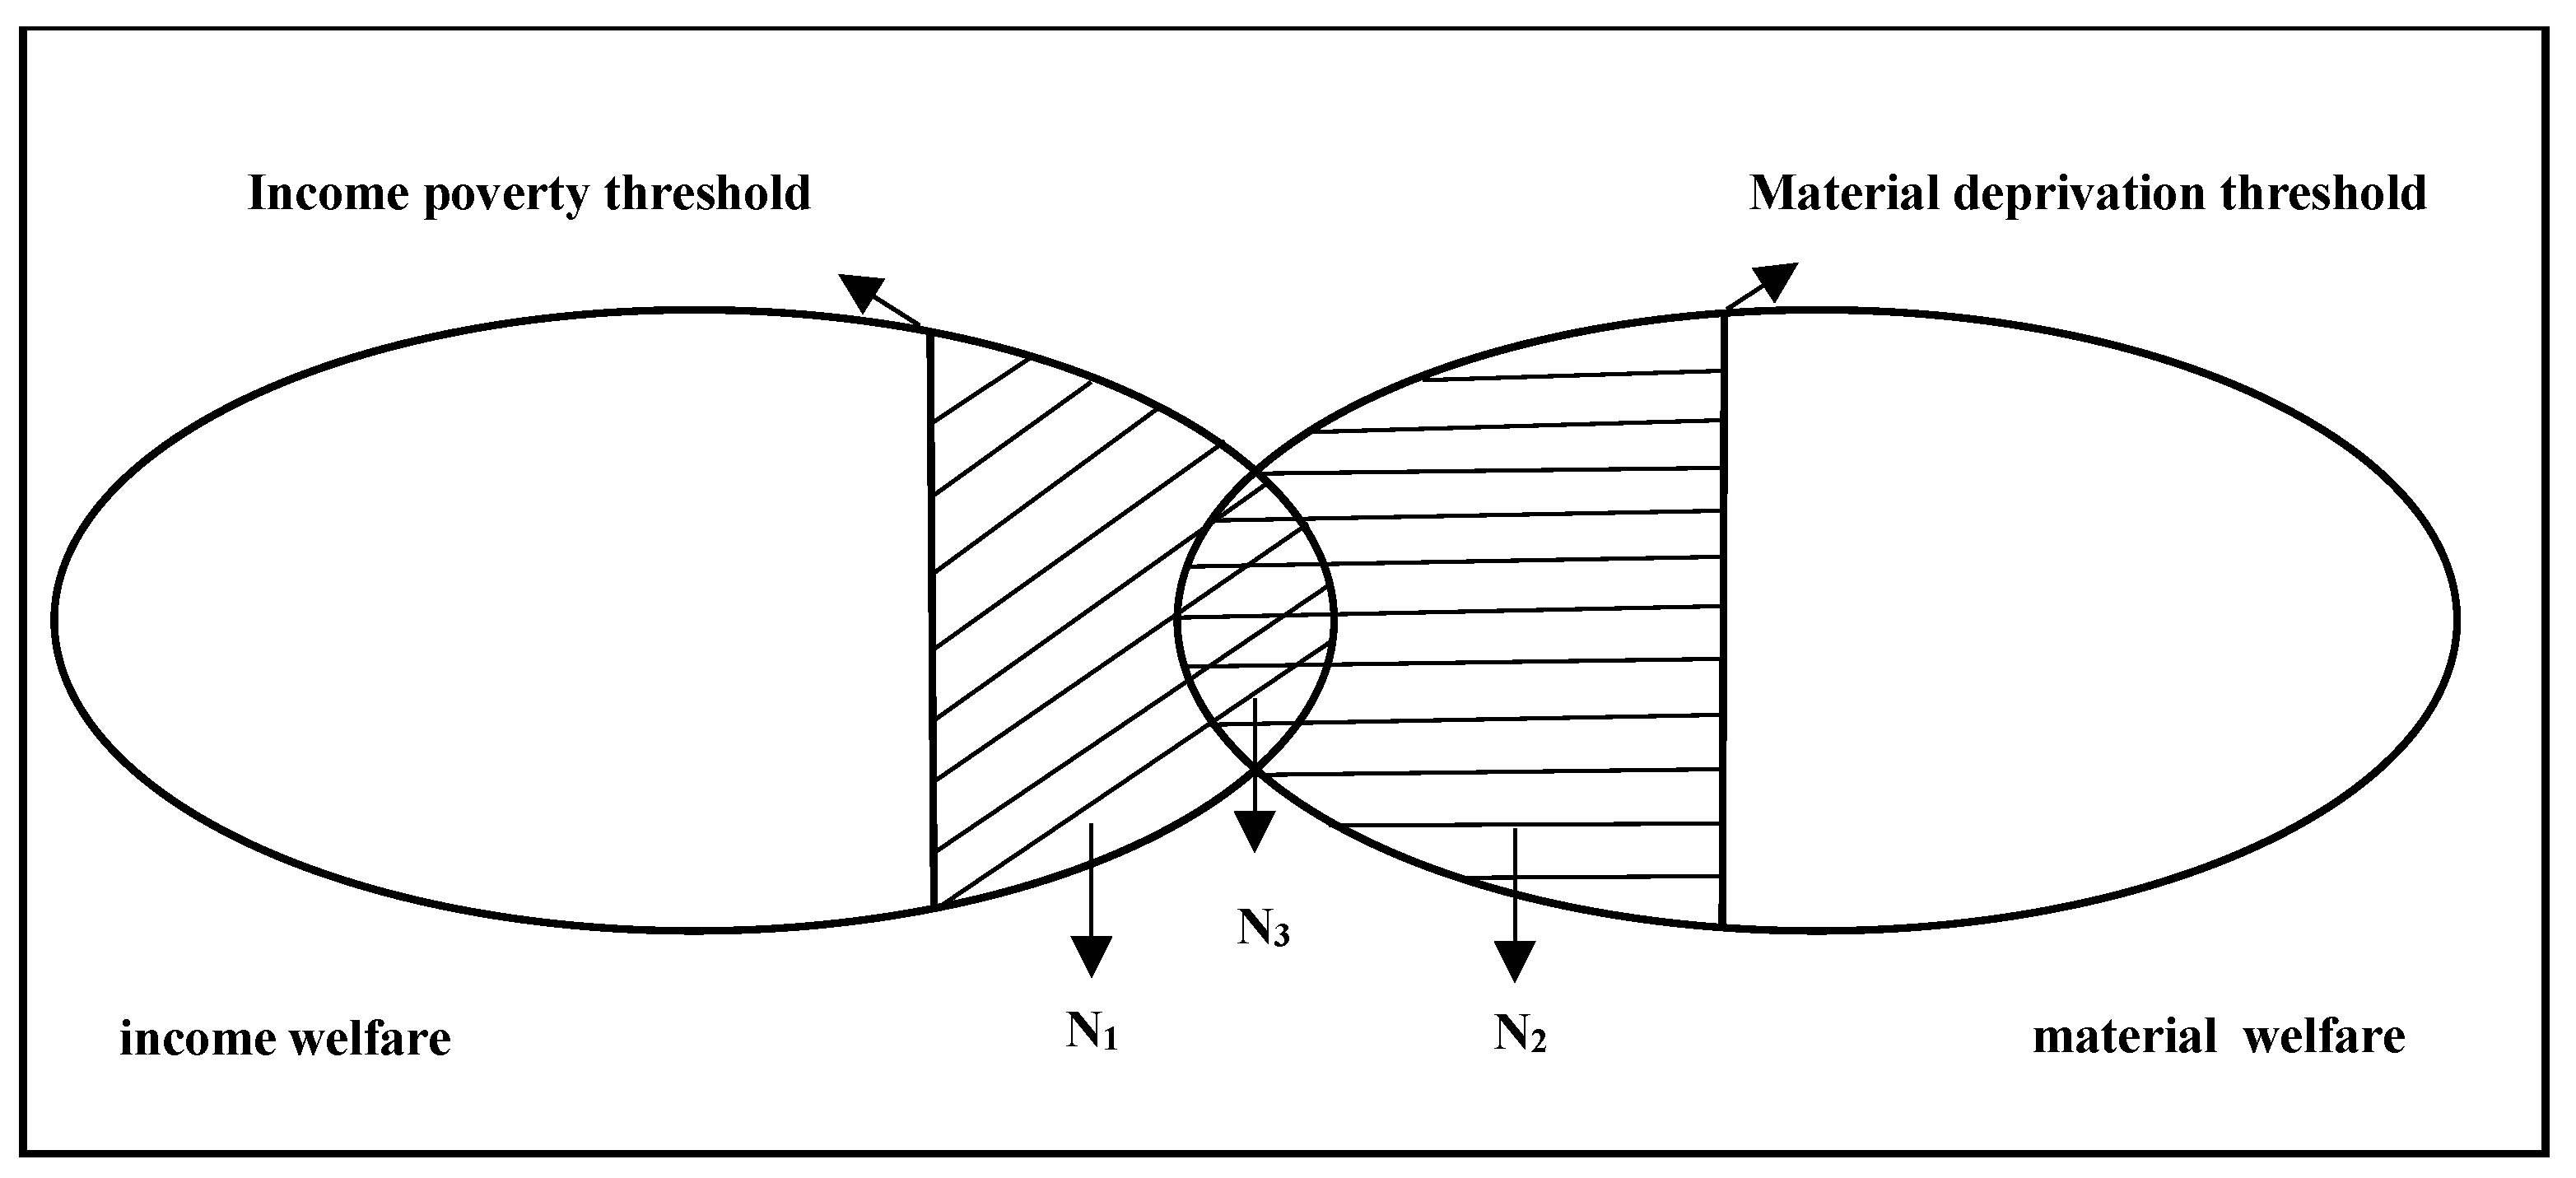
2.2. Research Framework

The primary aim of this article is to assess the overall welfare status of households within the forestry community who are participating in the National Forest Protection Programs (NFPP) while investigating the heterogeneity in the distribution of welfare effects resulting from these forest protection initiatives. The evaluation of household welfare is conducted from two perspectives: income welfare (unidimensional perspective) and material welfare (multidimensional perspective). The distribution heterogeneity issue concentrates on the welfare level and features of low-welfare groups (vulnerable groups) and elite groups (advantaged groups) within the forestry community. The research methodology can be summarized into three stages: defining and measuring household welfare levels, identifying low-welfare groups, and identifying elite groups.
Step 1 involves defining and quantifying household welfare levels, followed by an evaluation of the overall welfare status of forestry community households that participate in forest protection programs (NFPP). The definition and measurement of household welfare are crucial for assessing the welfare effects of various forest protection programs [71]. In light of the theoretical advancements in welfare economics, various measurement standards have been developed, such as income level, sustainable livelihood level, human development index, and material deprivation index [37,72,73]. To provide additional insights beyond a single welfare measurement perspective and to clarify conflicting results obtained under different standards, this study employs the income welfare theory (unidimensional perspective) and the material welfare theory (multidimensional perspective) to define and measure the welfare levels of forestry community households. The income welfare theory, rooted in the early period of welfare economics, regards welfare solely as economic welfare, and household per capita disposable income is commonly used as a proxy variable to measure household welfare levels [28]. The material welfare theory, developed in the later period of welfare economics, posits that welfare is the possession of necessary resources or abilities and is compatible with freedom, efficiency, and fairness.
One of the representative measurement indices utilized in assessing the welfare status of households is the Material Deprivation Index (MDI), which was originally proposed by Peter Townsend based on the concept of relative deprivation [35]. Material deprivation refers to the inability of individuals or households to consume or engage in activities that are commonly recognized and encouraged by society, due to limited financial resources [74,75]. This phenomenon reflects the level of welfare of individuals across various material dimensions, including food, housing, work, and social life [35]. The MDI has been widely applied to monitor the multidimensional material welfare of households in several countries, such as the United Kingdom, Ireland, and the United States, and organizations such as the European Union [76,77,78,79,80]. In this study, the household per capita disposable income and the MDI were ultimately selected as the proxy variables for income welfare (unidimensional perspective) and material welfare (multidimensional perspective), respectively, to evaluate the overall welfare level of households in forestry communities participating in the NFPP.
Step 2 involves identifying the low welfare group and exploring the heterogeneity of the effects of the NFPP on welfare, it is crucial to consider the proportion and characteristics of vulnerable groups. The low-welfare group, which is of primary interest, can be defined as the group whose welfare level falls below a certain social standard. Depending on the perspective of welfare measurement, the low-welfare group can be categorized into the low-income welfare group [81,82,83,84] and the low-material welfare group, also referred to as the material-deprived group [80]. The relationship between these two groups has been extensively examined in prior research [35,85], with some scholars estimating the degree of overlap between the two groups [86,87,88]. Some researchers argue that only individuals or households experiencing both low income and severe material deprivation can be considered truly impoverished [89,90]. Therefore, in line with Step 1, we identify the proportion of the low-income welfare group and low-material welfare group using the income poverty threshold and material deprivation threshold, respectively. Additionally, we explore the extent of overlap between these two groups and the proportion of the population experiencing both low-income and low-material welfare.
Step 3 involves identifying the elite group and investigating the risk of the welfare effects being captured by this group in the heterogeneous distribution of NFPP welfare effects. The elite group is a privileged social group that possesses disproportionate power, influence, and resources and is generally characterized by occupying high positions in various domains such as social, economic, and political spheres [91,92]. Drawing upon social stratification theory, this study defines the elite group in forest community households based on social and economic factors such as income, race, gender, and occupation. These factors help categorize individuals into different groups, thereby reflecting their relative social status. The concept of early occupational stratification [93] and subsequent developments in social stratification theory [94,95,96] are utilized to determine the elite group in the forest community households. By combining the grouping results of forest community households based on occupational and geographical stratification standards, we identify the intersecting group of the most privileged group under the two stratification standards as the local elite group. We measure the proportion of the elite group and examine the differences in welfare levels between this group and other groups.

3. Materials and Methods

3.1. Study Area

The Northeast and Inner Mongolia state-owned forest regions (NSFR) are geographically located between longitude 120–135° E and latitude 38–56° N. This region encompasses a forested area of 27.2748 million hectares, which represents 12.64% of China’s total forested area. Moreover, the forest stock in this area amounts to 3.007 billion cubic meters, representing 17.55% of China’s total forest stock.
The NSFR is a conglomerate of state-owned forest regions situated in three provinces, namely Inner Mongolia, Jilin, and Heilongjiang, encompassing a total of 87 SFFEs responsible for their operation and management. The SFEs have adopted the “government-enterprise unity” management system, which entails the fulfillment of production tasks for the exploitation and management of natural forest resources, as well as the responsibility of constructing local forestry communities. The forestry communities within NSFR are primarily categorized into two types: forest farm communities on the mountain and urban communities down the hill. Forest farm communities are small-scale forestry communities located on the mountain for the facilitation of timber harvesting and transportation operations, while urban communities serve as administrative and service centers for SFEs, as well as the main residential and commercial centers for local residents, situated down the hill.
The NSFR is a region of critical importance for the implementation of the NFPP, as well as the region that has witnessed the most severe forest resource crisis in history. Prior to the implementation of the NFPP, NSFR was a crucial timber production base with an annual capacity of up to 35 million m3, accounting for over 90% of China’s timber production [16,17]. However, the forest resource crisis led to a decline in the natural forest resources within NSFR, reducing from 2 billion m3 during its early stages of development in 1949 to 570 million m3 in 1990, a decline of 71.50% [97]. Consequently, SFEs without sufficient timber resources faced an acute debt crisis [98]. In 1996, the year-end debt for all 87 SFEs within NSFR reached an astronomical CNY 15.971 billion [99]. Furthermore, the laid-off workers suffered an average annual income of only CNY 430.17, less than one-tenth of the per capita disposable income of China’s urban residents in the same year [100].
After the implementation of the NFPP, the 87 SFEs within NSFR received transfer payments from the central government to settle their historical debts. These enterprises were primarily focused on protecting and restoring natural forests through the NFPP, which involved tasks such as forest management, nurturing, restoration, and afforestation. Over the course of the 20-year implementation of the NFPP (2000–2020), NSFR gradually implemented stringent protection measures, such as selective logging and complete logging bans, ultimately ceasing the commercial logging of natural forests in 2015. This led to a significant decline in wood production in NSFR, and the diminishing of pillar industries such as logging and processing is expected to have significant impacts on the subsequent development of local forestry communities and the livelihoods of households in these communities. The current conditions in NSFR provide an ideal opportunity to evaluate the effectiveness of the NFPP.

3.2. Data Sources

This study utilized cross-sectional data on forestry community households, which were collected from the “Livelihood Monitoring of State-Owned Forest Areas in Northeast China” survey project in May 2021. This joint survey project was conducted by the National Forestry and Grassland Administration and Northeast Forestry University, and aimed to comprehensively examine the living conditions of forestry community households involved in forest protection programs in NSFR. For the purposes of this study, forestry community households participating in the NFPP were defined as those with at least one member employed by the 87 SFEs operating within NSFR.
The present study utilized a multi-stage random sampling method to obtain the sample data from the forestry community households. Firstly, in each SFE’s operating area, two forest farm communities on the mountain and one urban community down the hill were equally sampled. Subsequently, 10 samples were randomly selected from the employee list of each of the three communities. The survey was conducted through computer-assisted telephone interviewing technology, utilizing structured interviews to collect responses to the survey questionnaire from the respondents. The surveyors further acquired relevant information about the household members during the interview process.
The survey data comprised three major categories: (i) demographic characteristics, encompassing variables such as age, gender, and marital status; (ii) household livelihood information, including variables such as income, consumption, housing conditions, work situation, and production and business activities and (iii) material deprivation information, involving deprivation situations across several material welfare dimensions, such as diet, energy, and social relations. The measures of economic income level and material deprivation, obtained through computer-assisted telephone interviews, furnished empirical evidence to assess the welfare status of forestry community households. After removing the samples that did not meet the research requirements, the final sample consisted of 1271 valid cases. These samples were drawn from the implementation areas of 56 SFEs, constituting 64.37% of the total number of SFEs (87) in the NSFR region.

3.3. Research Methods

3.3.1. Methods for Measuring Welfare Levels

First, this article employs per capita disposable income of households as a proxy variable to measure the income welfare level of forestry community households, from a unidimensional perspective. Its calculation formula is as follows:
Imean = Itotal/N = (Iwage + Ioperate + Itransfer + Iproperty)/N
Formula (1) specifies the variables used to measure the income of households, where Imean denotes the per capita disposable income, and Itotal represents the total income. The latter is composed of four parts: wage income (Iwage), operating income (Ioperate), transfer income (Itransfer), and property income (Iproperty). Wage income pertains to the pure wage income earned by household members from SFEs and other enterprises. Operating income includes the pure income earned by household members through agricultural and forestry production, as well as individual business operations. Transfer income encompasses income derived from government subsidies, gifts from relatives, and other sources. Property income consists of income obtained by household members from investments in stocks and real estate. The variable N signifies the size of the household population, and it is assessed using a universally accepted valuation standard that assigns a value of 1 for adults and 0.5 for children.
Second, this article uses the Material Deprivation Index (MDI) as a proxy variable for the material welfare level (multidimensional perspective) of forestry community households. Drawing upon the dimensions selected in existing MDI studies [80,101,102,103], we primarily adopt the logical and paradigmatic framework of the indicator system devised by Peter Townsend [35]. Given the specific circumstances of forestry community households within NSFR, this study develops a material deprivation index system, comprising 11 primary indicators and 53 secondary indicators. The 11 dimensions of material deprivation include diet, clothing, energy, household infrastructure, housing quality, working environment, health environment, dwelling environment, family relationships, recreational activity, and social relationships (The specific meanings of each material deprivation indicator can be found in Appendix B).
MDI is characterized by additivity and comparability. Additivity implies that the MDI score is obtained by summing up the individual scores of material deprivation dimensions, which reflect the material deprivation status of households [104]. Comparability denotes that a household with a score of “2” experiences more severe material deprivation than one with a score of “1”. Hence, this study utilizes the Alkire–Foster method to streamline the process of weighting indicators and calculating composite indices [105].
The material deprivation index score (ci) for the i individual can be computed as a weighted sum of the dimensions in which they experience deprivation, using the weight matrix w = (w1, …, wD). The deprivation matrix g0, which is constructed based on the population’s indicator levels Y and deprivation thresholds z = (z1, …, zD), is used to determine whether an individual is deprived in a particular indicator dimension. Mathematically, the computation of ci can be expressed as follows:
c i   = j = 1 D w j × g ij
where gij is the element of the deprivation matrix g0 corresponding to the i individual and j indicator dimension, and wj is the weight assigned to the j indicator dimension in the weight matrix w. The summation is carried out over all indicator dimensions j from 1 to D.
This formula calculates the material deprivation index (MDI) for each individual by multiplying the deprivation status (1 or 0) of each indicator dimension with the corresponding weight and summing up the weighted values across all indicator dimensions. The MDI score (ci) provides a quantitative measure of the level of material deprivation experienced by the i individual, taking into account the relative importance of each indicator dimension as determined by the weights assigned in the weight matrix w. Currently, the field of material deprivation research generally assigns equal weight to w [80,101,102,103].

3.3.2. Methods for Identifying Low Welfare Group

First, low-income welfare groups are identified from the perspective of income welfare using income poverty thresholds. Income poverty thresholds represent the minimum cost below which an individual or household is considered to be in a state of low welfare, with examples including absolute and relative poverty lines. Specifically, if the per capita disposable income (Imean) of household i in the sample falls below the income poverty thresholds, then household i is classified as belonging to the low-income welfare group.
The definition of absolute and relative poverty lines’ threshold standards varies across different countries and regions. China’s announced absolute poverty line threshold standard for 2020 is approximately 4000 CNY/year (The absolute poverty line in China after 2011 was set at 2300 CNY/year (at constant 2010 prices), which is approximately 4000 CNY/year in 2020.). The latest global poverty line standard published by the World Bank has been adjusted from $1.90 per person per day to $2.15 per person per day (approximately 5365.5 CNY/year). In contrast to the absolute poverty line, the relative poverty line varies with changes in the distribution of social income [82] and is usually determined based on a specific proportion of the average or median social income level [106]. For instance, the European Union sets its relative poverty line threshold standard at 60% of the median disposable income per capita, while the OECD employs 50% of the median disposable income per capita as its threshold standard. Considering that households in the forestry community of the NSFR region possess urban registration (the household registration system in China refers to the system of residence and identity certification that the Chinese government implements for citizens within the scope of administrative management in the country. In China’s household registration system, there are two different types of household registration: urban and rural. Urban household registration is usually held by people who reside or work in cities, while rural household registration is held by people who reside or engage in agricultural production in rural areas. There are significant differences between urban and rural household registration in social welfare, education, employment, and other areas, which is one of the important reasons for the urban-rural gap and inequality in Chinese society [107,108]. Official statistics provide China’s per capita disposable income for urban and rural residents, respectively. Forest protection programs in the NSFR area are classified as urban household registration, and therefore, this article selects the median per capita disposable income of urban residents in China for calculation) and selecting the median as a reference is a widely adopted international practice [109,110,111,112], this study ultimately adopts a certain proportion of the median disposable income per capita of urban residents in China to define the relative poverty line standard. According to data released by the National Bureau of Statistics of China [113], the median disposable income per capita of urban residents in China was 40,378 CNY/year in 2020.
This study adopts specific income poverty threshold standards to identify low-income welfare groups. For the absolute poverty line, the selected thresholds are 4000.0 CNY/year and 5365.5 CNY/year, respectively. For the relative poverty line, this study chooses three different thresholds which correspond to 40%, 50%, and 60% of the median per capita disposable income of urban residents in China (40,378 CNY/year). The resulting standards are 16,151 CNY/year, 20,189 CNY/year, and 24,226 CNY/year, respectively.
Second, this study employs a method for identifying low-material welfare groups using the material deprivation threshold (k, 0 < k < 1). The material deprivation threshold k represents the level of weighted deprivation that an individual or household must surpass to be recognized as being in a state of material deprivation. For instance, when the indicator dimension D is 10 and the material deprivation threshold k is 0.3, it means that individual i must experience deprivation in at least four indicators simultaneously to be considered part of the low-material welfare group. The material deprivation threshold used in current literature is commonly 1/3 [35,101,102,103], while some scholars set k to 4/9 [80] and 1/2 [55], representing the threshold levels of two levels of severe material deprivation.
To identify low welfare groups under the material deprivation threshold k, an identification function ρk (yi, z) is constructed, which takes a value of 1 if the MDI score ci exceeds the threshold k, and 0 otherwise. Hence, the H index under the material deprivation threshold k is used to reflect the proportion of the population with low-material welfare and can be expressed as:
H = i = 1 N ρ k y i , z / N   =   q / N
where q represents the size of the poverty population (i.e., the number of individuals or households with a value of 1 for the identification function ρk (yi, z)), and N represents the total population size.
Alkire and Foster [105] argued that the poverty incidence index (H) fails to capture the theoretical expectation that the incidence of poverty should increase as the poverty population experiences deprivation in new dimensions. To address this limitation, they proposed the average deprivation index (A), which measures the average degree of deprivation experienced by the poverty population, A = {|g0(k)|}/q. Specifically, A is calculated as the ratio of the sum of all entries in the deprivation matrix g0(k) to the size of the poverty population (q), where |g0(k)| is the sum of all deprivation indicators for each person in the poverty population, and |g0(k)| = i = 1 N j = D g ij 0 k . The adjusted poverty measure M0 not only reflects the proportion of the low-welfare group (H) but also their average degree of deprivation (A), with the formula as follows:
M0 = H × A = |g0(k)|/N
An important property of the index M0 is its perfect decomposability into subgroups and indicators. Specifically, the overall measure can be expressed as a weighted average of poverty levels for each subgroup, where the weights are determined by the subgroup’s share of the population, expressed as:
M 0 = g = 1 G Ng / N × M 0 , g
The M0 index of subgroup g is denoted by M0,g, and Ng refers to the population size of subgroup g. Therefore, the contribution percentage of subgroup g can be calculated as C0,g = (Ng/N)(M0,g/M0). M0 can be decomposed based on various population groups (e.g., race or geographic region) and deprivation domains (e.g., education, income, or health), making it well-suited for comparing group differences in policy analysis [114]. The decomposition approach enables us to identify the dimensions of the material deprivation index system that play a larger role in causing individuals or households to experience multidimensional material deprivation, and facilitate targeted policy optimization.
Third, we assess the differences and correlations between the two low welfare states by proportion scale. The differences are reflected in the disparity in size between the group below the income poverty threshold, denoted as N1, and the group below the material deprivation threshold, denoted as N2, both of which are proportions of the total population size N (see Figure 2). On the other hand, the correlation is revealed by the overlap size between the two low welfare groups, denoted as N3, with proportion sizes of N3/N1 and N3/N2, respectively. Notably, the proportion size of the population experiencing both low welfare states in the total population is N3/N.

3.3.3. Methods for Identifying Elite Group

As an advantaged social group, the elite possesses elevated levels of social, economic, and political status [92]. Hence, identifying the elite group requires selecting the “status” dimension for comparison between the advantaged group and other groups. Social stratification theory offers several dimensions to choose from, including wealth status, occupational status, and social status [93,96,115]. The characteristic of forestry communities is the “forest dependency” relationship between human activities and forest resources [116,117]. In the study area (NSFR) examined in this paper, the implementation of NFPP transformed the above “forest dependency” relationship from a consumptive to a coexistent type, giving rise to two distinctive social stratification phenomena.
One phenomenon resulting from the implementation of the NFPP is occupational stratification. To adapt to the main business transformation, SFEs employed various measures such as one-time placement, transfer, and other means to address the surplus labor force resulting from the decrease in timber production. A significant number of workers who were previously employed in logging, processing, and transportation positions were relocated and assigned to forest management, nurturing, afforestation, and other positions. During the implementation of the NFPP, SFEs offered four types of positions primarily to local forestry community households, which included management positions, technical positions, forest positions, and temporary positions (the management positions primarily involve management tasks, including developing business plans, overseeing functional departments, and providing structural support for the operation of the National Forest Protection Program (NFPP). Technical positions, on the other hand, focus on technical work such as forestry surveying, formulation of technical standards, and providing technical support for the successful execution of the NFPP. Forest positions are primarily responsible for forest management, nurturing, afforestation, and breeding, providing necessary manpower support for the efficient functioning of the NFPP. Temporary positions, meanwhile, are responsible for providing short-term services, such as assisting in nurturing and afforestation projects, logistics support, and other related service support to ensure the smooth operation of the NFPP). This occupational stratification, which resulted from these measures, can be regarded as an indicator of relative socioeconomic status [118].
Another phenomenon resulting from the implementation of NFPP is geographical stratification. Two main types of forestry communities exist within the study area (NSFR), forest farm communities on the mountain and urban communities down the hill. With the gradual disappearance of natural forest harvesting and transportation in the forest farm communities on the mountain, their remote geographic location, which is mostly based on the characteristics of mountains and valleys, resulted in a growing gap in population size, road quality, infrastructure services, medical education level, and other indicators, as compared to the urban communities down the hill.
In brief, occupational stratification leads to disparities in individuals’ earnings and social status, while geographical stratification results in discrepancies in individuals’ residential and social environments. A plausible deduction is that, under the NFPP, individuals with superior abilities and more resources are inclined to secure better positions and more favorable living locations. Consequently, a logical method to pinpoint the elite group in this study is to first evaluate the disparity in welfare levels between groups using two categorization standards, identify the most advantaged group (highest welfare level) under the occupational stratification criterion and the most advantaged group (highest welfare level) under the geographical stratification criterion, and secondly, designate the intersection group of the most advantaged groups under the two categorization standards as the elite group.

4. Results and Analysis

4.1. Measurement Results and Analysis of Welfare Level

4.1.1. Measurement Results and Analysis of Income Welfare Level

The mean per capita disposable income of 1271 households in the NSFR region for the year 2020 was 28,178.88 CNY/year. The income composition analysis revealed that 83.96%, 3.07%, 11.90%, and 1.07% of the income were sourced from wage income, operational income, transfer income, and property income, respectively (see Table 1). The data in Table 1 indicated that wage income and transfer income were the primary income sources for forestry community households, whereas operational income and property income made up only a small fraction of the personal income, which highlighted the structural characteristic of heavy dependence on wage income. Consequently, it can be reasonably concluded that the enhancement of salary standards for different positions in SFEs could potentially enhance the welfare level of the local forestry community households in terms of income.

4.1.2. Measurement Results and Analysis of Material Welfare Level

The total MDI score (mdi_total) and its sub-indices (mdi_domain1-mdi_domain11) were calculated for 1271 households residing in forestry communities within the NSFR range in the year 2020 (see Table 2). The result shows that the average MDI score for households in the forestry communities is 0.254. In particular, the scores for material deprivation in the domains of work environment, leisure activities, and social relations were relatively high, at 0.054, 0.062, and 0.043, respectively. A higher MDI score indicates a lower level of material welfare and a more severe state of material deprivation. These findings reveal a widespread occurrence of material deprivation in the forestry communities, characterized by inadequate working conditions, insufficient opportunities for leisure activities, and limited social relations.
As all of the 53 s-level indicators under the 11 dimensions of material deprivation are binary variables, it is possible to investigate the proportion of deprivation for forestry community households on each of the 53 dimensions of material welfare (in order to save space for the report, the detailed calculation results are not shown in this paper. The reader can request the detailed results from the author). For instance, to assess the material deprivation rate in the context of indicator 2, it is sufficient to measure the proportion of the 1271 samples whose indicator 2 value is 1. This enables the quantification of the prevalence of material deprivation in the indicator 2 dimension. Among them, the indicators with a material deprivation rate exceeding 80% are indicat35 (Whether the unit provides meal expenses or subsidies) and indicat48 (Did you travel last year), which suggests that a large number of forestry community households working in various positions do not receive meal subsidies and lack leisure activities such as travel.

4.2. Identification and Analysis of Low Welfare Group

4.2.1. Identification and Analysis of Low-Income Welfare Group

Based on the income welfare standard (unidimensional perspective), the low-income welfare groups are identified as forestry community households with per capita disposable income levels falling below the income poverty threshold. The income poverty threshold can be obtained by adopting the standard as defined in Section 3.3.2, which in turn helps to determine the size and proportion of low-income welfare groups (see Table 3). When the absolute poverty line is selected, the number of samples with per capita disposable income below the income poverty threshold in the 1271 forestry community households are 0 and 2, respectively, with an absolute poverty incidence of 0.00% and 0.16%. Thus, it is evident that absolute poverty is largely absent in forestry community households within the NSFR. On the other hand, when the relative poverty line is chosen, the income poverty threshold standard is established based on 40%, 50%, and 60% of the median per capita disposable income of urban residents in China in 2020 (40,378 CNY/year). The number of samples with per capita disposable income below the income poverty threshold standard in 1271 forestry community households are 186, 323, and 487, respectively, with a relative poverty incidence ranging between approximately 14% and 40%.
A comparative analysis of the incidence of relative poverty within the NSFR was conducted by reviewing the existing literature. The results indicate that the prevalence rates of relative poverty in the NSFR were higher than those documented in previous studies, irrespective of the median thresholds used (i.e., 40%, 50%, or 60%). Specifically, the incidence rate of relative poverty in China, based on a median threshold of 40%, was 9.0% [109], while the OECD and EU reported incidence rates of 11.7% [110] and 21.1% [111], respectively, based on median thresholds of 50% and 60%. Similarly, the UK’s incidence rate was 22.0% [112] based on the 60% median threshold. These findings indicate a significant presence of low-income welfare groups among forestry community households. To facilitate comparative analysis, the median threshold of 50% (20,189 CNY/year) was selected for the subsequent sections. Under this threshold, the size of low-income welfare groups within the NSFR was estimated at 323, which accounts for 25.41% of the total population.
We conducted a further comparison of income levels and income structure between the low-income welfare group and other groups (see Table 4). As shown in Table 4, the low-income welfare group is disadvantaged in terms of income level across all types of income, with a per capita disposable income level less than half of the other groups (46.72%). In terms of income structure, the low-income welfare group relies heavily on wage income (90.19%), while operating and transfer income support is lacking, leaving them vulnerable to a single income type. On the one hand, the implementation of the NFPP has limited the participation of forestry community households in production and business activities, such as under-forest planting, breeding, and collection. On the other hand, it indicates that the low-income welfare group has insufficient family property, including bank deposits, and the proportion of property income structure is negligible (less than 1.00%). In conclusion, while forestry community households participating in the NFPP do not experience absolute poverty, nearly a quarter (25.41%) of them belong to the low-income welfare group (relative poverty population) exhibiting typical characteristics of low-income levels and single-income structures.

4.2.2. Identification and Analysis of Low-Material Welfare Group

Adopting a multidimensional perspective of welfare standards, we define low-material welfare groups in forestry community households as those with MDI scores below the material deprivation threshold (k). To enhance the reliability of our findings, we reported the computed results of several indices for the low material welfare groups. We considered three levels of material deprivation thresholds (k = 1/3, 4/9, and 1/2), as outlined in Section 3.3.2 (see Table 5). Our analysis indicates that when the k is set at 1/3, the proportion (H index) of the low-material welfare group is 0.217, implying that nearly one-fifth (21.7%) of households in forestry communities within the NSFR experience multidimensional material deprivation. Under this standard, the average MDI score of low material welfare groups is 0.42, which is twice as high as that of other groups. When the k is adjusted to represent severe material deprivation (k = 4/9, 1/2), the values of the H index are 0.065 and 0.027, respectively. These figures indicate that the proportion of low-material welfare groups experiencing severe material deprivation is less than 10% and 5%, respectively. It is noteworthy that regardless of the k used, the average MDI score of the low-material welfare group is approximately twice as high as that of other groups. This indicates that the low-material welfare group experiences a significantly more pronounced phenomenon of material deprivation compared to other groups.
As stated in Section 3.3.2, the M0 index possesses perfect decomposability, implying that it can be disintegrated based on the dimensions of material deprivation. Following Formula (5), the contributions of the 11 dimensions of material deprivation toward the M0 index can be determined (see Table 6). Notably, the top three dimensions with the highest contribution to the M0 index are domain10 (related to recreational activities) at 17.1%, domain11 (related to social relationships) at 12.3%, and domain6 (related to working conditions) at 12.0%. This highlights the need to address material deprivation in terms of working conditions, social activities, and recreational activities, which can escalate the risk of individuals or households falling into a state of low-material welfare. Therefore, while implementing NFPP, it is crucial for SFEs to increase investment in improving working conditions, offering recreational facilities, and enhancing medical institutions’ level, as these measures significantly contribute to improving the material welfare of forestry community households.

4.2.3. Results of Differences and Correlations Analysis between Two Low Welfare Groups

This study employed two distinct thresholds to identify low welfare groups: the income poverty threshold and the material deprivation threshold. Specifically, the income poverty threshold was defined as 50% of the median per capita disposable income in Chinese urban areas, which amounted to 20,189 CNY/year. On the other hand, the material deprivation threshold was set at k = 1/3. Subsequently, we conducted a differences and correlations analysis between the two low welfare groups (see Table 7).
Among the 1271 forestry communities households, a total of 323 (25.41% of the size N1/N) and 276 (21.72% of the size N2/N) belong to the low-income welfare and low-material welfare groups, respectively. The difference in the sizes of these two low-welfare groups is statistically significant. Notably, poverty as measured by income is more prevalent than poverty as measured by material deprivation. Regarding the correlation between the two low welfare groups, 99 individuals belong to both the low-income welfare group and the low-material welfare group, accounting for 30.65% (N3/N1) of the low-income welfare group, 35.87% (N3/N2) of the low-material welfare group, respectively, and 7.79% (N3/N) of the total population of the 1271 forestry communities households.
The population exhibiting a dual low welfare state, as denoted by N3, is of particular interest in this study. Table 8 presents the mean differences between this group and others in terms of income level, consumption level, degree of material deprivation, and subjective satisfaction. The results indicate that the dual low welfare group is disadvantaged in all four dimensions of comparison, suggesting that individuals experiencing both low-income levels and high levels of material deprivation are the most marginalized and least likely to benefit from the implementation of the NFPP. This group is at high risk of poverty, as it is characterized by both income and material poverty. Further analysis based on geographical and occupational stratification standards revealed that out of the 99 samples belonging to the dual low welfare group, 35 were located in forest farm communities on the mountain, while 64 were situated in urban communities down the hill. The group with the largest scale comprised forest workers and temporary workers, accounting for 68 and 17 individuals, respectively, which together represented 85.86% of this group. Thus, it can be concluded that a significant proportion of the dual low-welfare group facing poverty issues is distributed among frontline workers actively involved in the task of natural forest protection and restoration.

4.3. Identification and Analysis of Elite Group

4.3.1. Grouping Results and Welfare Level Differences under Occupational and Geographical Stratification Standards

To investigate differences in welfare levels among various groups, we employed the identification approach detailed in Section 3.3.3, and the results are presented in Table 9. Specifically, we identified the group with the highest welfare level under the occupational stratification standard and the group with the highest welfare level under the geographical stratification standard.
Occupational stratification refers to the classification of workers based on the job types provided by the SFEs to local forestry communities during the implementation of the NFPP. In this study, we categorized four groups, namely managers, technicians, forest workers, and temporary workers. Our results showed that the technicians group was the most advantaged group under the occupational stratification standard. Specifically, this group exhibited the highest income level (29,761.13 CNY/year) and the lowest level of material deprivation degree (0.21). Moreover, the proportion of the technicians group in both low-income welfare status and low-material welfare status was the lowest, at 12.77%.
Geographic stratification was carried out based on the types of forestry communities within the NSFR range, with the resulting groups divided into two categories: forest farm communities on the mountain and urban communities down the hill. The analysis indicates that the urban communities down the hill are the most advantaged group under the geographic stratification standard. This group exhibits higher income levels, a lower degree of material deprivation, and a lower proportion of low-welfare groups.

4.3.2. Definition and Welfare Disparities of Elite Group

The elite group with the most advantageous position can be identified at the intersection of the most advantageous groups formed by two grouping criteria. In this study, technicians living in urban communities down the hill were identified as the elite group among forestry communities households within the NSFR, based on grouping calculation results presented in Section 4.3.1. To explore the differences in income level, consumption level, material deprivation degree, and subjective satisfaction between the elite group and other groups, further calculations were performed, and the results are reported in Table 10.
Based on the data presented in Table 10, the cohort of elite individuals comprises 44 members, which accounts for 3.46% of the total sample of 1271 households. In comparison to other groups, the elite group exhibits an advantageous position in terms of income level, consumption level, and material deprivation index. Notwithstanding, the elite cohort may demonstrate lower subjective satisfaction, which could be attributed to their higher expectations for their quality of life. The study area’s technicians, who inhabit the urban communities down the hill, display a more favorable socio-economic status than other groups, characterized by higher levels of income and consumption, and a lower degree of material deprivation. Such pronounced discrepancies in welfare between the elite and other groups raise concerns about the possibility of local elites capturing the welfare effects of the NFPP, thereby posing a challenge to the equitable distribution of benefits.

5. Discussion and Conclusions

5.1. Discussion

5.1.1. Enhancing the Efficacy Evaluation of Forest Protection Programs from a Dual Welfare Perspective: An Imperative for Effective Conservation Strategies

Assessing the welfare of households in forestry communities is a crucial starting point for evaluating the effectiveness of forest protection programs [71]. However, the issue of measuring welfare has been a contentious subject in academia, with debates centering on unidimensional income welfare and multidimensional material welfare perspectives [51,52]. The outcomes of using distinct measurement perspectives often display limited overlap [119,120,121], implying that low-income groups may not necessarily experience deprivation in the realm of material welfare, and vice versa [54,55]. As such, it is essential to expound on the disparities in results generated by diverse welfare measurement perspectives in a logical manner [53]. These findings have implications for decision-makers and researchers involved in forest protection programs, underscoring the importance of enhancing the efficacy evaluation of such programs from a dual welfare perspective. The comprehensive evaluation results of income welfare and material welfare levels for households participating in the NFPP not only supplement and update the expanding empirical literature on evaluating forest protection policies [20,21,22,23] but also address the shortcomings of biased evaluation outcomes arising from selective measurement perspectives in previous literature.
The evaluation results reveal that the income welfare level of households in forestry communities is 28,178.88 CNY/year, which is 65% lower than the average disposable income per capita in urban areas of China (43,834 CNY/year). Wage income constitutes more than 80% of the total income. These findings are consistent with the conclusions drawn by Jiang and Xu (2011) [29], Wang et al. (2016) [30], and other studies that indicate that participation in the NFPP can offer stable employment opportunities and increase income. Nonetheless, low-income levels and a single-income structure continue to pose significant challenges to improving the welfare of households in forestry communities [31,122]. The material welfare level, as reflected by the material deprivation index, has an average value of 0.254, implying that material deprivation is prevalent, and there is a marked absence of good working conditions, adequate recreational activities, and extensive social networks. These results are in line with the recent pessimistic findings of Sun and Geng (2022) [40], who assessed the welfare effects of NFPP from the perspective of livelihood resilience, suggesting that measures such as logging restrictions and bans constrain the role of NFPP in enhancing the multidimensional material welfare level of community households.
In response to forest environmental degradation, developing countries have widely adopted decentralized forest management in the form of CFEs to enhance community participation and benefit sharing in forest protection programs [2,8]. However, decentralization also poses a challenge as it weakens the government’s protection and control capacity for valuable forest resources [123]. The Chinese government-led NFPP program has adopted the “government-enterprise-community” operating model, integrating conventional protectionist approaches and decentralized forest management. This study provides an opportunity to observe the effectiveness of this integrated protection form and offers insights into other developing countries’ forest protection programs. For precious tree species, effective measures include establishing nature reserves, setting up special protection positions and operation funds, and leveraging the government’s “bottom-line” advantages in providing employment and guaranteeing minimum income. For economic tree species, decentralized forest management in the form of CFEs [124,125,126] can be fully implemented to improve the operational efficiency and profitability of forest resources. This would enable forestry communities to have sustainable operating funds for investment and construction of infrastructure and welfare projects.
It is important to acknowledge that the findings presented in this article are subject to certain limitations. The evaluation conclusions are drawn from cross-sectional data on the livelihoods of forestry community households in 2020, which may not fully reflect the temporal evolution of income and material welfare indicators. Therefore, the establishment of a longitudinal database for tracking welfare measurements will be a crucial area of focus for future research in the context of forest protection programs, the track panel data can also further satisfy the realization of constructing counterfactual research designs.

5.1.2. Ensuring the Rights of Vulnerable Groups Is a Prerequisite for the Effectiveness of Forest Conservation Programs

Scholars have identified impoverished groups in forestry communities as a barrier to achieving a balance between increasing forest resources and improving community welfare through protection programs [11]. This dependence on forest resources for survival not only contributes to forest degradation but also perpetuates the impoverishment of forest-dependent communities [9,10]. The concept of “forest dependency” introduced by Fortmann and Kusel [116] highlights the close interrelationship between forest resources and human activities in forestry communities. Households rely on forest products such as timber, firewood, and non-timber forest products to sustain their basic livelihood activities, including energy, housing, and food [127]. It is evident that the stringent protection measures of forest protection programs will affect these livelihood activities, thereby constraining the motivation of community households to participate in forest protection programs. Thus, it becomes necessary to ensure the rights of vulnerable groups and to increase their share of compensation benefits in the distribution plan as a prerequisite for the effective implementation of forest protection programs.
Therefore, the current study aims to identify and assess the vulnerable groups within local forestry communities from both the perspectives of income welfare and material welfare. Based on the evaluation results, the income welfare perspective reveals the existence of a low-income welfare group (25.41%) among the forestry community households participating in the NFPP, while no absolute poverty was found. This finding is in line with the existing literature on poverty among forestry community households [46] and supports the recent research results of Chen et al. (2022) [47], which suggest that the implementation of the NFPP project has effectively addressed the issue of absolute poverty, but still faces severe challenges of relative poverty. The material welfare perspective shows that nearly one-fifth of the households (21.70%) belong to a low-material welfare group, with a material deprivation index twice that of other groups. In comparison to multidimensional welfare indices such as sustainable livelihood levels and feasible capacities utilized in existing literature, the material deprivation index is better able to capture the material welfare level of forestry community households in dimensions such as work environment, living environment, and social relations [85], and has stronger targeting for optimizing environmental governance policies [128,129]. For instance, SFEs can focus on improving dietary subsidies or the work environment. Furthermore, our attempt to use the material deprivation index to measure the welfare level of forestry community households in China for the first time provides a useful starting point for evaluating the welfare effects of environmental governance policies in other developing countries.
The findings of the evaluation of the degree of overlap between the low-income welfare group and low-material welfare group convey a crucial message that should be taken seriously by decision-makers of forest protection programs. If the degree of overlap is high, it implies that decision-makers can solve the dual challenge of income poverty and material poverty by increasing the intensity of fiscal transfer payments or raising compensation standards to enhance the income levels of participants. Regrettably, the evaluation results presented in this article demonstrate that the mutual overlap proportion between the low-income welfare group and low-material welfare group is maintained at approximately one-third (30.65% and 35.87% respectively). This indicates that decision-makers of forest protection programs should not exclusively focus on the income welfare of participants but also pay attention to their material welfare. As underscored by Heflin and Butler (2013) [130], the occurrence of entering and exiting material poverty is more frequent and common than that of entering and exiting income poverty. Therefore, improving the working environment of participants and enriching the social and entertainment activities in the residential community of participants pose challenging yet optimal directions for various forest protection programs, as opposed to merely increasing the wage income level of participants.

5.1.3. Avoiding Unfair Distribution Results of Elite Capture of Benefits in Forest Protection Programs

In the domain of environmental governance, the public’s expectation is that participants in governance should receive policy welfare effects in an equitable manner. This implies that merely focusing on the overall welfare effects of a group is inadequate, and it is essential to also consider the degree of welfare inequality within the group [7,131]. Extensive research has demonstrated the heterogeneity of incentive effects produced by diverse forest protection programs, revealing an inability to attain an equitable distribution of benefits among groups. For instance, the investigations conducted by Gelo and Koch (2014) [132], Moktan et al. (2016) [133], and Okumu and Muchapondwa (2020) [1] all indicate that forest protection programs tend to provide a greater improvement in welfare to high-income households compared to low-income households.
Designing a benefit distribution scheme that is equitable and just not only adheres to the principles of social justice [134] but also enhances the optimization and advancement of forest protection programs. It is noteworthy that the current literature scarcely addresses the heterogeneity of welfare effects in the allocation of NFPP, despite recent empirical research by Yuan et al. (2022) [135] that tested the effectiveness of ecological compensation mechanisms in optimizing the pattern of benefit distribution. Nonetheless, prevailing research heavily concentrates on current issues and theoretical debates regarding the direction of resolving the benefit distribution scheme [122,136,137]. The possibility that the welfare effects of NFPP might be captured by privileged groups remains largely unexplored. The implementation of forest protection programs frequently generates a significant impact on the socio-economic structure of local forestry communities. Therefore, decision-makers and researchers must consider how to mitigate the risk of power and benefits being seized by local elite groups during the process of restructuring the socio-economic system [138], and identifying the identity of elite groups becomes a crucial step in addressing this issue.
The present study demonstrates the applicability of social stratification theory in identifying the elite group and uncovering the heterogeneity in incentive effects distribution within forest protection programs. Following the implementation of the NFPP, SFEs and forestry community households had to adapt to the shift in external environmental policy from “logging” to “protection” [139,140], leading to the emergence of two distinct social stratification phenomena, namely occupational and geographical stratification. The intersectional group of technicians living in urban communities down the hill, which belongs to the optimal advantaged group under the two stratification criteria, constitutes the local elite group, enjoying privileged positions in terms of income, consumption, and material welfare levels. Nevertheless, the frontline participants, i.e., forest workers and temporary workers who were actually engaged in forest protection and restoration during the implementation of the NFPP, did not receive the most benefits.
Our recommendation is to integrate indicators that are linked to enhancing income welfare and material welfare into the performance evaluation frameworks of government, enterprises, and communities. In order to mitigate the welfare disparity that arises from geographical stratification through relocation initiatives, and to address the welfare disparity that is caused by occupational stratification through employment training and promotional pathways. We advocate for decreasing the proportion of low-welfare and elite groups, gradually transforming the population distribution pattern of forestry communities from a “pyramid-shaped” to an “olive-shaped” distribution, and mitigating the risk of power and benefits being monopolized by the local elite group.

5.2. Conclusions

The primary objective of the study presented in this article is to evaluate the effectiveness of China’s Natural Forest Protection Program (NFPP) and provide valuable insights for the development and optimization of forest protection programs in other developing countries. The study utilizes data from 1271 forestry community households that participated in the NFPP within the NSFR to evaluate the overall welfare effects of the program, including income welfare and material welfare, and to examine the distributional heterogeneity of the program’s welfare effects. The key findings of the study include:
First, The NFPP has played a significant role in safeguarding and enhancing the welfare of forestry community households, with participating households’ income levels significantly exceeding China’s absolute poverty line standard. However, the program’s ability to increase income and enhance “soft welfare” remains limited, as the overall level of income welfare remains low, and material deprivation is widespread, particularly concerning the work environment, leisure activities, and social relationships.
Secondly, the welfare effects of the NFPP demonstrate a typical allocation heterogeneity problem, with significant differences in welfare levels between low welfare groups and other groups. The study identifies that approximately 25.41% of forestry community households belong to the low-income welfare group, and about 21.72% of households belong to the low-material welfare group. The overlapping proportion of low welfare groups from the two perspectives of welfare was approximately one-third, and the size of the group in both income poverty and material poverty accounted for 7.79% of the total group size.
Thirdly, the study suggests that the intersection of the optimal and advantageous groups under different social stratification standards can be used to identify the local elite group. The study’s assessment results indicate that technicians residing in the urban communities down the hill (with a group size of 44, accounting for 3.46% of the total sample households) constitute the elite group in the NSFR region, characterized by higher levels of income and consumption and a lower degree of material deprivation than other groups. This finding suggests that the welfare effects of the NFPP are subject to elite group capture. It should be noted that we are cautious about the research conclusions about elite groups. The “elite group” mentioned in this article is a broad concept, which assumes that the dominant group that benefits the most from the NFPP is the elite group. The research conclusions can only be regarded as the starting point for analyzing the distribution results of NFPP’s welfare effects. More accurate and in-depth research depends on the comparative results of future longitudinal data.
Based on the study’s results, the authors recommend that the operation mode and evaluation mechanism of forest protection programs, including the NFPP, should be further improved from the welfare perspective. This includes (1) incorporating various welfare measurement indicators, such as income welfare and material welfare, into the project objectives and performance evaluation system of forest protection programs to avoid governance blind spots; (2) designing assistance or compensation programs that are diverse and differentiated based on the type of low welfare group (income, material, or both) and (3) providing a fair and just benefit distribution plan to avoid marginalized weak groups and the monopoly of benefits by the elite group.

Author Contributions

Conceptualization, B.C. and H.Z.; methodology, Z.C. and Z.S.; formal analysis, X.H. and B.Y.; writing—original draft preparation, B.C.; writing—review and editing, H.Z.; software, B.C., Z.C. and Z.S.; visualization, X.H. and B.Y.; data curation, X.H. and B.Y. All authors have read and agreed to the published version of the manuscript.

Funding

This research was funded by National Forestry and Grassland Administration Fund Project “Northeast State-owned Forest Region People’s Livelihood Monitoring”, JYC2-2022-0002.

Data Availability Statement

The datasets generated and analyzed during the current study are not publicly available, but are available from the corresponding author upon reasonable request.

Conflicts of Interest

The authors declare no conflict of interest.

Appendix A

Table A1. Evaluation Studies of the Welfare Effects of NFPP by Different Scholars.
NumProxy VariableMeasurement
Perspective
YearData TypeLiterature
1Household Income Unidimensional 1997/2004/2008Micro Survey Cross-sectional [29]
2Household IncomeUnidimensional1997/2004/2008Micro Survey Cross-sectional[30]
3Household IncomeUnidimensional2015/2016Micro Survey Cross-sectional[33]
4Wage IncomeUnidimensional2001–2016Statistical Yearbook Panel[31]
5Wage IncomeUnidimensional2017Micro Survey Cross-sectional[34]
6Forest IncomeUnidimensional2021Micro Survey Cross-sectional[32]
7Sustainable LivelihoodMultidimensional2008Micro Survey Cross-sectional[39]
8Household WealthMultidimensional2012Micro Survey Cross-sectional[45]
9Feasible CapabilityMultidimensional2017Micro Survey Cross-sectional[42]
10Life SatisfactionMultidimensional2017Micro Survey Cross-sectional[44]
11Feasible CapabilityMultidimensional2019Micro Survey Cross-sectional[43]
12Sustainable LivelihoodMultidimensional2015/2019Micro Survey Cross-sectional[40]
13Sustainable LivelihoodMultidimensional2021Micro Survey Cross-sectional[41]

Appendix B

Table A2. The Material Deprivation Index questionnaire.
CategorySerial NumberIndex
Diet1Have you eaten normally every day for the past two weeks?
2Do you get fresh meat every week?
3Does your child have school meals at school?
4Are you able to cook breakfast most days of the week (at least 5 days out of 7)
5Have you hosted a family dinner in the last month?
Clothing6Did you buy out-of-season shoes last year?
7Did you buy new clothes last year?
8Did you buy clothing online in the last year?
9Have you purchased new winter clothing in the past three years?
Energy10Whether the household has a steady supply of electricity (without frequent blackouts).
11Is the home centrally heated?
12Is the indoor temperature below 16 degrees Celsius in winter?
Household infrastructure13Do you have a TV at home?
14Does the home have a refrigerator?
15Do you have a smartphone at home?
16Do you have Internet access at home?
17Do you have a computer at home?
18Do you have a washing machine at home?
19Do you have a vacuum cleaner at home?
20Does the home have tap water?
21Do you have a sofa at home?
Housing quality22Does the home have one or more of the following four facilities (indoor toilet, sink or washbasin, bathtub or shower, cooking utensils)?
23Is the permanent residence a dangerous building?
24Whether there are quality problems such as rain leakage and water leakage in the permanent residence.
25Whether three or more people in the family live in one room.
Working environment26Whether you work outdoors most or all of the time.
27Whether you have been standing or walking to work.
28Do you work more than eight hours a day (choose No if it is exactly eight hours)?
29Do you take at least one day off per week?
30Working conditions: 1. Provide heating facilities when working in winter; 2. Provide rest drinks such as tea or coffee (whether charged or not); 3. The workplace has indoor flushing toilets; 4. Washing and changing facilities are provided at the workplace; 5. The workplace has indoor dining conditions; 6. The workplace provides a place to put coats and spare clothes; 7. The workplace provides a place where personal belongings can be locked and kept; 8. The workplace provides first aid kits or first aid equipment; 9. Working hours allow the possibility of making at least one personal phone call per day.
31Have you been unemployed for more than two weeks in the past year?
32Whether there is a situation of job instability, such as the possibility of being fired at any time.
33Whether the unit pays the wages when the unit asks for leave (due to work or illness)
34Does the unit provide paid leave during the year?
35Whether the unit provides meal expenses or subsidies.
Health environment36Have you been in bed for more than 14 days in the last year?
37Do you have chronic diseases, such as long-term use of certain drugs to maintain good health (excluding health care products)?
38Do you have a disability?
Dwelling environment39Are there leisure places such as parks or squares near your home?
40Is the environmental pollution around your usual residence serious?
41Is there a public or private kindergarten near the place of residence (within 3 km)?
42Whether there are public or private primary and secondary schools near the place of residence (within 3 km).
Family relationships43Does child have safe play spaces at home?
44Has the child had a playmate in the past four weeks?
45Did you celebrate your child’s birthday last year?
46Did your household spend less than 1000 CNY during the Spring Festival last year?
Recreational activity47Whether you have been out for a walk or entertainment at night in the last two weeks.
48Did you travel last year?
Social relationships49Do you have someone who can help in an emergency (e.g., sick)?
50Have you entertained relatives and friends over for dinner in the last four weeks?
51Have you dined out with friends and family in the last four weeks?
52Have you moved in the last two years?
53Have you ever participated in the discussion and discussion of other collective affairs such as elections?

References

  1. Okumu, B.; Muchapondwa, E. Welfare and forest cover impacts of incentive based conservation: Evidence from Kenyan community forest associations. World Dev. 2020, 129, 104890. [Google Scholar] [CrossRef]
  2. Butler, M. Analyzing community forest enterprises in the Maya Biosphere Reserve using a modified capitals framework. World Dev. 2021, 140, 105284. [Google Scholar] [CrossRef]
  3. Blaikie, P.; Jeanrenaud, S. Biodiversity and human welfare. Soc. Chang. Conserv. 1997, 46–70. [Google Scholar]
  4. Gbadegesin, A.; Ayileka, O. Avoiding the mistakes of the past: Towards a community oriented management strategy for the proposed National Park in Abuja-Nigeria. Land Use Policy 2000, 17, 89–100. [Google Scholar] [CrossRef]
  5. Conroy, C.; Mishra, A.; Rai, A. Learning from self-initiated community forest management in Orissa, India. For. Policy Econ. 2002, 4, 227–237. [Google Scholar] [CrossRef]
  6. Adhikari, B.; Di Falco, S.; Lovett, J.C. Household characteristics and forest dependency: Evidence from common property forest management in Nepal. Ecol. Econ. 2004, 48, 245–257. [Google Scholar] [CrossRef]
  7. Gelo, D.; Muchapondwa, E.; Koch, S.F. Decentralization, market integration and efficiency-equity trade-offs: Evidence from joint forest management in Ethiopian villages. J. For. Econ. 2016, 22, 1–23. [Google Scholar] [CrossRef]
  8. Gebreegziabher, Z.; Mekonnen, A.; Gebremedhin, B.; Beyene, A.D. Determinants of success of community forestry: Empirical evidence from Ethiopia. World Dev. 2021, 138, 105206. [Google Scholar] [CrossRef]
  9. Wunder, S. Poverty alleviation and tropical forests—What scope for synergies? World Dev. 2001, 29, 1817–1833. [Google Scholar] [CrossRef]
  10. Fisher, M. Household welfare and forest dependence in Southern Malawi. Environ. Dev. Econ. 2004, 9, 135–154. [Google Scholar] [CrossRef]
  11. Robinson, E.J. Resource-dependent livelihoods and the natural resource base. Annu. Rev. Resour. Econ. 2016, 8, 281–301. [Google Scholar] [CrossRef]
  12. Dubois, O. Forest-based poverty reduction: A brief review of facts, figures, challenges and possible ways forward. In Forests in Poverty Reduction Strategies: Capturing the Potential; Oksanen, T., Pajari, B., Tuomasjukka, T., Eds.; Forestry Policy and Institutions Branch, FAO: Saarijarvi, Finland, 2003; pp. 65–81. [Google Scholar]
  13. Liu, J.; Li, S.; Ouyang, Z.; Tam, C.; Chen, X. Ecological and socioeconomic effects of China’s policies for ecosystem services. Proc. Natl. Acad. Sci. USA 2008, 105, 9477–9482. [Google Scholar] [CrossRef] [PubMed]
  14. Wang, W.; Delang, C.O. Chinese forest policies in the age of ideology (1949–1977). Int. For. Rev. 2011, 13, 416–430. [Google Scholar] [CrossRef]
  15. Delang, C.O.; Wang, W. Chinese forest policies in the age of decentralisation (1978–1997). Int. For. Rev. 2012, 14, 13–26. [Google Scholar] [CrossRef]
  16. Yin, R. Forestry and the environment in China: The current situation and strategic choices. World Dev. 1998, 26, 2153–2167. [Google Scholar] [CrossRef]
  17. He, F.; Ge, Q.; Dai, J.; Rao, Y. Forest change of China in recent 300 years. J. Geogr. Sci. 2008, 18, 59–72. [Google Scholar] [CrossRef]
  18. Dai, L.; Li, S.; Zhou, W.; Qi, L.; Zhou, L.I.; Wei, Y.; Yu, D. Opportunities and challenges for the protection and ecological functions promotion of natural forests in China. For. Ecol. Manag. 2018, 410, 187–192. [Google Scholar] [CrossRef]
  19. Wang, H.; He, M.; Ran, N.; Xie, D.; Wang, Q.; Teng, M.; Wang, P. China’s key forestry ecological development programs: Implementation, environmental impact and challenges. Forests 2021, 12, 101. [Google Scholar] [CrossRef]
  20. Wiggins, S.; Marfo, K.; Anchirinah, V. Protecting the forest or the people? Environmental policies and livelihoods in the forest margins of Southern Ghana. World Dev. 2004, 32, 1939–1955. [Google Scholar] [CrossRef]
  21. Clements, T.; Suon, S.; Wilkie, D.S.; Milner-Gulland, E.J. Impacts of protected areas on local livelihoods in Cambodia. World Dev. 2014, 64, S125–S134. [Google Scholar] [CrossRef]
  22. Wunder, S.; Angelsen, A.; Belcher, B. Forests, livelihoods, and conservation: Broadening the empirical base. World Dev. 2014, 64, S1–S11. [Google Scholar] [CrossRef]
  23. Ngoma, H.; Hailu, A.T.; Kabwe, S.; Angelsen, A. Pay, talk or ‘whip’to conserve forests: Framed field experiments in Zambia. World Dev. 2020, 128, 104846. [Google Scholar] [CrossRef]
  24. Ma, Y.; Fan, S. Ecological-economic effects of Grain to Green Program in desertification areas. J. Nat. Resour. 2005, 20, 590–596. [Google Scholar]
  25. Liu, M.; Tian, H. China’s land cover and land use change from 1700 to 2005: Estimations from high-resolution satellite data and historical archives. Glob. Biogeochem. Cycles 2010, 24. [Google Scholar] [CrossRef]
  26. Delang, C.O.; Wang, W. Chinese forest policy reforms after 1998: The case of the natural forest protection program and the slope land conversion program. Int. For. Rev. 2013, 15, 290–304. [Google Scholar] [CrossRef]
  27. Qiao, D.; Yuan, W.T.; Ke, S.F. China’s Natural Forest Protection Program: Evolution, impact and challenges. Int. For. Rev. 2021, 23, 338–350. [Google Scholar] [CrossRef]
  28. Perry–Rivers, P. Stratification, economic adversity, and entrepreneurial launch: The effect of resource position on entrepreneurial strategy. Entrep. Theory Pract. 2016, 40, 685–712. [Google Scholar] [CrossRef]
  29. Jiang, X.; Xu, J. Analysis on the Income Change of Workers in the Key State-owned Forest Region of Northeast and Inner Mongolia. For. Econ. 2011, 01, 25–29. [Google Scholar]
  30. Wang, H.; Zhang, H.P.; Xu, J.T. The Impact of the Reform of Key State-owned Forest Areas on the Family Income of Employees. J. Zhejiang A F Univ. 2016, 33, 680–688. [Google Scholar]
  31. Zhu, H.G.; Song, Z.J.; Zhang, X.L. Research on the impact of the reform process of key state-owned forest areas on wage income of employees. Issues For. Econ. 2019, 39, 269–273. [Google Scholar]
  32. Zhu, H.G.; Zhang, X.L.; Lu, Z.G. Comparative analysis of measurement methods for family forest dependence of employees in key state-owned forest areas. Issues For. Econ. 2022, 42, 578–588. [Google Scholar]
  33. Zhao, W.C.; Zhang, X.L.; Song, Z.J. The impact of forest tending subsidy policy on family income mobility of employees in state-owned forest areas. Issues For. Econ. 2019, 39, 280–285. [Google Scholar]
  34. Geng, Y.D.; Jiang, Y.L. The main factors affecting the family income of workers in state-owned forest areas after the complete cessation of commercial logging in natural forests. J. Northeast. For. Univ. 2022, 50, 122–126. [Google Scholar]
  35. Townsend, P. Poverty in the United Kingdom: A Survey of Household Resources and Standards of Living; University of California Press: Oakland, CA, USA, 1979. [Google Scholar]
  36. Sen, A. A sociological approach to the measurement of poverty: A reply to Professor Peter Townsend. Oxf. Econ. Pap. 1985, 37, 669–676. [Google Scholar] [CrossRef]
  37. Sen, A. Commodities and Capabilities; OUP Catalogue: Oxford, UK, 1999. [Google Scholar]
  38. Heflin, C.M. The role of social positioning in observed patterns of material hardship: New evidence from the 2008 survey of income and program participation. Soc. Probl. 2017, 64, 513–531. [Google Scholar] [CrossRef]
  39. Jing, Y.; Zhu, H.G. Sustainable Livelihoods of Residents in State-Owned Forestry Areas—Comparison of Uphill and Downhill Residents. Issues For. Econ. 2011, 31, 61–65+79. [Google Scholar]
  40. Sun, S.; Geng, Y. Livelihood Resilience and Its Influencing Factors of Worker Households in the Face of State-Owned Forest Areas Reform in China. Sustainability 2022, 14, 1328. [Google Scholar] [CrossRef]
  41. Tian, G.S.; Qi, Y.N.; Zou, Y.Y. How does livelihood capital affect dependence on forest ecosystem services?—An empirical study based on the micro data of workers in state-owned forest areas in Northeast China. Sci. Decis. Mak. 2023, 307, 142–158. [Google Scholar]
  42. Zou, Y.Y.; Qi, Y.N.; Zhu, H.G. Analysis on the subjective well-being of employees in state-owned forest areas and its influencing factors under the background of comprehensive logging cessation. Resour. Sci. 2019, 41, 669–680. [Google Scholar]
  43. Zhu, H.G.; Fu, Y.Z.; Zhang, S.P. Research on Labor Employment and Its Family Welfare Effect in Key State-owned Forest Areas. J. Agrofor. Econ. Manag. 2020, 19, 190–199. [Google Scholar]
  44. Hu, Q.X.; Zhu, H.G. Analysis of influencing factors of subjective well-being of residents in state-owned forest areas after comprehensive “logging cessation”. Issues For. Econ. 2019, 39, 286–291. [Google Scholar]
  45. Zhu, H.; Hu, S.; Ren, Y.; Ma, X.; Cao, Y. Determinants of engagement in non-timber forest products (NTFPs) business activities: A study on worker households in the forest areas of Daxinganling and Xiaoxinganling Mountains, northeastern China. For. Policy Econ. 2017, 80, 125–132. [Google Scholar] [CrossRef]
  46. Zhu, H.G.; Jing, Y. Key state-owned forest areas poverty: Measure, characteristics and influencing factors. Chin. Rural Econ. 2013, 337, 76–86. [Google Scholar]
  47. Chen, H.; Cao, J.; Zhu, H.; Wang, Y. Understanding Household Vulnerability and Relative Poverty in Forestry Transition: A Study on Forestry-Worker Families in China’s Greater Khingan Mountains State-Owned Forest Region. Sustainability 2022, 14, 4936. [Google Scholar] [CrossRef]
  48. Zhu, H.G.; Yuan, L.; Ma, G.B. Measurement of Multidimensional Poverty in Key State-owned Forest Areas. Issues For. Econ. 2015, 35, 712. [Google Scholar]
  49. Wang, Y.F.; Li, Z.X. Analysis of Influencing Factors of Poverty Vulnerability of Workers’ Families in State-owned Forest Areas of Heilongjiang Province. Issues For. Econ. 2014, 34, 1–7. [Google Scholar]
  50. Wang, Y.F.; Xu, Y.L.; Zhou, M. Analysis on the Vulnerability of Workers’ Families in Northeast State-owned Forest Areas during the Transition Period. Issues For. Econ. 2017, 37, 14–17+22+98. [Google Scholar]
  51. Whelan, C.T.; Layte, R.; Maître, B. Understanding the mismatch between income poverty and deprivation: A dynamic comparative analysis. Eur. Sociol. Rev. 2004, 20, 287–302. [Google Scholar] [CrossRef]
  52. Marlier, E.; Atkinson, T.; Cantillon, B.; Nolan, B. The EU and social inclusion: Facing the challenges. In The EU and Social Inclusion; Policy Press: Bristol, UK, 2009; pp. 237–246. [Google Scholar] [CrossRef]
  53. Atkinson, A.B. The restoration of welfare economics. Am. Econ. Rev. 2011, 101, 157–161. [Google Scholar] [CrossRef]
  54. Nolan, B.; Whelan, C.T. Using non-monetary deprivation indicators to analyze poverty and social exclusion: Lessons from Europe? J. Policy Anal. Manag. 2010, 29, 305–325. [Google Scholar] [CrossRef]
  55. Anand, P.; Jones, S.; Donoghue, M.; Teitler, J. Non-monetary poverty and deprivation: A capability approach. J. Eur. Soc. Policy 2021, 31, 78–91. [Google Scholar] [CrossRef]
  56. Kumar, S. Does “participation” in common pool resource management help the poor? A social cost–benefit analysis of joint forest management in Jharkhand, India. World Dev. 2002, 30, 763–782. [Google Scholar] [CrossRef]
  57. Alix-Garcia, J.; Wolff, H. Payment for ecosystem services from forests. Annu. Rev. Resour. Econ. 2014, 6, 361–380. [Google Scholar] [CrossRef]
  58. Ferraro, P.J.; Simorangkir, R. Conditional cash transfers to alleviate poverty also reduced deforestation in Indonesia. Sci. Adv. 2020, 6, eaaz1298. [Google Scholar] [CrossRef]
  59. Zhu, H.; Zhang, Y.; Chen, Y.; Zhao, M.; Bo, C. Constructing a Model of Government Purchasing of Ecological Services: Evidence from China’s Northeast Tiger and Leopard National Park. Land 2022, 11, 1737. [Google Scholar] [CrossRef]
  60. Brown, D. Principles and Practice of Forest Co-Management: Evidence from West-Central Africa; Overseas Development Institute (ODI): London, UK, 1999; p. 33. [Google Scholar]
  61. Sundar, N. Is devolution democratization? World Dev. 2001, 29, 2007–2023. [Google Scholar] [CrossRef]
  62. Shackleton, S.; Campbell, B.; Wollenberg, E.; Edmunds, D. Devolution and community-based natural resource management: Creating space for local people to participate and benefit. Nat. Resour. Perspect. 2002, 76, 1–6. [Google Scholar]
  63. Zhang, P.; Shao, G.; Zhao, G.; Le Master, D.C.; Parker, G.R.; Dunning, J.B., Jr.; Li, Q. China’s forest policy for the 21st century. Science 2000, 288, 2135–2136. [Google Scholar] [CrossRef]
  64. National Forestry and Grassland Administration Website. Measures for the Examination and Identification of Forest Management Plans in Key State-owned Forest Areas of Northeast Inner Mongolia (Trial). Available online: https://www.forestry.gov.cn/main/5925/20200414/090421645988928.html (accessed on 15 May 2023).
  65. Bray, D.B.; Merino-Pérez, L.; Negreros-Castillo, P.; Segura-Warnholtz, G.; Torres-Rojo, J.M.; Vester, H.F. Mexico’s community-managed forests as a global model for sustainable landscapes. Conserv. Biol. 2003, 17, 672–677. [Google Scholar] [CrossRef]
  66. Kumar, P.; Kant, S. Revealed social preferences and joint forest management outcomes. For. Policy Econ. 2016, 72, 37–45. [Google Scholar] [CrossRef]
  67. Xu, J.T.; Tao, R.; Wei, J.G. Information asymmetry, sharing contracts and over-quota harvesting: Theoretical analysis and empirical investigation on the changes of China’s state-owned forest resources. Econ. Res. J. 2004, 3, 37–46. [Google Scholar]
  68. Cao, Y.K.; Li, M.Y.; Li, D.X. Research on the reform of state-owned forests in Heilongjiang and its impact on natural protection projects. Issues For. Econ. 2020, 40, 225–235. [Google Scholar]
  69. Geng, Y.D.; Wan, Z.F.; Li, W. State-owned Forestry Reform Progress and Policy Research: Taking Longjiang Forest Industry Group and Daxinganling Forestry Group as Examples. For. Econ. 2017, 39, 3–11. [Google Scholar]
  70. Dahl, G.B.; Kostøl, A.R.; Mogstad, M. Family welfare cultures. Q. J. Econ. 2014, 129, 1711–1752. [Google Scholar] [CrossRef]
  71. Kandel, P.; Pandit, R.; White, B.; Polyakov, M. Do protected areas increase household income? Evidence from a Meta-Analysis. World Dev. 2022, 159, 106024. [Google Scholar] [CrossRef]
  72. Chipman, J.S.; Moore, J.C. The new welfare economics 1939–1974. Int. Econ. Rev. 1978, 19, 547–584. [Google Scholar] [CrossRef]
  73. Pigou, A. The Economics of Welfare; Routledge: London, UK, 2017. [Google Scholar]
  74. Runciman, W.G. Relative Deprivation and Social Justice: A Study of Attitudes to Social Inequality in Twentieth-Century England; Routledge: London, UK, 1966. [Google Scholar]
  75. Callan, T.; Nolan, B.; Whelan, C.T. Resources, deprivation and the measurement of poverty. J. Soc. Policy 1993, 22, 141–172. [Google Scholar] [CrossRef]
  76. Mayer, S.E.; Jencks, C. Poverty and the distribution of material hardship. J. Hum. Resour. 1989, 24, 88–114. [Google Scholar] [CrossRef]
  77. Whelan, C.T.; Maître, B. Vulnerability and multiple deprivation perspectives on economic exclusion in Europe: A latent class analysis. Eur. Soc. 2005, 7, 423–450. [Google Scholar] [CrossRef]
  78. Guio, A.C.; Fusco, A.; Marlier, E. An EU approach to Material Deprivation EU-SILC and Eurobarometer data. In IRISS Working Paper; CEPS/INSTEAD: Luxembourg, 2009; No. 2009-19. [Google Scholar]
  79. Marlier, E.; Natali, D. Europe 2020: Towards a More Social EU? P.I.E Peter Lang: Ixelles, Belgium, 2010. [Google Scholar]
  80. Nelson, K. Counteracting material deprivation: The role of social assistance in Europe. J. Eur. Soc. Policy 2012, 22, 148–163. [Google Scholar] [CrossRef]
  81. Bowley, A.L. The Nature and Purpose of the Measurement of Social Phenomena; P.S. King and Son: London, UK, 1923. [Google Scholar]
  82. Foster, J.E. Absolute versus relative poverty. Am. Econ. Rev. 1998, 88, 335–341. [Google Scholar] [CrossRef]
  83. Chen, S.; Ravallion, M. The developing world is poorer than we thought, but no less successful in the fight against poverty. Q. J. Econ. 2010, 125, 1577–1625. [Google Scholar] [CrossRef]
  84. Mehdi, T. Poverty comparisons with common relative poverty lines. Commun. Stat. Theory Methods 2017, 46, 2029–2036. [Google Scholar] [CrossRef]
  85. Mack, J.; Lansley, S. Poor Britain; George Allen & Unwin Ltd.: London, UK, 1985. [Google Scholar]
  86. Lusardi, A. On the importance of the precautionary saving motive. Am. Econ. Rev. 1998, 88, 449–453. [Google Scholar] [CrossRef]
  87. Skinner, J. Risky income, life cycle consumption, and precautionary savings. J. Monet. Econ. 1988, 22, 237–255. [Google Scholar] [CrossRef]
  88. Stiglitz, J.E.; Sen, A.; Fitoussi, J.P. Report by the Commission on the Measurement of Economic Performance and Social Progress; Commission on the Measurement of Economic Performance and Social Progress: Paris, France, 2009. [Google Scholar]
  89. Layte, R.; Maître, B.; Nolan, B.; Whelan, C.T. Persistent and consistent poverty: An analysis of the first two waves of the ECHP. Rev. Income Wealth 2001, 47, 357–372. [Google Scholar]
  90. Förster, M.F. The European social space revisited: Comparing poverty in the enlarged European Union. J. Comp. Policy Anal. Res. Pract. 2005, 7, 29–48. [Google Scholar] [CrossRef]
  91. Rahman Khan, S. The sociology of elites. Annu. Rev. Sociol. 2012, 38, 361–377. [Google Scholar] [CrossRef]
  92. Hunt, E.L. The Rise and Fall of Elites: Application of Theoretical Sociology; Routledge: London, UK, 2017. [Google Scholar]
  93. Davis, K.; Moore, W.E. Some principles of stratification. Am. Sociol. Rev. 1945, 10, 242–249. [Google Scholar] [CrossRef]
  94. Porter, J. Social Stratification: A Comparative Analysis of Structure and Process. By Bernard Barber. New York: Harcourt, Brace and Company [Toronto: WJ Gage and Company Limited]. 1957. Pp. xx, 540. $6.50. Can. J. Econ. Political Sci. Rev. Can. Econ. Sci. Polit. 1959, 25, 86–87. [Google Scholar] [CrossRef]
  95. Avent-Holt, D.; Henriksen, L.F.; Hägglund, A.E.; Jung, J.; Kodama, N.; Melzer, S.M.; Tomaskovic-Devey, D. Occupations, workplaces or jobs?: An exploration of stratification contexts using administrative data. Res. Soc. Stratif. Mobil. 2020, 70, 100456. [Google Scholar] [CrossRef]
  96. Grusky, D.B. The past, present, and future of social inequality. In Social Stratification; Routledge: London, UK, 2019; pp. 3–51. [Google Scholar]
  97. Jin, H.; Tian, Z.W.; Ren, H.Q. Conception of “Two Dangers” in State-owned Forest Region and Its Hierarchical Management. J. Beijing For. Univ. 1991, 82–88. [Google Scholar]
  98. Qiao, J.; Nie, H. and Lu, Y. Comprehensive “Two Crisis” in State Forestry Enterprise; Northeast Forestry University Press: Changchun, China, 1993. [Google Scholar]
  99. SFA (State Forestry Administration of China). China Forestry Development Report; China Forestry Publishing House Press: Beijing, China, 1997. [Google Scholar]
  100. Cao, Y.K. Management and Protection of State-Owned Forests and Reform and Development of State-Owned Forestry Enterprises; China Forestry Publishing House Press: Beijing, China, 2000. [Google Scholar]
  101. Whelan, C.T.; Maître, B. Understanding material deprivation: A comparative European analysis. Res. Soc. Stratif. Mobil. 2012, 30, 489–503. [Google Scholar] [CrossRef]
  102. Saunders, P.; Tang, V.M.Y. Adult and child deprivation in Hong Kong. Soc. Policy Adm. 2019, 53, 820–834. [Google Scholar] [CrossRef]
  103. Rodems, R.; Pfeffer, F.T. Avoiding material hardship: The buffer function of wealth. J. Eur. Soc. Policy 2021, 31, 517–532. [Google Scholar] [CrossRef]
  104. Guio, A.C.; Marlier, E.; Gordon, D.; Fahmy, E.; Nandy, S.; Pomati, M. Improving the measurement of material deprivation at the European Union level. J. Eur. Soc. Policy 2016, 26, 219–333. [Google Scholar] [CrossRef]
  105. Alkire, S.; Foster, J. Counting and multidimensional poverty measurement. J. Public Econ. 2011, 95, 476–487. [Google Scholar] [CrossRef]
  106. Ravallion, M. The Economics of Poverty: History, Measurement, and Policy; Oxford University Press: Oxford, UK, 2015. [Google Scholar]
  107. Lu, Y.L. China’s Household Registration System after 1949: Structure and Changes. J. Peking Univ. Philos. Soc. Sci. 2002, 2, 123–130. [Google Scholar]
  108. Du, Y.; Cai, F.; Qu, X.B. Continuing the Chinese Miracle: Harvesting Dividends from the Reform of the Household Registration System. Econ. Res. J. 2014, 49, 4–78. [Google Scholar]
  109. Shen, Y.Y.; Li, S. How to determine the relatively poverty standards?—Also discuss the feasible solution of “urban and rural coordination” relatively poor. J. S. China Norm. Univ. Soc. Sci. Ed. 2020, 2, 91–191. [Google Scholar]
  110. OECD. Society at a Glance 2019: OECD Social Indicators; OECD Publishing: Paris, France, 2019. [Google Scholar] [CrossRef]
  111. Eurostat. At Risk of Poverty Rate. Available online: https://ec.europa.eu/eurostat/web/products-datasets/-/tespm010: (accessed on 10 February 2023).
  112. Goulden, C. UK Poverty 2019/20. Available online: https://www.jrf.org.uk/report/uk-poverty-2019-20 (accessed on 15 February 2023).
  113. National Bureau of Statistics. Residential Income and Consumption Expenditure in 2020. Available online: http://www.stats.gov.cn/xxgk/sjfb/zxfb2020/202101/t20210118_1812464.html (accessed on 18 January 2021).
  114. Pacifico, D.; Poege, F. Estimating measures of multidimensional poverty with Stata. Stata J. 2017, 17, 687–703. [Google Scholar] [CrossRef]
  115. Ali, O.; Darity, W.A., Jr.; Janz, A.; Sánchez, M. The Association between Wealth Inequality and Socioeconomic Outcomes. In AEA Papers and Proceedings; American Economic Association: Pittsburgh, PA, USA, 2021; Volume 111, pp. 211–215. [Google Scholar] [CrossRef]
  116. Fortmann, L.; Kusel, J. Well-Being in Forest Dependent Communities; A report prepared for the California Department of Forestry and Fire Protection: Sacramento, CA, USA, 1991. [Google Scholar]
  117. Newton, P.; Miller, D.C.; Byenkya, M.A.A.; Agrawal, A. Who are forest-dependent people? A taxo nomy to aid livelihood and land use decision-making in forested regions. Land Use Policy 2016, 57, 388–395. [Google Scholar] [CrossRef]
  118. Treiman, D.J. Industrialization and social stratification. Sociol. Inq. 1970, 40, 207–234. [Google Scholar] [CrossRef]
  119. Fusco, A.; Guio, A.C.; Marlier, E. Characterising the income poor and the materially deprived in European countries. Income Living Cond. Eur. 2010, 133–153. [Google Scholar]
  120. Gordon, D. The scientific measurement of poverty: Recent theoretical advances. In Researching Poverty; Routledge: London, UK, 2019; pp. 37–58. [Google Scholar]
  121. Halleröd, B.; Larsson, D.; Gordon, D.; Ritakallio, V.M. Relative deprivation: A comparative analysis of Britain, Finland and Sweden. J. Eur. Soc. Policy 2006, 16, 328–345. [Google Scholar] [CrossRef]
  122. Zhu, H.G.; Cao, B. Practical judgments, key issues and key points for cracking down on state-owned forest regions in Northeast China. Issues For. Econ. 2022, 42, 569–577. [Google Scholar]
  123. Hardin, G. The tragedy of the commons: The population problem has no technical solution; it requires a fundamental extension in morality. Science 1968, 162, 1243–1248. [Google Scholar] [CrossRef]
  124. Beyene, A.D.; Bluffstone, R.; Mekonnen, A. Community forests, carbon sequestration and REDD+: Evidence from Ethiopia. Environ. Dev. Econ. 2016, 21, 249–272. [Google Scholar] [CrossRef]
  125. Rustagi, D.; Engel, S.; Kosfeld, M. Conditional cooperation and costly monitoring explain success in forest commons management. Science 2010, 330, 961–965. [Google Scholar] [CrossRef] [PubMed]
  126. Bluffstone, R.; Dannenberg, A.; Martinsson, P.; Jha, P.; Bista, R. Cooperative behavior and common pool resources: Experimental evidence from community forest user groups in Nepal. World Dev. 2020, 129, 104889. [Google Scholar] [CrossRef]
  127. Nerfa, L.; Rhemtulla, J.M.; Zerriffi, H. Forest dependence is more than forest income: Development of a new index of forest product collection and livelihood resources. World Dev. 2020, 125, 104689. [Google Scholar] [CrossRef]
  128. Perry, B. The mismatch between income measures and direct outcome measures of poverty. Soc. Policy J. N. Z. 2002, 9, 101–127. [Google Scholar]
  129. Whelan, C.T.; Layte, R.; Maître, B. Persistent income poverty and deprivation in the European Union: An analysis of the first three waves of the European Community Household Panel. J. Soc. Policy 2003, 32, 1–18. [Google Scholar] [CrossRef]
  130. Heflin, C.H.; Butler, J.S. Why do women enter and exit from material hardship? J. Fam. Issues 2013, 34, 631–660. [Google Scholar] [CrossRef]
  131. Adhikari, B. Poverty, property rights and collective action: Understanding the distributive aspects of common property resource management. Environ. Dev. Econ. 2005, 10, 7–31. [Google Scholar] [CrossRef]
  132. Gelo, D.; Koch, S.F. The impact of common property right forestry: Evidence from Ethiopian villages. World Dev. 2014, 64, 395–406. [Google Scholar] [CrossRef]
  133. Moktan, M.R.; Norbu, L.; Choden, K. Can community forestry contribute to household income and sustainable forestry practices in rural area? A case study from Tshapey and Zariphensum in Bhutan. For. Policy Econ. 2016, 62, 149–157. [Google Scholar] [CrossRef]
  134. Rawls, J. A Theory of Justice: Revised Edition; Harvard University Press: Cambridge, MA, USA, 2020. [Google Scholar]
  135. Yuan, W.T.; Qiao, D.; Ke, S.F. How to Improve the Ecological Compensation Mechanism from the Perspective of Resource Opportunity Cost—Taking the Welfare Inversion Problem in State-owned Forest Land Compensation as an Example. China Rural Surv. 2022, 164, 59–78. [Google Scholar]
  136. Wang, Y.Z.; Song, Y.; Wu, G.C. Research on Implementation Performance, Problems and Countermeasures of Heilongjiang Natural Protection Project. For. Econ. 2012, 243, 68–71. [Google Scholar]
  137. Qiao, D.; Yuan, W.T.; Li, H.X. The Formation and Breakdown of Multiple Dependent Relationships in Key State-owned Forest Areas—Taking China Jilin Forest Industry Group as an Example. World For. Res. 2022, 35, 99–105. [Google Scholar]
  138. Kahsay, G.A.; Medhin, H. Leader turnover and forest management outcomes: Micro-level evidence from Ethiopia. World Dev. 2020, 127, 104765. [Google Scholar] [CrossRef]
  139. Folke, C.; Hahn, T.; Olsson, P.; Norberg, J. Adaptive governance of social-ecological systems. Annu. Rev. Environ. Resour. 2005, 30, 441–473. [Google Scholar] [CrossRef]
  140. Folke, C. Resilience: The emergence of a perspective for social–ecological systems analyses. Glob. Environ. Chang. 2006, 16, 253–267. [Google Scholar] [CrossRef]
Figure 1. Scope of Implementation of NFPP, the square in the upper right corner of the figure represents the area where NSFR is located.
Forests 14 01140 g001
Figure 2. Cross-over Diagram between Low-income Welfare Group and Low-material Welfare Group.
Forests 14 01140 g002
Table 1. Per capita disposable income and proportion of income sources for forestry community households.
VariableTypeObsMeanStd. Dev.MinMaxRation
ImeanPersonal income127128,178.8810,870.48450072,050100.00
IwangeWage income127123,657.9510,811.75072,00083.96
IoperateOperate income1271866.163504.05050,0003.07
ItransferTransfer income12713354.475937.28040,00011.90
IpropertyProperty income1271300.291167.50018,9201.07
Note: The statistical basis for the income level in the table is the per capita income level of the household, and the unit is CNY/year; Ration represents the proportion of each type of income, and the unit is %.
Table 2. Total and sub-indices of material deprivation index for forestry community households.
VariableMaterial Deprivation Dimension Included IndicatObsMeanStd. Dev.MinMax
mdi_totalin terms of totalindicat1–5312710.2540.1090.0180.646
mdi_domain1 in terms of dietindicat1–512710.0250.0180.0000.100
mdi_domain2in terms of clothingindicat6–912710.0150.0220.0000.080
mdi_domain3in terms of energyindicat10–1212710.0160.0210.0000.090
mdi_domain4in terms of household infrastructureindicat13–2112710.0210.0220.0000.111
mdi_domain5in terms of housing qualityindicat22–2512710.0080.0130.0000.080
mdi_domain6in terms of working environmentindicat26–3512710.0540.0240.0000.121
mdi_domain7in terms of dwelling environmentindicat36–3812710.0110.0170.0000.090
mdi_domain8in terms of health statusindicat39–4212710.0160.0220.0000.080
mdi_domain9in terms of family relationshipsindicat43–4612710.0120.0170.0000.080
mdi_domain10in terms of recreational activityindicat47–4812710.0620.0280.0000.100
mdi_domain11in terms of social relationshipsindicat49–5312710.0430.0220.0000.100
Notes: The sum of weights for indicat1–53 in the table is 1. The specific meanings of each indicator can be found in Appendix B.
Table 3. Size and Proportion of Low-Income Welfare Groups under Different Income Poverty Thresholds.
Income Poverty ThresholdLow-Income Welfare Group
StandardThresholdSizeProportion
Absolute poverty line
Chinese standard400000.00
International standard536620.16
Relative poverty line
40 percent of the median16,15118614.63
50 percent of the median20,18932325.41
60 percent of the median24,22648738.32
Notes: The statistical caliber of Threshold in the table is the household per capita disposable income, the unit is CNY/year; Proportion is calculated as % by dividing the value of Size by 1271 and multiplying by 100.
Table 4. Differences in income level and structure between the low-income welfare group and other groups.
Type of IncomeLow-Income Welfare GroupOther GroupsTotal Population
Income LevelStructural ProportionIncome LevelStructural ProportionIncome LevelStructural Proportion
Personal income15,227.89100.0032,591.50100.0028,178.88100.00
Wage income13,700.4790.1927,050.6483.1623,657.9584.95
Operate income316.762.151053.363.01866.162.79
Transfer income1119.357.084116.0112.763354.4711.32
Property income91.310.58371.501.07300.290.94
Note: The statistical caliber of income level in the table is per capita income; The low-income welfare group refers to the household per capita disposable income less than 50% of the median urban per capita disposable income in China, which is 20,189 CNY/year.
Table 5. The measurement results of each index under different material deprivation threshold k standards.
Material Deprivation Threshold kLow-Material Welfare GroupOther GroupsH IndexA IndexM0 Index
MDI ScoreSizeMDI ScoreSize
1/30.422760.219950.2170.4170.091
(0.012)(0.004)(0.005)
4/90.50830.2411880.0650.5020.033
(0.007)(0.005)(0.004)
1/20.55340.2512370.0270.5510.015
(0.005)(0.007)(0.002)
Note: The standard deviation (std.err.) is presented in parentheses, and M0 = H * A.
Table 6. Contribution and ranking of 11 material deprivation dimensions to the M0 index.
Domain Material Deprivation DimensionContribution to the
M0 Index
Contribution Ranking
domain 1 in terms of diet0.072 7
domain 2 in terms of clothing0.102 4
domain 3 in terms of energy0.084 6
domain 4 in terms of household infrastructure0.071 8
domain 5 in terms of housing quality0.048 11
domain 6 in terms of working environment0.120 3
domain 7 in terms of dwelling environment0.049 10
domain 8 in terms of health environment0.102 4
domain 9 in terms of family relationships0.059 9
domain 10 in terms of recreational activity0.171 1
domain 11 in terms of social relationships0.123 2
Note: The calculation results in the table are based on the material deprivation threshold value K being set to 1/3.
Table 7. Overlap size between low-income welfare group and low-material welfare group.
Other Groups from the Perspective
of Material Welfare
Low-Welfare Group
from the Perspective of Material Welfare
Total
Other groups
from the perspective
of income welfare
771177948
Low-welfare group
from the perspective
of income welfare
22499323
Total9952761271
Table 8. Mean differences between the dual low welfare group and other groups.
SizeIncome LevelConsumption LevelMaterial Deprivation IndexSubjective Satisfaction
The dual low welfare group9914,586.4419,055.220.422.95
Other groups117229,327.0429,672.520.243.38
Total127128,178.8828,845.530.253.35
Note: The statistical basis for income level and consumption level is the per capita level of households in the forestry communities, measured in CNY/year; The subjective satisfaction is measured on a 5-point scale, where 1–5 represent the respondent’s level of dissatisfaction from very dissatisfied, somewhat dissatisfied, neither satisfied nor dissatisfied, somewhat satisfied, to very satisfied, respectively.
Table 9. Grouping results and differences in welfare levels under occupational stratification and geographical stratification standards.
StandardGroupSizeIncome LevelThe Proportion of Low-Income Welfare GroupsMdi
Score
The Proportion of Low-Material Welfare Groups
Occupational stratification
Managers39029,323.6820.510.2210.51
Technicians4729,761.1312.770.2112.77
Forest workers71427,729.5127.870.2726.33
Temporary workers12026,512.3231.670.2934.17
Geographical stratification
Forest farm communities on the mountain20027,062.4227.000.3555.50
Urban communities down the hill107128,387.3725.110.2415.41
Note: The total sample size is 1271; the statistical caliber of income level is per capita level; In the calculation of the proportion of the low welfare group, the income poverty threshold and material deprivation threshold are set at 20,189 CNY/year and 1/3, respectively.
Table 10. Mean differences between the elite group and other groups.
SizeIncome LevelConsumption LevelMaterial Deprivation IndexSubjective Satisfaction
Elite group4429,808.4831,712.440.203.27
Other groups122728,120.4428,742.720.263.35
Total127128,178.8828,845.530.253.35
Disclaimer/Publisher’s Note: The statements, opinions and data contained in all publications are solely those of the individual author(s) and contributor(s) and not of MDPI and/or the editor(s). MDPI and/or the editor(s) disclaim responsibility for any injury to people or property resulting from any ideas, methods, instructions or products referred to in the content.

