Article

An Overview of Extreme Years in Quercus sp. Tree Ring Records from the Northern Moldavian Plateau

1
Forest Biometrics Laboratory—Faculty of Forestry, “Ștefan cel Mare” University of Suceava, Universității Street, no. 13, 720229 Suceava, Romania
2
Paleoclimate Dynamics Group, Alfred Wegener Institute, Helmholtz Center for Polar and Marine Research, 27570 Bremerhaven, Germany
3
Faculty of Agricultural, Forestry and Environmental Sciences, Technical University of Moldova, Str. Mircești 48, MD-2049 Chișinău, Moldova
4
National Research and Development Institute for Silviculture “Marin Drăcea”, Calea Bucovinei no. 76bis, 725100 Câmpulung Moldovenesc, Romania
5
Center for Mountain Economy (CE-MONT), 725700 Vatra Dornei, Romania
*
Author to whom correspondence should be addressed.
Forests 2023, 14(5), 894; https://doi.org/10.3390/f14050894
Submission received: 27 February 2023 / Revised: 13 April 2023 / Accepted: 23 April 2023 / Published: 26 April 2023

Abstract

:
In this study, we made use of a regional oak tree-ring network from six stands that cover the northern Moldavian Plateau (eastern Europe) to analyze how different tree ring parameters (i.e., early wood tree-ring width, late wood tree-ring width, and total tree-ring width) of Quercus sp. are influenced by the occurrence of extreme climatic events (e.g., long-lasting drought events). In order to explore the influence of extreme hydroclimatic events on tree ring width, we have selected each of the six most extreme positive and negative years of tree growth and addressed the seasonal cycle of tree growth in comparison with the main climatic parameters, then evaluated both the current and lagged consequences of extreme hydroclimatic events on tree ring width and the capacity of trees to recover. Our results indicate that the variability of oak tree ring width from the Moldavian Plateau is mainly influenced by the availability of water resources, and that an important limiting growth factor for Quercus sp. is the occurrence of long-lasting drought events, e.g., at least two years in a row with severe drought conditions.

1. Introduction

Extreme climatic events (e.g., droughts, heatwaves, floods) have a strong impact on different sectors including society, biodiversity, the economy, the environment, forestry, water management, and agriculture [1,2,3,4]. Forest ecosystems are directly affected by the variability of major climatic parameters (e.g., temperature, precipitation, radiation) via their impact on the tree’s physiological processes, for example, photosynthesis and water transport [5]. Thus, extreme climatic events can cause severe damage to trees in the form of forest fires, drastic reduction in tree growth rates, dieback events, and even tree mortality [5,6,7,8]. Numerous studies have reported a significant decline in the growth of oak trees during severe drought conditions or extreme climatic events [9,10,11,12,13].
Trees respond to climatic conditions through variations in tree ring parameters (e.g., tree ring width, maximum wood density, and stable isotopic composition in tree ring cellulose, among others) [14,15]. The variations in tree ring width represent an efficient indicator that can quantify the influence of climate (including drought conditions and climatic extreme events) on the growth of trees [11,16]. Extreme climatic events (e.g., droughts, heatwaves, floods) have a strong impact (e.g., via significant changes in resource availability) on tree growth in the year of the extreme climatic event, as well as during the post-event recovery time. The overall availability of water resources is recorded by the sequence of wider or narrower tree ring width [16,17]. Additionally, during extreme drought conditions, trees become more vulnerable to pathogen attacks, forest fires, and insect outbreaks [18].
Recent studies have shown that as a consequence of the ongoing climate change we are facing an increase in mean global/regional temperatures, changes in precipitation patterns, and more frequent and more intense extreme climatic events [3,19,20,21], including over Romania [22,23], where our tree ring network is located. The observed record-breaking heat waves, droughts, and floods over the last several years have cost hundreds of millions of Euros in damage and have led to significant impacts at the social, economic, and ecological levels [4,24,25,26]. Moreover, climate models predict that temperature will continue to increase in the next decades, and that the associated climatic extreme events will increase in both frequency and intensity [21,27], causing even greater socio-economic and ecological damages. Therefore, it is expected that the associated risks and impacts of climate change will increase significantly in the coming years and even decades.
Considering the economic and ecological importance of forests, a better understanding of the relationship between the variability of tree ring width and extreme climatic events is essential for ensuring reliable provisioning of forest ecosystem services in the face of climate change [24]. The recent extreme drought events which have affected large parts of Europe over the last decade [3,20,28,29] have allow for investigation of the short-term consequences of extreme drought on tree growth in temperate European forests [18,24,30]; however, such studies are limited for the eastern part of Europe. Furthermore, it is of great interest to study the potential impact of extreme climatic events on forestry (especially tree growth) and related services for human societies in order to help mitigate negative effects.
Here, we employ a regional oak tree ring network from six stands covering the northern Moldavian Plateau (eastern Europe) to present an overview of how tree ring width is affected by extreme hydroclimatic events, with a special focus on long-lasting droughts. The aim of this paper are: (i) to analyze the climate–growth relationship between different parameters of tree rings of Quercus sp. from the northern Moldavian Plateau (the northeastern part of Romania and the northern part of the Republic of Moldova) along with the main climatic parameters; (ii) to investigate how the tree ring network reflects the spatial extent of extreme climatic events and climatic extremes over the analyzed region; (iii) to address the seasonal cycle of tree growth variability during the most extreme years; and (iv) to evaluate both the immediate and lagged consequences of extreme climatic events on tree growth and on their capacity to recover.

2. Materials and Methods

2.1. Study Area

The study area is located in the northern part of the Moldavian Plateau, which is situated in the northeastern part of Romania and the northern part of the Republic of Moldova (Figure 1). The northern Moldavian Plateau is characterized by a series of alternating ridges, depression, and asymmetric valleys [31]. The highest elevations (~700 m.a.s.l.) are situated in the northwestern part of the plateau, decreasing towards the eastern and southern parts of the plateau to levels around 200 m.a.s.l. The climate is temperate-continental, with cold winters and warm summers [32]. The monthly mean temperature ranges from −2.2 °C (in January) to +21.8 °C (in July) [32,33], while the annual precipitation sum is on average 520 mm, with a minimum in January (~26 mm) and a maximum in June (~76 mm) [32,33].

2.2. Chronology Development

From six oak stands placed in Northeastern Romania and the Republic of Moldova, we took 155 samples (from 17 to 30 cores per site) from dominant and healthy trees with a Pressler borer, taking one core per tree at breast height (1.30 m) (Figure 1, Table 1).
Sampling site selection was in agreement with our research objectives, choosing the oldest and most representative oak stands in the region (more than 100 years old and without regeneration cuttings) while covering different environmental conditions. The increment cores were kept in plastic containers with special slots for ventilation, and were processed and measured at the Forest Biometrics Laboratory (biometrie.usv.ro, accessed on 27 February 2023). After drying, surface preparation was performed by cutting a flat surface with a WSL core-microtome [34] to enhance the tree-ring borders. Further, the cores were digitalized using an Epson 11000 XL flatbed scanner (Epson Inc, Long Beach, CA, USA) and Silverfast v.8.1 with a true resolution of 2400 dpi, and saved as an image in 48-bit color format. The resulting images were opened in CooRecorder v. 9.3.1 [35], where we measured the tree ring widths (TRW) as well as the seasonal wood width for both early wood (TREW) and late wood (TRLW) with respect to the IAWA classifications [36]. The measurement quality was checked by individual cross-dating using TSAPwin v. 4.8 [37] and statistically verified with COFECHA using correlation analysis of 50-year intervals with 25-year overlaps [38].
To remove non-climate-induced trends, the individual series were detrended using a cubic smoothing spline with a 50% frequency cut-off at 30 years in the dplR library [38] to maintain the high-frequency signal [39]. The tree ring indices (standard chronology) were computed as the ratio between the raw and detrended functions, and the mean site chronology was obtained using the bi-weighted mean [40]. The chronology strength was assessed with the expressed population signal (EPS) parameter and the inter-series correlation (rbar) using a 50-year window lagged by 25 years [41] for the entire period of each chronology. Moreover, standard dendrochronological statistics such as mean sensitivity (MS), first-order autocorrelation (AC1), and signal-to-noise ratio (SNR) were computed for each site and master chronology.

2.3. Climate Data

The climate–growth relationship was analyzed using four climate variables, namely, monthly precipitation totals (PP), minimum air temperature (Tmin), mean air temperature (Tmean), and maximum air temperature (Tmax), based on the CRU TS 4.06 gridded database [33]. The CRU TS 4.06 dataset has a spatial resolution of 0.5° × 0.5° and covers the period 1901–2019. Because tree growth is strongly affected by the availability of water [42,43] the climate–growth relationship was analyzed with respect to the prevailing drought conditions. For this purpose, in the current study we make use of the Standardized Precipitation and Evapotranspiration Index (SPEI) [44] calculated for different accumulation periods, namely, one month (SPEI1), three months (SPEI3), six month (SPEI6), nine months (SPEI9), and twelve months (SPEI12). The use of multiple accumulation periods was motivated by the fact that we wanted to test the influence of the previous months’ water availability on the measured tree ring parameters of TREW, TRLW, and TRW. SPEI was computed using the monthly precipitation totals (PP) and the potential evapotranspiration (PET) extracted from the aforementioned CRU T.S. 4.06 dataset [33].

2.4. Statistical Analyses

In order to extract the common signal in our six chronologies, we applied an empirical orthogonal function (EOF) analysis [45] for each of the tree-ring parameters (TREW, TRLW, and TRW). EOF analysis seeks structures that explain the maximum amount of variance in a two-dimensional dataset. The EOF technique aims at finding a new set of variables that capture most of the observed variance from the data through a linear combination of the original variables. EOF analysis provides a convenient method for studying the spatial and temporal variability of multiple time series or gridded data. The result of the analysis is a set of first-dimensional structures that are referred to as EOFs, and which are considered to be structured in the spatial dimension. Principal Components (PCs) are the complementary set of structures in the sampling dimension (for example, time) that are directly related to the EOFs. In their own dimension, both sets of structures are orthogonal.
In order to analyze the climate variability during extreme growth years, the six most extreme positive and negative years were selected for each tree ring parameter index. The temporal evolution of the seasonal cycle of the climate parameters during the selected extreme growth years was compared with a standard climatological reference period (e.g., 1971–2000). If the difference is higher or lower than 0.75 standard deviations (SD), then the climate parameter has a significant influence on tree growth. We chose a 0.75 SD as a compromise in order to have sufficient degrees of freedom to compute the statistical significance and to disregard those years which were not extreme.
The relationship between the main climatic parameters and oak tree ring growth was examined using Superposed Epoch Analysis (SEA) [46]. We used this approach to statistically examine the significance of the mean response of oak trees’ growth to extreme climatic events. We tested whether the precipitation amount, maximum temperature, and long term-drought conditions had a significant influence on tree ring width during the five years prior to and after the selected extreme years.

3. Results and Discussion

3.1. Chronology Characteristics

Six individual early wood (TREW), late wood (TRLW), and total tree ring width (TRW) chronologies were developed for the Northern Moldavian Plateau (Table 2). The mean oak age ranged from 95 years (RUDI) to 189 years (TUDO), with a maximum of 218 years (TUDO), covering the period 1802–2019. In terms of growth performance, the oak growth rate had a mean of 2.33 ± 0.51 mm·year−1 and varied from 1.65 mm·year−1 (TUDO) to 3.03 mm·year−1 (PADM). The TREW represented ~37% of TRW, namely, 0.87 ± 0.51 mm·year−1, while the TRLW growth rate was 1.45 ± 0.38 mm·year−1. The previous-year environmental conditions exhibited a significant influence on oak growth for all sites and all tree-ring parameters, as indicated by the high and significant values of AC1. Year-by-year growth variation, as expressed by the mean sensitivity (MS), was higher for TRLW (0.21) and lower for TREW (0.08), and no significant differences were found between sites. Correlation with the master chronology showed strong coherence for the TRW and TRLW components and increased variability for TREW for all sites. The mean chronology statistical parameters (rbar, EPS, and SNR) revealed a distinct and robust signal strength, with obvious differences noticeable between the different tree-ring components. The TRLW and TRW components showed higher internal coherence, implying a similar climatic control for these parameters, while the TREW chronologies showed higher variability.
For oak growing on continental sites, the accumulation rates are relatively similar to those under optimal and limiting conditions [42,47,48,49,50], which demonstrates the high ecological plasticity of this species [47,51,52,53]. Nevertheless, our results indicate that local climatic conditions can induce growth limitation in oak [42]. In addition, human activities such as harvesting and thinning, insect outbreaks, and pollution can negatively modify accumulation rates, thereby dimming the recorded climate signal [54]. Briefly, both our individual and seasonal chronologies are in line with previous studies, which have shown that TRLW and TREW record different climatic signals [42,47,48,54,55].
The common signal in the six analyzed chronologies was extracted by applying an empirical orthogonal function (EOF) analysis [45] in order to analyze how tree ring width is affected by climatic extreme events in the northern Moldavian Plateau (the northeastern part of Romania and the northern part of the Republic of Moldova). Moreover, further analyses were made using the output from the EOF analysis. The obtained time series (PCs) are presented in Figure 2. The first EOF pattern (EOF1, Table 3) explains 46.96%/44.79%/48.23% of the total variance for TRLW/TREW/TRW, respectively. The high values of the explained variance (in the case of EOF1) and the monopolar structure (the same loadings for all six site locations) indicate that more than 45% of the common variability in our network is driven by the same factors, e.g., regional and/or large-scale climatic factors. The dipole-like structure, with three sites having positive loadings (e.g., the ones located on the Romanian side of the network) and thee having negative loadings (e.g., the three sites located on the Moldavian side of the network) is captured by EOF2 (Table 3), and indicates that ~15% of the network variability is driven by different local factors (e.g., orography, water availability).
The temporal evolution (PC1) associated with EOF1 (Figure 2) indicates that the most extreme positive TREW years were 1914, 1938, 1948, 1980, 1997, and 2014, while the most extreme negative ones were 1920, 1925, 1934, 1971, 1979, and 2016. For TRLW and TRW, the most extreme positive years were 1909, 1962, 1965, 1985, 1997, and 2013, while the most extreme negative ones were 1915, 1946, 1968, 1972, 1983, and 2004 (Table 4).

3.2. General Climate–Growth Relationship

Quercus sp. species have been widely used in dendroclimatological studies due to their natural distributions and strong climate–growth relationships [42,43,50]. In the current study, the climate–growth relationship was tested between all three tree-ring width components (early wood tree-ring width (TREW), late wood tree-ring width (TRLW), and total tree-ring width (TRW)) and different climatic parameters. The significance of the obtained correlations was tested using Student’s t-test. All obtained results are presented in Figure 3, Figure 4 and Figure 5.
The highest correlations for TREW were obtained for July SPEI9 (r = 0.35). Significant correlations with precipitation were obtained only for current May (r = 0.20), AMJ (r = 0.25), and MJJ (r = 0.26), while no significant correlations with temperature were obtained. Correlations with the SPEI increased from shorter periods of accumulation (e.g., one month) to longer periods of accumulation (e.g., nine months), i.e., for July SPEI1 r = 0.21, for May SPEI3 r = 0.26, for May SPEI6, and for July SPEI6 r = 0.30. For July SPEI9 r = 0.35, suggesting that the oak tree species are more sensitive to longer-lasting droughts.
The obtained correlations between the climate variables and TRLW are much stronger compared to those for TREW. TRLW is significantly correlated with current June precipitation (r = 0.42) and maximum and mean June temperature (r = −0.29 and r = −0.25, respectively). The highest correlation coefficients with the SPEI drought index were obtained for June and July months for all analyzed combinations of the accumulated periods, with the maximum found for the July SPEI12 (r = 0.52).
The correlation analysis between the climate indicators and TRW shows a similar pattern in terms of the values of the correlation coefficients, as in the case of TRLW, although in general the correlation coefficients tend to be higher overall. For example, the highest correlation coefficient was obtained with July SPEI12 (r = 0.57). Therefore, in our subsequent analyses, the TRLW and TRW are discussed together. Similar to the TREW, the highest correlations of TRLW and TRW with the SPEI drought index were obtained for the longest accumulation period (i.e., SPEI12), indicating the importance of long-term climate variability on oak tree growth.
We performed the same analysis with the Standardized Precipitation Index (SPI) drought index. Compared to SPEI, which takes into account both precipitation and evapotranspiration, and therefore the temperature, SPI takes into account only the accumulated precipitation. Because the temperature does not play an important role in the climate–growth relationship (i.e., Figure 3, Figure 4 and Figure 5), the results obtained with the SPI drought index are similar to those obtained in the case of SPEI (Tables S1–S3). Our obtained results are in accordance with previously published papers [42,56].

3.3. Spatial Correlations

Because the highest correlations for early (late) wood were obtained for SPEI12, we looked at the composite maps for those years with extreme values for TREW and TRLW (Table 4) with respect to the spatial variability of July SPEI12 (Figure 6). As can be inferred from Figure 6, the response of negative TREW years is very regional, and is usually associated with drought conditions over the analyzed region as well as in the northeastern part of Romania (i.e., Ukraine and a small part of Poland; see Figure 6a). Positive TREW years are associated with wet conditions extending over the central and eastern parts of Europe (Figure 6b). Conversely, negative TRLW values are associated with drought conditions extending over large parts of Europe, with the strongest signal over Romania (Figure 6c). Positive TRLW years are associated with wet conditions restricted mainly to the analyzed region and a few areas in Ukraine, Poland, and western Russia (Figure 6d). Based on the obtained results presented in Figure 6, we can conclude that TREW seems more sensitive to wet years, while TRLW is more sensitive to drought, both locally and over an extended spatial scale.

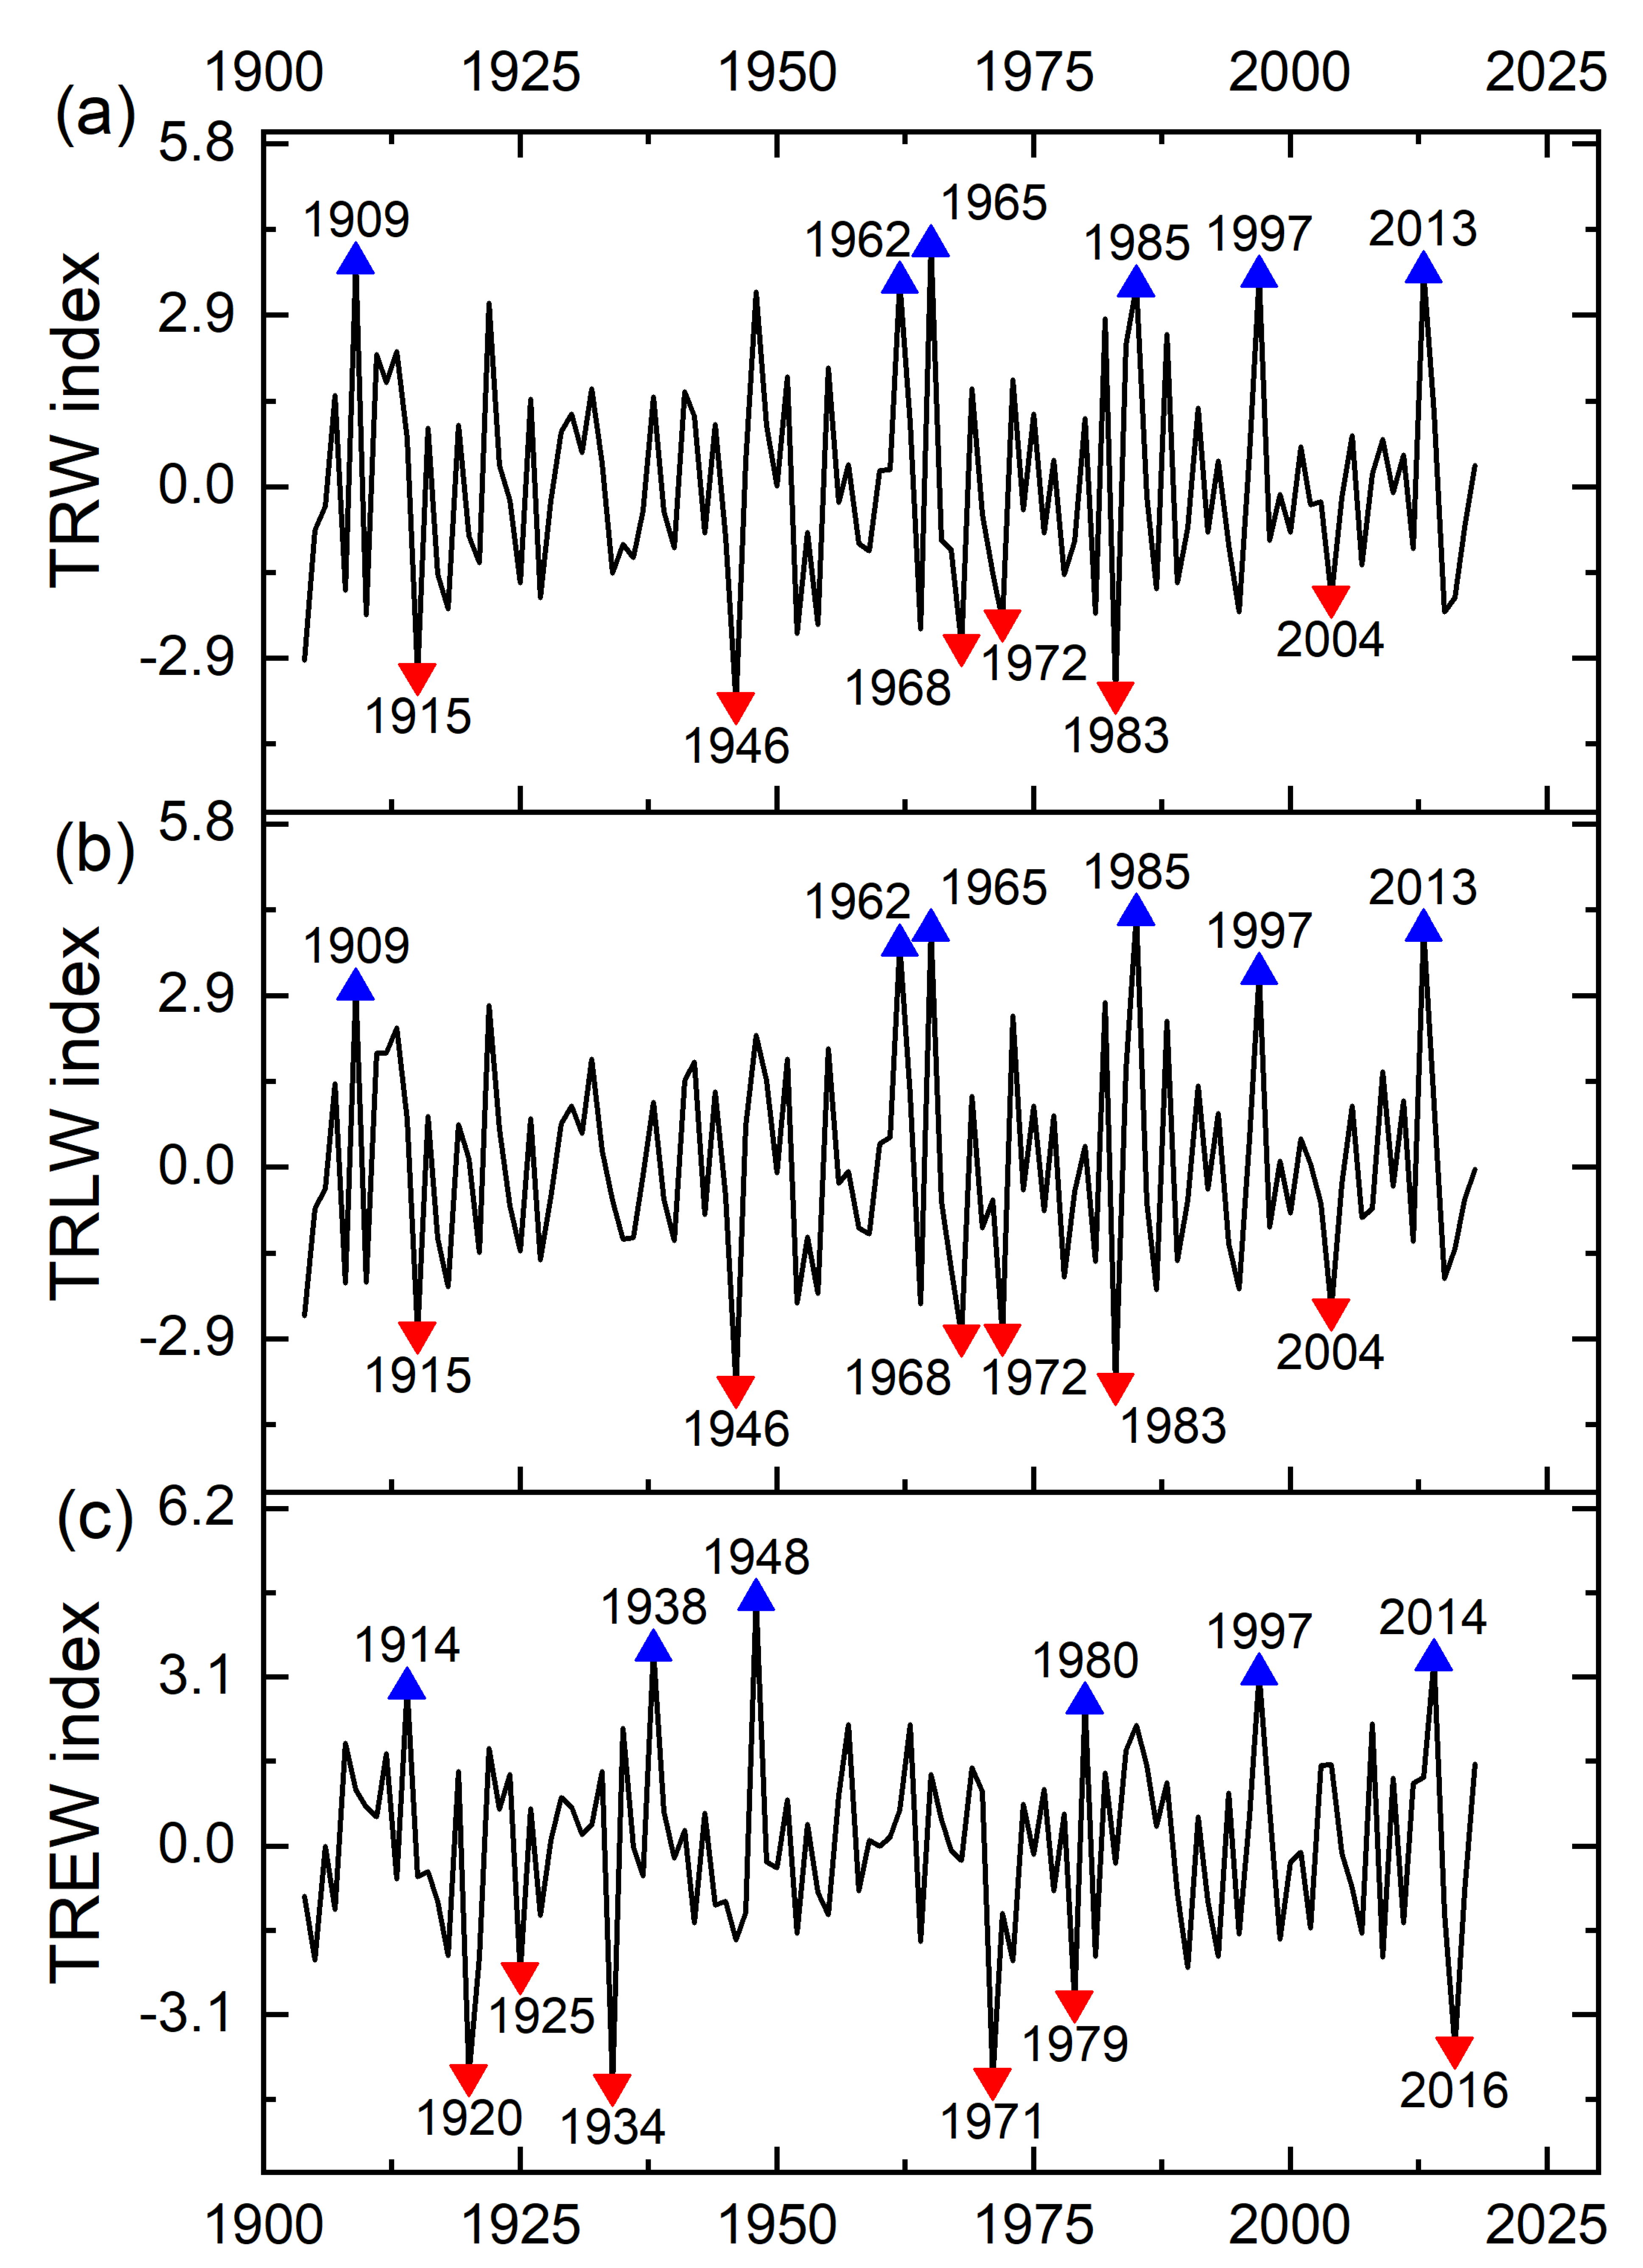
3.4. Extreme Years in Quercus sp. Tree Ring Records

3.4.1. Early Wood Tree Ring Width

The comparison between extreme values of the tree ring width components and the seasonal cycle of maximum temperature, precipitation, and SPEI for the period 1901–2019 shows several interesting patterns. The most extreme six positive and negative years were selected (Table 4) and used to calculate the seasonal cycle of the maximum temperature and precipitation as well as the SPEI1, SPEI3, SPEI6, SPEI9, and SPEI12 for these particular years. The variability of the maximum temperature in the selected extreme TREW years fits within 0.75 standard deviations (SD) of the climatological range, indicating that the maximum temperature does not have a significant influence on TREW growth (Figure 7a). The seasonal variability of the precipitation (Figure 7b) shows that a high amount of precipitation in May and July and a low amount of precipitation in April significantly influences TREW growth.
The seasonal variability of the drought index presents different results for extremely positive and negative years, as well as for different accumulation periods of SPEI. The high values of the previous year’s August SPEI1 and very low values of February SPEI1 have a significant influence on the positive TREW years. During extremely negative TREW years, the April and May SPEI1 both register low values (Figure 8a). Very low values of the previous year’s June and July SPEI3 have significant influence on the extremely high TREW values, and low values of April, May, and June SPEI3 have significant influence on the extremely low TREW values (Figure 8b). The temporal variability of SPEI6 is similar to that of SPEI3, namely, very low values of the previous year’s July SPEI3 significantly influence the extremely high TREW values, while low values of May to September SPEI6 have significant influence on the extremely low TREW values (Figure 8c). The temporal variability of SPEI9 and SPEI12 for the extreme positive TREW years fits within 0.75 SD of the climatological range, while for the extreme negative TREW years SPEI9 presents very low values from August to December, as does SPEI12 from May to October (Figure 8d,e).

3.4.2. Late Wood Tree Ring Width and Total Tree Ring Width

The analysis of extreme pointer years for late wood tree-ring width (TRLW) and total tree-ring width (TRW) were made together, as both chronologies have the same extreme pointer years (Table 4). As in the case of early wood tree-ring width, all analyses were performed for the maximum temperature, precipitation, SPEI1, SPEI3, SPEI6, SPEI9, and SPEI12. The seasonal variability of the maximum temperature (Figure 9a) shows that positive maximum temperatures in April and June and negative maximum temperatures in February significantly influence TRLW and TRW growth. Our analyses of precipitation variability during extreme years revealed that high or low precipitation amounts in June have a strong influence on TRLW and TRW growth. It is noteworthy that high precipitation amounts in June have a stronger influence on TRLW and TRW growth than low precipitation amounts in the same month (Figure 9b).
The seasonal cycle of the SPEI drought index was calculated for different periods of accumulation, from 1 to 12 months. The SPEI1 drought index for the selected extreme years presents increased variability without a clear pattern (Figure 10a).
However, it can be observed that SPEI1 has values higher than 0.75 SD in June in the extreme positive years, while in the years with extreme negative values the SPEI1 drought index has values lower than 0.75 SD in November of the previous year and in April and June of the current year (Figure 10a). The seasonal cycle in the case of SPEI3 presents lower variability. Positive SPEI3 values during extreme years favor TRLW and TRW growth, while negative SPEI3 values from April to June lead to narrower TRLW and TRW. Starting with SPEI6, a clear pattern can be seen in the analyses of extreme pointer years. TRLW and TRW growth is strongly influenced by high precipitation during May to June and low precipitation amounts during April to September (Figure 10c). The seasonal cycle of the SPEI9 drought index displays the same pattern as that of SPEI6 (Figure 10d). The temporal evolution of the SPEI12 seasonal cycle emphasizes the influence of long-term drought on oak tree ring growth. SPEI12 values lower than 0.75 SD were recorded from November of the previous year until September of the current year during the extreme negative pointer years (Figure 10e), while SPEI12 values higher than 0.75 SD were recorded for the same period, highlighting that long-term drought conditions have a greater influence on oak TRLW and TRW growth than wet periods.

3.5. Superposed Epoch Analysis

The superposed epoch analysis (SEA) method was used to assess the influence of the climate indicators on the TRW chronologies from the northern part of the Moldavian Plateau during the extreme years. The results of the superposed epoch analysis for TREW are represented in Figure 11. For the positive and negative extreme years, the SEA analysis shows that TREW is not influenced by the previous year’s climatic conditions. Moreover, there is no evidence of memory effects for the next years (Figure 11). However, the aligned tree ring data by year of the extreme event reveal that the precipitation, maximum temperature, and drought conditions during the year of the event have a strong impact on early wood growth, which is in accordance with climate–growth relationship results presented in Section 3.2.
The results of the superposed epoch analysis for TRLW and TRW show different patterns (Figure 12). Our SEA analyses indicate that the extreme negative years of TRLW and TRW growth were strongly influenced by the drought conditions in years −1 and 0; therefore, we can conclude that oak TRLW and TRW in the northeastern part of Romania and the northern part of the Republic of Moldova are susceptible to very long term drought conditions, with two years in a row with severe drought conditions representing an important limiting growth factor for these species. On the other hand, wet conditions in year −1 favor TRLW and TRW growth during the extreme positive years. Likewise, wet conditions in year −1 prior to extreme years enable the accumulation of underground water reserves that can be accessed by oak trees.
Previously published studies have indicated that severe drought during two consecutive years leads to a drastic reduction in the growth rates of broadleaved tree species [30,57]. The obtained results highlight the role of the pivotal oak root system, which allows these trees to reach soil water during drought conditions. If drought conditions persist for two consecutive years, however, water soil reserves decrease significantly due to the lack of any source for recharging; therefore, extremely low soil water leads to concurrent extremely low rates of oak tree growth [30,58]. Likewise, wet conditions in the previous year facilitate the accumulation of soil water reserves, which can provide a buffer against the impact of drought on tree growth and stimulate growth in average climatic conditions [13].
Our SEA analyses indicate that the maximum temperature and precipitation from previous years do not have a significant influence on TRLW and TRW growth, nor was any significant memory effect in the next year observed. However, when analyzing the aligned tree ring data by the year of the extreme event for the TRLW and TRW we found similar results as for TREW, namely, that precipitation, maximum temperature, and drought conditions during the year of the extreme event have a significant influence on the late wood and tree-ring width growth. Previous studies have shown that, for sites with high correlation coefficients between radial tree ring growth and climatic parameters, post-drought growth recovery is controlled by the climate sensitivity of sites and rapidity of recovery after summer droughts [58,59].

4. Conclusions

In this study, we made use of a regional oak tree ring network from six stands that cover the northern Moldavian Plateau (eastern Europe) in presenting an overview of how oak tree growth on the northern Moldavian Plateau is affected by extreme climatic events. Our results indicate that oak tree ring width is mainly affected by long periods with a rainfall deficit (e.g., the standardized precipitation evapotranspiration index for an accumulation period of 12 months—SPEI12), emphasizing the importance of long-term drought variability on oak growth. Spatial correlation analyses revealed that low TRLW values on the northern Moldavian Plateau are associated with drought conditions extending over large parts of Europe, with the strongest signal over Romania, while high TRLW values are associated with wet conditions restricted mainly to the analyzed region and a few areas in Ukraine, Poland, and western Russia.
The seasonal cycle of extreme years in Quercus sp. tree ring records confirms the influence of the long-term drought conditions on tree growth, and highlights a different response to wet and dry extremes. Overall, we found that TREW, TRLW, and TRW are less sensitive to wet years and more sensitive to drought conditions.
Our SEA analyses for TREW indicate that precipitation, maximum temperature, and drought conditions during the year of the extreme event have a strong impact on the early wood width, which is in accordance with the climate–growth relationship. The results of the SEA analysis for TRLW and TRW indicate that during the extreme negative years of TRLW and TRW growth is strongly influenced by drought condition in years −1 and 0; therefore, we can conclude that oak TRLW and TRW in the northeastern part of Romania are susceptible to very-long-term drought conditions, and that two years in a row with drought condition represents an important limiting growth factor for Quercus sp. On the other hand, wet conditions in year −1 favor the TRLW and TRW during the extreme positive years. Thus, investigating the potential impact of extreme hydroclimatic events on forestry (especially tree ring growth) and related services for society and the economy is essential in order to mitigate negative effects, especially in the context of ongoing climate change and the projected increase in the global mean temperature over the coming decades [21,27].

Supplementary Materials

The following supporting information can be downloaded at: https://www.mdpi.com/article/10.3390/f14050894/s1, Table S1: Climate growth relationship for earlywood tree-ring width (TREW) over the 1901–2019 period (uppercase months—current year, lower case months—the previous year, PP— Precipitation, Tmin—minimum temperature, Tmean—mean temperature, Tmax—Maximum Temperature, 1-month (SPI1), 3-month (SPI3), 6-month (SPI6), 9-month (SPI9), 12-month (SPI12) Standardized Precipitation Index); Table S2: Climate growth relationship for latewood tree-ring width (TRLW) over the 1901–2019 period (uppercase months—current year, lower case months—the previous year, PP— Precipitation, Tmin—minimum temperature, Tmean—mean temperature, Tmax—Maximum Temperature, 1-month (SPI1), 3-month (SPI3), 6-month (SPI6), 9-month (SPI9), 12-month (SPI12) Standardized Precipitation Index); Table S3: Climate growth relationship for total tree-ring width (TRW) over the 1901–2019 period (uppercase months—current year, lower case months—the previous year, PP— Precipitation, Tmin—minimum temperature, Tmean—mean temperature, Tmax—Maximum Temperature, 1-month (SPI1), 3-month (SPI3), 6-month (SPI6), 9-month (SPI9), 12-month (SPI12) Standardized Precipitation Index).

Author Contributions

V.N. conceptualized the study and wrote the article draft; A.M., C.-C.R. and M.I. designed the methodology and analyzed the data; all authors (V.N., A.M., M.I., I.P., V.S. and C.-C.R.) helped with the writing of the original draft, interpretation the results, and the review process. All authors have read and agreed to the published version of the manuscript.

Funding

This work was supported by a grant of the Ministry of Research, Innovation, and Digitization, CNCS—UEFISCDI, project number PN-III-P1-1.1-TE-2021-1419, within PNCDI III. C.-C.R and V.N. were partially funded by the Ministry of Research, Innovation, and Digitalization within Program 1—Development of national research and development system, Subprogram 1.2—Institutional Performance—RDI excellence funding projects, under contract no. 10PFE/2021. I.P was supported by a grant of the Ministry of Research, Innovation, and Digitization, CNCS—UEFISCDI, project number PN-III-P4-PCE-2021-1002, within PNCDI III. V.N.: This work has been financially supported within the project entitled “DECIDE—Development through entrepreneurial education and innovative doctoral and postdoctoral research”, project code POCU/380/6/13/125031, project co-financed from the European Social Fund through the 2014–2020 Operational Program Human Capital.

Data Availability Statement

The datasets analyzed during the current study are available from the corresponding author upon reasonable request.

Acknowledgments

We would like to thank to Ilarie Leșan and Marian-Ionuț Știrbu for field and technical assistance.

Conflicts of Interest

The authors declare no conflict of interests.

References

  1. Ionita, M.; Nagavciuc, V. Extreme floods in the eastern part of europe: Large-scale drivers and associated impacts. Water 2021, 13, 1122. [Google Scholar] [CrossRef]
  2. Stahl, K.; Kohn, I.; Blauhut, V.; Urquijo, J.; De Stefano, L.; Acácio, V.; Dias, S.; Stagge, J.H.; Tallaksen, L.M.; Kampragou, E.; et al. Impacts of European drought events: Insights from an international database of text-based reports. Nat. Hazards Earth Syst. Sci. 2016, 16, 801–819. [Google Scholar] [CrossRef]
  3. Ionita, M.; Nagavciuc, V. Changes in Drought Features at the European Level over the Last 120 Years. Nat. Hazards Earth Syst. Sci. 2021, 21, 1685–1701. [Google Scholar] [CrossRef]
  4. Kreibich, H.; Van Loon, A.F.; Schröter, K.; Ward, P.J.; Mazzoleni, M.; Sairam, N.; Abeshu, G.W.; Agafonova, S.; AghaKouchak, A.; Aksoy, H.; et al. The challenge of unprecedented floods and droughts in risk management. Nature 2022, 608, 80–86. [Google Scholar] [CrossRef]
  5. Hartmann, H.; Bastos, A.; Das, A.J.; Esquivel-Muelbert, A.; Hammond, W.M.; Martínez-Vilalta, J.; Mcdowell, N.G.; Powers, J.S.; Pugh, T.A.M.; Ruthrof, K.X.; et al. Climate Change Risks to Global Forest Health: Emergence of Unexpected Events of Elevated Tree Mortality Worldwide. Annu. Rev. Plant Biol. 2022, 73, 673–702. [Google Scholar] [CrossRef]
  6. McKenney-Easterling, M.; Dewalle, D.R.; Iverson, L.R.; Prasad, A.M.; Buda, A.R. The potential impacts of climate change and variability on forests and forestry in the Mid-Atlantic Region. Clim. Res. 2000, 14, 195–206. [Google Scholar] [CrossRef]
  7. Allen, C.D.; Breshears, D.D.; McDowell, N.G. On underestimation of global vulnerability to tree mortality and forest die-off from hotter drought in the Anthropocene. Ecosphere 2015, 6, art129. [Google Scholar] [CrossRef]
  8. Buras, A.; Rammig, A.; Zang, C.S. Quantifying impacts of the drought 2018 on European ecosystems in comparison to 2003. arXiv Popul. Evol. 2020, 17, 1655–1672. [Google Scholar] [CrossRef]
  9. Teskey, R.; Wertin, T.; Bauweraerts, I.; Ameye, M.; McGuire, M.A.; Steppe, K. Responses of tree species to heat waves and extreme heat events. Plant Cell Environ. 2014, 38, 1699–1712. [Google Scholar] [CrossRef]
  10. Bauwe, A.; Jurasinski, G.; Scharnweber, T.; Schröder, C.; Lennartz, B. Impact of climate change on tree-ring growth of scots pine, common beech and pedunculate Oak in northeastern Germany. IForest 2016, 9, 1–11. [Google Scholar] [CrossRef]
  11. Bréda, N.; Badeau, V. Forest tree responses to extreme drought and some biotic events: Towards a selection according to hazard tolerance? Comptes Rendus Geosci. 2008, 340, 651–662. [Google Scholar] [CrossRef]
  12. Granier, A.; Reichstein, M.; Bréda, N.; Janssens, I.A.; Falge, E.; Ciais, P.; Grünwald, T.; Aubinet, M.; Berbigier, P.; Bernhofer, C.; et al. Evidence for soil water control on carbon and water dynamics in European forests during the extremely dry year: 2003. Agric. For. Meteorol. 2007, 143, 123–145. [Google Scholar] [CrossRef]
  13. Bréda, N.; Huc, R.; Granier, A.; Dreyer, E. Temperate forest trees and stands under severe drought: A review of ecophysiological responses, adaptation processes and long-term consequences. Ann. For. Sci. 2006, 63, 625–644. [Google Scholar] [CrossRef]
  14. Nagavciuc, V. Transfer of the Climatic Signal in Physical and Geochemical Parameters in Annual Tree Ring. Ph.D. Thesis, Stefan cel Mare University of Suceava of Romania, Suceava, Romania, 2019. [Google Scholar]
  15. Nagavciuc, V.; Kern, Z.; Ionita, M.; Hartl, C.; Konter, O.; Esper, J.; Popa, I. Climate signals in carbon and oxygen isotope ratios of Pinus cembra tree-ring cellulose from Călimani Mountains, Romania. Int. J. Climatol. 2020, 40, 2539–2556. [Google Scholar] [CrossRef]
  16. Fritts, H.C. Tree Rings and Climate; Academic Press: London, UK, 1976. [Google Scholar]
  17. Schweingruber, F.H. Tree Rings and Environment. Dendroecology; Swiss Federal Institute of Forest, Snow and Landscape Research WSL/FNP: Birmensdorf, Switzerland, 1996. [Google Scholar]
  18. Laginha Pinto Correia, D.; Bouchard, M.; Filotas, É.; Raulier, F. Disentangling the effect of drought on stand mortality and productivity in northern temperate and boreal forests. J. Appl. Ecol. 2019, 56, 758–768. [Google Scholar] [CrossRef]
  19. Ionita, M.; Nagavciuc, V.; Kumar, R.; Rakovec, O. On the curious case of the recent decade, mid-spring precipitation deficit in central Europe. npj Clim. Atmos. Sci. 2020, 3, 49. [Google Scholar] [CrossRef]
  20. Ionita, M.; Caldarescu, D.E.; Nagavciuc, V. Compound Hot and Dry Events in Europe: Variability and Large-Scale Drivers. Front. Clim. 2021, 3, 688991. [Google Scholar] [CrossRef]
  21. IPCC Summary for policymakers. Climate Change 2021: The Physical Science Basis. Contribution of Working Group I to the Sixth Assessment Report of the Intergovernmental Panel on Climate Change; Masson-Delmotte, V., Zhai, P., Pirani, A., Connors, S.L., Péan, C., Berger, S., Caud, N., Chen, Y., Goldfarb, L., Gomis, M.I., et al., Eds.; Cambridge University Press: Cambridge, UK; New York, NY, USA, 2021; pp. 3–22. ISBN 9781139177245. [Google Scholar]
  22. Nagavciuc, V.; Scholz, P.; Ionita, M. Hotspots for warm and dry summers in Romania. Nat. Hazards Earth Syst. Sci. 2022, 22, 1347–1369. [Google Scholar] [CrossRef]
  23. Nagavciuc, V.; Ionita, M.; Kern, Z.; McCarroll, D.; Popa, I. A ~700 years perspective on the 21st century drying in the eastern part of Europe based on δ18O in tree ring cellulose. Commun. Earth Environ. 2022, 3, 277. [Google Scholar] [CrossRef]
  24. Leuzinger, S.; Zotz, G.; Asshoff, R.; Körner, C. Responses of deciduous forest trees to severe drought in Central Europe. Tree Physiol. 2005, 25, 641–650. [Google Scholar] [CrossRef]
  25. Kirilenko, A.P.; Sedjo, R.A. Climate change impacts on forestry. Proc. Natl. Acad. Sci. USA 2007, 104, 19697–19702. [Google Scholar] [CrossRef] [PubMed]
  26. Moravec, V.; Markonis, Y.; Rakovec, O.; Svoboda, M.; Trnka, M.; Kumar, R.; Hanel, M. Europe under multi-year droughts: How severe was the 2014–2018 drought period? Environ. Res. Lett. 2021, 16, 034062. [Google Scholar] [CrossRef]
  27. IPCC. Global Warming of 1.5 °C an IPCC Special Report on the Impacts of Global Warming of 1.5 °C above Pre-Industrial Levels and Related Global Greenhouse Gas Emission Pathways, in the Context of Strengthening the Global Response to the Threat of Climate Change; IPCC-Intergovernmental Panel on Climate Change: Geneva, Switzerland, 2018. [Google Scholar]
  28. Bakke, S.J.; Ionita, M.; Tallaksen, L.M. The 2018 northern European hydrological drought and its drivers in a historical perspective. Hydrol. Earth Syst. Sci. 2020, 24, 5621–5653. [Google Scholar] [CrossRef]
  29. Ionita, M.; Nagavciuc, V.; Scholz, P.; Dima, M. Long-term drought intensification over Europe driven by the weakening trend of the Atlantic Meridional Overturning Circulation. J. Hydrol. Reg. Stud. 2022, 42, 101176. [Google Scholar] [CrossRef]
  30. Scharnweber, T.; Smiljanic, M.; Cruz-García, R.; Manthey, M.; Wilmking, M. Tree growth at the end of the 21st century—The extreme years 2018/19 as template for future growth conditions. Environ. Res. Lett. 2020, 15, 074022. [Google Scholar] [CrossRef]
  31. Bacauanu, V.; Barbu, N.; Pantazica, M.; Ungureanu, A.; Chiriac, D. Podisul Moldovei; Editura Stiintifica si Enciclopedica: Bucureşti, Romania, 1980. [Google Scholar]
  32. Sandu, I.; Pescaru, V.I.; Poiana, I. Clima Romaniei; Editura Academiei Române: Bucureşti, Romania, 2008; ISBN 973-27-1674-8. [Google Scholar]
  33. Harris, I.; Osborn, T.J.; Jones, P.; Lister, D. Version 4 of the CRU TS monthly high-resolution gridded multivariate climate dataset. Sci. Data 2020, 7, 1–18. [Google Scholar] [CrossRef]
  34. Gärtner, H.; Nievergelt, D. The core-microtome: A new tool for surface preparation on cores and time series analysis of varying cell parameters. Dendrochronologia 2010, 28, 85–92. [Google Scholar] [CrossRef]
  35. Cybis Elektronik CDendro and CooRecorder. 2010. Available online: http://www.cybis.se/forfun/dendro/index.htm (accessed on 12 January 2022).
  36. Wheeler, E.A.; Baas, P.; Gasson, P.E. IAWA List of Microscopic Features for Hardwood Identification with an Appendix on Non-Anatomical Information; International Association of Wood Anatomists: Leiden, The Netherlands, 1989. [Google Scholar]
  37. Rinn, F. TSAP-Win User Reference; Rinntech: Heidelberg, Germany, 2003. [Google Scholar]
  38. Bunn, A.G. A dendrochronology program library in R (dplR). Dendrochronologia 2008, 26, 115–124. [Google Scholar] [CrossRef]
  39. Cook, E.R.; Kairiukstis, L.A. Methods of Dendrochronology: Applications in the Enviromnental Science; Kluwer: Alphen aan den Rijn, The Netherlands, 1990. [Google Scholar]
  40. Cook, E.-R.; Peters, K. Calculating unbiased tree-ring indices for study of climatic and environmental change. Holocene 1997, 7, 361–370. [Google Scholar] [CrossRef]
  41. Wigley, T.M.L.; Briffa, K.R.; Jones, P.D. On the Average Value of Correlated Time Series, with Applications in Dendroclimatology and Hydrometeorology. J. Clim. Appl. Meteorol. 1984, 23, 201–213. [Google Scholar] [CrossRef]
  42. Roibu, C.-C.; Sfecla, V.; Mursa, A.; Ionita, M.; Nagavciuc, V.; Chiriloaei, F.; Lesan, I.; Popa, I. The Climatic Response of Tree Ring Width Components of Ash (Fraxinus excelsiorL.) and Common Oak (Quercus roburL.) from Eastern Europe. Forests 2020, 11, 600. [Google Scholar] [CrossRef]
  43. Nagavciuc, V.; Ionita, M.; Perșoiu, A.; Popa, I.; Loader, N.J.; McCarroll, D. Stable oxygen isotopes in Romanian oak tree rings record summer droughts and associated large-scale circulation patterns over Europe. Clim. Dyn. 2019, 52, 6557–6568. [Google Scholar] [CrossRef]
  44. Vicente-Serrano, S.M.; Beguería, S.; López-Moreno, J.I. A multiscalar drought index sensitive to global warming: The standardized precipitation evapotranspiration index. J. Clim. 2010, 23, 1696–1718. [Google Scholar] [CrossRef]
  45. Von Storch, H.; Zwiers, F.W. Statistical Analysis in Climate Research; Cambridge University Press: Cambridge, UK, 1999. [Google Scholar]
  46. Lough, J.M.; Fritts, H.C. An assessment of the possible effects of volcanic eruptions on North American climate using tree-ring data, 1602 to 1900 A.D. Clim. Chang. 1987, 10, 219–239. [Google Scholar] [CrossRef]
  47. Lebourgeois, F.; Cousseau, G.; Ducos, Y. Climate-tree-growth relationships of Quercus petraea Mill. stand in the Forest of Bercé (“Futaie des Clos”, Sarthe, France). Ann. For. Sci. 2013, 61, 361–372. [Google Scholar] [CrossRef]
  48. Kern, Z.; Patkó, M.; Kázmér, M.; Fekete, J.; Kele, S.; Pályi, Z. Multiple tree-ring proxies (earlywood width, latewood width and d13C) from pedunculate oak (Quercus robur L.), Hungary. Quat. Int. 2012, 293, 257–267. [Google Scholar] [CrossRef]
  49. Cufar, K.; Grabner, M.; Morgós, A.; Martínez del Castillo, E.; Merela, M.; de Luis, M. Common climatic signals affecting oak tree-ring growth in SE Central Europe. Trees 2014, 28, 1267–1277. [Google Scholar] [CrossRef]
  50. Roibu, C.-C.; Ważny, T.; Crivellaro, A.; Mursa, A.; Chiriloaei, F.; Ştirbu, M.-I.; Popa, I. The Suceava oak chronology: A new 804 years long tree-ring chronology bridging the gap between central and south Europe. Dendrochronologia 2021, 68, 125856. [Google Scholar] [CrossRef]
  51. Ellenberg, H. Vegetation Ecology of Central Europe; Cambridge University Press: Cambridge, UK, 1988. [Google Scholar]
  52. Mátyás, C. Adaptive pattern of phenotypic plasticity and inherent growth reveal the potential for assisted transfer in sessile oak (Quercus petraea L.). For. Ecol. Manag. 2021, 482, 118832. [Google Scholar] [CrossRef]
  53. Gimeno, T.E.; Pías, B.; Lemos-Filho, J.P.; Valladares, F. Plasticity and stress tolerance override local adaptation in the responses of Mediterranean holm oak seedlings to drought and cold. Tree Physiol. 2009, 29, 87–98. [Google Scholar] [CrossRef]
  54. Fonti, P.; García-González, I. Earlywood vessel size of oak as a potential proxy for spring precipitation in mesic sites. J. Biogeogr. 2008, 35, 2249–2257. [Google Scholar] [CrossRef]
  55. González, I.G.; Eckstein, D. Climatic signal of earlywood vessels of oak on a maritime site. Tree Physiol. 2003, 23, 497–504. [Google Scholar] [CrossRef] [PubMed]
  56. Roibu, C.C.; Popa, I.; Kirchhefer, A.J.; Palaghianu, C. Growth responses to climate in a tree-ring network of European beech (Fagus sylvatica L.) from the eastern limit of its natural distribution area. Dendrochronologia 2017, 42, 104–116. [Google Scholar] [CrossRef]
  57. Schuldt, B.; Buras, A.; Arend, M.; Vitasse, Y.; Beierkuhnlein, C.; Damm, A.; Gharun, M.; Grams, T.E.E.; Hauck, M.; Hajek, P.; et al. A first assessment of the impact of the extreme 2018 summer drought on Central European forests. Basic Appl. Ecol. 2020, 45, 86–103. [Google Scholar] [CrossRef]
  58. Bose, A.K.; Scherrer, D.; Camarero, J.J.; Ziche, D.; Babst, F.; Bigler, C.; Bolte, A.; Dorado-Liñán, I.; Etzold, S.; Fonti, P.; et al. Climate sensitivity and drought seasonality determine post-drought growth recovery of Quercus petraea and Quercus robur in Europe. Sci. Total Environ. 2021, 784, 147222. [Google Scholar] [CrossRef]
  59. Huang, M.; Wang, X.; Keenan, T.F.; Piao, S. Drought timing influences the legacy of tree growth recovery. Glob. Chang. Biol. 2018, 24, 3546–3559. [Google Scholar] [CrossRef]
Figure 1. Site location (a) In Europe, (b) at the regional scale, and (c) at the local scale.
Forests 14 00894 g001
Figure 2. The temporal evolution (PC1) associated with EOF1 for: (a) total tree-ring width (TRW index), (b) late wood tree-ring width (TRLW index), and (c) early wood tree-ring width (TREW index). The most extreme positive and negative years are indicated by the red and blue triangles.
Forests 14 00894 g002
Figure 3. Climate growth relationship for early wood tree-ring width over the 1901–2019 period (uppercase months—current year; lowercase months—the previous year; AMJ—April, May, June; MJJ—May, June, July; JJA—June, July, August), PP—monthly precipitation, Tmin—monthly minimum temperature, Tmean—monthly mean temperature, Tmax—monthly maximum temperature, SPEI—Standardized Potential Evapotranspiration Index for one month (SPEI1), three months (SPEI3), six months (SPEI6), nine months (SPEI9), and twelve months (SPEI12)). Significant correlations are represented by black dots (p > 0.05).
Forests 14 00894 g003
Figure 4. Climate growth relationship for late wood tree-ring width over the 1901–2019 period (uppercase months—current year; lowercase months—the previous year; JJA—June, July, August), PP—monthly precipitation, Tmin—monthly minimum temperature, Tmean—monthly mean temperature, Tmax—monthly maximum temperature, SPEI—Standardized Potential Evapotranspiration Index for one month (SPEI1), three months (SPEI3), six months (SPEI6), nine months (SPEI9), and twelve months (SPEI12)). Significant correlations are represented by black dots (p > 0.05).
Forests 14 00894 g004
Figure 5. Climate growth relationship for total tree-ring width over the 1901–2019 period (uppercase months—current year; lowercase months—the previous year; JJA—June, July, August), PP—monthly precipitation, Tmin—monthly minimum temperature, Tmean—monthly mean temperature, Tmax—monthly maximum temperature, SPEI—Standardized Potential Evapotranspiration Index for one month (SPEI1), three months (SPEI3), six months (SPEI6), nine months (SPEI9), and twelve months (SPEI12)). Significant correlations are represented by black dots (p > 0.05).
Forests 14 00894 g005
Figure 6. (a) Composite map between low TREW and SPEI12; (b) composite map between high TREW and SPEI12; (c) same as in (a), except for TRLW; (d) same as in (b), except for TRLW. The hatching highlights significant values at a confidence level of 95%. Analyzed period: 1901–2019. Black stars indicate the site location.
Forests 14 00894 g006
Figure 7. The temporal evolution of the seasonal cycle for (a) maximum monthly temperature and (b) monthly precipitation during years with extreme TREW values. The black lines indicate the seasonal cycle over the period 1971–2000, the red and green lines indicate the seasonal cycle for high extreme values of TREW, and the blue and orange lines indicate the seasonal cycle for low extreme values of TREW. Where the coloured lines lie outside the grey shading, deviations higher/lower than 0.75 (SD) from average conditions occur. All analyses were made from May of the previous year (lowercase letters) until December of the current year (uppercase letters).
Forests 14 00894 g007
Figure 8. Temporal evolution of the seasonal cycle for the SPEI drought index for different accumulation periods during years with extreme TREW values: (a) SPEI1, (b) SPEI3, (c) SPEI6, (d) SPEI9, and (e) SPEI12. The black lines indicate the seasonal cycle over the period 1971–2000, the green lines indicate the seasonal cycle for high extreme values of TREW, and the orange lines indicate the seasonal cycle for low extreme values of TREW. Where the coloured lines lie outside the grey shading, deviations higher/lower than 0.75 SD from average conditions occur. The analyses were made from May of the previous year (lowercase letters) until December of the current year (uppercase letters).
Forests 14 00894 g008aForests 14 00894 g008b
Figure 9. Temporal evolution of the seasonal cycle for (a) maximum monthly temperature and (b) monthly precipitation during years with extreme TRLW values. The black lines indicate the seasonal cycle over the period 1971–2000, the red and green lines indicate the seasonal cycle for high extreme values of TRLW, and the blue and orange lines indicate the seasonal cycle for low extreme values of TRLW. Where the coloured lines lie outside the grey shading, deviations higher/lower than 0.75 SD from average conditions occur. The analyses were made from May of the previous year (lowercase letters) until December of the current year (uppercase letters).
Forests 14 00894 g009
Figure 10. Temporal evolution of the seasonal cycle for the SPEI drought index for different accumulation periods during years with extreme TRLW values: (a) SPEI1, (b) SPEI3, (c) SPEI6, (d) SPEI9, and (e) SPEI12. The black lines indicate the seasonal cycle over the period 1971–2000, the green lines indicate the seasonal cycle for high extreme values of TRLW, and the orange lines indicate the seasonal cycle for low extreme values of TRLW. Where the coloured lines lie outside the grey shading, deviations higher/lower than 0.75 SD from average conditions occur. The analyses were made from May of the previous year (lowercase letters) until December of the current year (uppercase letters).
Forests 14 00894 g010aForests 14 00894 g010b
Figure 11. Superposed epoch analysis (SEA) for early wood tree-ring width (g,h) and main climatic parameters ((a,b)—SPEI drought index for different accumulation periods, (c,d)—monthly maximum temperature (Tmax), and (e,f)—monthly precipitation (PP) for the extreme negative years (left column) and extreme positive years (right column)). The grey lines in (ch) indicate the maximum and minimum variability for the corresponding parameter during the selected extreme years.
Forests 14 00894 g011
Figure 12. Superposed epoch analysis (SEA), for late wood tree-ring width (LW), total tree-ring width (RW) (g,h), and main climatic parameters ((a,b)—SPEI drought index for different accumulation periods, (c,d)—monthly maximum temperature (Tmax), and (e,f)—monthly precipitation (PP) for the extreme negative years (left column) and extreme positive years (right column)). The grey lines in (ch) indicate the maximum and minimum variability for the corresponding parameter during the selected extreme years.
Forests 14 00894 g012
Table 1. Sample location.
NoSiteDescriptionLatitude (°N)Longitude (°E)Altitude
(m a.sl.)
Number of Cores
1PATRPătrăuți, Suceava, RO47.7626.2039417
2TUDOTudora, Botoșani, RO47.5426.6948320
3ZLQRZamostea Luncă, Suceava, RO47.8726.2529129
4BRICBriceni, MD48.2627.0222830
5PADMPădurea Domnească, MD47.6127.405929
6RUDIRudi, MD48.3127.9122930
Table 2. Statistical parameters for oak chronologies (MxAge—maximum age; MSL—mean sample length; MGR—mean growth rate; AC1—first-order autocorrelation; MS—mean sensitivity; corr—correlation with master chronology; rbar—inter-series correlation; EPS—expressed population signal; SNR—signal-to-noise-ratio, SD—standard deviation).
SiteRing
Type
Tree Ring Width ChronologyTree Ring Width Index Chronology
Time SpanMxAge
(Years)
MSL ± SD
(Years)
MGR ± SD (mm)AC1corrMSrbarEPSSNR
BRICTREW1842–2019178157 ± 150.88 ± 0.170.560.490.130.2830.92211.86
TRLW1.08 ± 0.250.520.700.390.5350.97234.48
TRW1.96 ± 0.390.620.710.240.5360.97234.71
PADMTREW1868–2019152124 ± 201.09 ± 0.270.520.450.110.2450.9049.39
TRLW1.94 ± 0.570.710.670.270.4880.96527.67
TRW3.03 ± 0.790.760.670.180.4640.96225.14
PATRTREW1805–2019215168 ± 260.76 ± 0.120.560.380.100.1810.7893.75
TRLW1.34 ± 0.320.700.610.250.4070.92111.67
TRW2.10 ± 0.410.760.610.170.4220.92512.42
RUDITREW1904–201911695 ± 100.98 ± 0.190.550.350.100.1570.8485.57
TRLW1.95 ± 0.510.550.630.310.5100.96931.28
TRW2.92 ± 0.650.590.630.220.4870.96628.43
TUDOTREW1802–2019218189 ± 280.64 ± 0.150.560.290.090.1180.7282.68
TRLW1.02 ± 0.390.690.550.250.3860.92612.59
TRW1.66 ± 0.510.750.560.170.3750.92312.02
ZLQRTREW1820–2018199157 ± 240.89 ± 0.150.500.400.090.2030.8817.39
TRLW1.42 ± 0.260.600.630.270.5110.96830.25
TRW2.31 ± 0.370.650.630.180.4860.96527.41
Table 3. The contribution of the individual time series to the EOF analysis.
Ring TypeTRLWTREWTRW
SiteEOF1
(46.96%)
EOF2
(15.91%)
EOF1
(44.79%)
EOF2
(15.62%)
EOF1
(48.23%)
EOF2
(15.76%)
ZLQR0.41−0.330.40−0.440.39−0.44
TUDO0.48−0.230.42−0.010.46−0.17
RUDI0.390.470.350.610.390.49
PATR0.43−0.550.44−0.480.41−0.54
PADM0.360.450.390.440.390.34
BRIC0.380.350.440.020.410.36
Table 4. The selected extreme positive and negative growth years for early wood tree-ring width (TREW), late wood tree-ring width (TRLW), and total tree-ring width (TRW).
TRW and TRLWTREW
Positive1909, 1962, 1965, 1985, 1997, 20131914, 1938, 1948, 1980, 1997, 2014
Negative1915, 1946, 1968, 1972, 1983, 20041920, 1925, 1934, 1971, 1979, 2016
Disclaimer/Publisher’s Note: The statements, opinions and data contained in all publications are solely those of the individual author(s) and contributor(s) and not of MDPI and/or the editor(s). MDPI and/or the editor(s) disclaim responsibility for any injury to people or property resulting from any ideas, methods, instructions or products referred to in the content.

