Article

Health and Growth of Black Pine outside Its Natural Distribution Range in the Romanian Carpathians

by
Gheorghe-Marian Tudoran
1,*,
Avram Cicșa
1,2,
Alexandru-Claudiu Dobre
1,2,
Maria Cicșa
1,
Ionuț-Silviu Pascu
1,2 and
Ştefan Leca
1,2
1
Forest Management Planning and Terrestrial Measurements, Department of Forest Engineering, Faculty of Silviculture and Forest Engineering, Transilvania University, 1 Ludwig van Beethoven Str., 500123 Brașov, Romania
2
Department of Forest Monitoring, “Marin Drăcea” Romanian National Institute for Research and Development in Forestry, 128 Eroilor Blvd., 077190 Voluntari, Romania
*
Author to whom correspondence should be addressed.
Forests 2023, 14(5), 884; https://doi.org/10.3390/f14050884
Submission received: 15 February 2023 / Revised: 6 April 2023 / Accepted: 24 April 2023 / Published: 25 April 2023
(This article belongs to the Special Issue Drought Tolerance Traits and Growth in Trees)

Abstract

:
In the last decade, coniferous stands outside their natural range in Romania have experienced declines in both their health and growth and, in tandem with global climate trends, these forests are becoming even more threatened. We studied the relationship between tree growth and defoliation as an indicator of tree health. The data came from black pine stands monitored from 2012 to 2021 in the Postăvarul Massif in the Romanian Carpathians. Analyses were carried out on 508 individual trees based on their defoliation and radial growth data and also at the stand level. The results revealed an increase in the percentage of tree defoliation from 17% to 38% during the studied decade, along with 13.5% tree mortality. Over the decade, radial growth showed a negative trend, driven significantly by defoliation. The biometric parameters of the trees did not influence their percentage of defoliation. In contrast, spring/summer droughts associated with high temperatures affect the health and growth of trees. Models generated from the temperature–defoliation–radial-growth relationship estimated a significant continuous reduction in the radial growth of the trees of 0.5%–0.6% for each 1% increase in defoliation. Under the site conditions of the investigated stands, an increase in basal area and stocking degree significantly increased stand defoliation. This was further accentuated when the pine stand included an understory of young trees. As a rule, in the interest of production, stands are kept dense to fully exploit the site, but thinning may become necessary to protect these stands and ensure their survival as the climate changes.

1. Introduction

As a result of climate change, the condition of forests is increasingly worrying, with temperatures predicted to continue to rise [1]. This trend is expected to change the frequency and intensity of natural disturbances [2,3] and will likely become a stressor for forest sites and affect living organisms [4]. The coniferous forests located in Southern and Central Europe have been significantly affected [5,6], particularly spruce and pine forests in Norway [7]. These species will experience significant productivity losses as they remain threatened by future climate change [7,8]. Climate scenarios indicate potential changes in species distribution with serious consequences for forest management and nature conservation [8]. The impact of droughts in conjunction with warmer temperatures, also known as “hotter droughts” [9], begets increases in tree defoliation [10], leading to significant increases in tree mortality [9,10,11]. According to the “International Co-operative Programme on Assessment and Monitoring of Air Pollution Effects on Forests” (ICP Forests), tree defoliation is an important indicator of forest health, which is relevant for sustainable forest management [12] and can be used as a measure of forest health and vitality [13]. The tree crown records the cumulative effect of the action of various biotic and abiotic factors, including the site characteristics, climatic conditions, pests, and deposition of air pollution [14]. Studies investigating defoliation have mainly focused on dominant trees [15], which in some cases are considered more sensitive compared to suppressed trees, with the response of trees differing due to the availability of water and nutrients [16]. This highlights the importance of the natural distribution of species, and in general, of knowing the behavior of species under the site conditions in which they are to be introduced or the response of species under similar site conditions.
Climate change has become one of the main factors affecting forest health, causing radical changes in forest structures [17]. For example, changes in composition result in changes in the structural complexity of stands due to the ability of species to use the space between trees and belowground resources differently. The increase in drought severity in Europe is predicted by all climate scenarios [1,8,18] and is faithfully recorded in tree crowns and ring growth. Tree-ring analysis provides objective information about how adult trees respond to variations in climate [19,20]. Silvicultural interventions also shape stand structure [21] and induce changes in the growth of individual trees [22] and stands [23,24]. Consecutive droughts with reduced rainfall in spring lead to reductions in growth and may be one of the causes of pine forest decline [25,26], as pine is more susceptible during the growing season. Numerous studies have highlighted the relationship between climatic factors and radial growth processes in the Carpathians [27,28,29], which has led to a dendrochronological series that explains the response of various species to climatic factors. Climate fluctuations and changes are also known to be responsible for tree defoliation, and defoliation is significantly negatively related to radial tree growth [13] and, as a result, the basal area [30].
In Romania, the droughts of 2011–2012 severely affected mainly coniferous stands located at the lower limit of their natural distribution and outside. Research findings from a country-level dendrochronological network of Scots pine in Romania [19] have indicated that high temperatures in spring and summer and low rainfall during the growing season in 2011–2012 significantly reduced stand growth and productivity, triggering dieback and mortality events in some areas of the country. Black pine (Pinus nigra ssp. banatica [Borb.] Novák, P. nigra var. banatica Georg. and Ion.) is found, in its natural range, in south-western Romania—on rocky calcareous soils at altitudes of between 500 and 900 m, and with annual rainfall of between 900 and 1100 mm [31]. However, throughout the country, it is mostly represented by plantations on degraded land [32] and on steeply sloping, rugged land (i.e., P. nigra var. austriaca [Höss] Asch. and Graebn., P. austriaca Höss) [33], considered outside the natural distribution range of the species [34]. These monocultures have a low genetic diversity compared to natural old-growth forests, whose genetic richness makes them more adaptable to changing environmental conditions [35]. Since black pine find it difficult to regenerate during dry periods [36], the site conditions outside its natural distribution range could diminish its ability to regenerate naturally.
Droughts can cause the defoliation and death of tree crowns [37]. Defoliation frequently correlates with precipitation and precipitation deficit, while air temperature is not considered an important predictor [38], although leaf browning tendencies have been observed after considerably higher temperatures and precipitation deficit [39]. Drought-induced defoliation also caused a significant reduction in the radial growth of coniferous trees and beech trees [13,39]. The decline induced by drought can manifest itself differently—either it can be transmitted immediately to a decline in radial growth and later on the canopy condition [40], resulting in increased defoliation, or immediately and simultaneously on the crown and the trees growth [39]. The impact of drought depends on tree size, with understory trees being less sensitive to mortality than dominant trees in a structured forest [16], but also by the genetic variability of the population [35]. Additionally, large trees are more likely to be affected [39], but they can explore the deeper layers of the soil in favorable precipitation [16]. However, there have also been cases where suppressed trees are the most negatively impacted by drought events, as their diameter shortens more than dominant trees [16]. Under climate change, the responses of trees depend on multiple conditions and are specific to the site and tree species. In this paper, we discuss the behavior of black pine in Romania, not only at the level of individual trees but also at the level of stands, outside its natural distribution area, and under high-temperature drought conditions. We hypothesize that hotter droughts in Romania will lead to a decline in the health of black pine trees growing outside their native distribution range. Therefore, our objective was to determine (i) the dynamics of tree and stand health after the severe drought of 2012 and (ii) the relationship between defoliation and stand growth. These indicators provide more insight into the response of pine forests located outside their natural distribution to the changing environmental conditions, which is indispensable for the management of these forests.

2. Materials and Methods
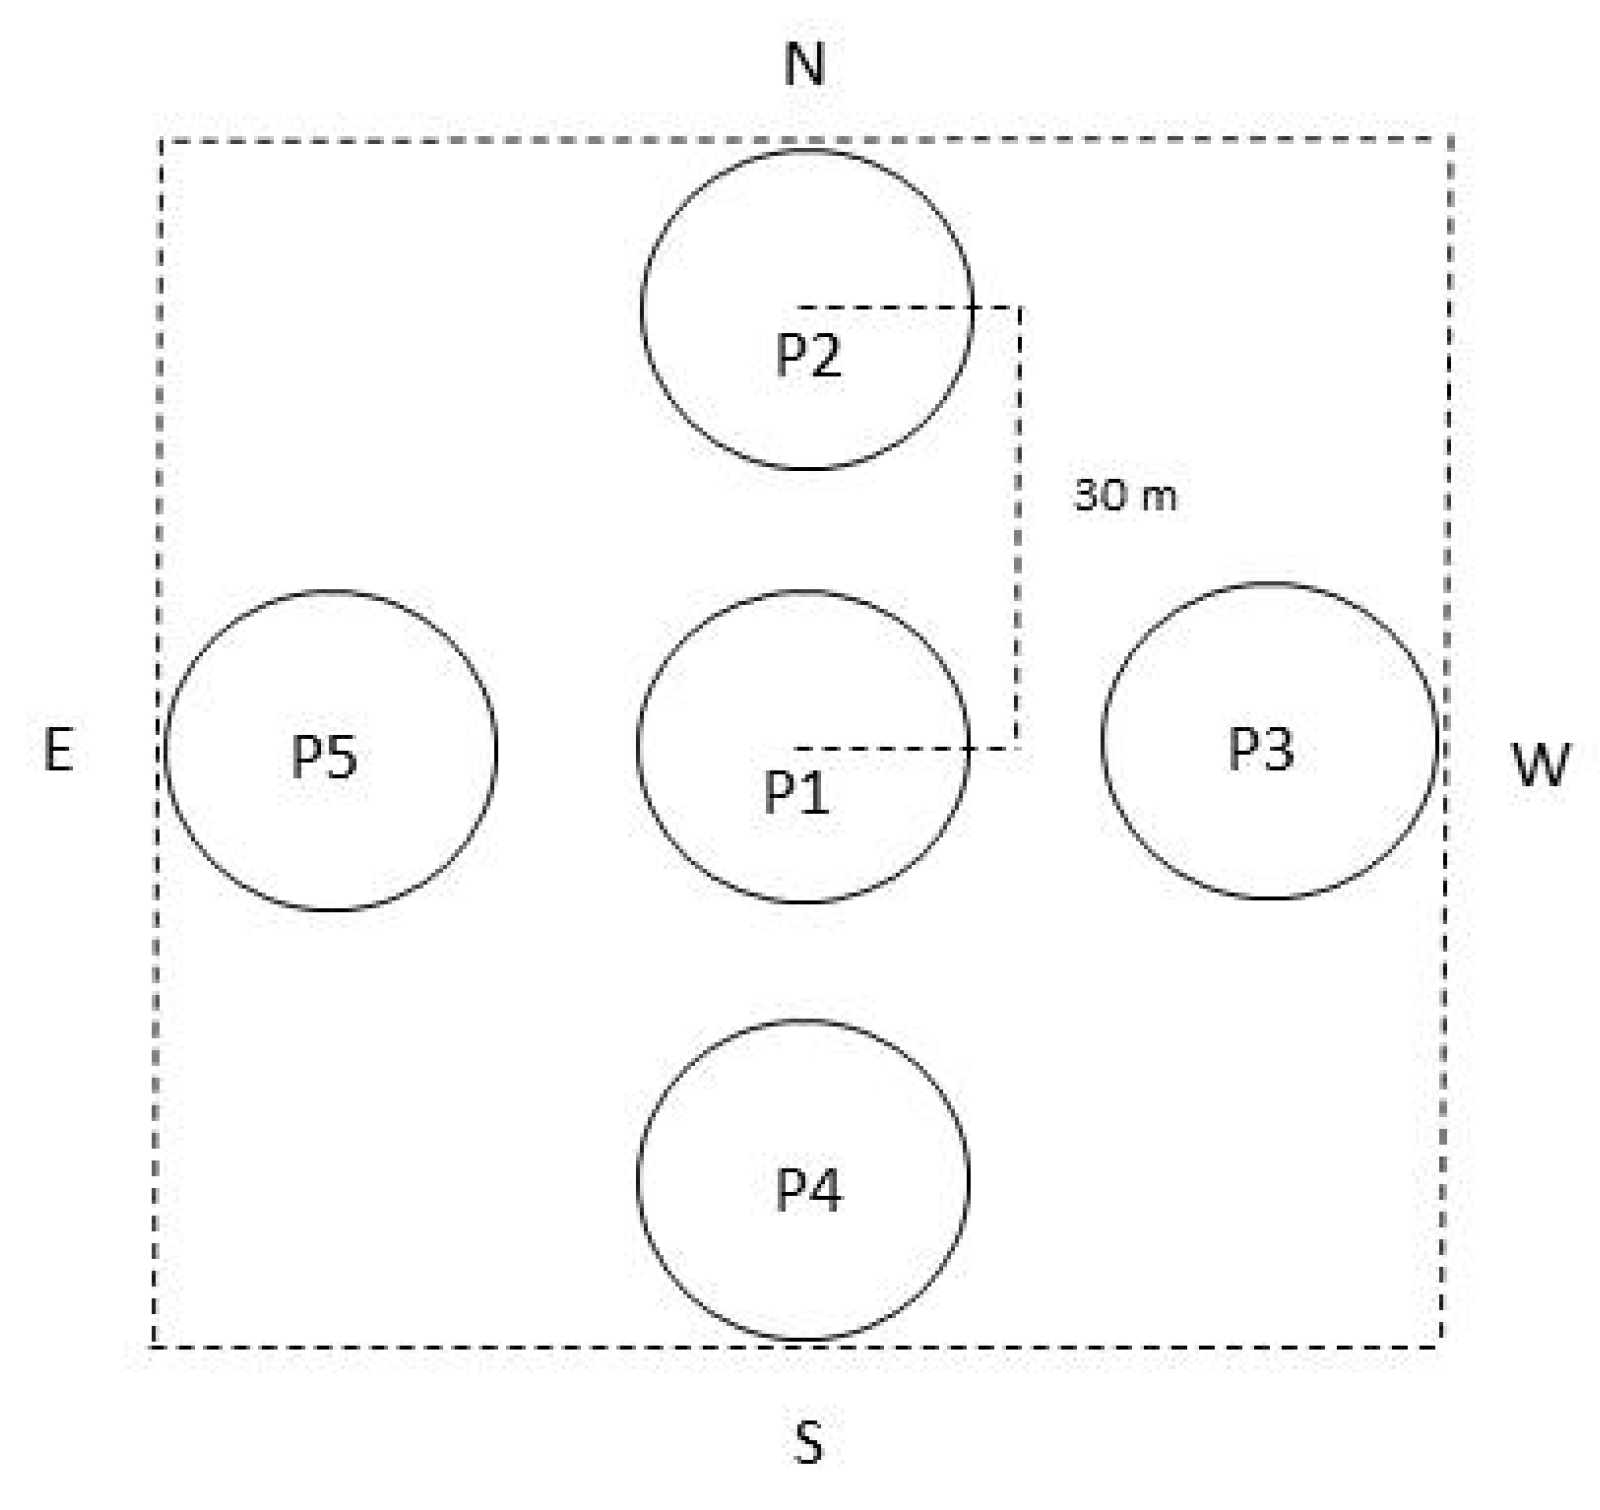
2.1. Study Area

The surveys were carried out in the Postăvarul Massif in the Romanian Carpathians (45°38′20″ N, 25°36′17″ E and 45°37′59″ N and 25°35′54″ E). The growing conditions of the stands were specific to south-eastern slopes, with inclinations of between 25 and 37°, on limestone substrates and in rendzinic soils. The climate of the studied area, according to the Köppen–Geiger map for climate classification, was Dfb (warm and humid continental), with a mean annual temperature (MAT) of around 7.8 °C and a mean annual precipitation (MAP) of around 750 mm. The edaphic volume of the soils was between 10 and 40 cm and served to differentiate the productive potential of the site conditions in the researched stands in two productivity levels: medium (average height (i.e., hg), between 18 and 22.5 m) and high (i.e., hg > 22.5 m).
Field measurements were carried out in 2012 in six sample plots (SPs), all covering 1.5 ha, located in 100-year-old black pine monocultures. These stands had not been subjected to silvicultural interventions. Each SP consisted of five permanent circular subplots (P1–P5 in Figure 1), each with an area of 500 m2, arranged in the directions of the cardinal points [15]. The SPs were surveyed periodically (every 3 years) between 2012 and 2021. The circumference, height (h), crown length (cl), and crown diameter (cw) were measured in all (508) trees in the SPs. The tree diameter (d) was calculated from the circumference. Table 1 shows the values of these parameters for the six SPs in 2021.

2.2. Crown Defoliation

Defoliation was estimated visually, based on the loss of needles in the tree crown compared to a reference tree (i.e., healthy tree, with full foliage, 0% defoliation) of the same species in the vicinity [15]. Defoliation intensity was recorded in 5% steps, ranging from 0% (no defoliation) to 100% (dead tree) [12]. The defoliation values were grouped into five classes: 0––up to 10%; 1––slight, >10%–25%; 2––moderate, >25%–60%; 3––severe, >60%–<100%; and 4––standing dead, 100% [43]. Assessments were carried out on all the trees in the subplots. During the period of analysis (i.e., 2012–2021), there was no damage to the trees from biotic or anthropogenic factors, so the defoliation was not influenced by these factors. The assessment was carried out every 3 years from 2012, at the end of August each time.

2.3. Radial Growth

Radial wood cores were extracted from trees in the SP buffer zones that had similar site index values (i.e., hg = 18.2 to 19.4 m), as they were considered to be representative of the radial growth trend over the last 30 years (i.e., 1992–2021). Cores were extracted in 2021 at the end of the growing season. However, strictly defoliation data collected from 2012 to 2021 were used for data analysis. The trees from which the cores were taken were visually analyzed for physical damage, and they were selected from all defoliation classes and from the mean-diameter category of each subplot. Defoliation was estimated and size was measured in these sample trees during the same period (i.e., late August). Two cores were extracted from each tree. Annual tree-ring width (RW) was measured using a digital positiometer with an accuracy of 0.01 mm. Interdating of the radial growth series was performed statistically using COFECHA software [44]. Cores from 91 sample trees were selected and retained. These 91 trees provided a tree RW determination error of 10%, with the error at the growth-year level within the 2012–2021 range being 5%. An individual tree RW series was produced and standardized to a linear equation for the period of 2012–2021.

2.4. Data Processing

2.4.1. Defoliation Explained by Biometric Variables (at Tree Level and Stand Level)

The tree volume (v) was determined using the equation applied at the national level for forest species in Romania [45]:
log v = a0 + a1 log d + a2 log d2 + a3 log h + a4 log2 h
In Equation (1), the regression coefficients had the values a0 = −4.01698, a1 = 1.96342, a2 = 0.01241, a3 = 0.57848, and a4 = 0.094783 (for black pine).
At level trees, the defoliation values were correlated with the tree biometric parameters (i.e., d, h, v, cw, and cl), as well as the slenderness index (h/d) and form factor (f) [46]. We assumed that each subplot contained information on the stand structure. Therefore, to analyze the correlation between defoliation and stand structure, the mean values of the biometric parameters were determined at the subplot level, including the basal area (G), stocking degree of the stand (SSD), quadratic mean diameter (dg), mean height (hg), tree volume (v), mean tree crown diameter (cwg), and mean tree crown length (clg). In the relationship between defoliation and the structure of the stands, these indicators were considered to be independent variables. To determine the SSD, the normal basal-area values (i.e., the values used for maximizing production) were taken from the production tables for the black pine species used in Romania [42]. The defoliation trends, related to variable characteristics such as tree size, stand structure, or climatic conditions, were explained via univariate linear regression only, such as the defoliation equation (DEF) in relation to MAT and the tree RW equation in relation to defoliation (equation RWD). A Fischer test was used to investigate the variability in defoliation under site conditions with different site index values (i.e., hg = 18.2 to 19.4 vs. 25.3 m). At the stand level, the defoliation values were distinctly highlighted on the two productivity levels. Also at the stand level, defoliation was analyzed in relation to the coefficient of variation in tree height, with the difference being insignificant, reason for which the results was not provided.

2.4.2. Relationship between Radial Growth and Crown Defoliation

The radial growth (i.e., RW) measured between 1992 and 2021 for the 91 trees was factored into the calculations. Thus, a growth series characterizing the radial growth of the pine trees in stands located in sites with a site-index between 18.2 and 19.4 m was obtained. Based on the obtained growth series, an equation (RW) was generated to estimate radial annual growth for the study period 2012–2021, for which tree health data were available. The diameter annual growth of stands over the study period (i.e., 2012–2021) was based on the radial growth estimated by equation (RW) (i.e., double the radial growth).
Two series of growth versus defoliation were conducted to estimate the radial growth trend based on defoliation, one at the 2012–2021 level and another at the 2021 level. The first series uses the defoliation percentages observed at the inventory year level between 2012 and 2021. The second series uses the defoliation percentages observed for trees in the year 2021. An F-test was used to compare the two series. The equation (RWD) expressing the relationship between radial tree growth and defoliation is based on this second series. This series shows the variation in radial growth in response to different percentages of tree defoliation produced under the same climatic conditions (i.e., specific to 2021). It has the advantage of separating the effect of defoliation on radial growth from the effect of climatic conditions in the inventory years (which is important as these conditions differed from year to year). Thus, the equation (RWD) predicts radial growth as an effect of defoliation under the same climatic conditions.

2.4.3. Growth Driven by Climate

The climate data were retrieved from the Meteoblue online data archive [47] (accessed 17 March 2022). The climate parameters MAT and MAP were used (see Supplementary Materials Table S1). To eliminate age-related trends in annual ring width and analyze it using climate data, the measured RW values were transformed into an A RW index (RW%). The increasing trend of defoliation and the mean annual temperature in the last decade allowed for the generation of an equation (DEF) that estimates the defoliation of stands based only on the mean annual temperature. The model is based only on the values of the two variables (i.e., defoliation and MAT) known between 2012 and 2021.

3. Results

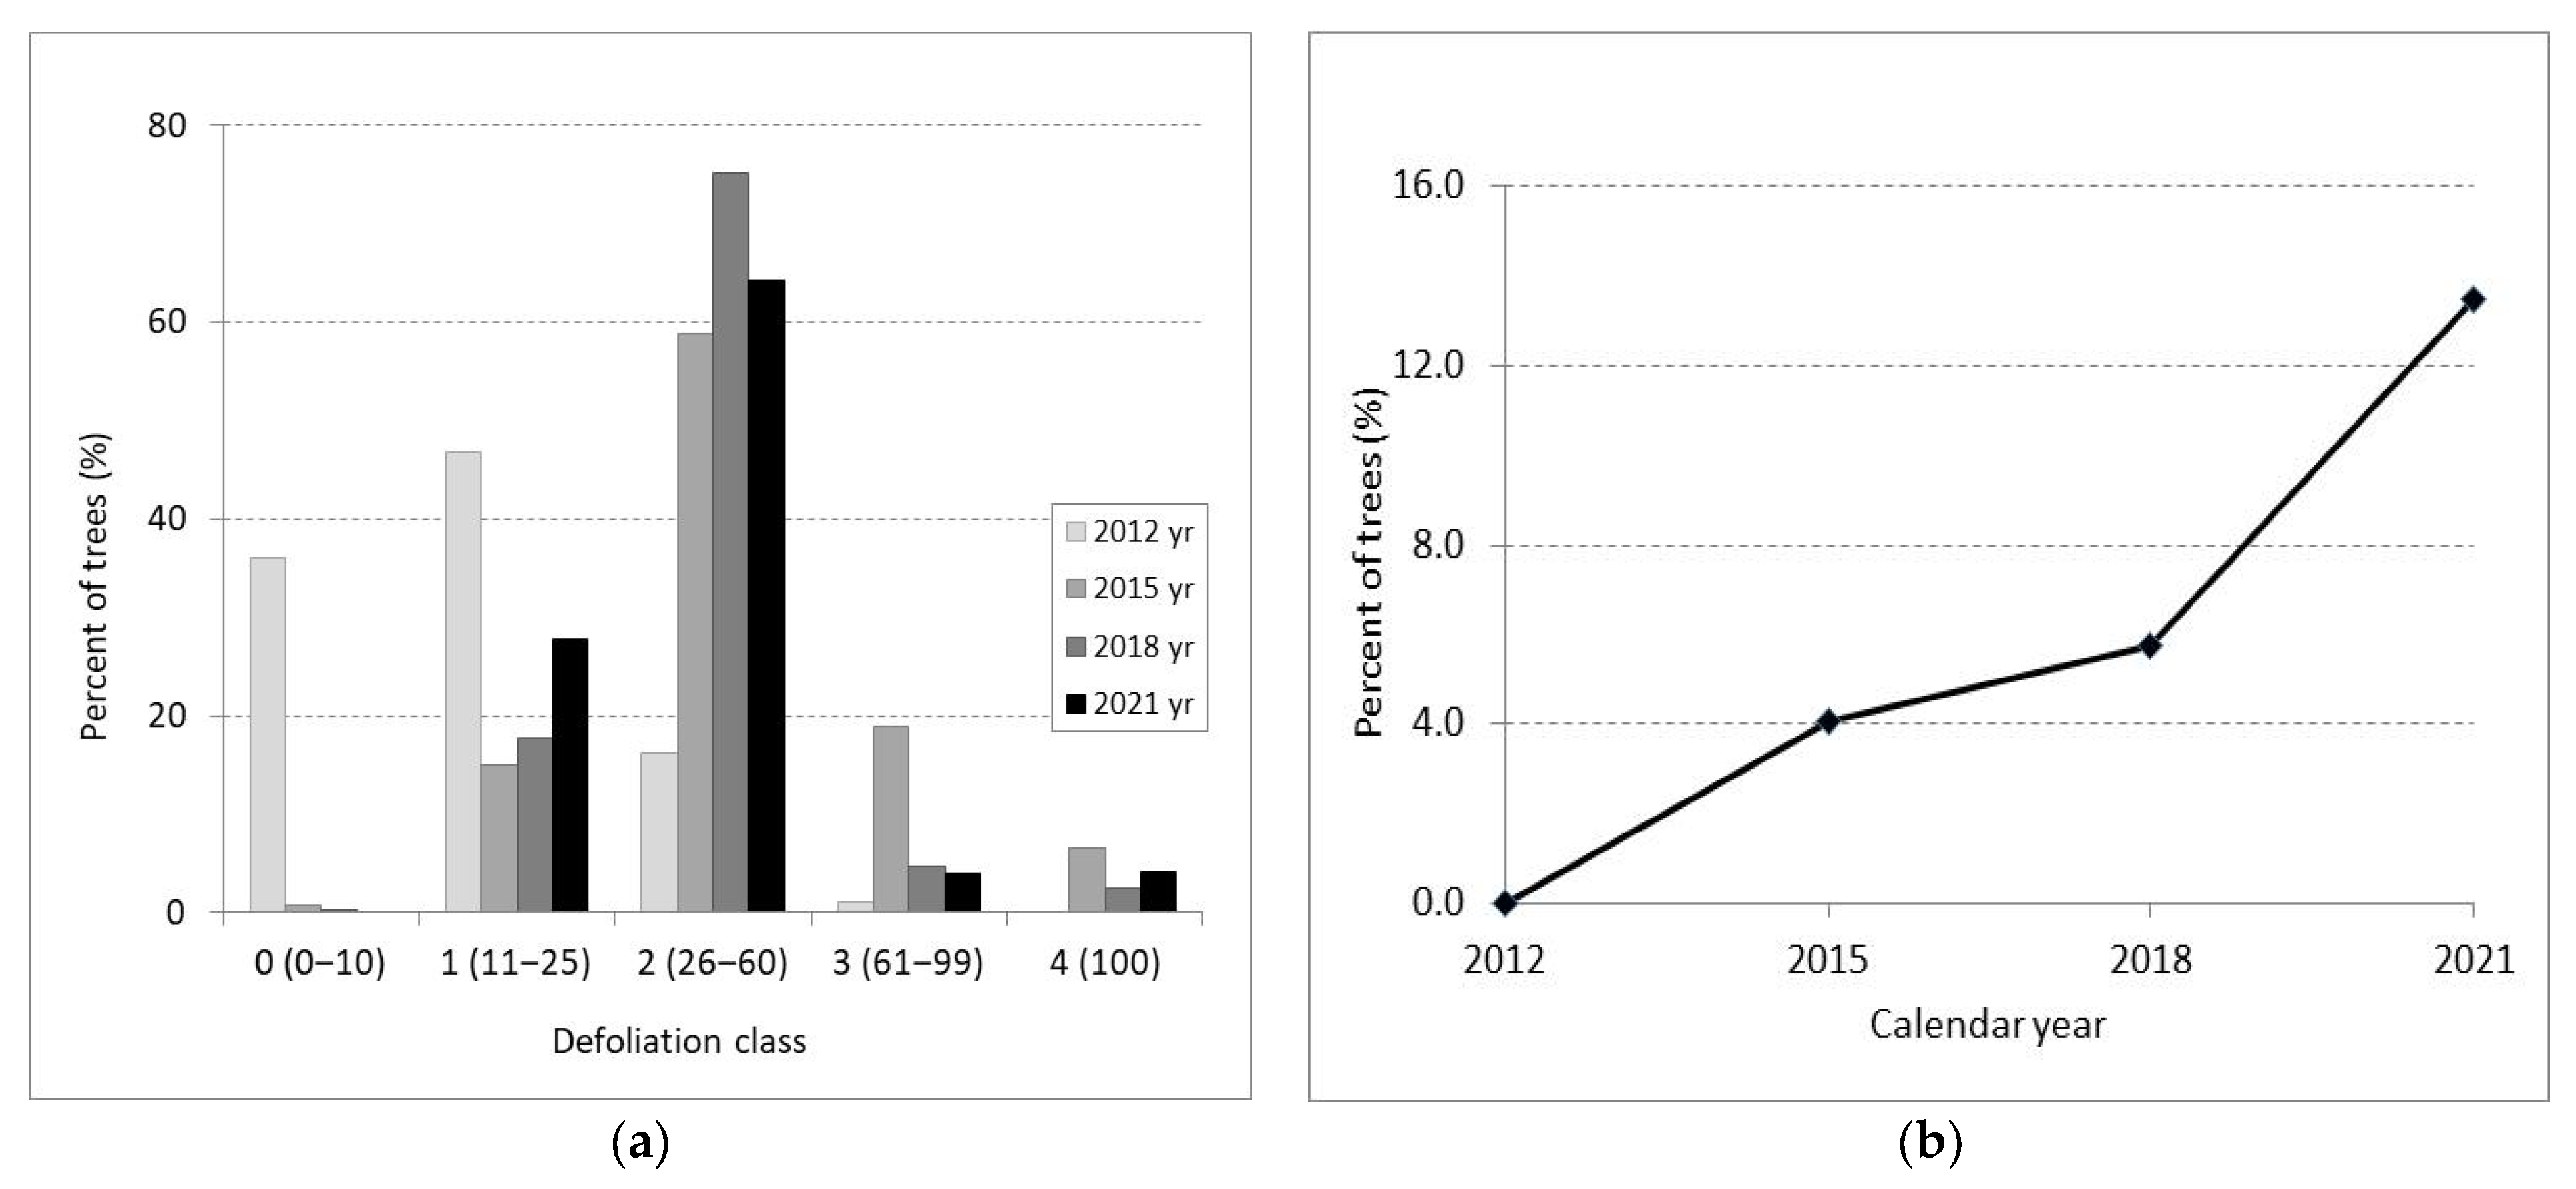
3.1. Crown Defoliation

In 2012, 36% of trees showed no defoliation. Most trees exhibited slight defoliation (47%), with only 1% having severe defoliation. After 2012, tree defoliation increased, with all trees becoming affected and most (64%) showing moderate defoliation (Figure 2). By 2015, standing dry trees experienced the highest increase (around 6%); however, this figure gradually decreased over time, reaching 4% in 2021. Thus, in the 2012–2021 period, the percentage of downed trees on the ground reached 13.5%. These were windthrown trees of different defoliation classes, including dead trees. The defoliation value, characterized by the six surveys in which the assessment was carried out, is 38%.

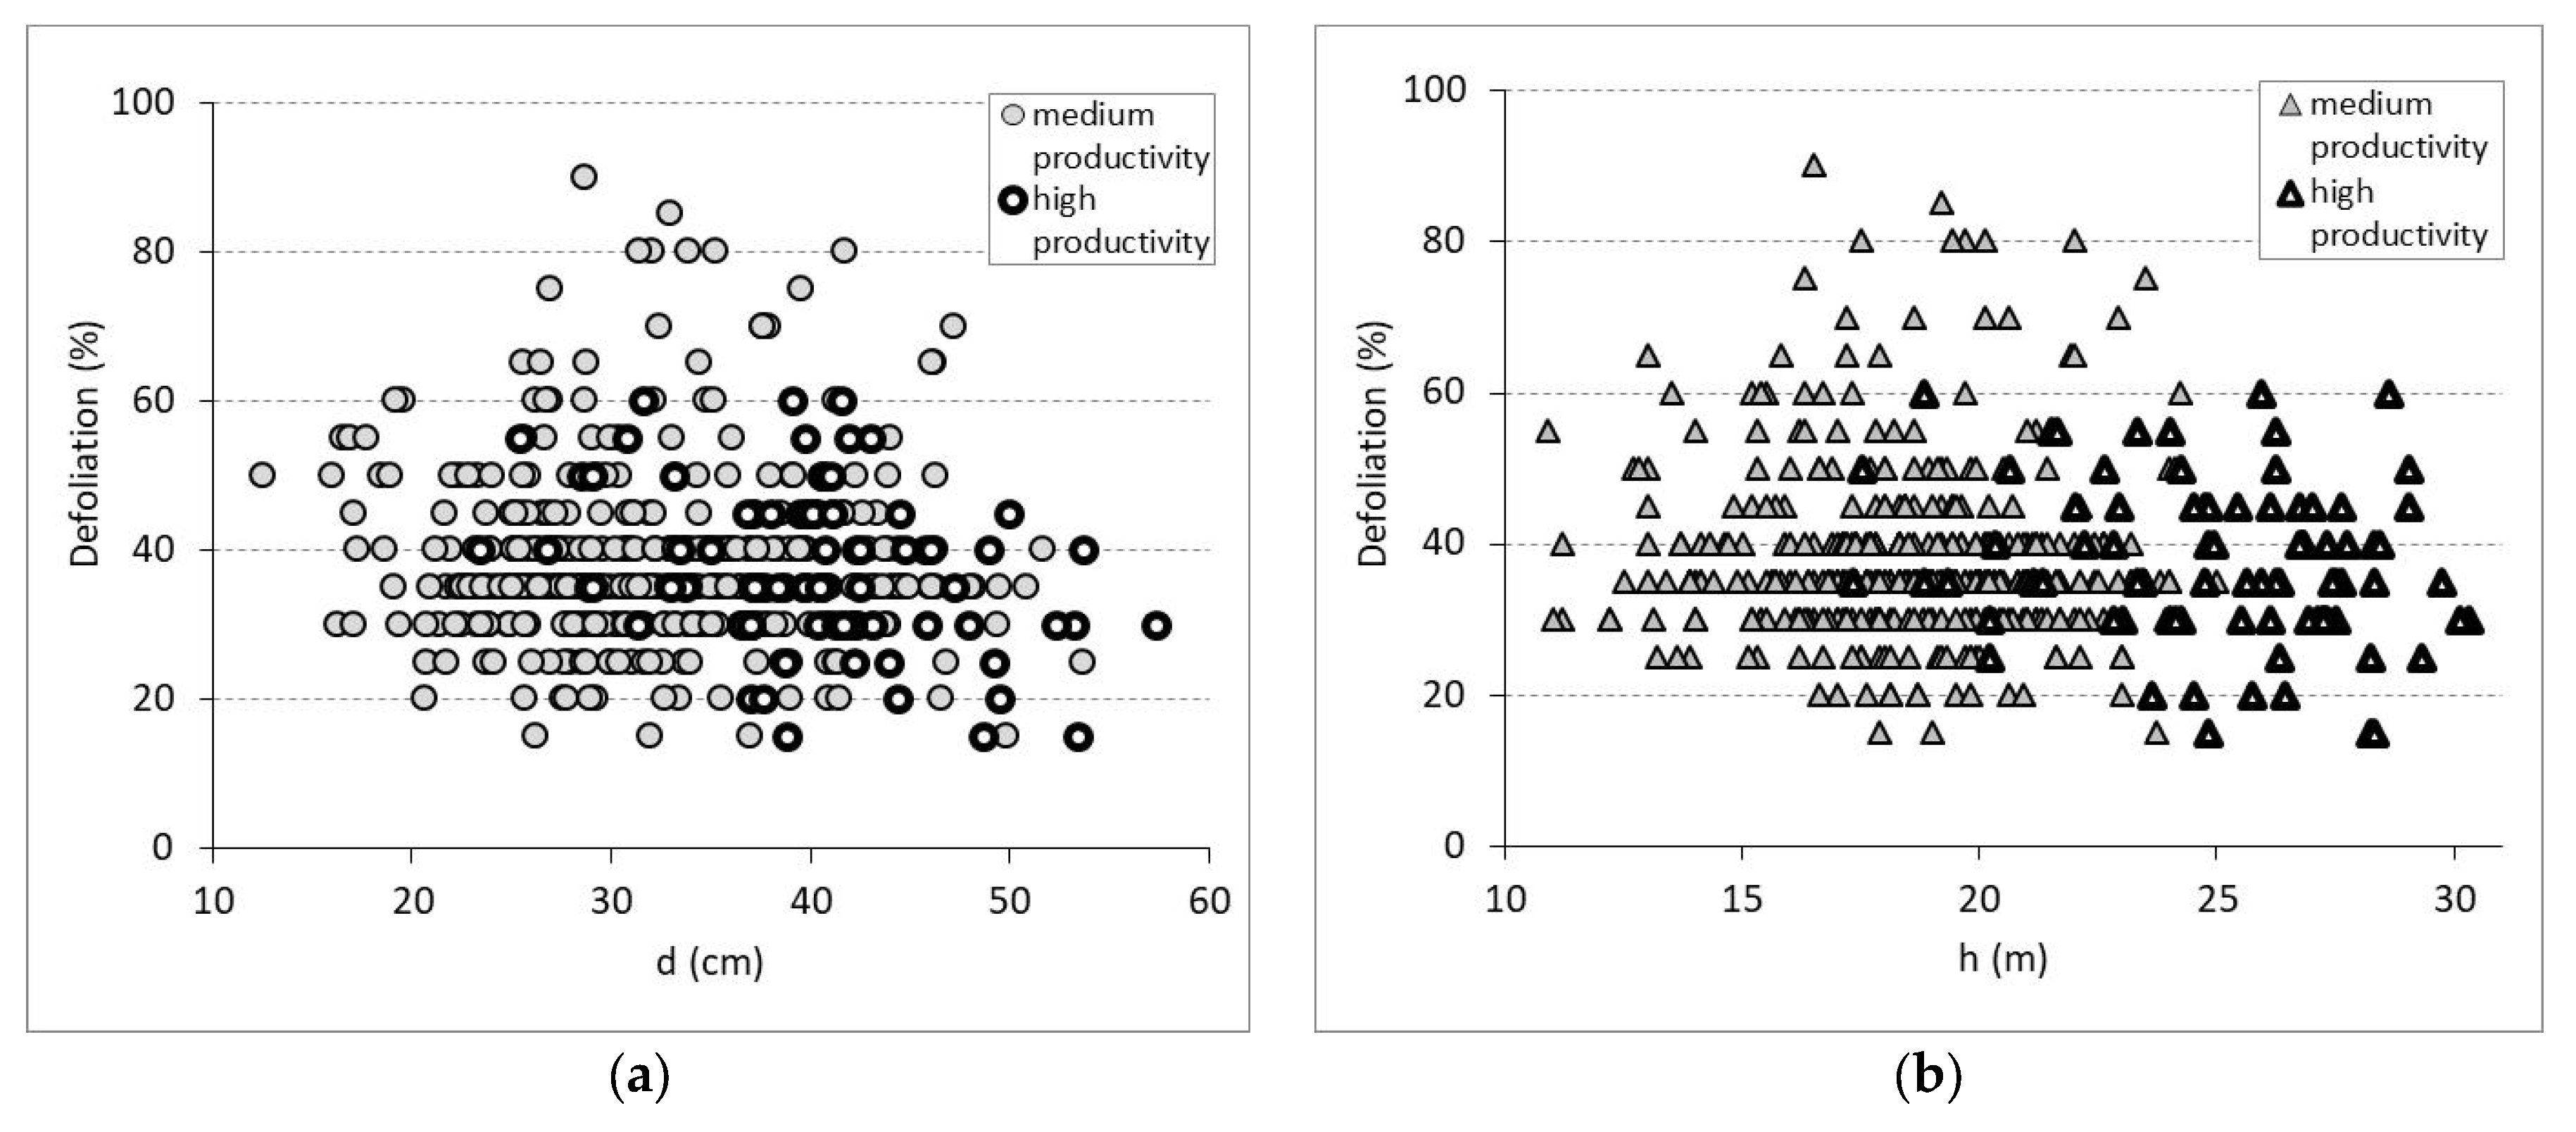
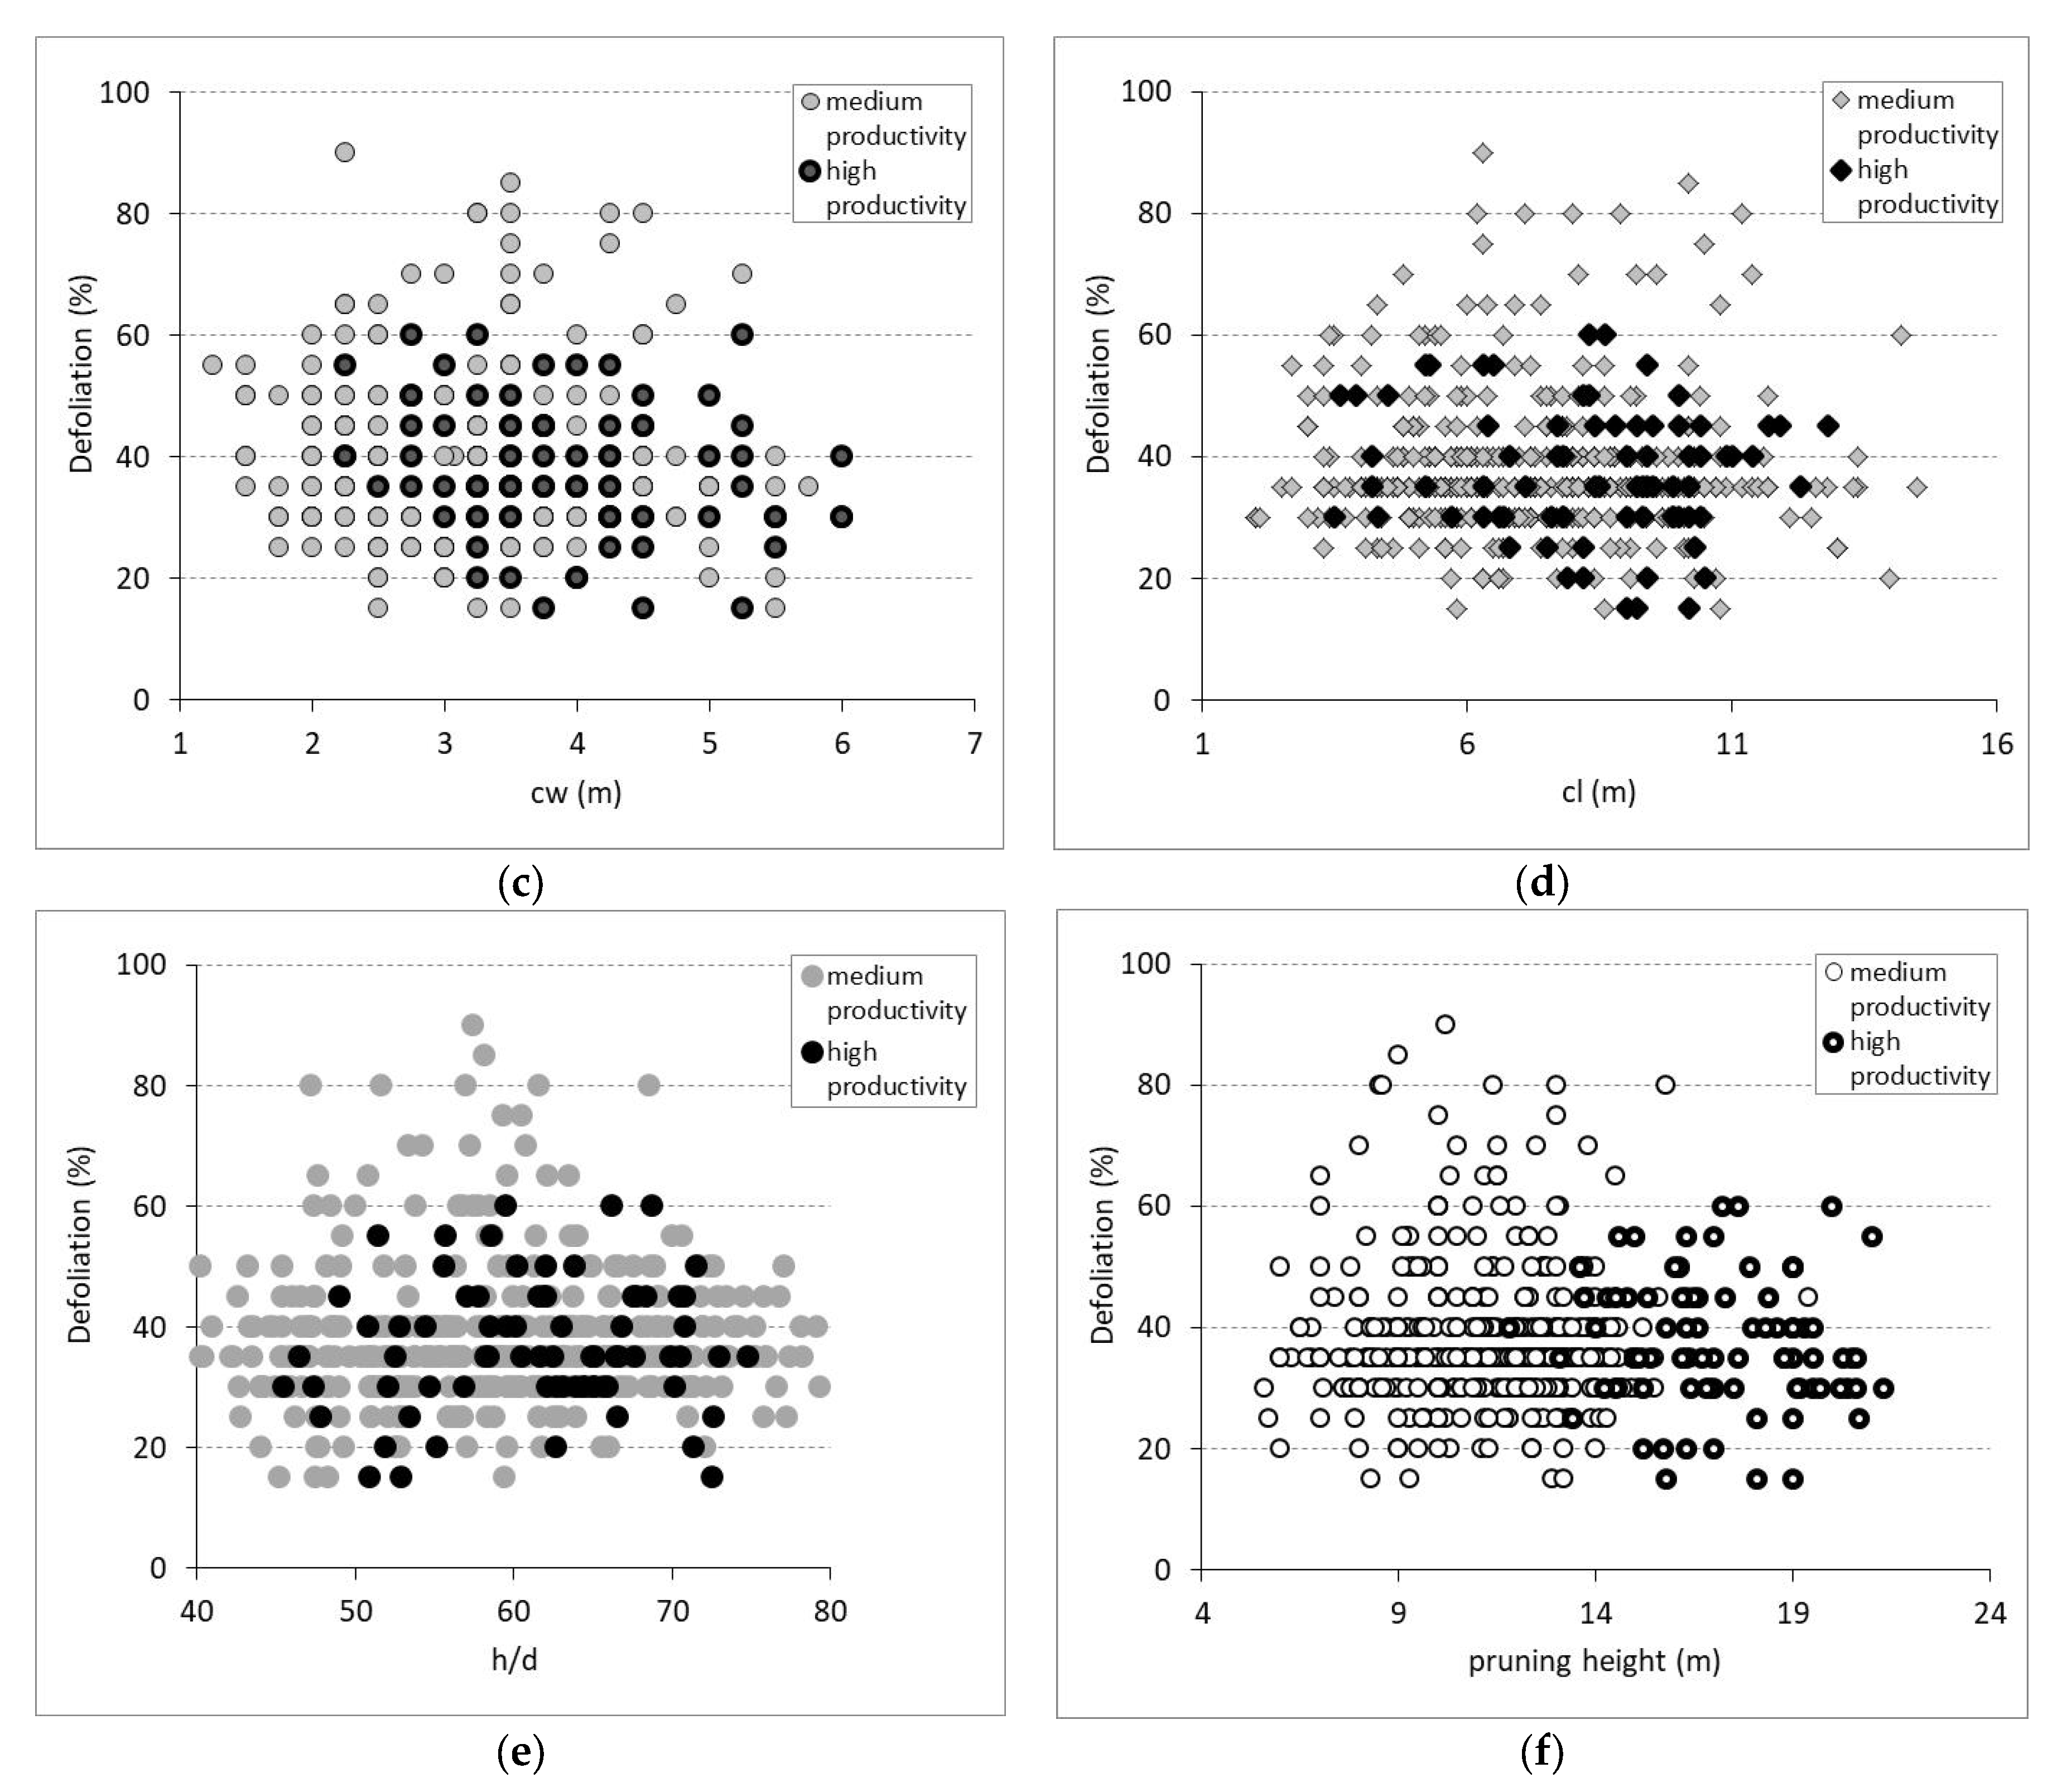
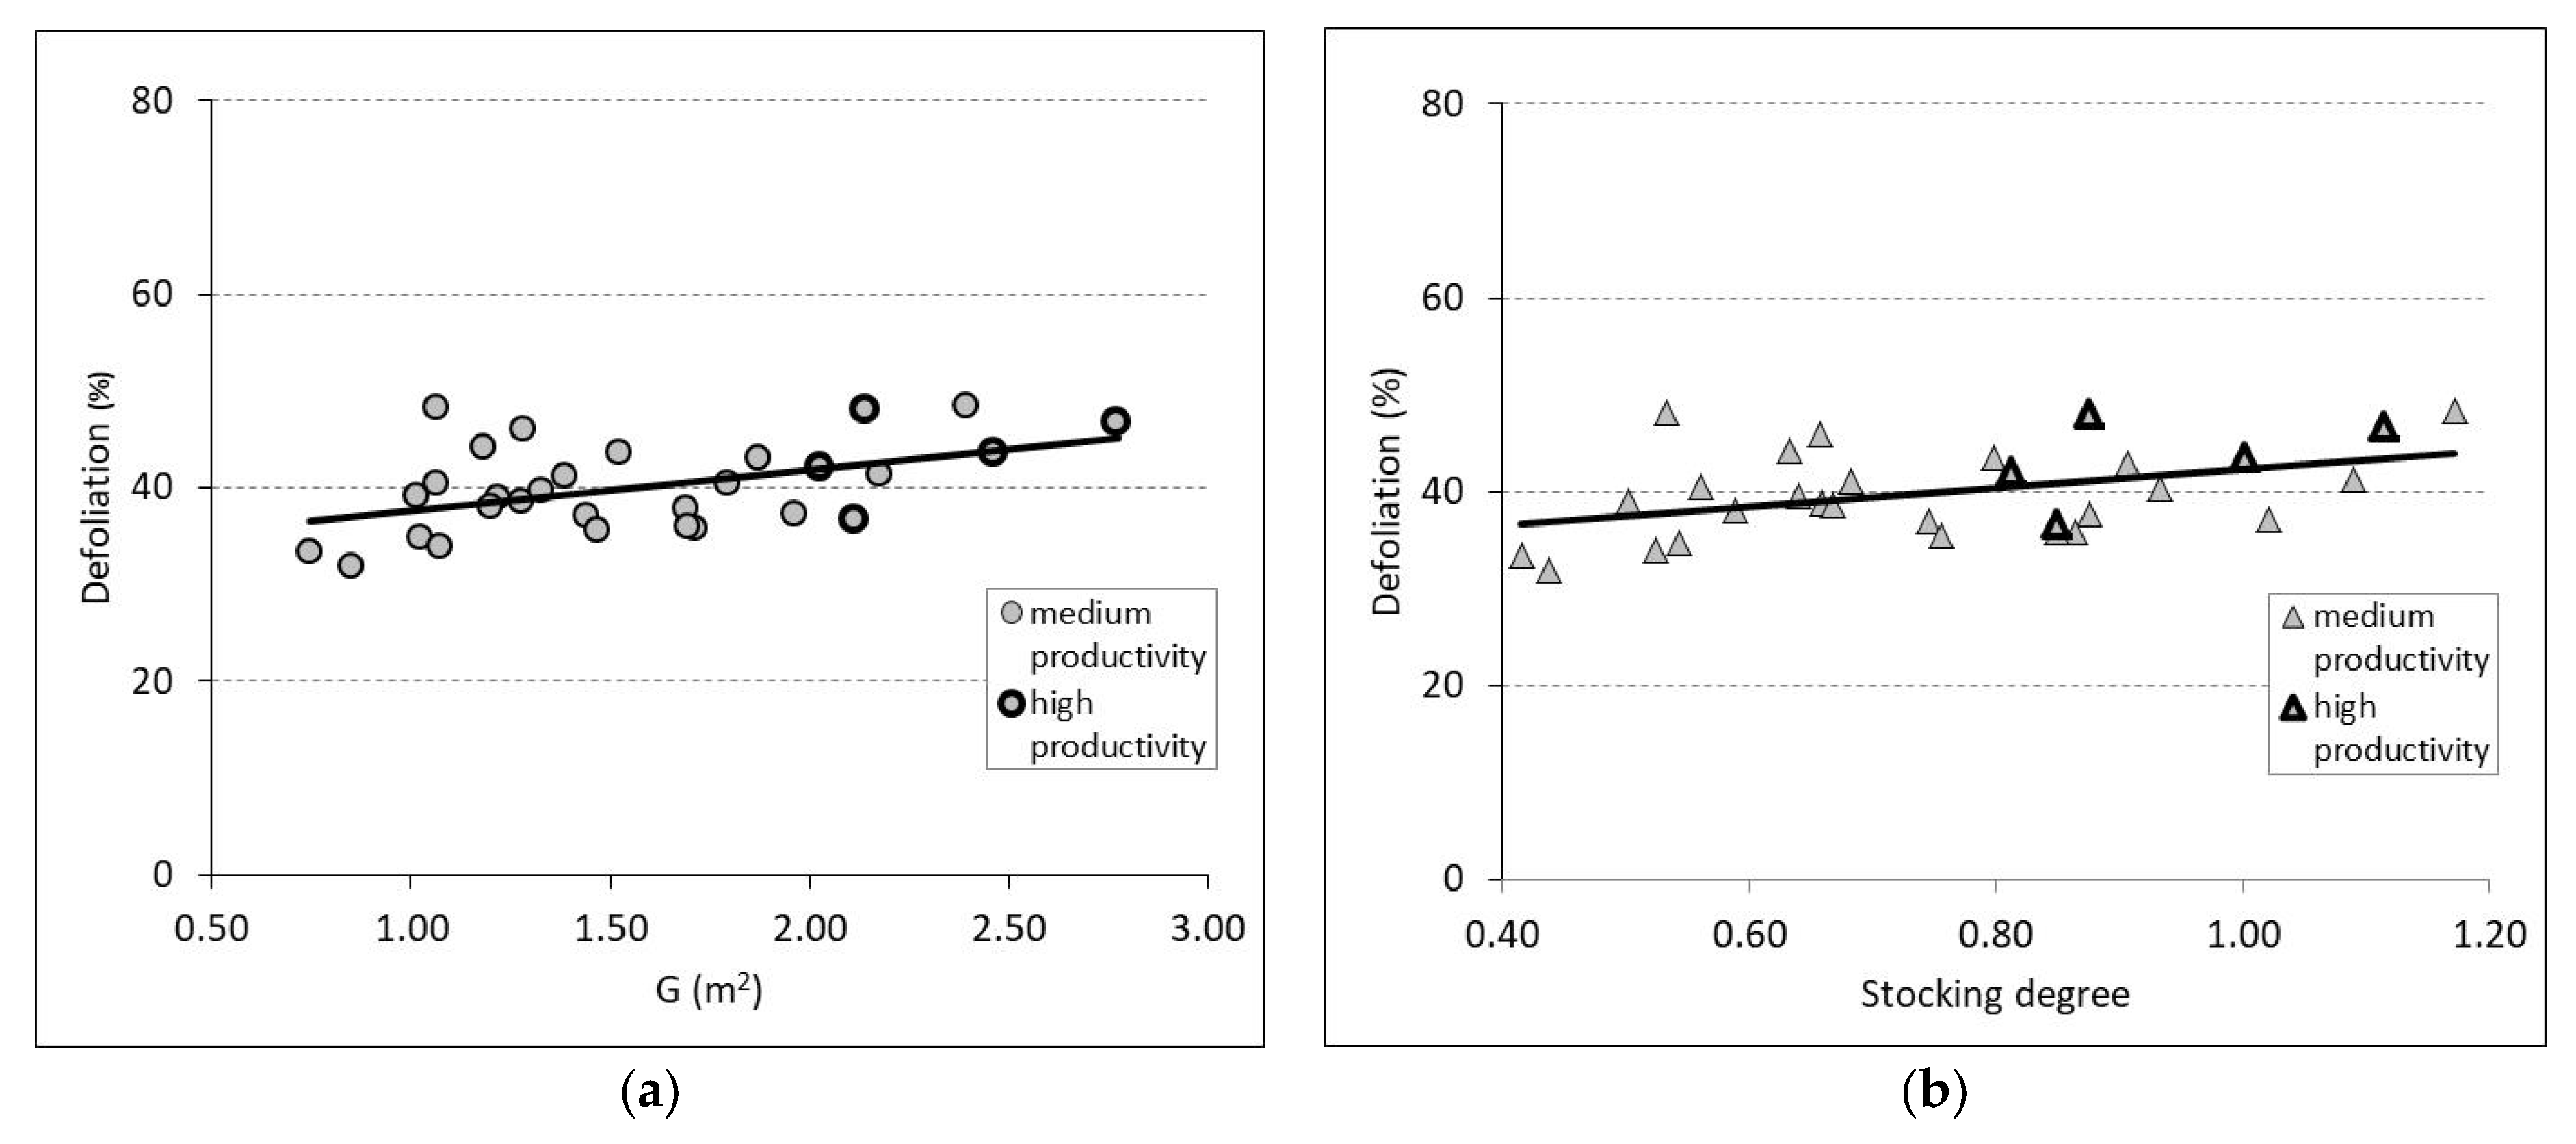
3.2. Defoliation and Biometric Parameters in Trees and Stands

Defoliation did not differ significantly depending on diameter or height. In forest sites where hg is between 18 and 25 m (Table 1), the correlation coefficient values between defoliation and tree biometric parameters (i.e., d, h, cw, cl, v, h/d, and f) is within the range of –0.08 to +0.06. The different site productivity levels (i.e., medium vs. high) did not significantly affect tree defoliation (Figure 3).
At the level of the stand, trends indicating an increase in defoliation were determined in relation to each biometric indicator (i.e., G, SSD, dg, hg, cwg, clg, and v). The correlations were significant for all indicators. Defoliation was most strongly related to dg (R2 = 0.249 and p = 0.005), and the weakest relation was to hg (R2 = 0.152 and p = 0.033). Table 2 presents the results of the linear regression between the stand biometric parameters and defoliation, whereas Figure 4 illustrates the relationship between defoliation and the parameters G and SSD. At the stand level, the different yield potentials of the site conditions (i.e., medium vs. high) did not cause a significant difference in defoliation.

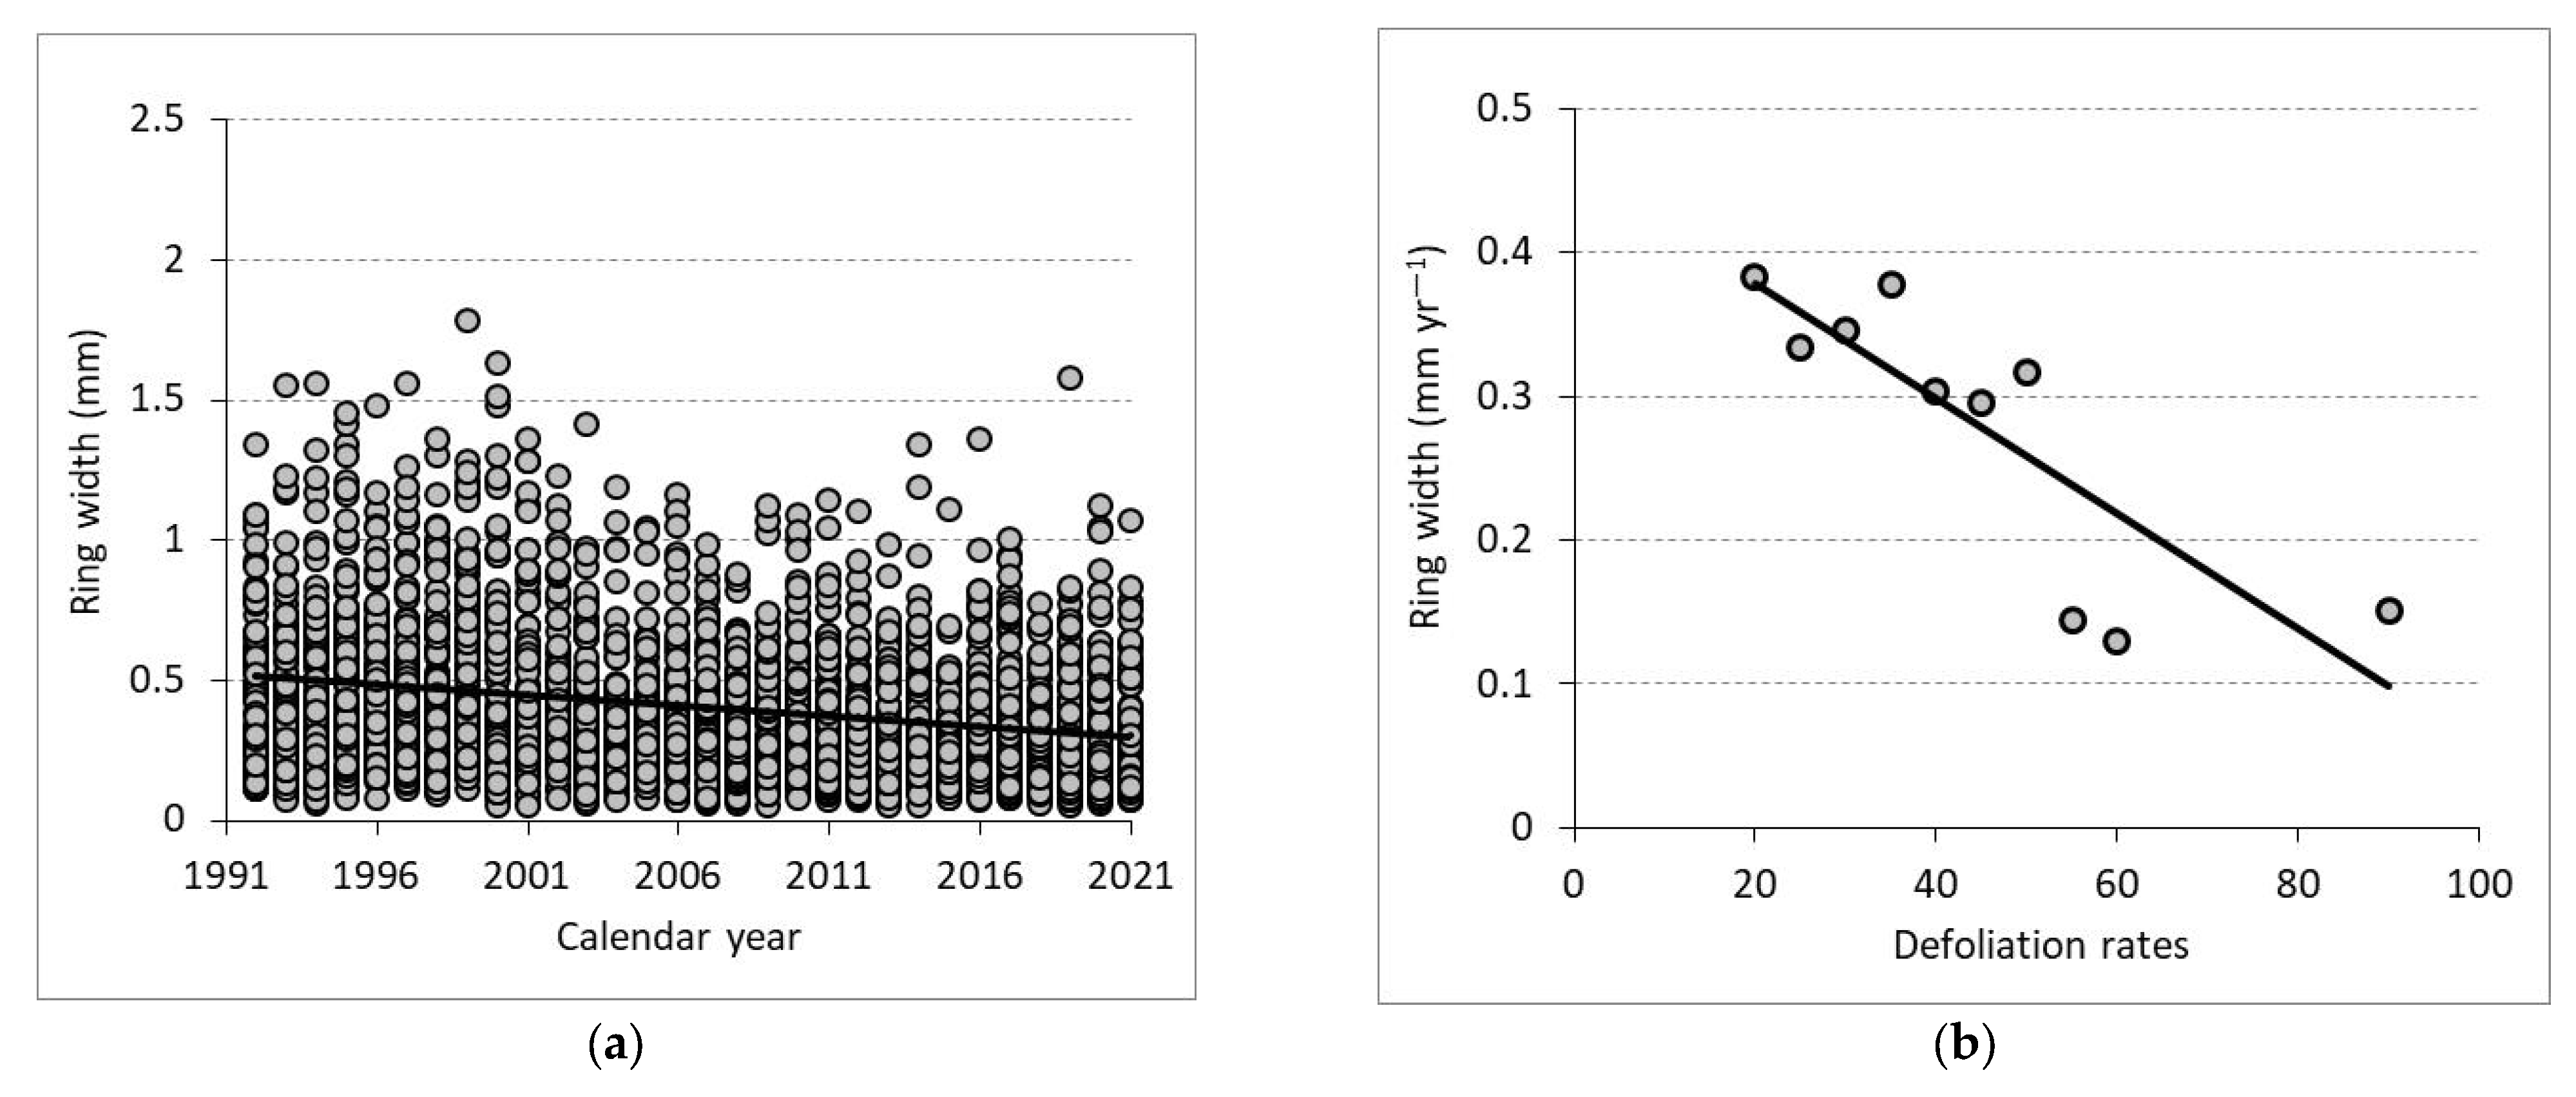
3.3. Radial Growth and Crown Defoliation

Radial growth and diameter growth of stands. The radial growth of the trees over the last 30 years (i.e., 1991–2021) has continuously decreased to an annual average of less than 0.5 mm/year (Figure 5a). This was accompanied by a continuous decline in the health of the trees, possibly due to defoliation, which has increased year on year. Increased defoliation has also led to a trend of reduced tree RW (Figure 5b).
Between 2012 and 2021, the mean annual radial growth was similar from year to year, showing a variation coefficient of 11%. However, the level of variation in radial growth at the level of trees in the sample plot, not at the level of years in the study period, was higher. Thus, the coefficient of variation in the radial increment of the 91 sample trees from which cores were extracted was 48%. Because the different site productivity potentials did not significantly influence the radial growth rate, and the age of the trees was the same, the differences in growth between the trees can be explained by their different percentages of defoliation and possibly by the structural conditions. For 2012–2021, the trend in the radial growth of trees could be expressed by a simple linear regression (RW, Table 3). The confidence interval of the theoretical regression coefficient b was between −0.005 and −0.009. The equation (RW) estimated the mean annual value of radial growth for each year from 2012 to 2021 with a RMSE = 0.0379. The estimated mean annual radial growth over the period of 2012–2021 is 0.33 mm yr−1, leading to a mean annual diameter growth of 0.66 mm yr−1. The confidence interval limits for the equation (RW) for 2021 ranged from 0.197 to 0.404 mm. Because the radial growth used in the analysis was extracted from the mean trees, the growth of 0.66 mm yr−1 was an annual diameter growth for 100-year-old pine stands and the respective site conditions.
The relationship between radial growth (i.e., RW) and defoliation (i.e., D). The most defoliated trees showed the lowest radial growth. The value of the correlation coefficient between radial growth (i.e., tree RW) and defoliation (D) is significant. The relationship between these variables can be characterized by the equation (RWD):
RWD = −0.004D + 0.459
Equation (2) estimated the radial growth by defoliation category with a MAE error of −0.0058 and a RMSE error of 0.0652, and explained 60% (p = 0.008) of the variation in radial growth with respect to tree defoliation. In Equation (2), the radial growth (i.e., RWD) values in 2021 correspond to the defoliation percentages (i.e., D) of the 91 trees surveyed in 2021. Even at 90% defoliation, the equation estimated a growth of 0.099 mm yr−1. Thus, even at 90% defoliation, the trees could still accumulate growth at 0.099 mm yr−1 (i.e., a growth in diameter of 0.198 mm/yr) over the entire growing season. Because the sample trees were in the mean-diameter category, the growth of 0.198 mm yr−1 is equivalent to the current annual diameter growth of a stand of the same age (i.e., 100 years) with 90% defoliation and has the same site conditions as the surveyed stands. Using the observed defoliation percentages for the years 2012–2021 led to an equation that differs from Equation (2) only in the value of the constant (0.458 instead of 0.459). Thus, the radial growth estimated by the two equations does not differ significantly (F = 0.011 and F crit 4.413 for p 0.05).

3.4. Radial Growth and Climatic Conditions

The reduction in RW% (i.e., tree RW expressed as a percentage or the radial growth index) could not be explained over the entire time frame (i.e., 2012–2021) by the climatic conditions. The values of the correlation coefficients between the RW% and the climatic conditions (i.e., the correlation coefficient between the RW% and the MAP, and between the RW% and the MAT) were insignificant, with values of 0.48 and –0.02, respectively. However, a strong correlation between RW% and MAP was determined for a period of, at most, 5 years between 2012 and 2016 (R2 = 0.90 and p = 0.013)—the period following the 2012 spring drought. However, the 2012 drought was a sequel to the 2011 drought. In 2011, MAP reached 618 mm (see Supplementary Materials Table S1), compared to an average of 745 mm for the 2012–2021 period. Additionally, in March 2012, rainfall stood at 28 mm, compared to the average of the last 30 years (40 mm), and rainfall in the summer of 2012 reached 165 mm (compared to the 30-year average of 252 mm). Results show that after the droughts of 2011–2012, tree growth became strongly influenced by the amount of rainfall, regardless of the soil volume. The year 2016 was the wettest in the 2012–2021 period, with a MAP recording of 849 mm. This was followed by the 2019 drought, wherein there was a reduced MAP value of 674 mm, but this year yielded the highest MAT value recorded in the last 30 years (8.5 °C). After the drought of 2019, the RW% returns to being dependent on MAP. Correlation coefficient values between RW% and MAT) are insignificant.
The correlation of defoliation with MAP was also not significant (R2 = 0.115 and p = 0.661). However, a significant correlation was determined between defoliation and MAT (Eq. DEF from Table 4), as both variables have a positive upward trend. Of course, this relationship characterizes black pine under the site conditions specified (i.e., south-eastern slopes, with inclinations 37°, on limestone substrates with rendzinic soils).
Compared with the years 1992–2001, on average, MAT increased between 2002 and 2011 by 0.4 °C and between 2012 and 2021 by 1.2 °C. The DEF and RWD equations indicated that an increase in MAT by 0.5 °C could produce an increase in the percentage of defoliation from 38% (as it was in 2021) to 59%, which would mean a reduction in the RW to 0.22 mm yr−1. With a temperature increase of 1 °C, the DEF equation estimated an increase in defoliation of up to 78%.

4. Discussion

4.1. Crown Defoliation

The period of 2012–2021 was a critical one for black pine outside its natural habitat. Over this time period, tree defoliation increased from 17% to 38% (with dead trees being excluded in the calculation of the mean defoliation), culminating in 13.5% of the inventoried trees drying out (Figure 2). In other research on pine trees in the Carpathian Mountains of Romania, defoliation values between 24.9% and 33.8% were recorded, with Scots pine being the least affected. Spruce was observably in poor condition, with 42.9%–46.6% of the trees being damaged, and fir with 46.0%–50.9% damage in defoliation classes 2–4 (i.e., moderate, severe, and standing dead) [48]. Tree crown damage over time has also been observed in other forest species (e.g., spruce and beech) in the Southern Carpathians of Romania, and was attributed to drought and highly acidic precipitation [49].
Increased browning in the tree crowns of black pine in 2012 was likely caused by the severe drought in that spring. Studies on the basal-area increment in black pine have shown the favorable effect of spring rains on it [50]. The 2012 spring drought caused increased defoliation in pines in other parts of Europe, including the Keszthely Mountains of south-western Hungary [51] and Mediterranean lowland pines [14]. The results from the large-scale, representative, transnational ICP Forests assessments (Level I) carried out in 2020 show a 6.3% increase in the annual mean plot defoliation of Austrian black pine, compared to an increase of 4.4% for Scots pine [43].
Tree crown condition is the result of tree age, drought, ozone levels, and exceedances of critical levels of acid deposition [48]. Studies on other forest species (Norway spruce, European beech, Scots pine, and sessile oak) have also exhibited the strong effect stand age has on defoliation [52], with older trees being the most susceptible to drought [53] when the population has a low genetic variability [35]. In the sample plots, at the level of individual trees, defoliation did not significantly correlate with tree size (i.e., d, h) or crown dimensions (i.e., cw and cl) (Figure 3). Other studies on the relationship between crown dieback and tree diameter [54] show an increase in damage to trees with smaller diameters. On high-productivity sites (i.e., SP4 in Table 1), it is possible that trees with larger diameters (i.e., larger than the average diameter of the stand, e.g., 40.37 cm) are more able to exploit the soil edaphic environment at depth, whereas those trees with smaller diameters are more sensitive to water deficits at the soil surface, where they have more extensive root systems. The low number of trees in the investigated high-productivity stand (i.e., 81 trees) did not allow us to draw a firm conclusions in this respect. Thus, these results characterize the studied stands, which have the aforementioned specific site and stand structure conditions. The results cannot be generalized.
Tree density and growing stock volume affected the defoliation of black pine at the stand-level. Tree size has been found to be more important than age when considering the climatic effects on the growth of pine trees [55,56]. Defoliation increased significantly with G, SSD, V, dg, hg, cwg, and clg, with the highest values occurring with the highest values of G, SSD, dg, hg, cwg, clg, and V (Table 2 and Figure 4). The stands with smaller tree sizes had the lowest defoliation values and were associated with microsites with the shallowest soils. When water supply is limited, trees may acclimate through morphological or physiological changes, resulting in drought hardening [54]. On the most productive sites (with hg = 25.3 m), the presence of native deciduous juveniles were quite abundant and tended to form a second story. The presence of a sapling–pole structure, including shrub species, may have accentuated soil and water deficits during dry periods. Additionally, in these stands, smaller black pine trees, despite participating in the dominant story, showed a higher defoliation rate and were more vulnerable. These trees increased the average percentage of defoliation in the stands. It is possible that, during critical periods, the soil, even if it is deep, may not be able to support these stands as well. It follows that defoliation monitoring should be carried out on all trees in permanent stands, regardless of their cenotic position, and not only on the dominant target trees, in order to capture the behavior of trees of different sizes and species in the mix (i.e., the effect of stand structure).

4.2. Relationship between Radial Growth and Defoliation

In the study area, black pine showed a negative radial growth trend (Figure 5a and Table 3). This trend occurred in all of the trees in the analyzed plots, regardless of stand structure or site condition. Recent research on pine stands with site conditions similar to those in our study [34] showed that the significant negative RW trend occurred independently of the vigor class (i.e., dead vs. living) of the trees. However, in 2021, there were significant reductions in the RW% for the most defoliated trees (Figure 5b). Smaller radial increases in trees that experienced greater defoliation have been determined in other species (e.g., spruce and beech) [49]. Thus, radial growth is significantly negatively related to defoliation, with a significant decrease in annual RW when defoliation levels are above 20% [13].
In pine stands (around 50 years old, located on sites moderately affected by sheet erosion), the climate (rainfall and temperature) can contribute to overall tree growth by up to 57% [32]. Tree-growth–climate relationships determined for 1928–2015 under site conditions similar to those in our study [26] showed that black pine grew permanently under conditions of limited water availability, as black pine adapted to these conditions, albeit while being sensitive to the spring precipitation of the current year. A higher MAP led to an increase in RW% in our study, but this correlation between RW% and MAP was maintained over only a short time span (e.g., 2012–2016). This is possibly attributable to the reaction of the trees to the severe drought in the spring of 2012. A similar MAP deficit was also observed in 2018 and 2019, and this also resulted in reduced radial tree growth. Warm years, such as in 2014, also generated an increase in RW%, although only with sufficient MAP. This increase in RW% was not possible in 2015, when there was a deficit of MAP. This year (i.e., 2015) also saw the highest percentage of dead trees (6%)—a year in which the average defoliation recorded by the ICP Forests survey also peaked [43]. The RW% fluctuations show that black pine growth may be affected for years following a dry period. The combination of warm, dry conditions in 2015 significantly increased tree defoliation and, indirectly, tree radial growth. This was most pronounced in the high-density stands. Increased defoliation implicitly leads to a reduced RW% in trees. Even with reduced growth over a long period of time, pine stands can withstand critical periods and remain viable, demonstrating a high ability to acclimate to changing environmental conditions.
The estimates of tree defoliation and annual tree RW were based on the analysis of tree health in relation to the MAT for 2012–2021 only. However, this analysis could not be generalized and is only relevant for stands with the same structural characteristics that experience similar site conditions to those of the investigated stands. From the equations we developed (Table 4), it was estimated that an increase in the MAT by 0.5 °C would increase defoliation to 59% and increase the percentage of trees that were ground-dried. This would lead to a reduction in stand density and, as a result, large volume growth losses, as well as a reduction in the protective effect of the stands, given the very steep slope of the land. It is known from the literature that defoliation rates of 5%–24%, caused by processionary moth damage, can lead to growth losses of around 20%, with defoliation >50% inducing growth losses of almost 50% [57]. Studies on trees in permanent monitoring plots have also shown a significant negative reduction of 0.7–0.8% in the basal-area growth of coniferous trees with a 1% increase in defoliation [30]. Increasing the MAT by 1 °C could generate an even greater increase in pine defoliation (up to 78%), further jeopardizing the very existence of stands.
It is possible that other variables could explain the negative growth trend in pine, with one of these variables possibly being the age of the stands. Studies have indicated that the amount and also the timing of water availability, such as a water deficit in the soil in spring, can strongly influence seedling performance [58]. The current structural conditions are another important variable to consider (e.g., high density and growing-stock volumes), including rich native deciduous juveniles. These compete for soil water and also hinder natural pine regeneration. Thus, the continuity of these stands outside their natural range is questionable. The natural regeneration of pine becomes conditioned by the gaps’ presence and the thickness of forest litter, and seed germination and seedling survival depend on these conditions [36]. On the other hand, the species association effect affects the behavior of insect pests and significantly reduces the damage they can cause to seedlings [59]. It follows that black pine, introduced outside its natural distribution range, in isolated stands, forms populations of reduced size and genetic diversity. As a result, their probability of successfully adapting to environmental changes is reduced. The health status of these stands, coupled with the lack of regeneration and the presence of rich native juveniles, already indicates the response of these stands to climate change, which should be considered in the management of these stands. For such stands, located outside their natural range, species mixing could be a future solution.

5. Conclusions

The deteriorating health of pine trees is characterized by a continued reduction in radial growth. An obvious indicator of this is defoliation intensity. Under the specific site conditions of the investigated stands, defoliation occurred in all of the trees, regardless of their cenotic position or dendrometric characteristics. At stand level, defoliation increases in intensity where the basal area (i.e., growing-stock volume of the stands) increases. A decrease in spring and summer rainfall could lead to a significant deterioration in stand health and growth. However, the relationship between pine growth and climatic conditions needs to be studied at the level of the growing season of the trees, considering the age of the stands as well as other site variables that define their productive potential. The presence of abundant native deciduous juveniles indicates an obvious succession of species, meaning that the continuity of the pine trees would not be possible without silvicultural interventions that favored their regeneration. Monocultures outside its natural distribution range are not a solution for Romania’s future forests. The long-term monitoring of existing forests is needed to select the most tolerant trees that are the most adaptable to changing environmental conditions. Management measures in future stand structures should promote locally sourced species that have proven their adaptability and resilience and are capable of stable mixtures. This would ensure the continuity of services that forests are supposed to provide and avoid biodiversity loss and significant economic losses.

Supplementary Materials

The following supporting information can be downloaded at: https://www.mdpi.com/article/10.3390/f14050884/s1. Table S1: Climate date.

Author Contributions

Conceptualization, G.-M.T.; Data curation, G.-M.T., A.C., A.-C.D., M.C. and I.-S.P.; Investigation, G.-M.T., A.C., A.-C.D., M.C., I.-S.P. and Ş.L.; Methodology, G.-M.T.; Validation, G.-M.T., A.C. and A.-C.D.; Writing—original draft, G.-M.T.; Writing—review and editing, G.-M.T., A.C., A.-C.D., M.C., I.-S.P. and Ş.L. All authors have read and agreed to the published version of the manuscript.

Funding

This research received no external funding.

Data Availability Statement

The datasets that were analysed during the study are publicly archived at http://www.rplpkronstadt.ro/uploads/Harta-generala-UP-IV-Brasov-scanata_-1.pdf.

Acknowledgments

We thank the Forest R.P.L Kronstadt staff of Brașov for supporting this research and giving us access to the Forest Management Plans.

Conflicts of Interest

The authors declare no conflict of interest.

References

  1. Allen, M.; Antwi-Agyei, P.; Aragon-Durand, F.; Babiker, M.; Bertoldi, P.; Bind, M.; Brown, S.; Buckeridge, M.; Camilloni, I.; Cartwright, A. Technical Summary: Global Warming of 1.5 C. An IPCC Special Report on the Impacts of Global Warming of 1.5 C above Pre-Industrial Levels and Related Global Greenhouse Gas Emission Pathways, in the Context of Strengthening the Global Response to the Threat of Climate Change, Sustainable Development, and Efforts to Eradicate Poverty; IPCC—The Intergovernamental Panel on Climate Change: Geneva, Switzerland, 2019. [Google Scholar]
  2. Schelhaas, M.J.; Nabuurs, G.J.; Schuck, A. Natural disturbances in the European forests in the 19th and 20th centuries: Natural disturbances in the european forests. Glob. Chang. Biol. 2003, 9, 1620–1633. [Google Scholar] [CrossRef]
  3. Seidl, R.; Thom, D.; Kautz, M.; Martin-Benito, D.; Peltoniemi, M.; Vacchiano, G.; Wild, J.; Ascoli, D.; Petr, M.; Honkaniemi, J.; et al. Forest disturbances under climate change. Nat. Clim. Chang. 2017, 7, 395–402. [Google Scholar] [CrossRef] [PubMed]
  4. Hoegh-Guldberg, O.; Jacob, D.; Taylor, M.; Guillén Bolaños, T.; Bindi, M.; Brown, S.; Camilloni, I.A.; Diedhiou, A.; Djalante, R.; Ebi, K. The human imperative of stabilizing global climate change at 1.5 C. Science 2019, 365, 6459. [Google Scholar] [CrossRef] [PubMed]
  5. Ficko, A.; Poljanec, A.; Boncina, A. Do changes in spatial distribution, structure and abundance of silver fir (Abies alba Mill.) indicate its decline? For. Ecol. Manag. 2011, 261, 844–854. [Google Scholar] [CrossRef]
  6. Čavlović, J.; Bončina, A.; Božić, M.; Goršić, E.; Simončič, T.; Teslak, K. Depression and growth recovery of silver fir in uneven-aged Dinaric forests in Croatia from 1901 to 2001. Forestry 2015, 88, 586–598. [Google Scholar] [CrossRef]
  7. Hanewinkel, M.; Cullmann, D.A.; Schelhaas, M.J.; Nabuurs, G.J.; Zimmermann, N.E. Climate change may cause severe loss in the economic value of European forest land. Nat. Clim. Chang. 2013, 3, 203. [Google Scholar] [CrossRef]
  8. Dyderski, M.K.; Paź, S.; Frelich, L.E.; Jagodziński, A.M. How much does climate change threaten European forest tree species distributions? Glob. Chang. Biol. 2018, 24, 1150–1163. [Google Scholar] [CrossRef]
  9. Allen, C.D.; Breshears, D.D.; Mcdowell, N.G. On underestimation of global vulnerability to tree mortality and forest die-off from hotter drought in the Anthropocene. Ecosphere 2015, 6, 1–55. [Google Scholar] [CrossRef]
  10. Carnicer, J.; Coll, M.; Ninyerola, M.; Pons, X.; Sánchez, G.; Peñuelas, J. Widespread crown condition decline, food web disruption, and amplified tree mortality with increased climate change-type drought. Proc. Natl. Acad. Sci. USA 2011, 108, 1474–1478. [Google Scholar] [CrossRef]
  11. McDowell, N.G.; Pockman, W.T.; Allen, C.D.; Breshears, D.D.; Cobb, N.; Kolb, T.; Plaut, J.; Sperry, J.; West, A.; Williams, D.G.; et al. Mechanisms of plant survival and mortality during drought: Why do some plants survive while others succumb to drought? New Phytol. 2008, 178, 719–739. [Google Scholar] [CrossRef]
  12. Eichhorn, J.; Roskams, P.; Pototic, N.; Timmerman, V.; Ferretti, M.; Mues, V.; Szepesi, A.; Durrant, D.; Seletcovic, I.; Schöck, H.W.; et al. Part IV: Visual assessment of crown condition and damaging agents. In Manual on Methods and Criteria for Harmonized Sampling, Assessment, Monitoring and Analysis of the Effects of Air Pollution on Forests; UNECE ICP Forests Programme Coordinating Centre, Ed.; Thünen Institute of Forest Ecosystems: Eberswalde, Germany, 2016; p. 54. Available online: http://www.icp-forests.org/Manual.htm (accessed on 26 September 2022).
  13. Ferretti, M.; Ghosh, S.; Gottardini, E. Stem radial growth is negatively related to tree defoliation and damage in conifers, Northern Italy. Front. For. Glob. Chang. 2021, 4, 775600. [Google Scholar] [CrossRef]
  14. Sicard, P.; De Marco, A.; Dalstein–Richier, L.; Tagliaferro, F.; Renou, C.; Paoletti, E. An epidemiological assessment of stomatal ozone flux–based critical levels for visible ozone injury in Southern European forests. Sci. Total Environ. 2016, 541, 729–741. [Google Scholar] [CrossRef]
  15. Badea, O. Manual on Methodology for Long–Term Monitoring of Forest Ecosystems Status under Air Pollution and Climate Change Influence; Editura Silvică: Bucharest, Romania, 2008; pp. 5–97. [Google Scholar]
  16. Grote, R.; Gessler, A.; Hommel, R.; Poschenrieder, W.; Priesack, E. Importance of tree height and social position for drought-related stress on tree growth and mortality. Trees 2016, 30, 1467–1482. [Google Scholar] [CrossRef]
  17. Mina, M.; Bugmann, H.; Cordonnier, T.; Irauschek, F.; Klopcic, M.; Pardos, M.; Cailleret, M. Future ecosystem services from European mountain forests under climate change. J. Appl. Ecol. 2017, 54, 389–401. [Google Scholar] [CrossRef]
  18. Rajczak, J.; Pall, P.; Schär, C. Projections of extreme precipitation events in regional climate simulations for Europe and the Alpine Region. J. Geophys. Res.-Atmos. 2013, 118, 1–17. [Google Scholar] [CrossRef]
  19. Sidor, C.G.; Camarero, J.J.; Popa, I.; Badea, O.; Apostol, E.N.; Vlad, R. Forest vulnerability to extreme climatic events in Romanian Scots pine forests. Sci. Total Environ. 2019, 678, 721–727. [Google Scholar] [CrossRef]
  20. Popa, A.; Popa, I.; Roibu, C.-C.; Badea, O.N. Do Different Tree-Ring Proxies Contain Different emperature Signals? A Case Study of Norway Spruce (Picea Abies (L.) Karst) in the Eastern Carpathians. Plants 2022, 11, 2428. [Google Scholar] [CrossRef]
  21. Tudoran, G.M.; Zotta, M. Adapting the planning and management of Norway spruce forests in mountain areas of Romania to environmental conditions including climate change. Sci. Total Environ. 2020, 698, 133761. [Google Scholar] [CrossRef] [PubMed]
  22. Tudoran, G.M.; Cicșa, A.; Ciceu, A.; Dobre, A.C. Growth Relationships in Silver Fir Stands at Their Lower-Altitude Limit in Romania. Forests 2021, 12, 439. [Google Scholar] [CrossRef]
  23. Tudoran, G.M.; Cicșa, A.; Ciceu, A.; Dobre, A.C. Management of Recreational Forests in the Romanian Carpathians. Forests 2022, 13, 1369. [Google Scholar] [CrossRef]
  24. Cicşa, A.; Tudoran, G.M.; Boroeanu, M.; Dobre, A.C.; Spârchez, G. Effect of Species Composition on Growth and Yield in Mixed Beech–Coniferous Stands. Forests 2022, 13, 1651. [Google Scholar] [CrossRef]
  25. Sánchez-Salguero, R.; Navarro-Cerrillo, R.M.; Camarero, J.J.; Fernandez-Cancio, A. Selective drought-induced decline of pine species in southeastern Spain. Clim. Chang. 2012, 113, 767–785. [Google Scholar] [CrossRef]
  26. Hereş, A.M.; Polanco-Martínez, J.M.; Petritan, I.C.; Petritan, A.M.; Jorge Curiel Yuste, J. The stationary and non-stationary character of the silver fir, black pine and Scots pine tree-growth-climate relationships. Agric. For. Meteorol. 2022, 325, 109146. [Google Scholar] [CrossRef]
  27. Bouriaud, O.; Popa, I. Comparative dendroclimatic study of Scots pine, Norway spruce, and silver fir in the Vrancea Range, Eastern Carpathian Mountains. Trees 2009, 23, 95–106. [Google Scholar] [CrossRef]
  28. Sidor, C.G.; Popa, I.; Vlad, R.; Cherubini, P. Different tree-ring responses of Norway spruce to air temperature across an altitudinal gradient in the Eastern Carpathians (Romania). Trees 2015, 29, 985–997. [Google Scholar] [CrossRef]
  29. Schurman, J.S.; Babst, F.; Björklund, J.; Rydval, M.; Bače, R.; Čada, V.; Janda, P.; Mikolas, M.; Saulnier, M.; Trotsiuk, V.; et al. The climatic drivers of primary Picea forest growth along the Carpathian arc are changing under rising temperatures. Glob. Chang. Biol. 2019, 25, 3136–3150. [Google Scholar] [CrossRef] [PubMed]
  30. Ferretti, M.; Bacaro, G.; Brunialti, G.; Calderisi, M.; Croisé, L.; Frati, L.; Nicolas, M. Tree canopy defoliation can reveal growth decline in mid-latitude temperate forests. Ecol. Indic. 2021, 127, 107749. [Google Scholar] [CrossRef]
  31. Doniţǎ, N.; Popescu, A.; Paucǎ-Comǎnescu, M.; Mihǎilescu, S.; Biriş, I.A. Habitatele din România; Editura Tehnicǎ Silvica: Bucureşti, Romania, 2005; pp. 254–255. ISSN 973-96001-4-X. [Google Scholar]
  32. Silvestru-Grigore, C.V.; Dinulică, F.; Spârchez, G.; Hălălișan, A.F.; Dincă, L.C.; Enescu, R.E.; Crișan, V.E. Radial Growth Behavior of Pines on Romanian Degraded Lands. Forests 2018, 9, 213. [Google Scholar] [CrossRef]
  33. Şofletea, N.; Curtu, A.L. Dendrologie; Editura Universitǎţii Transilvania: Brașov, Romania, 2007; pp. 64–67. [Google Scholar]
  34. Hereş, A.M.; Petritan, I.C.; Bigler, C.; Curtu, A.L.; Petrea, Ş.; Petritan, A.M.; Polanco-Martínez, J.M.; Rigling, A.; Curiel Yuste, J. Legacies of past forest management determine current responses to severe drought events of conifer species in the Romanian Carpathians. Sci. Total Environ. 2021, 751, 141851. [Google Scholar] [CrossRef]
  35. Przybylski, P.; Mohytych, V.; Rutkowski, P.; Tereba, A.; Tyburski, Ł.; Fyalkowska, K. Relationships between Some Biodiversity Indicators and Crown Damage of Pinus sylvestris L. in Natural Old Growth Pine Forests. Sustainability 2021, 13, 1239. [Google Scholar] [CrossRef]
  36. Przybylski, P.; Jastrzȩbowski, S.; Ukalski, K.; Tyburski, L.; Konatowska, M. Quantitative and qualitative assessment of pine seedlings under controlled undergrowth disturbance: Fire and soil scarification. Front. For. Glob. Chang. 2022, 5, 225. [Google Scholar] [CrossRef]
  37. Pollastrini, M.; Puletti, N.; Selvi, F.; Iacopetti, G.; Bussotti, F. Widespread crown defoliation after a drought and heat wave in the forests of Tuscany (Central Italy) and their recovery—A case study from summer 2017. Front. For. Glob. Chang. 2019, 2, 74. [Google Scholar] [CrossRef]
  38. Ferretti, M.; Nicolas, M.; Bacaro, G.; Brunialti, G.; Calderisi, M.; Croisé, L.; Frati, L.; Lanier, M.; Maccherini, S.; Santi, E.; et al. Plot-scale modelling to detect size, extent, and correlates of changes in tree defoliation in French high forests. For. Ecol. Manag. 2014, 311, 56–69. [Google Scholar] [CrossRef]
  39. Rohner, B.; Kumar, S.; Liechti, K.; Gessler, A.; Ferretti, M. Tree Vitality Indicators Revealed a Rapid Response of Beech Forests to the 2018 Drought. Ecol. Indic. 2021, 120, 106903. [Google Scholar] [CrossRef]
  40. Dobbertin, M. Tree growth as indicator of tree vitality and of tree reaction to environmental stress: A review. Eur. J. For. Res. 2005, 124, 319–333. [Google Scholar] [CrossRef]
  41. Tudoran, G.M. Using mathematical models based on unmanned aerial vehicle optical imagery to estimate tree and stand characteristics. Bull. Transilv. Univ. Braşov. 2022, 15, 1. [Google Scholar] [CrossRef]
  42. Giurgiu, V.; Drăghiciu, D. Modele Matematico-Auxologice Și Tabele de Producție Pentru Arborete; Editura Ceres: București, Romania, 2004; pp. 132–136. [Google Scholar]
  43. Timmermann, V.; Potočić, N.; Ognjenović, M.; Kirchner, T. Part B: Tree crown condition in 2021. In Forest Condition in Europe: The 2022 Assessment. ICP Forests Technical Report under the UNECE Convention on Long-Range Transboundary Air Pollution (Air Convention); Thünen Institute: Eberswalde, Germany, 2022. [Google Scholar]
  44. Grissino-Mayer, H.D. Evaluating crossdating accuracy: A manual and tutorial for the computer program cofecha. Tree-Ring Res. 2001, 57, 205–221. [Google Scholar]
  45. Giurgiu, V.; Decei, I.; Drăghiciu, D. Metode Şi Tabele Dendrometrice; Editura Ceres: București, Romania, 2004; pp. 53–54. [Google Scholar]
  46. Tudoran, G.-M.; Cicșa, A.; Boroeanu, M.; Dobre, A.-C.; Pascu, I.-S. Forest Dynamics after Five Decades of Management in the Romanian Carpathians. Forests 2021, 12, 783. [Google Scholar] [CrossRef]
  47. Available online: https://www.meteoblue.com/ro/vreme/archive/windrose/bra%C8%99ov_rom%C3%A2nia_683844 (accessed on 17 March 2022).
  48. Badea, O.; Tanase, M.; Georgeta, J.; Anisoara, L.; Peiov, A.; Uhlirova, H.; Pajtikc, J.; Wawrzoniakd, J.; Shparyk, Y. Forest health status in the Carpathian Mountains over the period 1997–2001. Environ. Pollut. 2004, 130, 93–98. [Google Scholar] [CrossRef] [PubMed]
  49. Bytnerowitz, A.; Badea, O.; Popescu, F.; Musselman, R.; Tanase, M.; Barbu, I.; Fraczek, W.; Gembasu, N.; Surdu, A.; Danescu, F.; et al. Air pollution, precipitation chemistry and forest health in the Retezat Mountains, Southern Carpathians, Romania. Environ. Pollut. 2005, 137, 546–567. [Google Scholar] [CrossRef]
  50. Candel-Pérez, D.; Lucas-Borja, M.E.; García-Cervigón, A.I.; Tíscar, P.A.; Andivia, E.A.; Bose, K.; Sánchez-Salguero, R.; Camarero, J.J.; Linares, J.C. Forest structure drives the expected growth of Pinus nigra along its latitudinal gradient under warming climate. For. Ecol. Manag. 2022, 505, 119818, ISSN 0378-1127. [Google Scholar] [CrossRef]
  51. Móricz, N.; Garamszegi, B.; Rasztovits, E.; Bidló, A.; Horváth, A.; Jagicza, A.; Illés, G.; Vekerdy, Z.; Somogyi, Z.; Gálos, B. Recent Drought-Induced Vitality Decline of Black Pine (Pinus nigra Arn.) in South-West Hungary—Is This Drought-Resistant Species under Threat by Climate Change? Forests 2018, 9, 414. [Google Scholar] [CrossRef]
  52. Eickenscheidt, N.; Augustin, N.H.; Wellbrock, N. Spatio-temporal modelling of forest monitoring data: Modelling German tree defoliation data collected between 1989 and 2015 for trend estimation and survey grid examination using GAMMs. iForest 2019, 12, 338–348. [Google Scholar] [CrossRef]
  53. Lucas-Borja, M.E.; Bose, A.K.; Andivia, E.; Candel-Pérez, D.; Plaza-Álvarez, P.A.; Linares, J.C. Assessing Tree Drought Resistance and Climate-Growth Relationships under Different Tree Age Classes in a Pinus nigra Arn ssp. Salzmannii Forests. Forests 2021, 12, 1161. [Google Scholar] [CrossRef]
  54. Marchin, R.M.; Esperon-Rodriguez, M.; Tjoelker, M.G.; Ellsworth, D.S. Crown dieback and mortality of urban trees linked to heatwaves during extreme drought. Sci. Total Environ. 2022, 850, 157915. [Google Scholar] [CrossRef] [PubMed]
  55. Bond, B.J. Age-related changes in photosynthesis of woody plants. Trends Plant Sci. 2000, 5, 349–353. [Google Scholar] [CrossRef]
  56. Koch, G.; Sillett, S.; Jennings, G.; Davis, S. The limits to tree height. Nature 2004, 428, 851–854. [Google Scholar] [CrossRef]
  57. Jacquet, J.S.; Orazio, C.; Jactel, H. Defoliation by processionary moth significantly reduces tree growth: A quantitative review. Ann. For. Sci. 2012, 69, 857–866. [Google Scholar] [CrossRef]
  58. Westerband, A.C.; Kagawa-Viviani, A.K.; Bogner, K.K.; Beilman, D.; Knight, M.; Barton, K. Seedling drought tolerance and functional traits vary in response to the timing of water availability in a keystone Hawaiian tree species. Plant Ecol. 2019, 220, 321–344. [Google Scholar] [CrossRef]
  59. Tudoran, A.; Bylund, H.; Nordlander, G.; Oltean, I.; Puentes, A. Using associational effects of European beech on Norway spruce to mitigate damage by a forest regeneration pest, the pine weevil Hylobius abietis. For. Ecol. Manag. 2021, 486, 118980, ISSN 0378-1127. [Google Scholar] [CrossRef]
Figure 1. SP scheme used for tree evaluation in the study.
Forests 14 00884 g001
Figure 2. (a) Percentage of trees by defoliation class in the 2012 and 2021 inventories; and (b) percentage of dead trees fallen to the ground (mortality and wind damage).
Forests 14 00884 g002
Figure 3. Relationship between the defoliation and biometric parameters of trees with medium (411 trees) and high (81 trees) site productivity: (a) diameter; (b) height; (c) crown diameter; (d) crown length; (e) slenderness index; and (f) pruning height. Trees with 100% defoliation were not included.
Forests 14 00884 g003aForests 14 00884 g003b
Figure 4. Relationship between defoliation and the mean values of the biometric parameters at the subplot level: (a) basal area (G); and (b) stocking degree (SSD). The defoliation values are plotted for the two productivity levels, but the defoliation did not differ significantly, so the data analysis was not differentiated for those two levels.
Forests 14 00884 g004
Figure 5. Radial growth trend: (a) over the last 30 years (1992–2021); and (b) in 2021, regarding defoliation intensity. The ten RW values are averages of the radial growth of the sample trees. They correspond to the ten percent defoliation estimated in 2021 for the 91 sample trees.
Forests 14 00884 g005
Table 1. Biometric parameters of the inventoried pine stands [41].
SPInventoried Area (ha)SpeciesNdg ± SD (cm)hg ± SD (m)cwg ± SD (m)clg ± SD (m)
SP10.25black pine7134.98 ± 8.1819.3 ± 3.33.3 ± 0.87.3 ± 2.2
SP20.25black pine6236.77 ± 7.918.2 ± 3.14.0 ± 0.98.0 ± 2.7
SP30.25black pine6136.66 ± 7.719.1 ± 3.63.7 ± 0.88.0 ± 2.5
SP40.25black pine9040.37 ± 6.625.3 ± 3.03.9 ± 0.97.8 ± 2.6
SP50.25black pine11629.73 ± 4.719.4 ± 2.53.0 ± 0.56.6 ± 2.2
SP60.25black pine10829.92 ± 6.118.5 ± 2.32.7 ± 0.66.2 ± 1.9
Total1.50––508––––––––
Note. N = number of trees inventoried; dg ± SD = mean squared diameter or quadratic mean diameter (the diameter corresponding to the mean basal area of trees or groups of trees) and their corresponding standard deviation (SD); hg = height of the dg tree and SD; cwg = average crown diameter of the inventoried trees (corresponding to the crown diameter of the tree with dg) and SD; clg = average crown length of the inventoried trees and SD. Sites with hg values of 18.2 to 19.3 m were classed as medium productivity, whereas those with hg values of 25.3 m were classed as high productivity [42].
Table 2. Relationship between defoliation and stand biometric parameters.
Biometric ParameternInterceptSlope (Value/std. Error/t)R2p-ValueMAERMSE
dg3021.8470.5240.2490.005−0.00163.9207
6.0080.172
3.6363.043
V3034.8520.3390.2420.006−0.00263.9412
1.8730.113
18.6042.99
G3033.254.3020.2320.0070.00053.9662
2.4331.477
13.6642.912
SSD3032.5749.7970.190.0160.00024.0744
2.9913.818
10.892.566
clg3027.8271.6630.1820.0190.00034.0937
4.9310.666
5.6432.498
cwg3027.33.7320.1790.020.0014.1012
5.1931.51
5.272.472
hg3026.0530.6980.1520.0330.00874.175
6.2660.311
4.1582.242
Note. The relationship between defoliation and the biometric parameters characterizing the black pine stands surveyed at the subplot level with different plot productivity indices (see Table 1). Biometric parameters: dg—quadratic mean diameter; V—stand volume; G—stand basal area; SSD—stocking degree; clg—mean tree crown length; cwg—mean tree crown width; and hg—height of tree with dg. The values of these parameters were determined in 2021.
Table 3. Statistical descriptor of the regression equation.
Equation (RW)CoefficientStd. Error (SE)tpR2MAERMSE
Intercept15.2561.19617.780.0000.67−0.00250.0379
Slope–0.00740.001−7.577
Note. The equation (RW) estimated the mean annual value of radial growth for each year from 2012 to 2021. RW (i.e., annual radial growth)—dependent variable, calendar year—independent variable.
Table 4. Indicator statistics.
Equation (DEF)CoefficientSE tpR2MAERMSE
Intercept−263.69215.452−17.0650.0030.990.00280.8194
Slope38.858219.425
Note. The equation (DEF) estimated the average defoliation value of trees (i.e., stand defoliation) in relation to MAT value. DEF (i.e., defoliation)—dependent variable, MAT (mean annual temperature)—independent variable.
Disclaimer/Publisher’s Note: The statements, opinions and data contained in all publications are solely those of the individual author(s) and contributor(s) and not of MDPI and/or the editor(s). MDPI and/or the editor(s) disclaim responsibility for any injury to people or property resulting from any ideas, methods, instructions or products referred to in the content.

