1. Introduction
Tea production plays an important role in the development of the national economy. Tea is an important economic crop in China and has become one of the main economic pillars of tea-producing regions, becoming an important component of the national economy. In the process of its planting to maturity, its yield drops sharply due to various pests and diseases, resulting in huge economic losses. It is very important for tea farmers to be able to detect tea leaf pests and diseases in a timely manner. In the past, the identification of crop diseases was based on the careful observation of leaves by experts in the field [
1]. However, this method relies too much on personal experience, which is obviously too inefficient if large areas of pests and diseases are produced, and also results in miscalculations and omissions due to lack of human resources. Therefore, it is particularly important to solve the problem of crop pest and disease detection. In recent years, as computer technology has advanced, an increasing number of researchers have tried to apply deep learning in the field of crop pest and disease identification [
2].
The majority of pest detection algorithms currently in use are deep learning-based, and these algorithms are primarily split into two categories: the first is the two-stage target detection technique based on regional targets represented by R-CNN [
3], Fast R-CNN [
4] and Faster R-CNN [
5], using a two-stage detection algorithm with relatively high accuracy but relatively slow speed; the other is the two-stage detection algorithm represented by SSD [
6], RSDD [
7], CenterNet [
8] and YOLO [
9] series as the representative of regression-based [
10] single-stage target detection algorithms. In recent years, Wang Yuqing [
11] proposed the research of UAV-based tea pest control system, which used Faster R_CNN algorithm for feature extraction of tea disease images. However, the dataset collected using this method was not carefully divided for different incidence periods. Xue Zhenyang [
12] et al. proposed a YOLOv5-based tea disease detection method. A convolutional block attention module (CBAM) and self-attention and convolution (ACmix) are merged into YOLOv5, and a global context network is added to the model to reduce resource consumption (GCNet). Nevertheless, this approach has difficulty with the actual diagnosis of diseases with complicated backgrounds and is only suitable for leaf photos with plain backgrounds. Bao Wenxia [
13] et al., in this study, proposed an improved RetinaNet target detection and recognition network, AX-RetinaNet, for natural scene image automatic detection and recognition of tea diseases in natural scene images. Yang Ning [
14] et al. proposed tea disease detection based on fast infrared thermal image processing technique, which achieved fast detection of tea diseases by regularity of tea disease area and its grayscale distribution in infrared images, but the accuracy of the enhancement was not high.
Lee, SH [
15] et al. proposed a region-based convolutional neural network for three tea leaf diseases and four pests to detect the location of leaf lesions and determine the cause of the lesions. Li, H [
16] et al. proposed a framework for tea pest symptoms and recognition based on Mask R-CNN, wavelet transform, and F-RNet, which began with segmenting disease and insect spots from tea leaves using Mask R-CNN model, then enhancing the features of disease and insect spot images using two-dimensional discrete wavelet transform to obtain 98 frequency images, and finally, simultaneously inputting the four frequency images into a four-channel residual network (F-RNet) to identify the tea pest. Srivastava, AR et al. [
17] used texture-based image processing for diseases prediction. After training the dataset using classifiers, images of tea leaves were used as input, the classifier system found the best match and the classifier system identified the disease. The goal of this study is to better tea production in India by identifying and predicting tea illnesses using a variety of classification approaches.
Most of the above-proposed methods use a single target detection network to detect the location of tea leaf pest production, and the effect of pest classification for tea tree is not outstanding enough to identify Apolygus lucorμm and Leaf blight well. Therefore, this paper proposes a new method of tea tree leaf pest detection based on integrated learning, integrating the new model after using both models to reduce the possibility of misclassification or omission.
(1) For the case of
Apolygus lucorμm with low target pixels and easy information loss, in order to make the model focus on the detection of local information and improve the accuracy of extracting image features, the Backbone network in YOLOv5 introduces the GAM attention mechanism [
18] to focus more on the recognition of
Apolygus lucorμm.
(2) Secondly, due to the large area of
Leaf blight and stronger background contrast, the YOLO v5 Backbone network introduces the CBAM [
19] attention mechanism improve the focus on the directionality of
Leaf blight recognition to obtain quicker convergence and enhance the detection algorithm’s inference and training.
(3) Finally, the two trained models are fused before using the weighted frame fusion algorithm (WBF) [
20] to fuse the prediction frames of the two models. The results of the experiments demonstrate that the strategy can significantly enhance model detection performance.
The rest of this paper is organized as follows. In
Section 2, we not only describe the tea pest dataset and model evaluation metric used in our experiments, but also detail the structure of our tea pest detection model. In
Section 3, we show the configuration used for the experiments and the settings of some of the main training parameters. In addition, the effects of CBAM attention module, GAM attention module and CBAM_fusion_GAM on
Leaf blight and
Apolygus lucorµm identification are demonstrated via comparison experiments. In
Section 4, our pest and disease detection model is discussed and analyzed.
Section 5 summarizes the whole work and provides a vision for the future.
2. Materials and Methods
2.1. Datasets
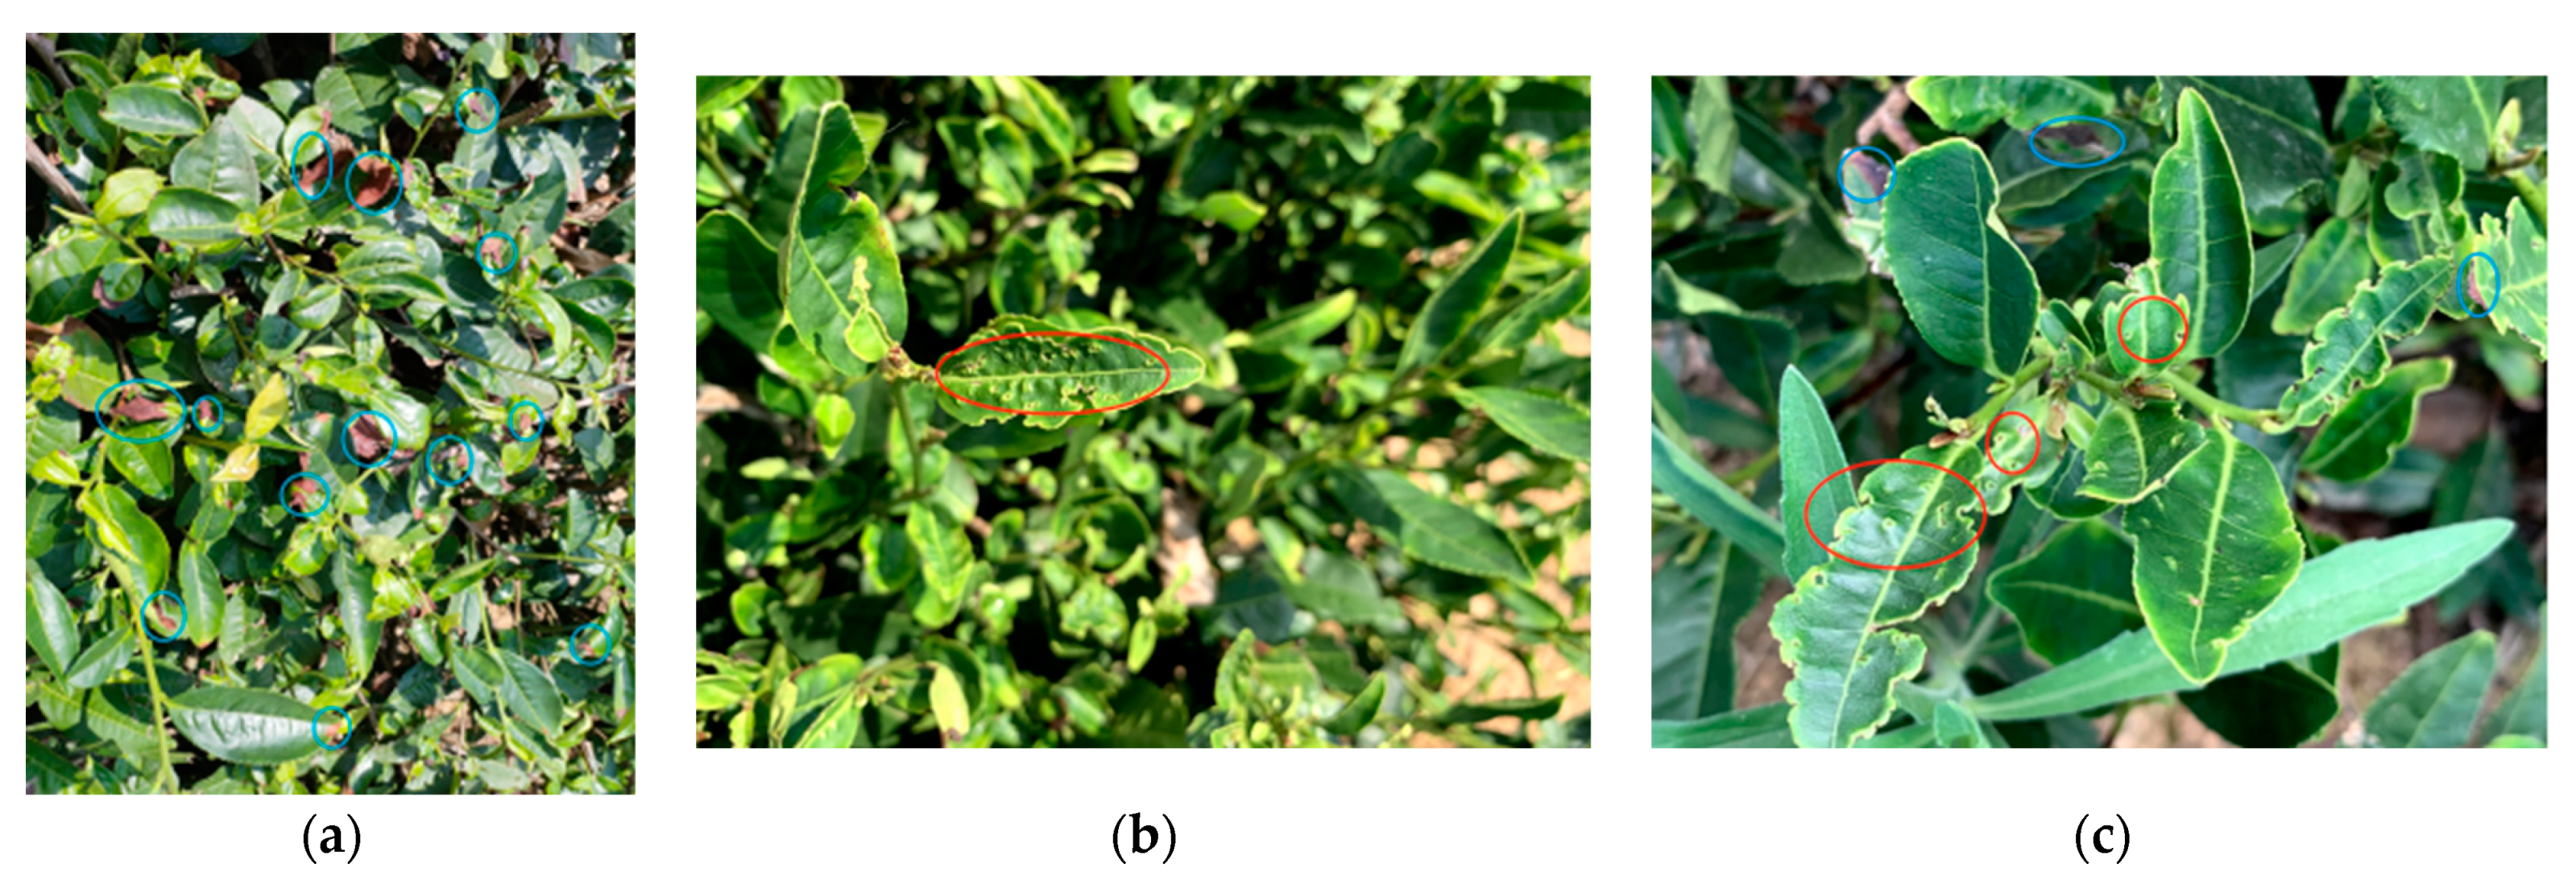
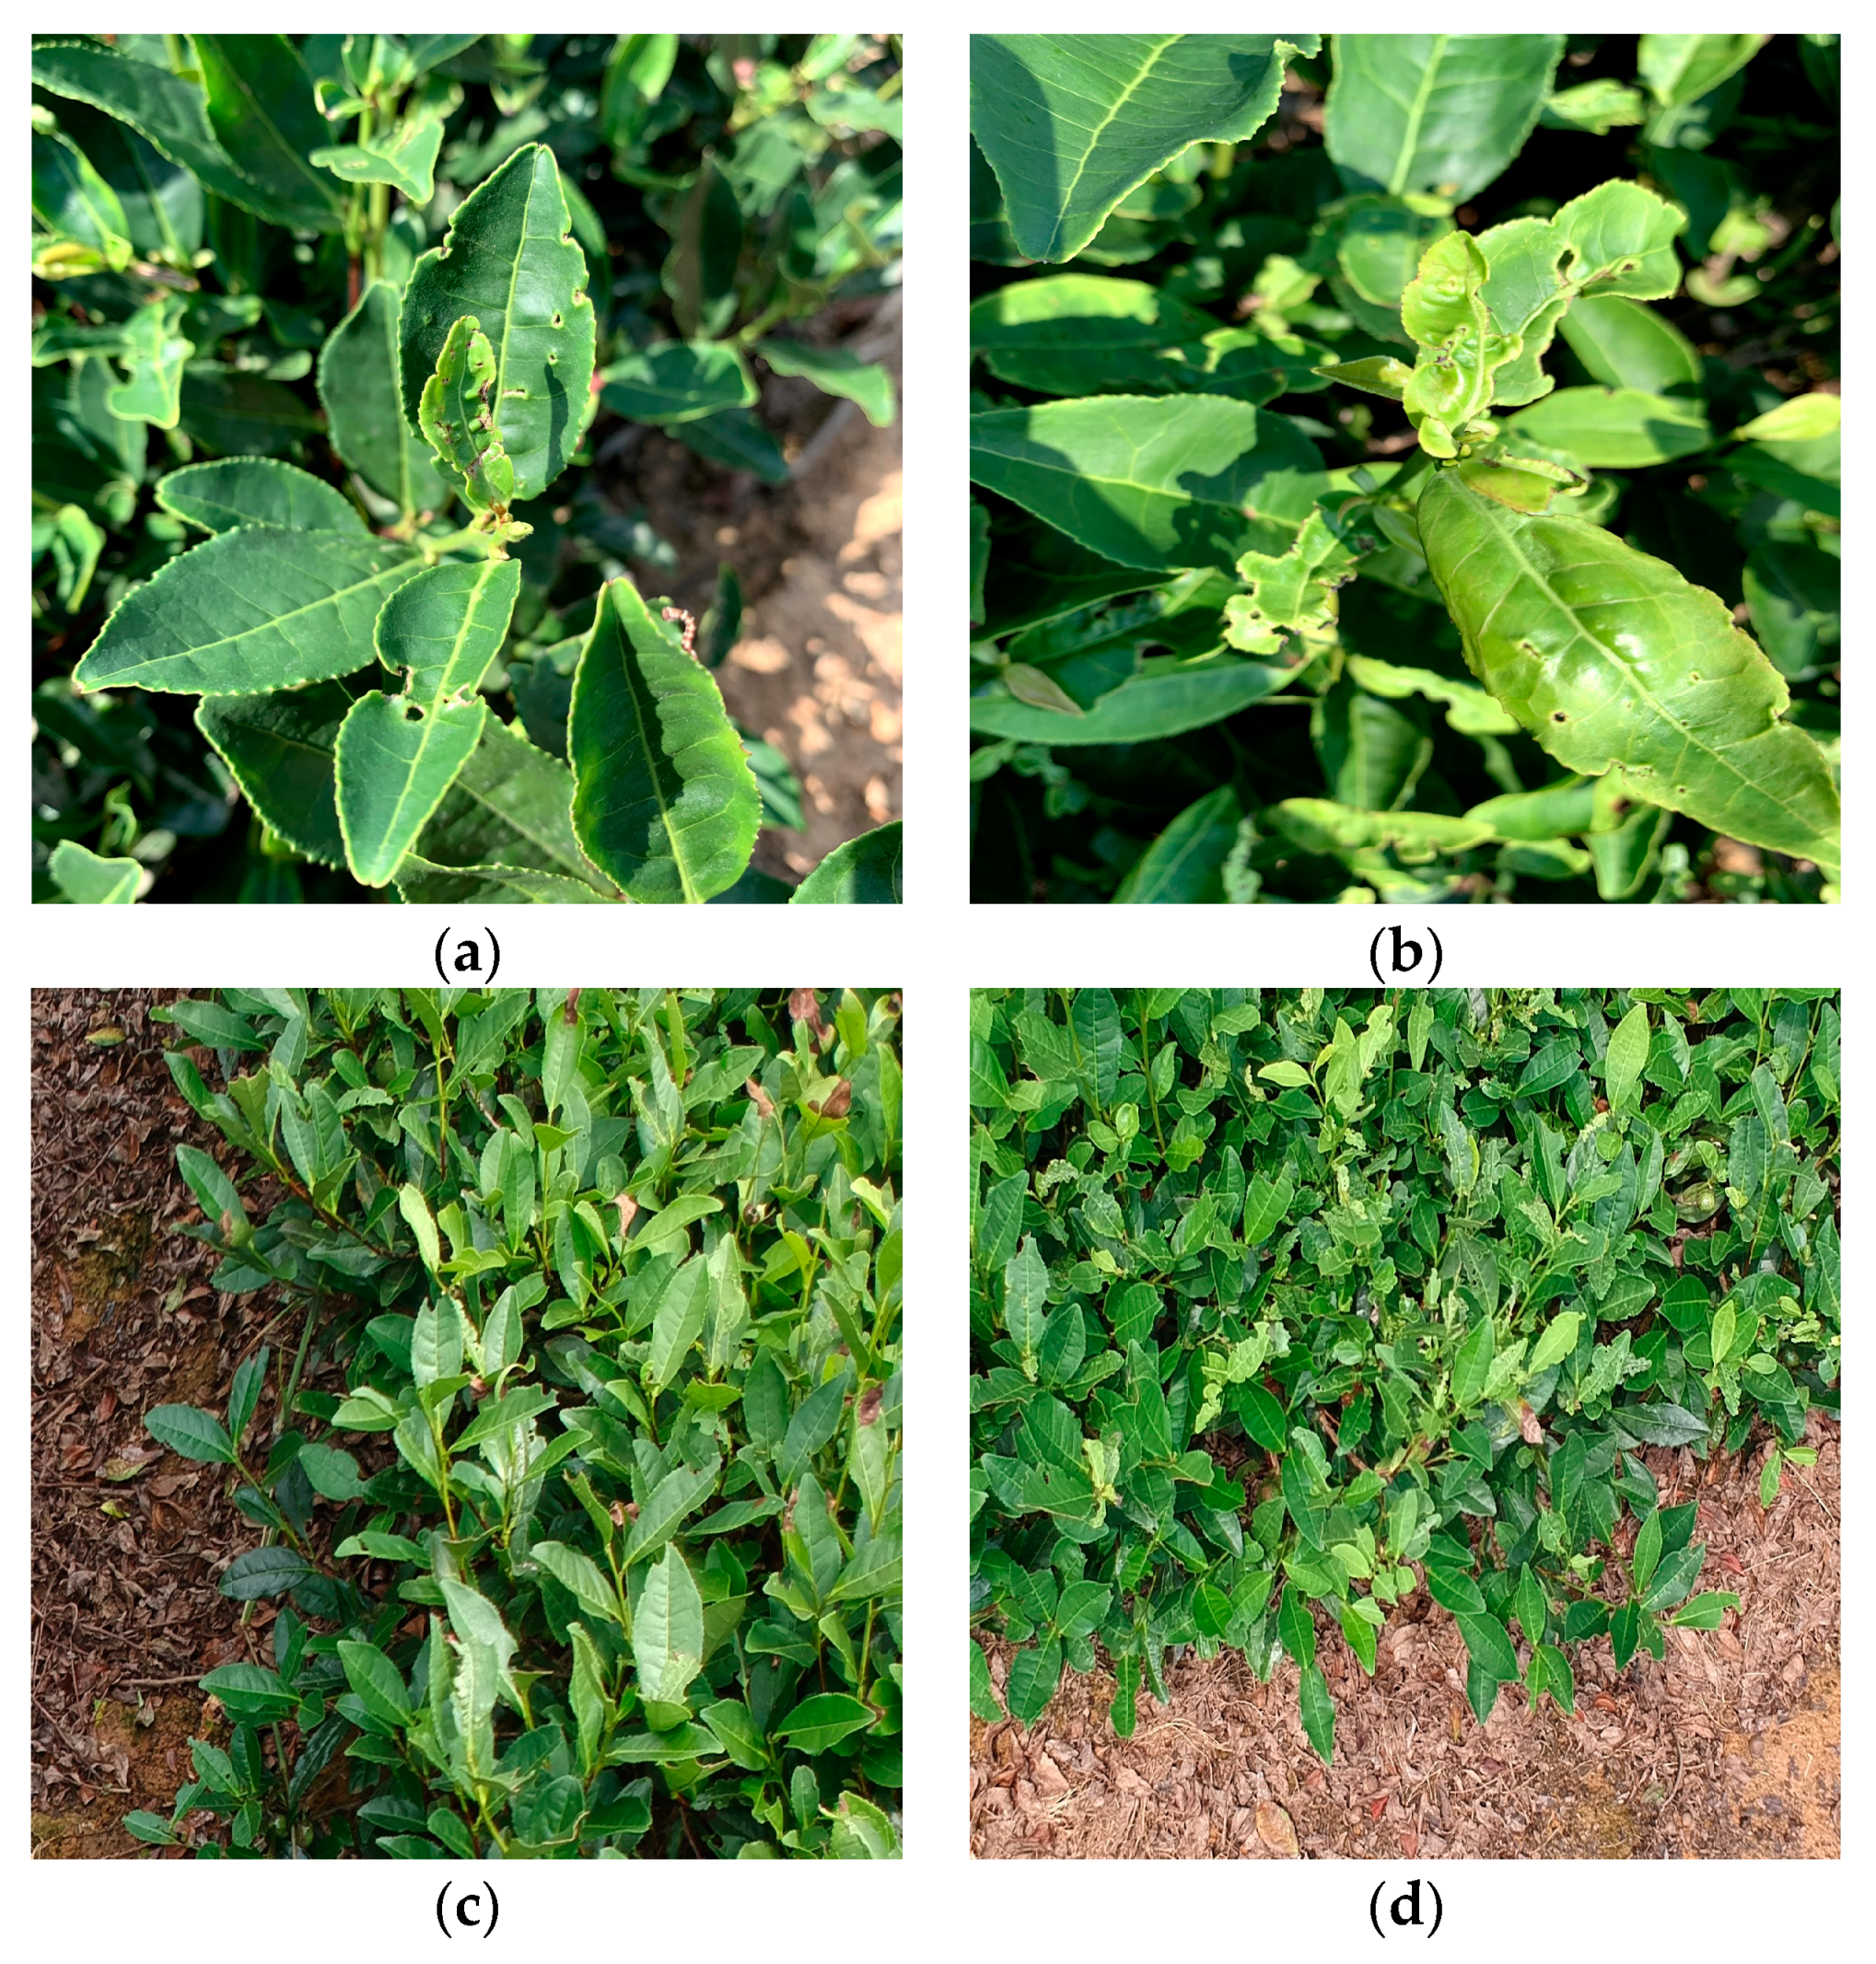
The learning effect of the deep learner on the target features is highly dependent on the degree of annotation of the dataset. Therefore, the quality of the dataset has a very strong relationship with the effectiveness of model recognition. First, we wrote a crawler program in python to collect images of
Leaf blight and
Apolygus lucorµm in tea from the Internet. Additionally, the high-quality tea pest and disease pictures were screened manually. Secondly, the number of tea pests and diseases is too small. To improve the robustness of the model, we added some pictures taken in our own tea gardens to the tea pest and disease dataset. Third, we annotated the dataset by using labels to ensure that our model could identify
Leaf blight and
Apolygus lucorµm. Finally, we produced a total of 450 images from the tea dataset. The names of the tags in the tea pest dataset and their corresponding pest types and numbers are shown in
Table 1. Representative images of each type in the dataset are shown in
Figure 1 and
Figure 2.
2.2. YOLOv5
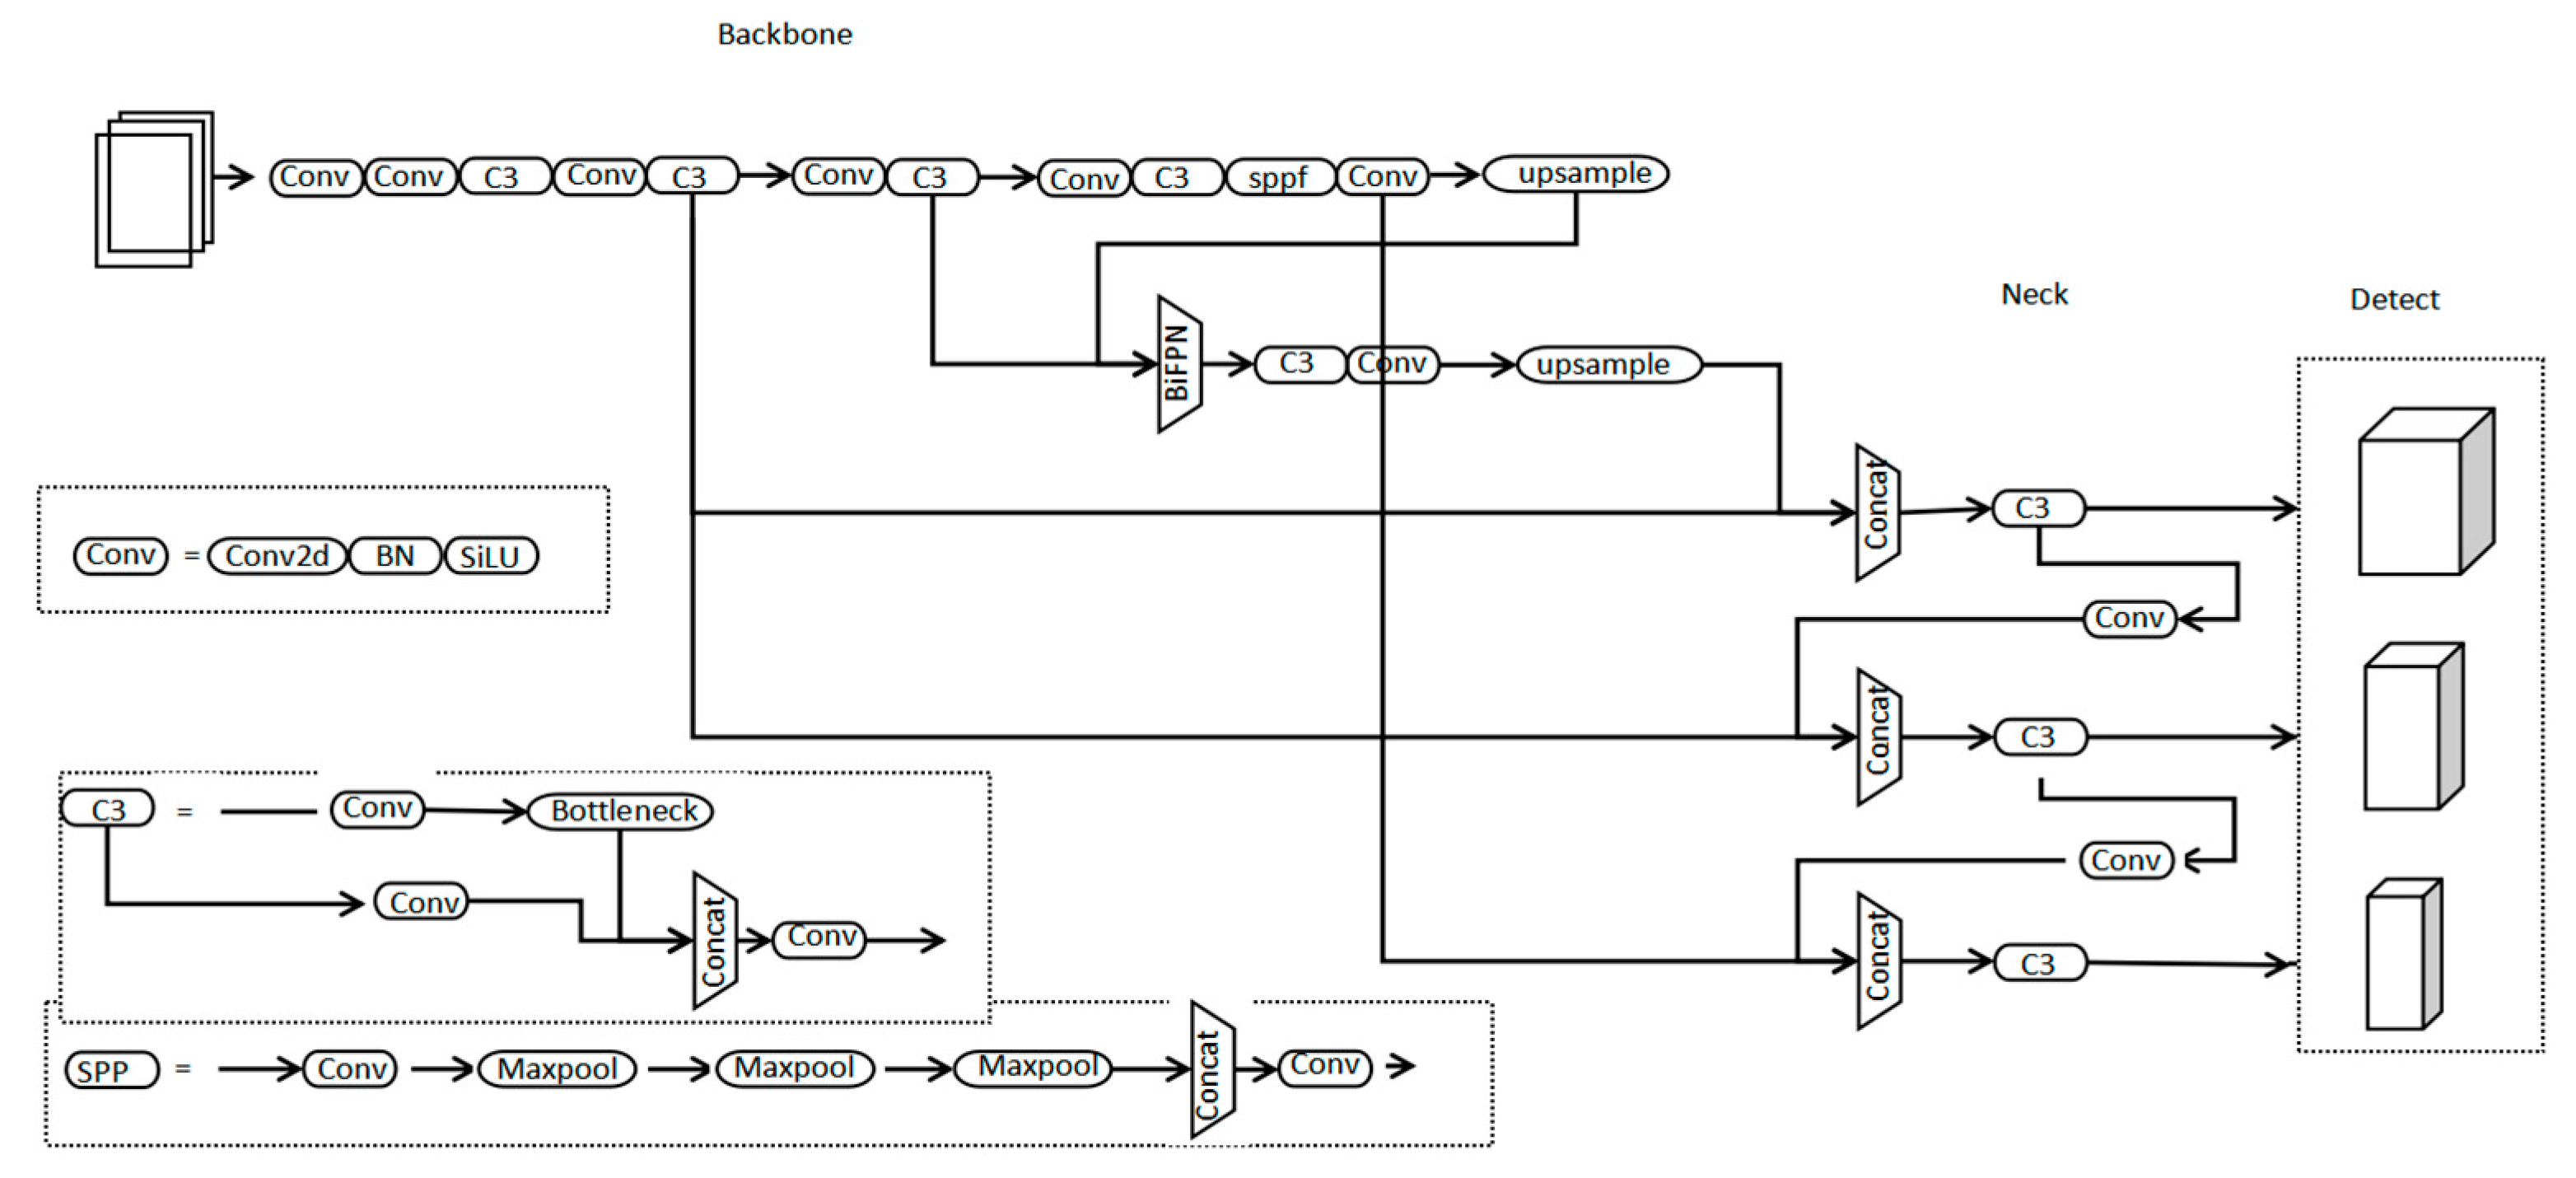
The YOLO family of algorithms is widely used in computer vision projects because of its relatively simple structure and fast computational processing speed. The YOLOv5 used in this study is a regression-based one-stage target detection algorithm that makes it easier to learn the generalized features of the target, resulting in a great performance improvement in terms of speed and accuracy.
The network structure of YOLOv5 model consists of four parts: input side, Backbone network, Neck network, and prediction module. First of all, in the input side, the data input is processed via adaptive image scaling, Mosaic data enhancement, and adaptive anchor frame calculation to increase the accuracy and recognition of detection; the Backbone network includes CSP structure, Focus, etc. The slicing operation of the Focus structure is used to slice the image, and the new image is obtained after the convolution operation. After convolution operation, a binary down sampled feature map without information loss is obtained; the Neck network uses the feature pyramid structure of FPN + PAN (Feature Pyramid Network + Pyramid Attention Network), which mainly increases the multi-scale semantic expression and enhances the localization ability on different scales. The Prediction part involves using the loss function to calculate the position, classification and confidence loss, respectively, and to perform Non-Maximum Suppression (NMS) on the final detection frame of the target. The category prediction frame with the maximum value of local classification is retained and the prediction frame with low score is discarded. The YOLOv5 graph is shown in
Figure 3.
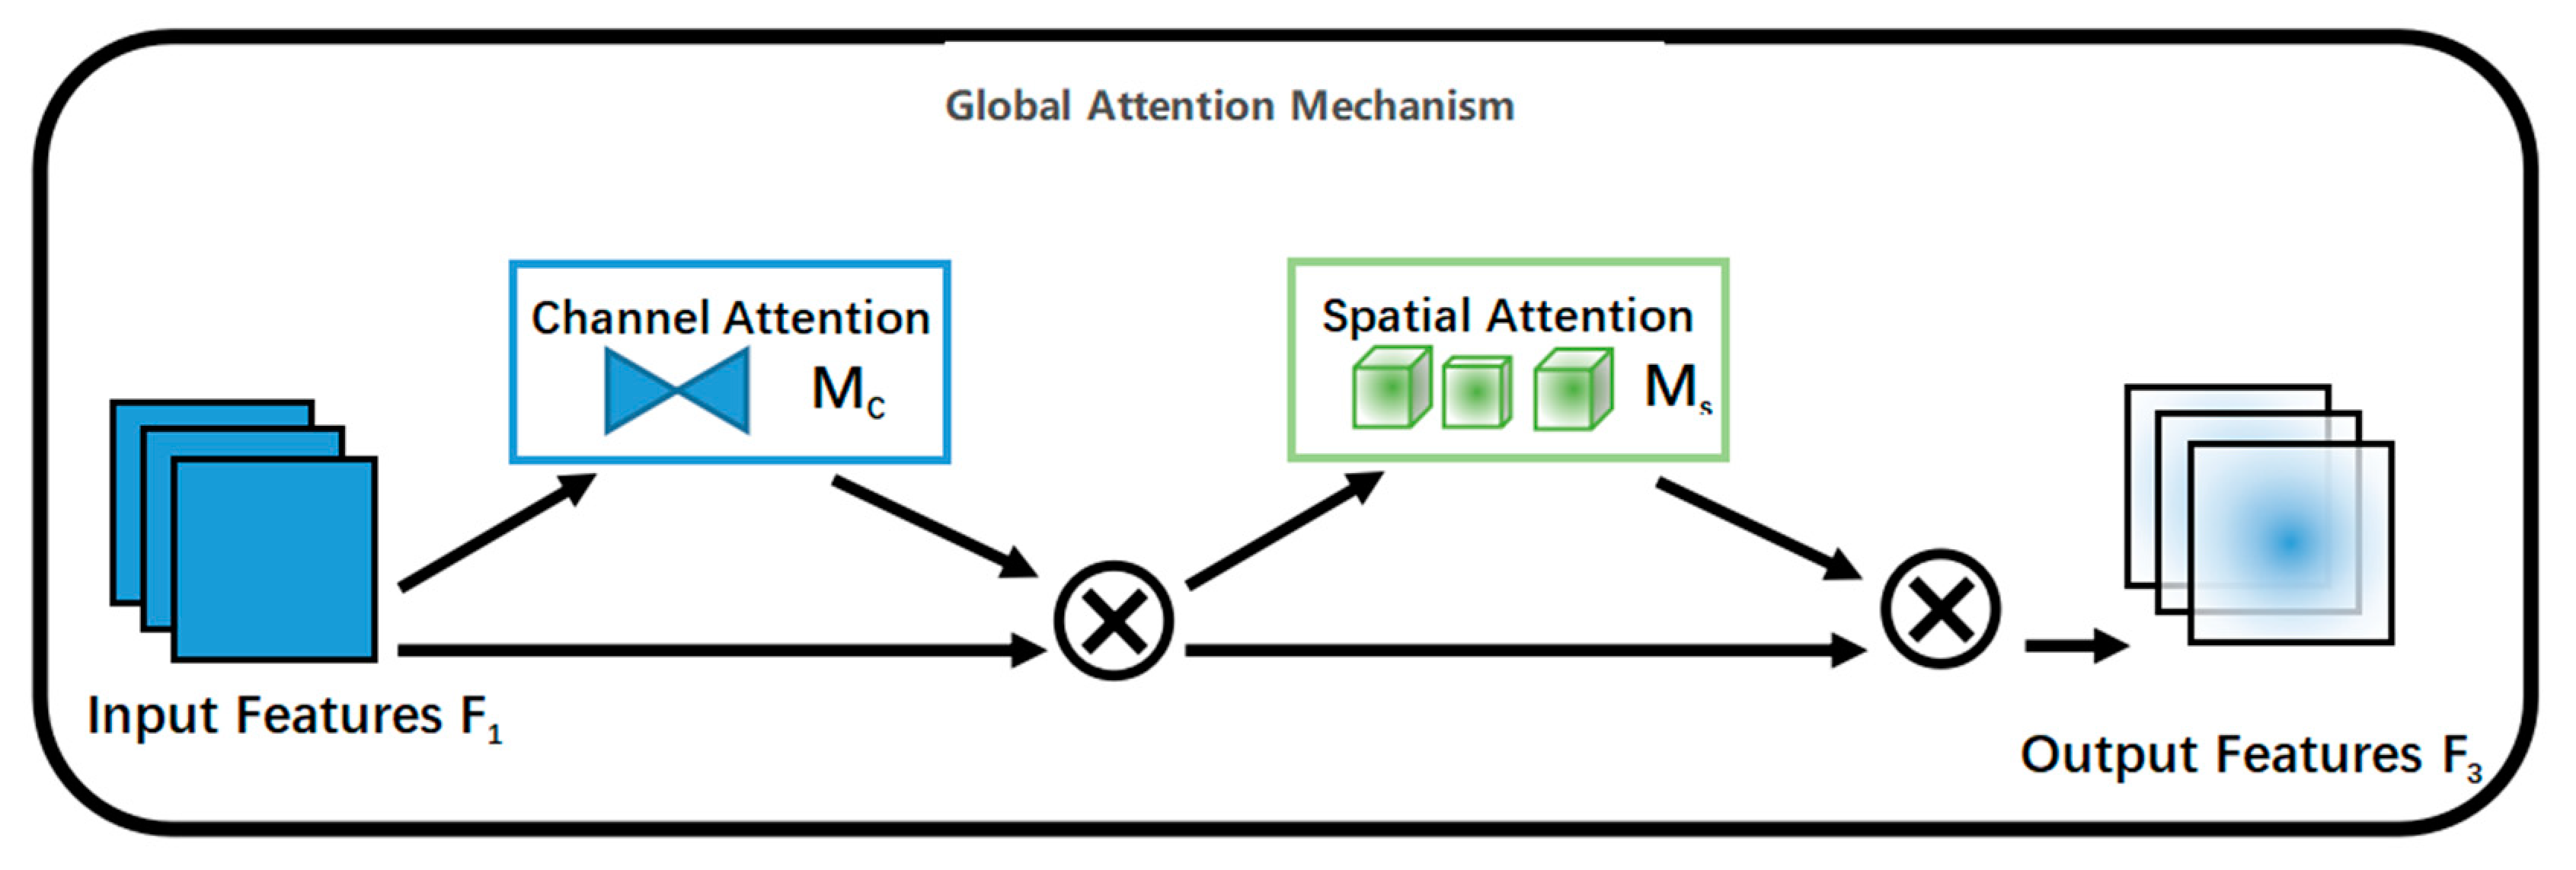
2.3. GAM Attention Mechanism
Since the Apolygus lucorμm target has strong contrast of background information in the image, the GAM attention mechanism is added to the network model to better identify the Apolygus lucorμm to improve the target detection accuracy by extracting feature information from the image, reducing information loss and improving global feature interactions to improve the performance of the deep neural network and enhance the focus on the detection target. The global attention mechanism contains spatial location attention and feature channel attention, both of which can extract important feature information from individual feature points to link global feature points to reduce information loss and amplify global dimensional interactions. Channel attention focuses on the meaningful channels of the feature map, suppresses irrelevant channels, and finally uses convolution to achieve a weighted channel feature map. Spatial attention uses the spatial relationship between features to generate a spatial attention mapping to focus on the feature map local information. The global attention mechanism module is shown in
Figure 4.
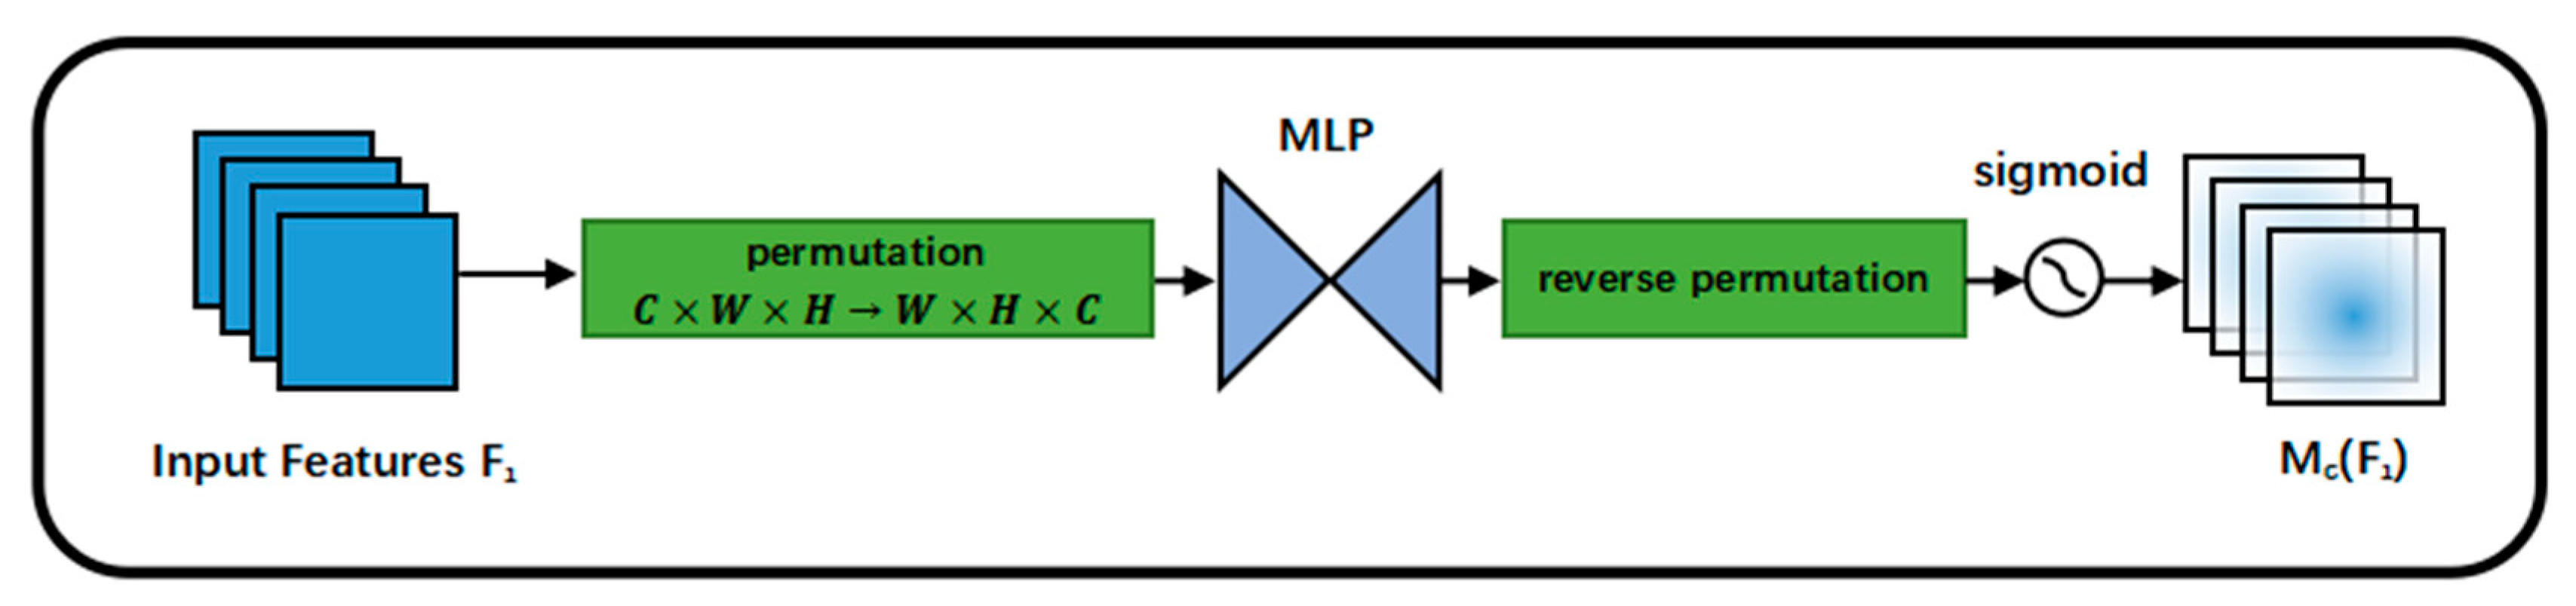
The specific approach: Firstly, the channel-attention submodule is passed through to preserve the 3D information using a 3D alignment. Then, a two-layer MLP (multilayer perceptron) is used to amplify the cross-dimensional channel-space dependencies. (MLP is an encoder–decoder structure with reduction ratio r, the same as BAM.) The channel attention submodule is shown in
Figure 5.
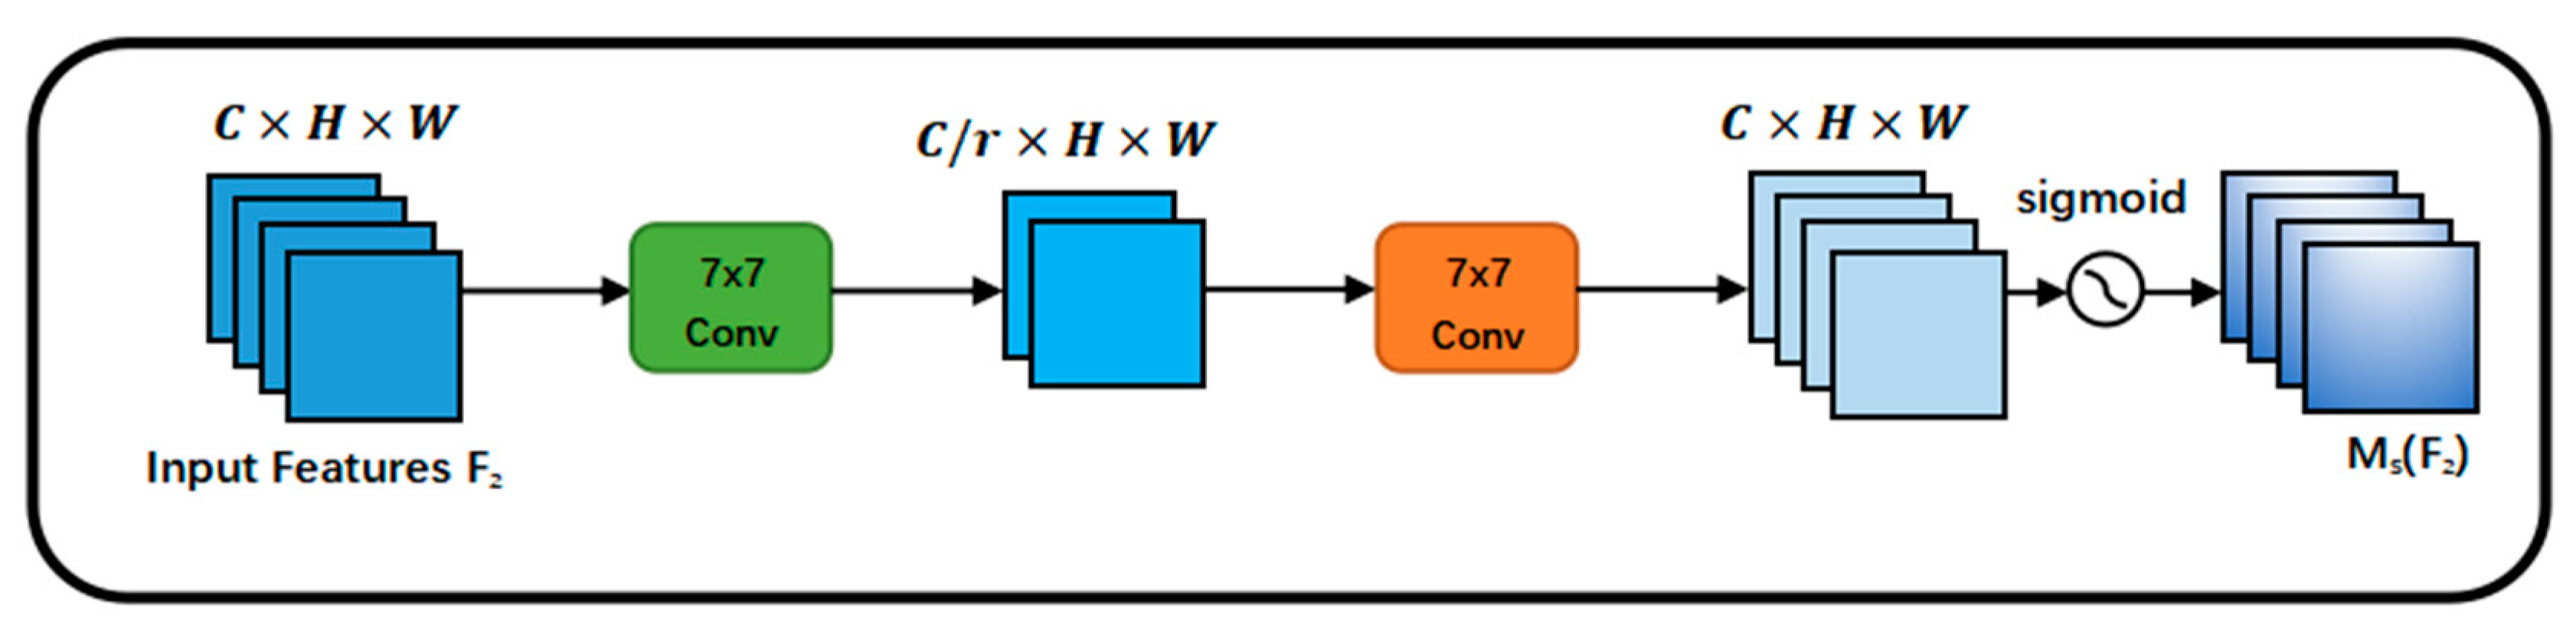
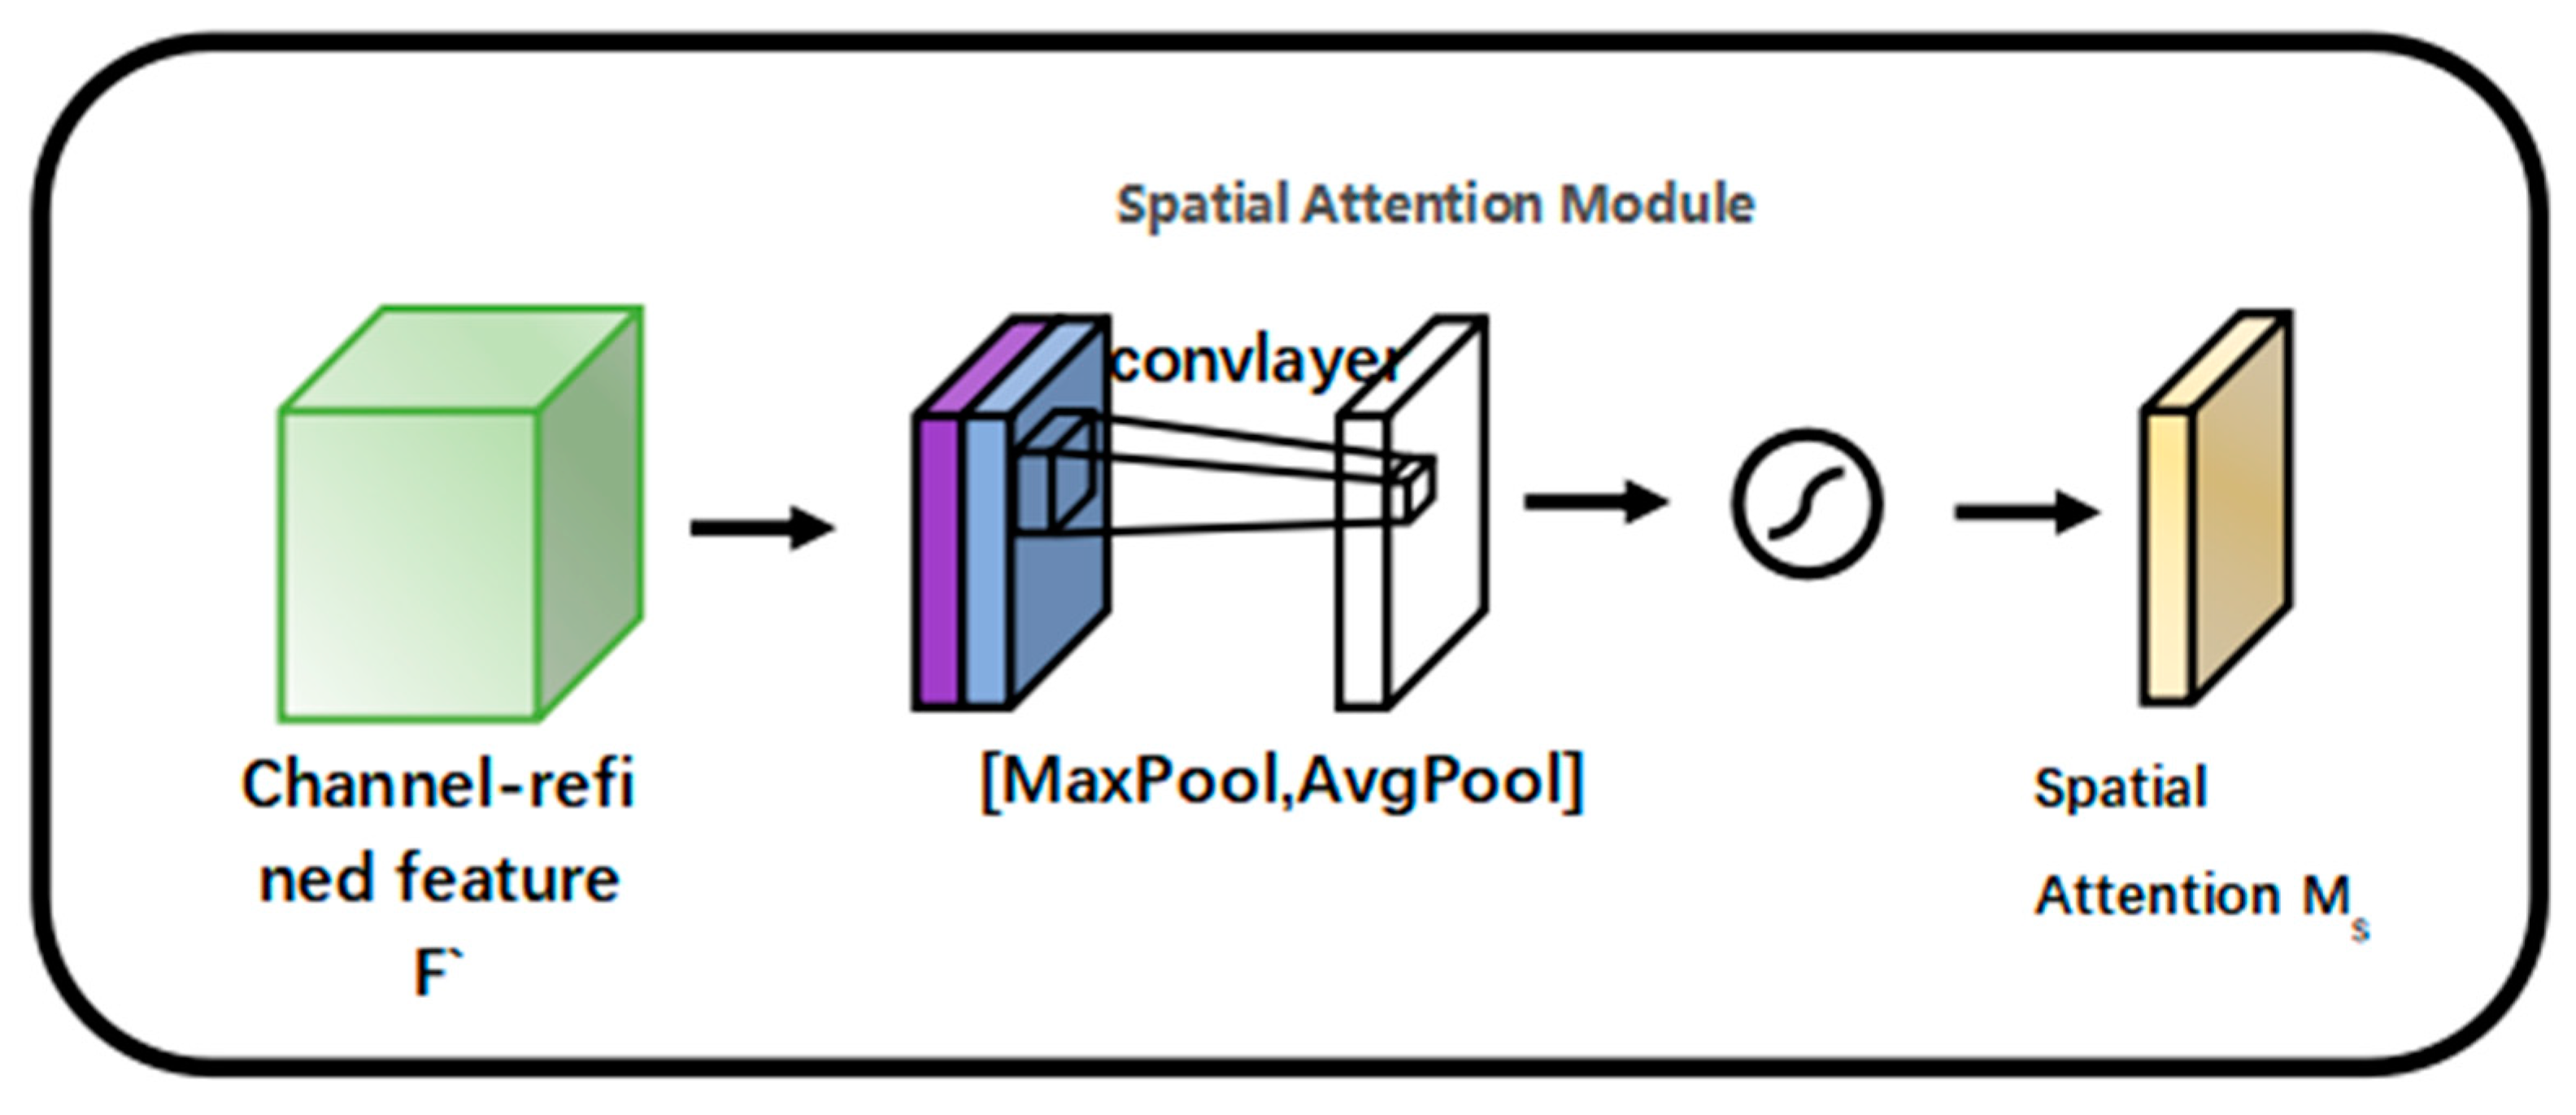
Two convolutional layers are employed for spatial information fusion in the spatial attention submodule in order to concentrate on spatial information. Additionally, the information is diminished as a result of the maximum pooling procedure, producing a negative contribution. In this module, the pooling process has been eliminated to further protect the feature mapping. As a result, the spatial attention module occasionally considerably raises the number of parameters. Group convolution with channel mixing wash is employed to stop the parameters from rising significantly.
Figure 6 depicts the spatial attention submodule.
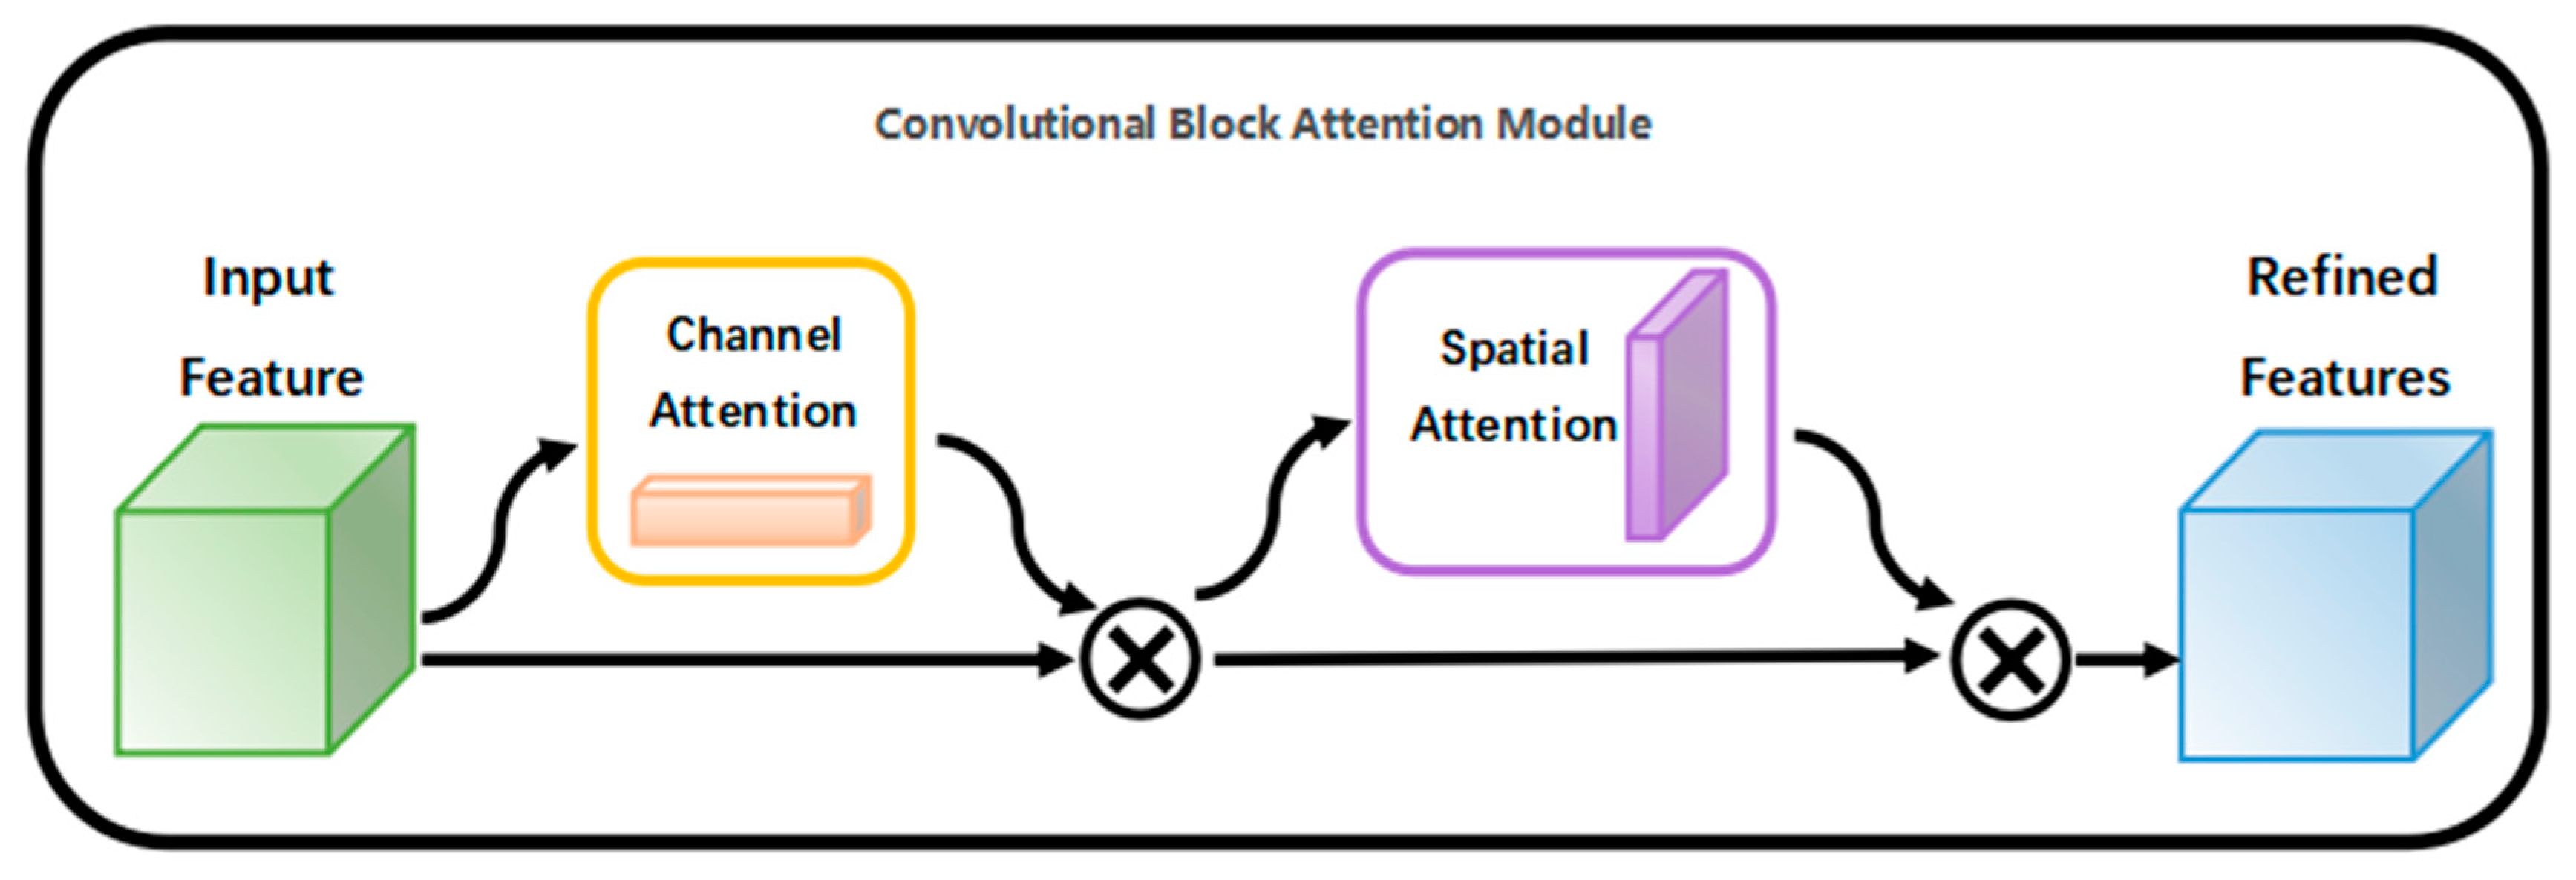
2.4. CBAM Attention Mechanism
Due to the problem of low pixel count of
Leaf blight targets in the image, which is prone to missing information, the CBAM attention mechanism is added to the network model to improve the target detection accuracy. The CBAM attention mechanism contains two independent sub-modules, the channel attention module and the spatial attention module, which perform attention operations (attention) on channel and space, respectively. This not only improves the time complexity and spatial complexity, but also integrates into the existing network architecture as a plug-and-play module. Given an intermediate feature map, the input weights are inferred sequentially along both spatial and channel dimensions, and then multiplied with the original feature map to make adaptive adjustments to the features. The structure of the CBAM attention mechanism is shown in
Figure 7.
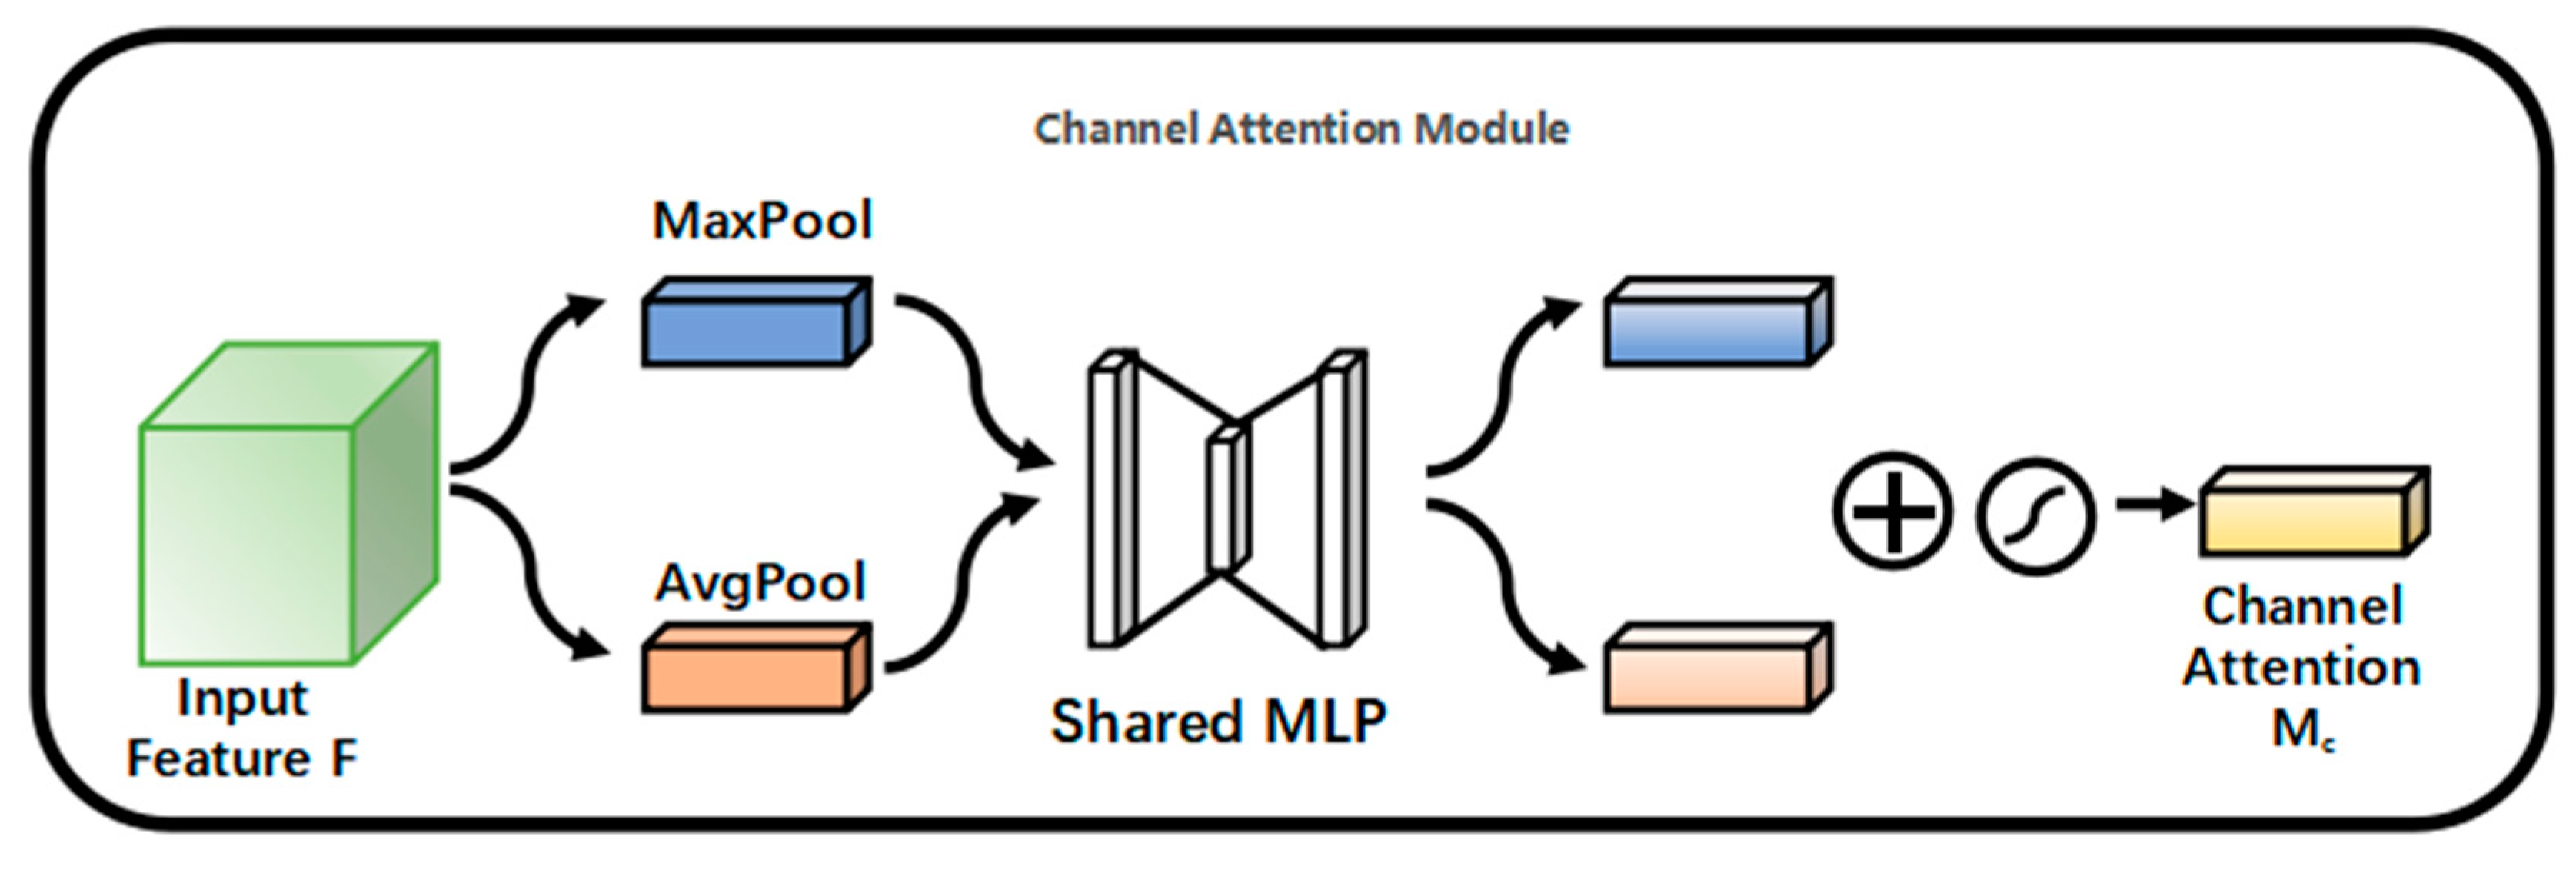
Firstly, the input features are fed into a two-layer neural network (multilayer perceptron (MLP)) after global maximum pooling (maxpool) and global average pooling (average pool). The two features output from the MLP are then summed and activated by a sigmoid function to generate the input features needed for the spatial attention mechanism module. The channel attention module is shown in
Figure 8.
The feature maps produced by the channel attention method are first subjected to global maximum pooling and global average pooling, and then the two results are channel spliced. The two features are multiplied following the sigmoid activation function to produce the final generated features after the convolution operation to decrease the dimension into 1 channel.
Figure 9 displays the module for spatial attention.
2.5. Integrated Learning
Although the aim of deep learning is to train a model with good performance and strong robustness, this is not always the case, as various individual learners frequently exhibit their own “preferences” for learning features. Several weakly supervised models are combined using “preferences” in ensemble learning [
21] to create a stronger, more effective supervised model.
Table 2,
Table 3 and
Table 4 illustrate the principle, where signifies the ith model.
In order to properly combine them, integrated learning often begins by creating a number of separate learners [
22]. The more homogeneous the integrated individual learners are, the larger the effect of integration will be; hence, the integration in
Table 2 has a “positive effect”; additionally, the greater the diversities and accuracy of individual learners, the better the integration will be.
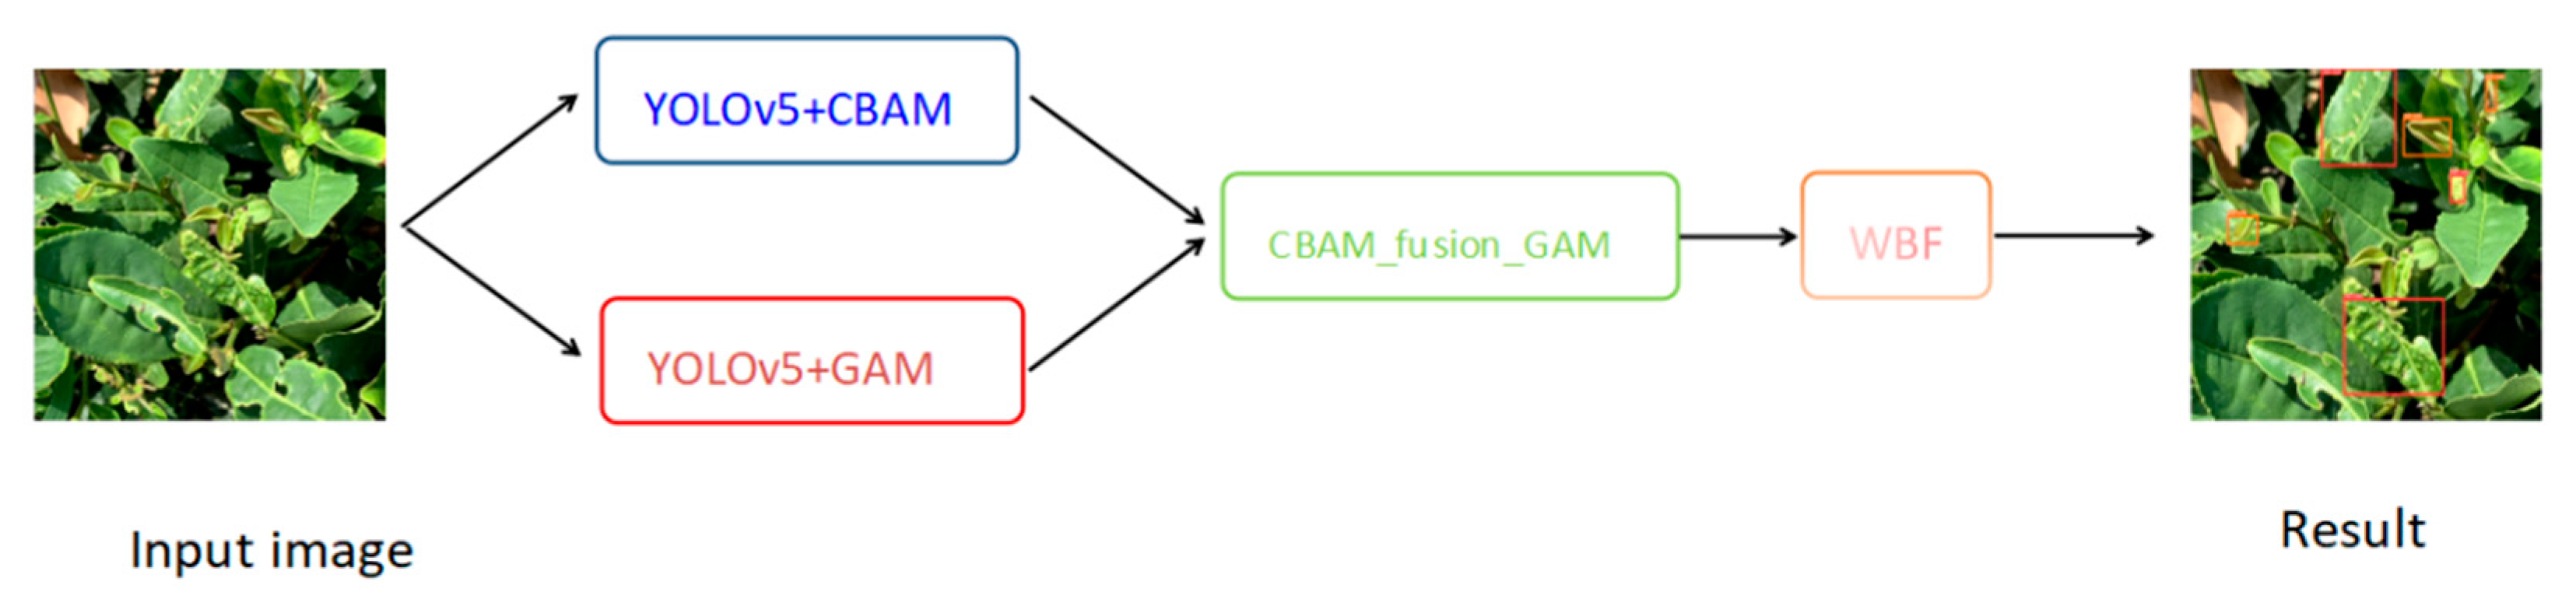
Given that real-world tea pest and disease detection required a high level of algorithmic accuracy, we went with a single-stage model with better real-time performance. Using experimental observations, we discovered that YOLOv5 + GAM occasionally fails to detect Leaf blight but is better at recognizing Apolygus lucorμms. While YOLOv5 + CBAM is less cautious than YOLOv5 + GAM and can only detect a narrow range of Leaf blight, it is sensitive to the Apolygus lucorμm. Consequently, the problem of missed detection of tea pests and diseases can be effectively resolved in this study by combining these two weakly supervised models with various levels of expertise.
2.6. Fusion Model CBAM_Fusion_GAM
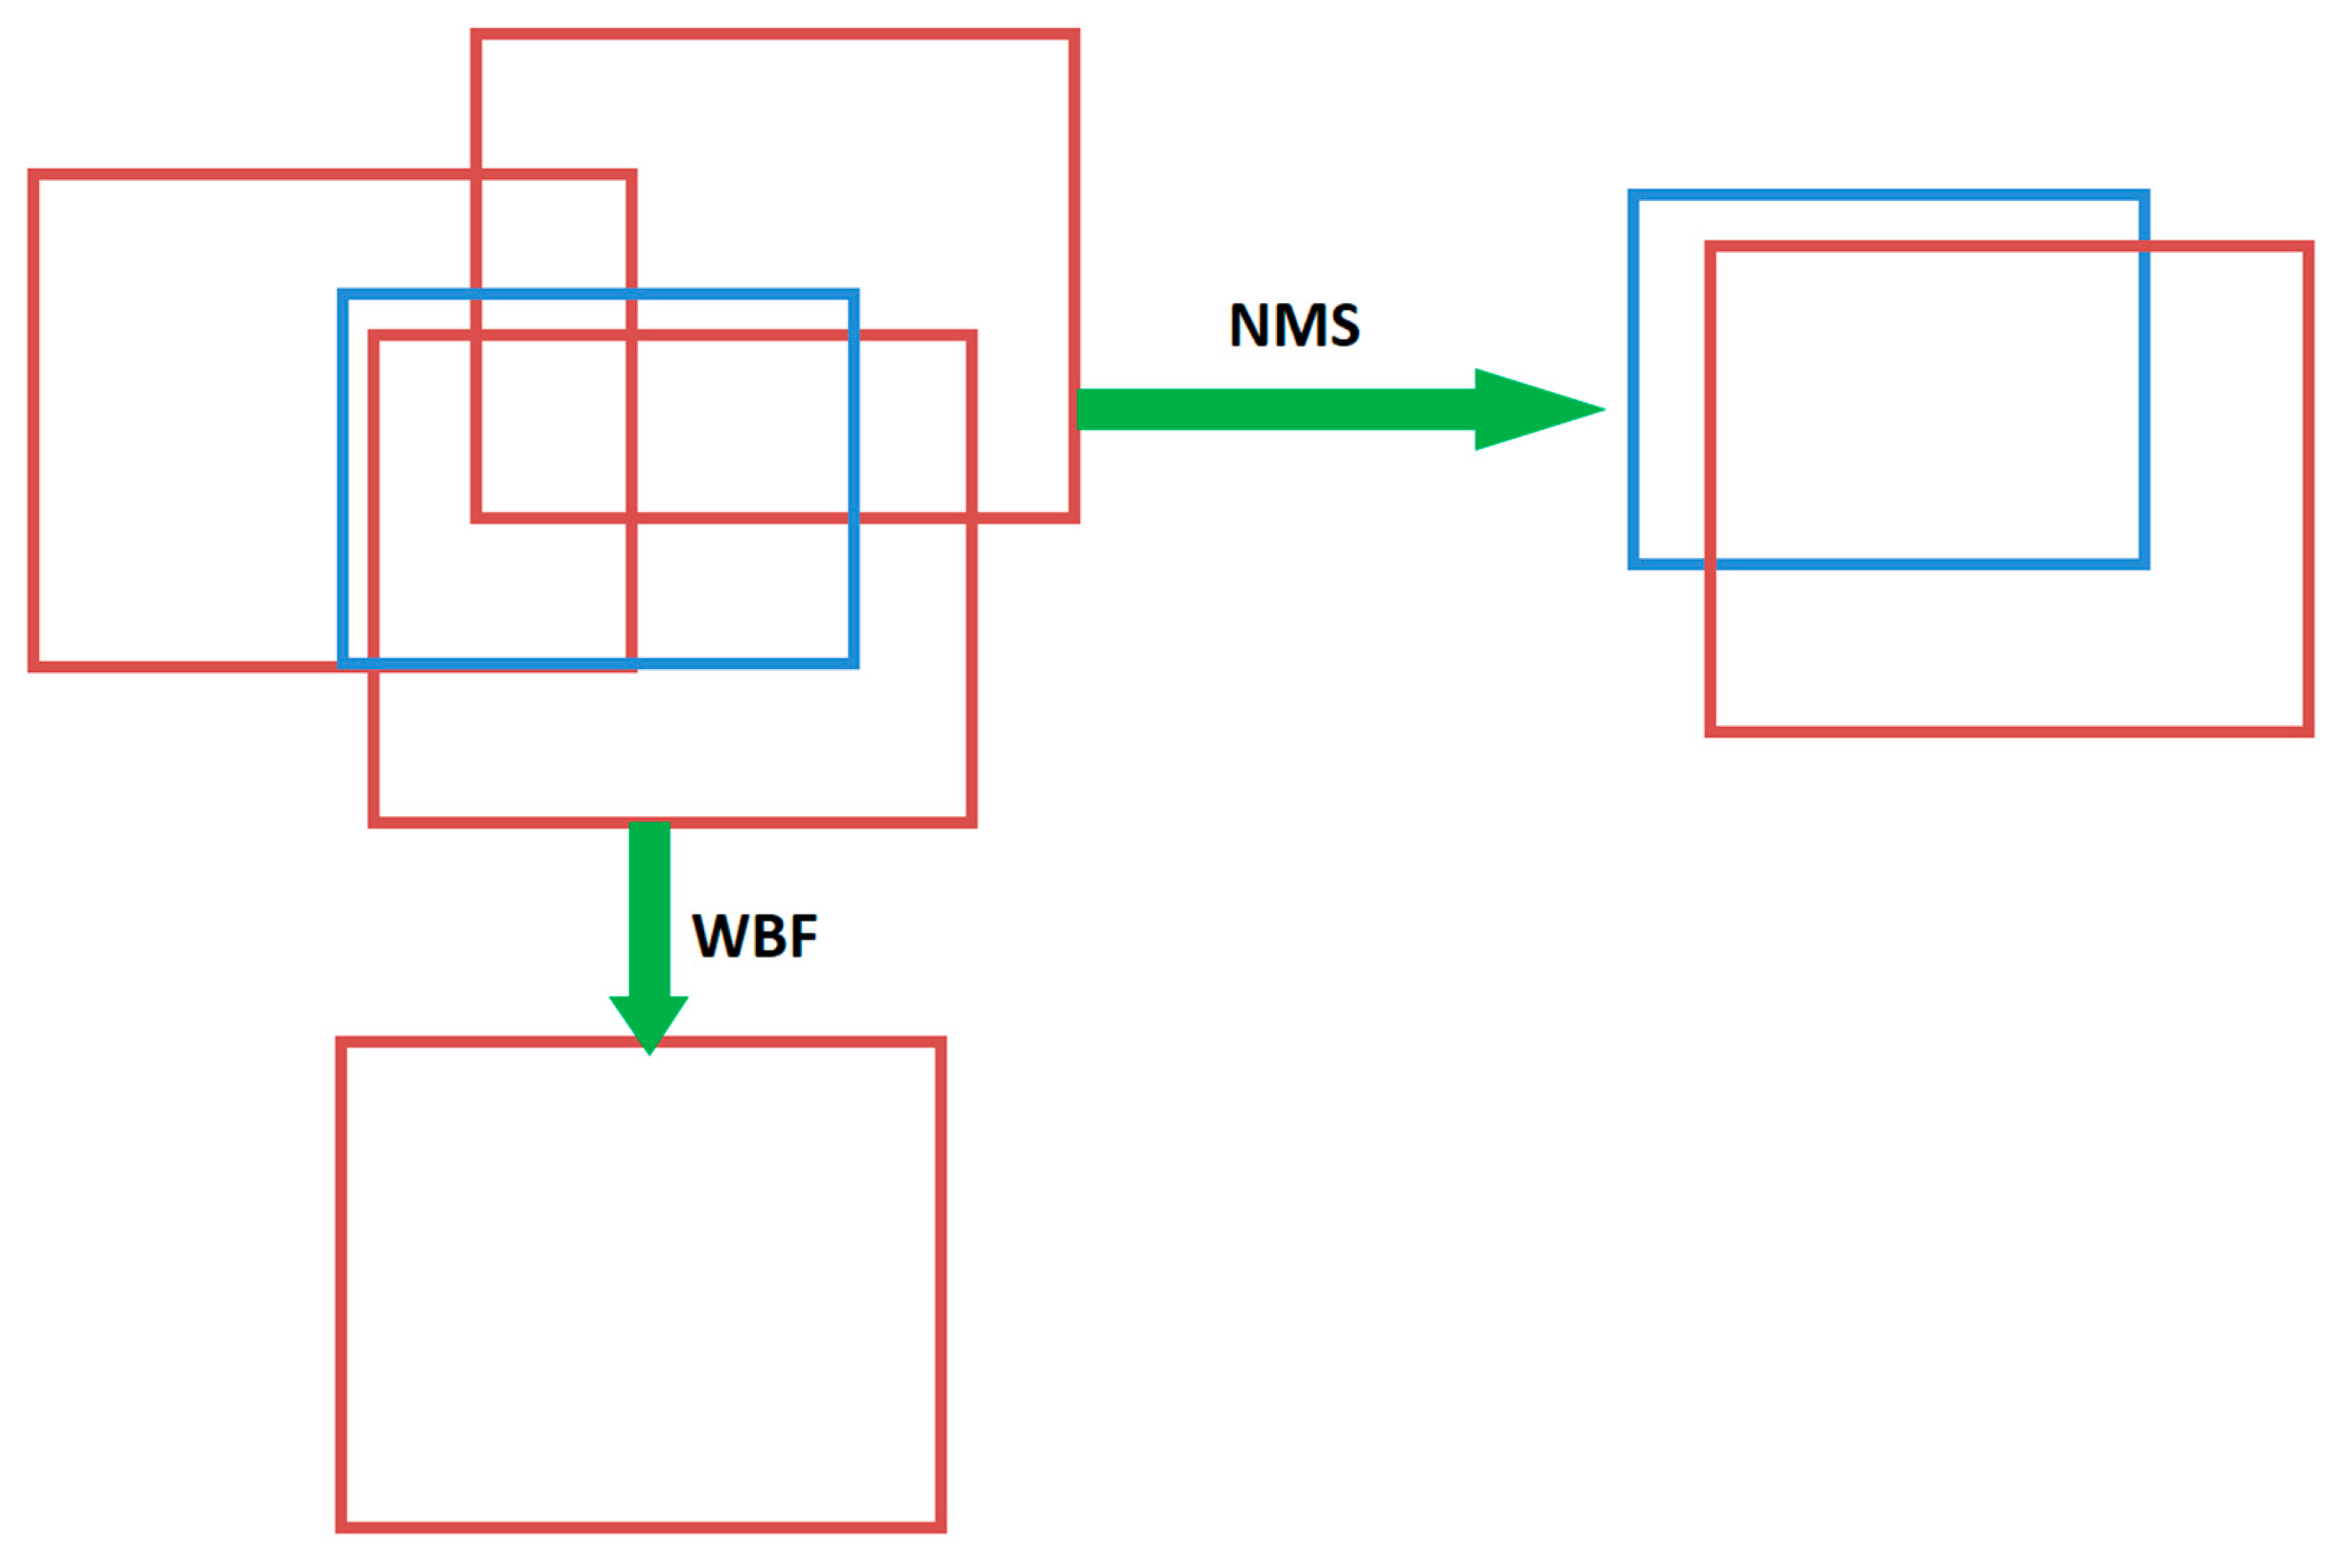
Non-Maximum Suppression (NMS), a common technique for filtering prediction frames, relies on the selection of a single threshold IoU [
23]. Nevertheless, using alternative thresholds may have an impact on the model’s final outcomes. When two objects are placed side by side, one of them is taken away. Because NMS throws out unnecessary boxes, it cannot efficiently create average local forecasts from several models.
Figure 10 shows that, in contrast to NMS, the WBF method constructs the fused frames using the confidence (score) of all prediction frames.
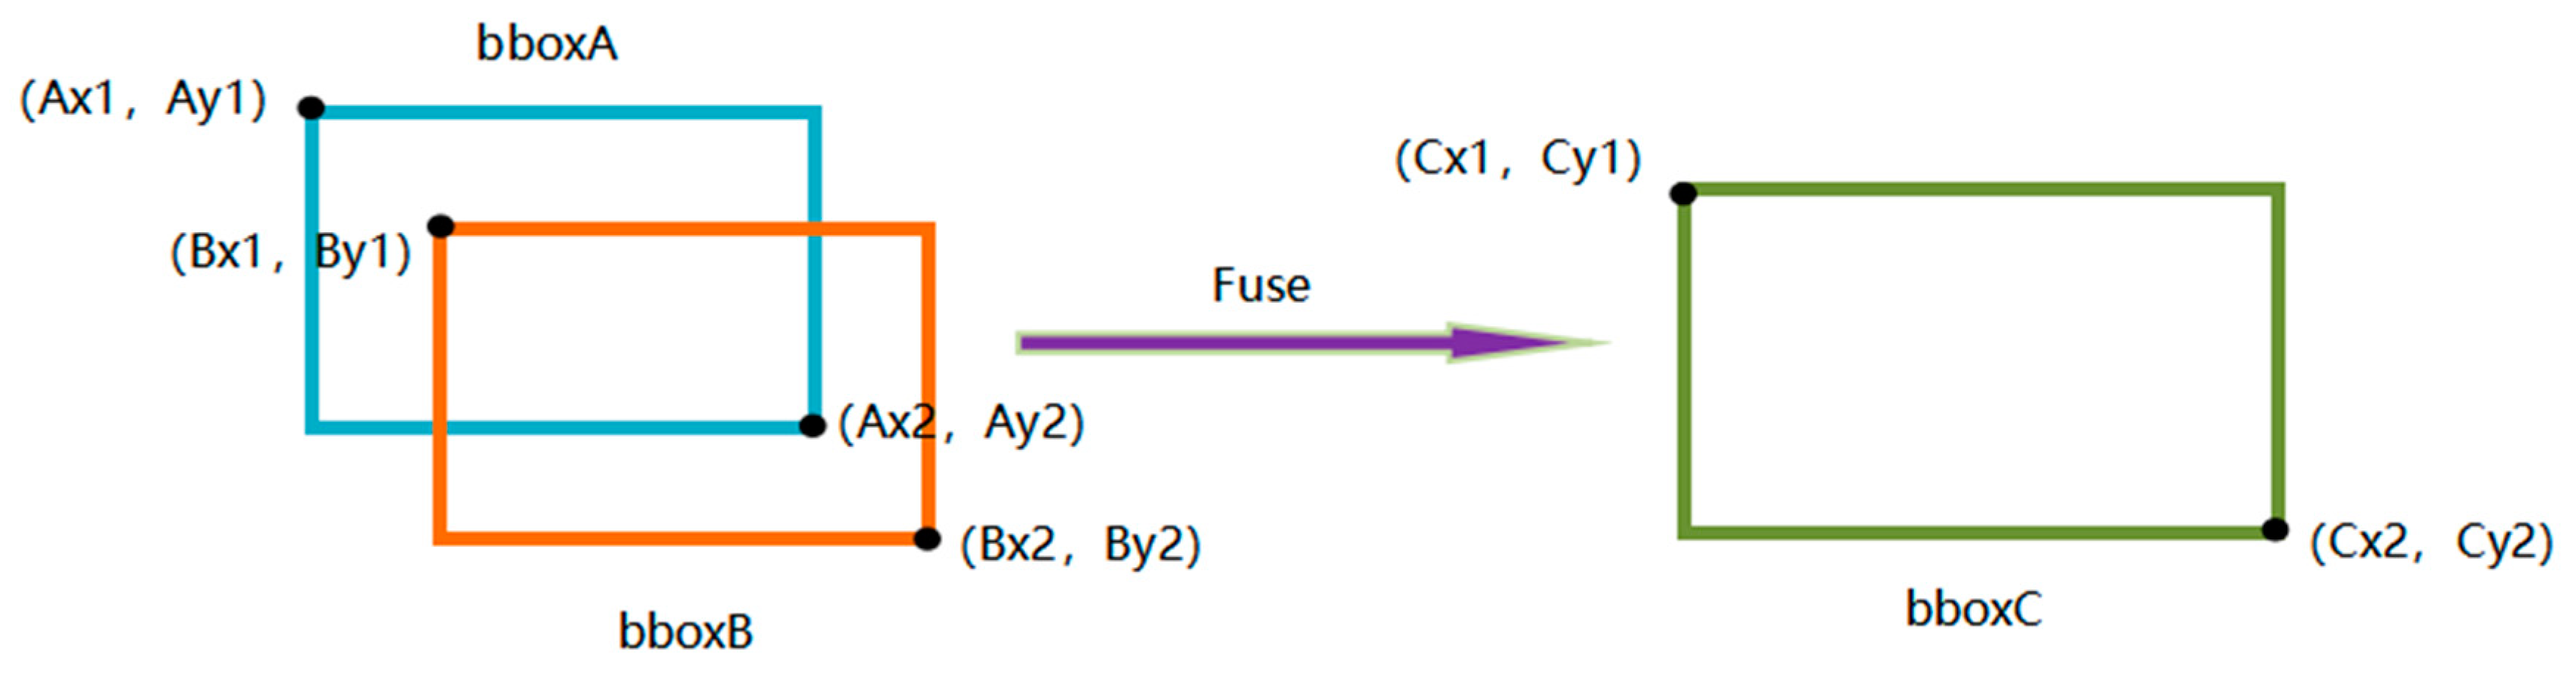
Two prediction frames are given as an example to show how the weighted frame that results from the fusion of the two prediction frames is calculated. Assume that each of the two prediction boxes represent the coordinates of the box’s upper left and lower right corners, respectively, and represent the box’s confidence level. These coordinates were derived using and fusion, as illustrated in
Figure 11.
Experimental tests have shown that each model has the advantage of extracting different features from different models. Therefore, the fusion of two different models based on YOLOv5 and the use of the advantages of each model can considerably enhance the model’s robustness and detection performance.
The WBF algorithm formula is shown in the following Equations.
The upper-left coordinates of the fused box are determined to use Equations (1) and (2), the lower-right coordinates are calculated using Equations (3) and (4), and the confidence level of the box is calculated using Equation (5).
The integrated architecture model diagram is shown in
Figure 12.
2.7. Model Evaluation
To accurately assess the effectiveness of the improved detection models, the evaluation metric used precision (
P), recall (
R), mean Average Precision (mAP), and mAP@.5:.95 to compare the performance of each model. mAP@.5:.95 indicates the average mAP over the overlap degree (
IoU) threshold (from 0.5 to 0.95 in steps of 0.05), which mainly reflects the boundary regression capability. The
IoU calculation formula is shown in Equation (6).
where
A represents the prediction frame and
B represents the true frame.
The formulas representing accuracy (
P) and recall (
R) are shown in Equations (7) and (8).
TP is the number of pests and diseases detected accurately at the same time,
FP is the number of pests and diseases not detected but detected incorrectly,
FN is the number of pests and diseases but detected incorrectly,
AP is the average accuracy and represents the average of all accuracies obtained for all possible values of recall. mean Average Precision (mAP) is the average of
AP values going down all categories. The average accuracy (
AP) and mean Average Precision (mAP) are calculated as shown in Equations (9) and (10).
TN is the number of no pests and diseases detected accurately at the same time, and m denotes the dataset’s overall classification count for categories.
2.8. Training
The experimental environment configuration can be found in
Table 5.The specific parameters of training are shown in
Table 6, and the specific division of the dataset is shown in
Table 7. In this study, comparison experiments will be set up to compare the improved model with the original model and some mainstream target algorithms for training and validation on the same dataset, as well as the same experimental equipment.
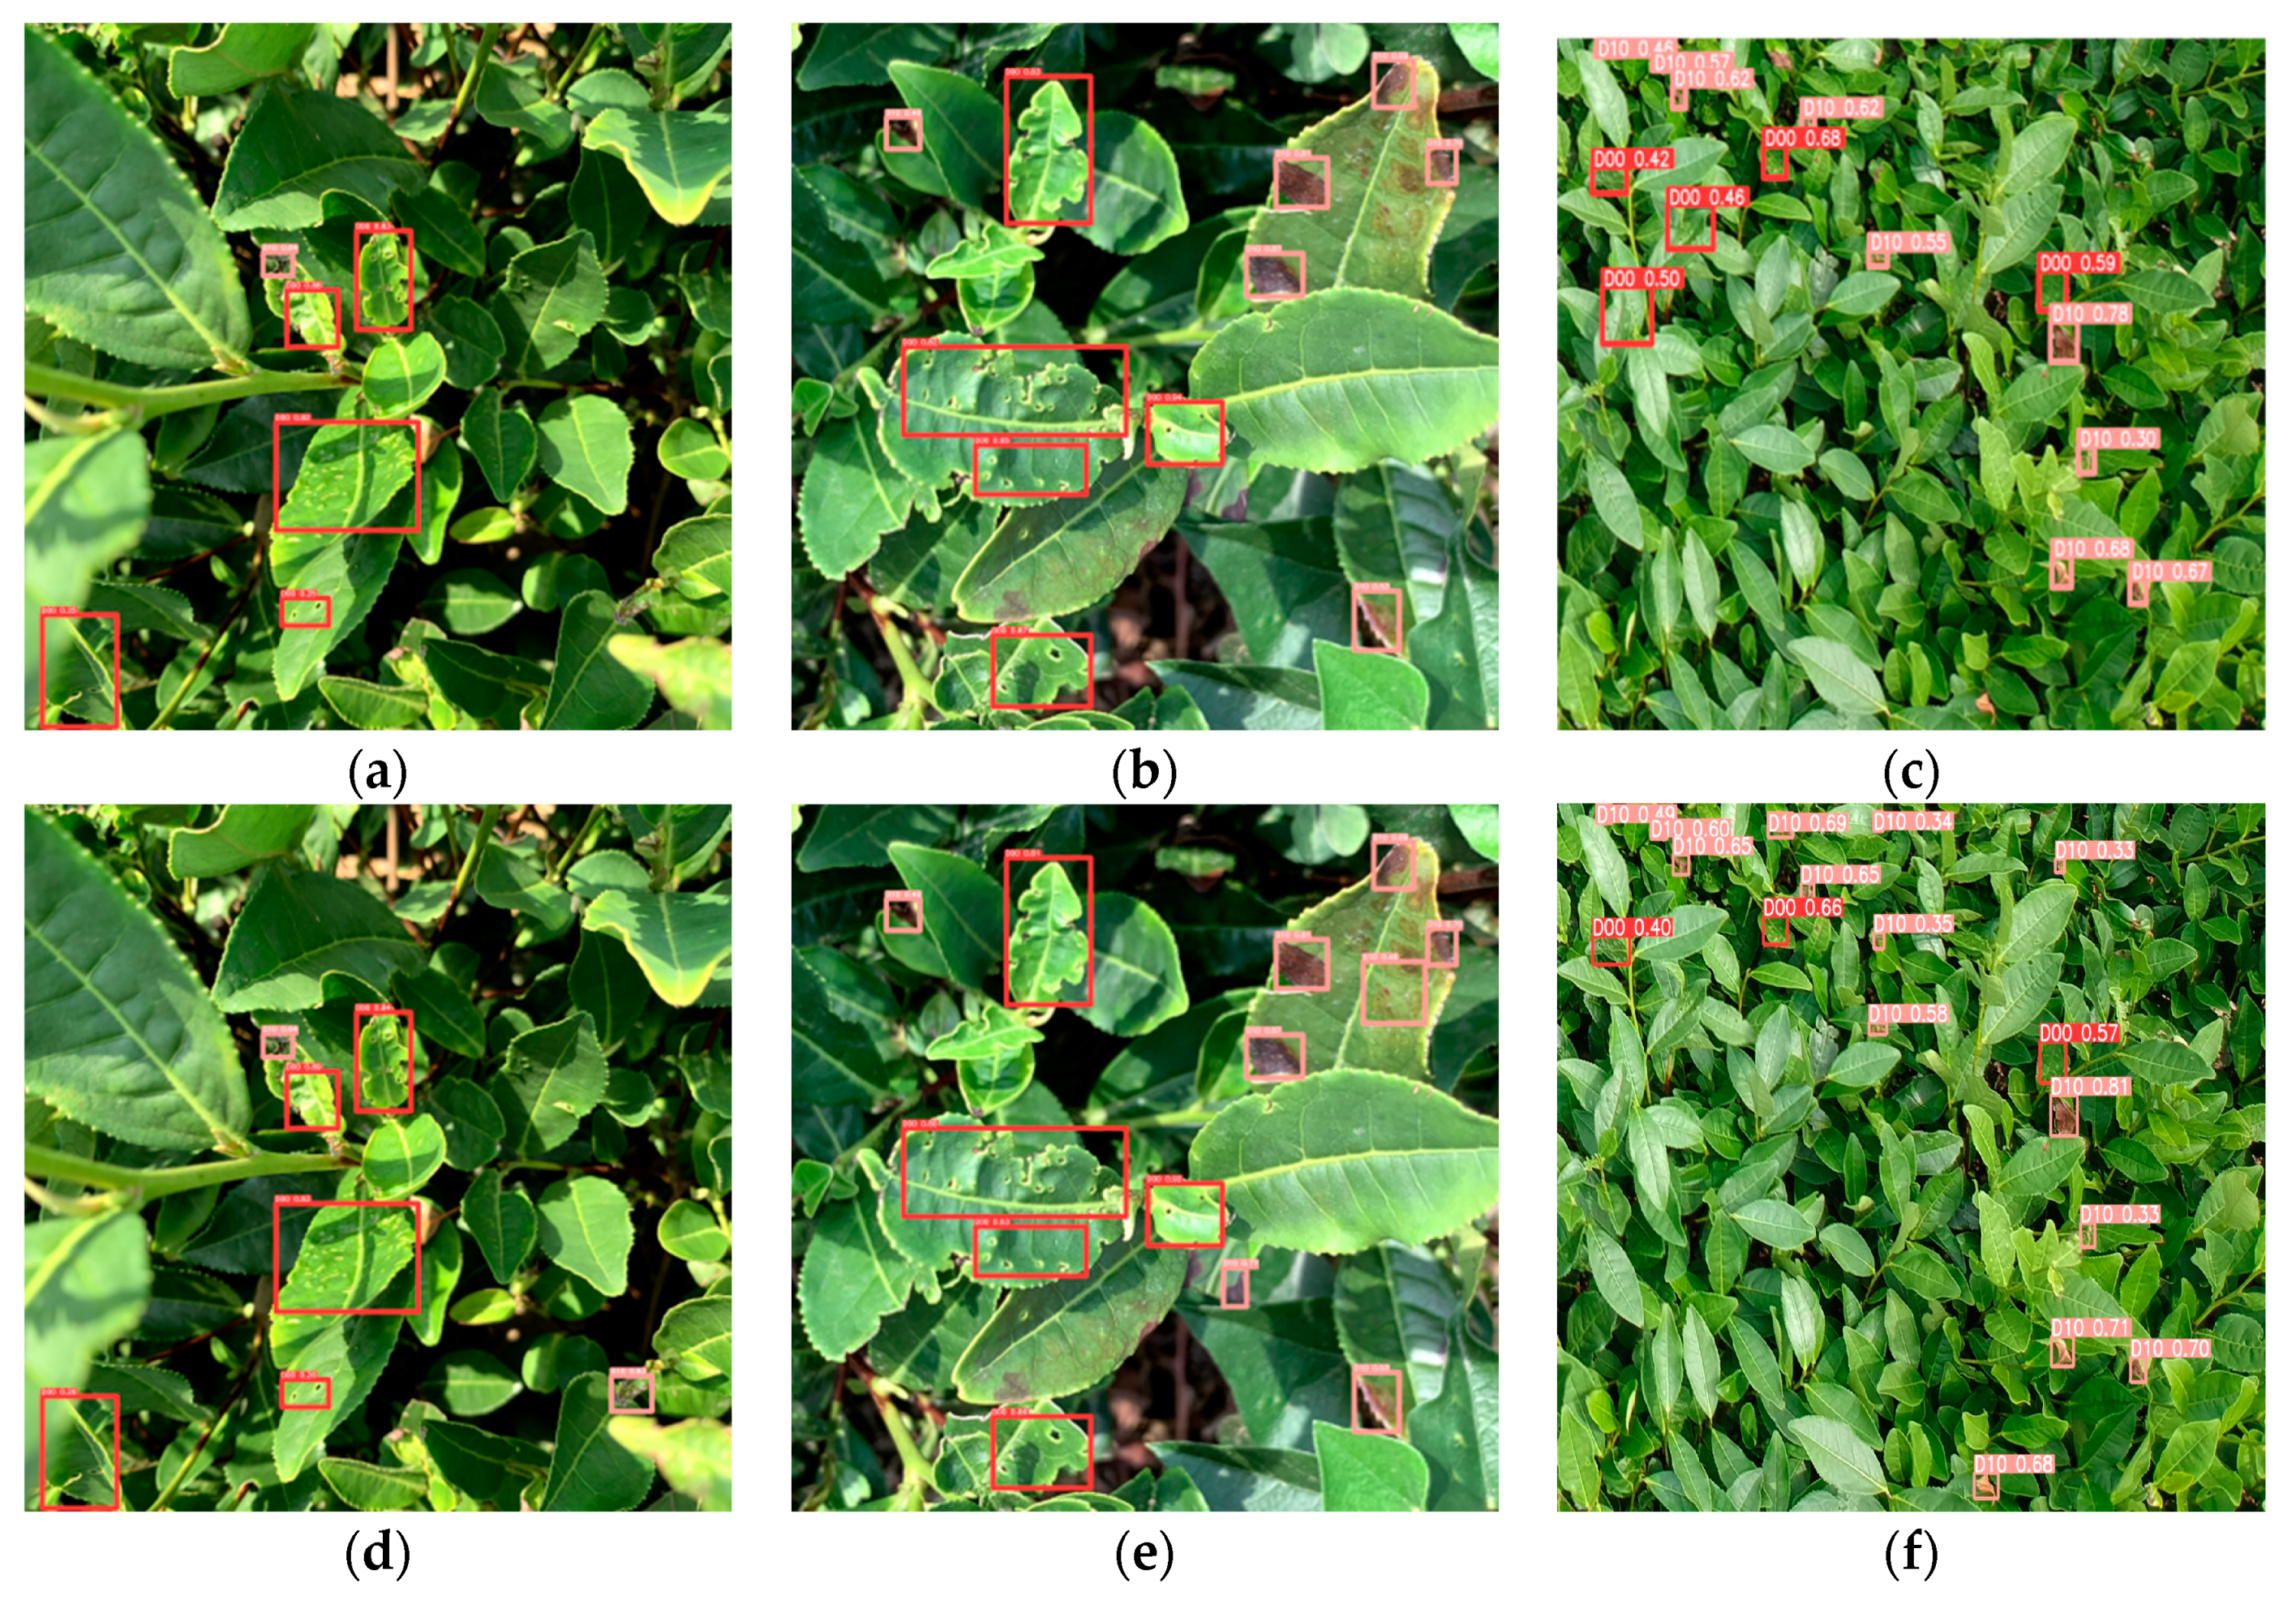
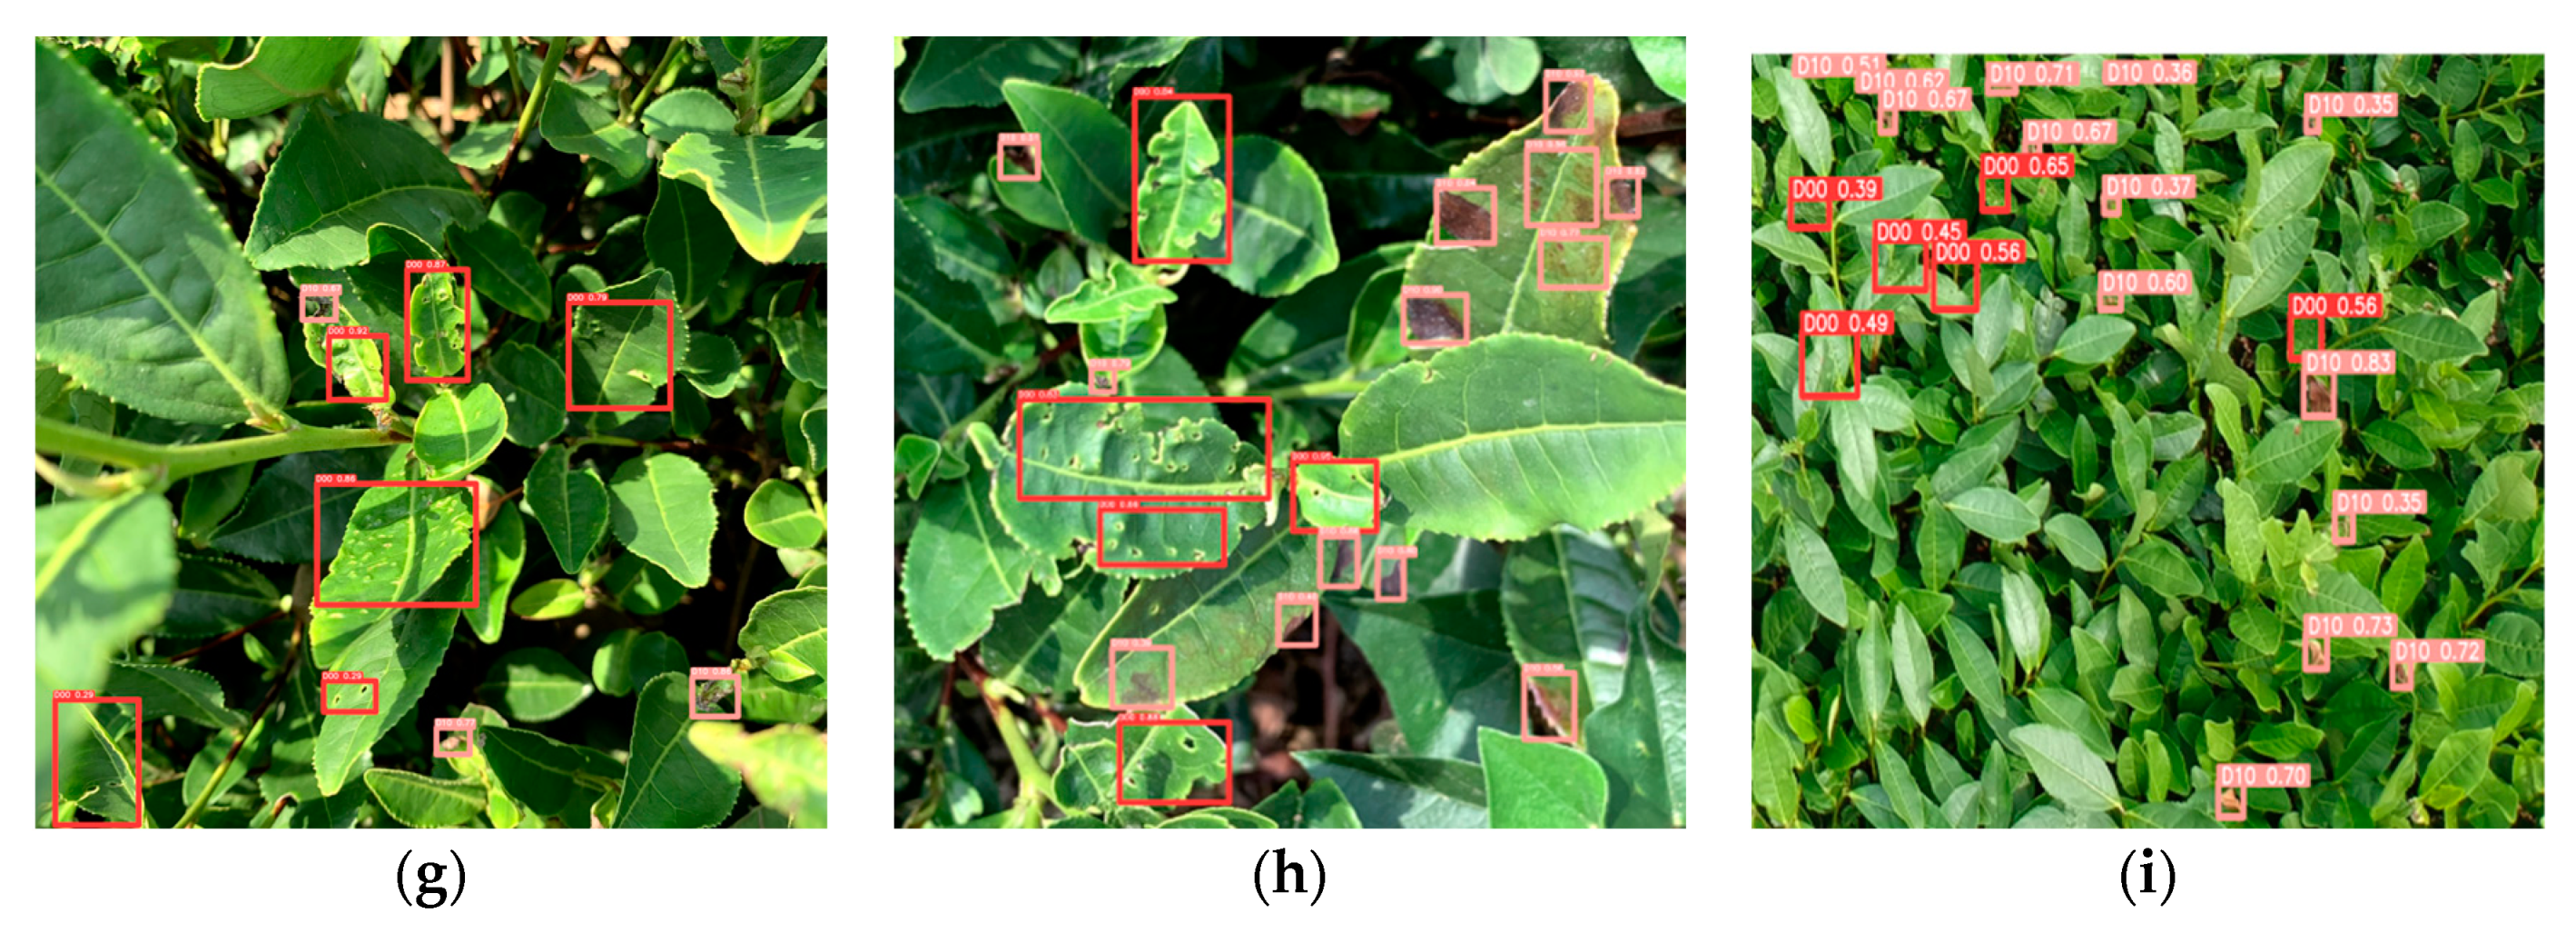
4. Discussion
Due to various characteristics such as texture, shape, and color, diseases and insect pests of tea tree leaves are hard to accurately detect. Since the original model of YOLOv5 could not effectively focus on Leaf blight and Apolygus lucorµm, we added the GAM attention mechanism to YOLOv5 to enable our model to better concentrate on the Apolygus lucorµm and extract the pest features more purposefully. In order to better focus on the global information of Leaf blight, the CBAM attention mechanism was added to YOLOv5, and it was found that the CBAM attention mechanism had a better recognition effect than the GAM attention mechanism for t features highlighted in the background, so it was more effective than the GAM attention mechanism in the recognition of Leaf blight, but weaker for the recognition of Apolygus lucorµm. This paper proposes a new integrated model based on YOLOv5 + CBAM and YOLOv5 + GAM. YOLOv5 + GAM is good at the detection of pests and diseases with large areas and large background differences, though it struggles to detect small targets and the problem of missing detection occurs. At the same time, although YOLOv5 + CBAM is less sensitive for detecting foliar pests over large areas, it is more “careful” than the previous one and can identify as many diseases as possible on leaves. Therefore, this paper proposes an efficient integration strategy model CBAM_fusion_GAM, which integrates two separate models to achieve the complementary advantages between the models, and finally completes the detection of apple tree leaf diseases after the parallel processing of the two models and the removal of redundant frames using the WBF algorithm.
The experimental tests show that each model has the advantage of extracting different features from different models. Therefore, the integration of two different models based on YOLOv5 can considerably enhance the model’s robustness and detection performance by using the advantages of each model.
However, the CBAM_fusion_GAM model still has shortcomings when it comes to detecting complex backgrounds. Firstly, it is prone to false detection, and secondly, there is also leakage for detection of very small targets. Therefore, there is still much room for improvement for both problems.
Finally, motivated by Lin’s two deep learning bus route planning applications [
24,
25], we also intend to create a deep learning model for planning individual drones for pesticide spraying on tea plantations in our subsequent research. In addition, the method proposed by Xue et al. [
26] allows direct modeling of the detailed distribution of canopy radiation at the plot scale. In our opinion, the method proposed by Xue et al. may be a useful aid to our subsequent continued research on tea diseases and insect pests. Finally, our detection model is still in the laboratory stage, and we will also consider how to deploy this detection model in future studies.
5. Conclusions
Tea pests and diseases are variable and of different types, and most of the tea pest and disease detection at this stage relies on the experience of experts, so this paper proposes an integrated learning-based tea pest and disease identification model.
In order to carry out effective pest and disease identification, we have carried out the following work. First, we chose the YOLOv5 model, which is widely used in the field of target detection. Second, we made three improvements to the YOLOv5 model due to its ineffectiveness for pest detection. The CBAM attention mechanism was added to enable the model to better focus on the Leaf blight target. The GAM attention mechanism was added to enable the model to better focus on the Apolygus lucorµm. The model detection frame is optimized by WBF algorithm after fusing the two trained models together. Finally, we experimentally verified the effective improvement of our model compared to the original YOLOv5 model.
In future work, we will continue to improve the model by seeking more efficient and less parameter-intensive methods. We will also investigate methods for deploying tea pest detection models.


