Article

Predicting Aboveground Biomass and Carbon Storage for Ma Bamboo (Dendrocalamus latiflorus Munro) Plantations

1
Department of Forestry, National Chung Hsing University, No. 145, Xingda Rd., Taichung 40227, Taiwan
2
Chiayi Forest District Office, Taiwan Forestry Bureau, No. 1, Lin-Shen West Rd., Chiayi 60049, Taiwan
3
Forest Management Division, Taiwan Forestry Research Institute, No. 53, Nanhai Rd., Taipei 10066, Taiwan
*
Author to whom correspondence should be addressed.
Forests 2023, 14(4), 854; https://doi.org/10.3390/f14040854
Submission received: 3 March 2023 / Revised: 14 April 2023 / Accepted: 17 April 2023 / Published: 21 April 2023
(This article belongs to the Special Issue Ecological Functions of Bamboo Forests: Research and Application)

Abstract

:
The purpose of this study was to predict aboveground biomass (AGB) and aboveground carbon storage (AGCS) in Ma bamboo (Dendrocalamus latiflorus Munro) plantations. A total of 25 bamboo samples were selected and felled based on age and diameter at breast height (DBH) classes. Two types of allometric equations (with and without an age factor) were used to develop biomass models for foliage, branches, culms and aboveground parts. Moreover, three intensively managed Ma bamboo plantations were used in this study to predict AGB and AGCS. The above two biomass models and a diameter distribution model were used to predict AGB for the three bamboo stands. The AGCS was predicted based on the AGB and percent carbon content. The results showed that the proportions of foliage, branches and culms to AGB were 11.1, 23.7 and 65.2%, respectively, at the individual bamboo level. The mean percent carbon content was predicted to be 41.68, 44.21 and 46.72% for foliage, branches and culms, respectively. The allometric equation with the age factor had better predictive ability than that without the age factor, with the former having higher R2 and lower root mean square error values. Compared to the AGB predicted by the allometric model with the age factor at the stand level, the range of relative error was from −16.56 to 5.26% and from −40.0 to 71.7% for the AGB predicted by the allometric model without the age factor and that by the diameter distribution model, respectively. According to the allometric model with the age factor, the AGB and AGCS were predicted to be 35.7 ± 3.4 and 16.3 ± 1.5 Mg ha−1, respectively, in Ma bamboo plantations. The results also reflected that the current status of Ma bamboo management is intensive management, where the focus is on harvesting bamboo shoots.

1. Introduction

Taiwan is an important area of global bamboo distribution because its climate and environment are suitable for bamboo growth [1,2,3]. More than 150,000 ha of bamboo forests with high biological diversity and productivity are distributed throughout Taiwan, which have environmental, economic and social value [1,4]. Biomass accumulation is an important stand characteristic of bamboo forests because it helps assess various values of bamboo forests, including productivity and carbon storage capacity. Using an allometric function based on diameter at breast height (DBH) is considered a realistic approach for predicting the biomass of bamboo plantations. Usually, the samples used to build the model are based on a stratified sampling method or cover the entire range of DBH values. The model could be reasonably scaled to each individual stand when there is a high correlation between the sample data and the model. As a result, the biomass yield of whole stands can be obtained from the summation of each individual bamboo. In addition to biomass prediction, this approach is also suitable for further predicting carbon storage because the carbon storage of wood plants is usually close to half of their biomass value, i.e., carbon storage = 0.5 × biomass. However, determining the percent carbon content (PCC) for a certain tree or bamboo species helps accurately predict carbon storage if the PCC has been established. In recent years, bamboo forests worldwide have been discovered to have high potential carbon storage, with most of those studies being based on the above approach [2,3,5,6,7,8,9,10].
The diameter distribution model (DDM) is another available approach to predicting biomass yield for bamboo forests. A generalized framework of the DDM was proposed by Hyink and Moser [11] and was employed for projecting timber forest yield. The structure of the DDM is more complex than that of the allometric function because this model contains a diameter distribution function (such as the Weibull function) and a yield function (e.g., the allometric equation for volume or biomass) [2,11,12]. Although the stand yield predicted by the DDM contains abundant information, the application of this model is subject to whether the stand diameter can be quantified [2,10]. This model has accurately predicted biomass yield and carbon storage for Makino bamboo (Phyllostachys makinoi Hayata) plantations [2,10]. Using the DDM for another bamboo species can demonstrate its applicability. Ma bamboo (Dendrocalamus latiflorus Munro) is an important bamboo species because both its shoots and culms have commercial uses; the former is a delicious food and the latter is a good raw material [1,13,14,15]. Therefore, pure and mixed plantations are widely distributed around the plains and low mountainous areas in Taiwan [1,14]. This bamboo has an apachymorph rhizome morphology. Therefore, it appears as an aboveground clump structure on land, with each clump containing culms of various ages [1].
To expand the understanding of Ma bamboo, the purpose of this study was (1) to develop biomass equations based on allometric functions, (2) to employ models to predict aboveground biomass (AGB), (3) to evaluate the applicability of the DDM for predicting AGB, (4) to determine the percent carbon content (PCC) and (5) to estimate aboveground carbon storage (AGCS) for Ma bamboo plantations.

2. Materials and Methods

2.1. Study Areas

The study site was located in Nantou County of central Taiwan. Due to this region’s abundant rainfall and optimum temperature for bamboo growth, the site is rich in bamboo resources, with both a broad cultivation area and high biodiversity. According to the records of the Sun Moon Lake weather station from 1980 to 2020 (a weather station within Nantou County, near our study site), the annual rainfall was 2343 mm year−1, and the monthly average temperature was 19.3 °C and ranged from 14.4 °C (January) to 22.9 °C (July) [16]. Among the various bamboo species, some species, such as Ma bamboo, Makino bamboo and Moso bamboo (Phyllostachys pubescens Mazel), have high economic value [2,3,4,6,14]. Usually, bamboo species with economic value are planted and managed by farmers on plantations. The present study addressed Ma bamboo plantations distributed in a low mountainous area.

2.2. Data Collection

This study was conducted on six Ma bamboo stands managed by farmers in Nantou County. These stands were located between longitudes of 120°42′06″ and 120°42′29″ E and latitudes of 23°41′56″ and 24°42′45″ N and distributed in a low mountainous area with an elevation of 348–538 m. Detailed information on these stands is shown in Table 1.
All the bamboo stands examined in this study were plantations. Among these stands, five were pure stands and one was a mixed stand (stand D). Stand D consisted of Ma bamboo mixed with betel nut (Areca catechu Linn). Thinning, fertilizing and irrigation were conducted on stands A, B, C and D, while only thinning was conducted on stands E and F. Usually, thinning, fertilizing and irrigating are considered intensive management practices, while only thinning is considered an extensive management practice [6].

2.3. Fundamental Information on the Stands in This Study

In a previous study, several stand characteristics were analyzed, including mean DBH, mean culm height (H), clumps per hectare and culms per clump for the six stands [14]. However, the treatments and stand status of the six stands were not consistent. They varied with the farmers’ management strategies (i.e., intensive and not intensive management) and stand structure (i.e., pure and mixed stands) (Table 1). To consider the consistence of stands, we selected three stands and performed intensive management at the stand level (stands A, B and C). The stand characteristics of these three stands are briefly summarized as follows. The mean DBH was 7.7 ± 1.6 cm; the mean culm height was 8.9 ± 1.0 m; the clump density was 467 ± 153 clumps ha−1; the culms per clump was 7.0 ± 3.6 culms clump−1 for the three stands [14]. In addition, the stand diameter distribution of these three stands was quantified by the Weibull function, and all passed the Kolmogorov‒Smirnov (K‒S) test. This result indicated that the Weibull function effectively quantified the DBH distribution for these three stands. The a, b and c parameters of the Weibull function were predicted to be 2.61 ± 1.64, 6.06 ± 0.84 and 3.56 ± 0.61, respectively [14]. For detailed information on these three stands, please refer to Sun and Yen [14].

2.4. Methods

2.4.1. Sampling to Determine Biomass and Percent Carbon Content

Since Ma bamboo is pachymorphic, we calculated the number of clumps for each stand, and six clumps were selected as samples for each stand. The number, DBH, H and age of the culms were measured for each sample clump in the field. After the distribution of the DBH and age of the culms was obtained from all the sample clumps, we sampled individual bamboos based on their DBH and culm age. According to these two factors, the following five DBH classes were classified: I: DBH < 5 cm; II: 5 cm ≤ DBH < 7.5 cm; III: 7.5 cm ≤ DBH <10 cm; IV: 10 cm ≤ DBH < 12.5 cm; V: DBH ≥ 12.5 cm. Culm ages ranging from 1 to 5 years old were chosen for each DBH class. Each sample contained all five age classes, and five different age samples were obtained within each DBH class. As a result, 25 bamboo samples (5 DBH classes × 5 age classes) were obtained in the present study.
After the bamboo samples were felled, the culm height was measured and each sample was divided into 1 m intervals. Different sections of culms, branches and foliage were separated at each interval and were separately weighed and recorded. As a result, the fresh weight of different sections of bamboo samples was obtained from the summation of each interval. Moreover, subsamples from different sections were collected from each bamboo sample. These subsamples were collected from the upper, middle and lower portions of the bamboo samples and were separately weighed and recorded.
These subsamples oven-dried at 70 °C in the laboratory until their oven-dried weight was obtained. We used the ratios of the oven-dried weight to the fresh weight of the subsample to predict the biomass of different sections. For example, foliage biomass estimation was based on the ratios of the oven-dried weight to the fresh weight of the foliage subsamples. Likewise, the biomass of branches and culms was predicted by the same approach. Consequently, the biomass of different sections of individual bamboo samples was obtained [2]. The subsamples of different sections were ground into a powder to determine the PCC by an elemental analyzer (Elementar vario EL III (CHN-OS Rapid, Hanau, Germany), referring to the PCC as the carbon concentration or carbon content.

2.4.2. Predicting Aboveground Biomass by Allometric Model

An allometric function was used to build the relationships between the biomass of each section and DBH. Because we had sample data with age attributes, we employed two methods. One method was to pool all age samples, and the other was to distinguish different age samples for building biomass equations for various sections. DBH was used as an independent variable, and the biomass of foliage, branches and culms and AGB were employed as dependent variables. The model is shown as the following Equation (1), which is also called the power model [2,17,18]:
Bsection = a × DBH b,
where Bsection is the biomass of different sections, including foliage, branches and culms and aboveground (leaf, branches and culms); DBH is the diameter at breast height of the culm; a and b are parameters.
We used the root mean square error (RMSE) to assess the performance (fitness) of the allometric equations. This indicator was employed to calculate the difference between the observed and the predicted value, and the detailed formula is as follows [19]:
R M S E = i = 1 n ( Y i Y i ) 2 n p ,
where Yi and Ŷi are the i observed and the predicted values in the allometric model, respectively; n is the total number of observations; p is the number of parameters in the models.

2.4.3. Predicting Aboveground Biomass and Carbon Storage at the Stand Level

We used two approaches to predict the AGB of the stands. In the first approach, the AGB of the stands was calculated as the summation of the individual AGB values predicted by the allometric equations. Since allometric equations with and without age factors were developed in this study, both types of equations were employed for prediction.
The second approach was based on the DDM. The framework of the DDM was proposed by Strub and Burkhart [20] and Hyink and Moser [11] and is shown in Equation (3) [11,20].
Y = N l u g ( x ) f ( x ) d x ,
where N is the number of stems per ha; x is the diameter at breast height (DBH) of stems; g(x) is the yield function based on the DBH; f(x) is a probability function (PDF); u and l are the upper and lower DBH limits, respectively, of each DBH class separated by size; Y is the yield (volume or biomass) per unit area given by g(x) when all DBH classes are calculated.
The DDM contains the following 3 main components: (1) the number of stems of whole stands, (2) a specific probability density function (PDF) used to quantify the stand DBH distribution and (3) an allometric function to predict the volume or biomass for each DBH class calculated by the PDF [2,11,20]. In this study, we surveyed the culms within the sample clumps to scale out the number of culms for whole stands. The Weibull probability density function was employed to quantify the DBH distribution.
The Weibull probability density function and its cumulative distribution function (CDF) form are defined as Equations (4) and (5) [21].
f ( x ) = c b x a b c 1 exp { x a b c } ,
F ( x ) = 1 exp { x a b c } ,
where x is the diameter at breast height and a, b and c are the parameters of the Weibull function.
In a previous study, Sun and Yen [14] successfully employed the Weibull function to quantify the DBH distribution for the 3 stands used in this study because all of them passed the Kolmogorov–Smirnov test. Therefore, we directly used those results in our study, where the a, b and c parameters of the Weibull function were 1.53, 5.80 and 2.94; 1.80, 5.39 and 4.15 and 4.50, 7.00 and 3.60 for stands A, B and C, respectively [14]. Sun and Yen [14] used the maximum likelihood estimator and percentile estimator for solving the parameters of the Weibull function and found the former was better than the latter. The parameters of the Weibull function used in this study were based on the maximum likelihood estimator by Sun and Yen [14]. According to these parameters, the probability of the culm number within DBH classes was calculated by Equation (5) for each stand. Noticeably, the allometric equations used for the DDM were based on those without the age factor because culm number within DBH classes counted by the Weibull function did not contain age information. The AGB of each DBH class was obtained from the above step, and the AGB of whole stands was calculated from that of all DBH classes.
Because AGCS was calculated as AGB × PCC, the same pattern was observed in the AGCS and AGB. We used the AGB predicted by the allometric equation with the age factor to predict the AGCS for the Ma bamboo plantations.

3. Results

3.1. Biomass Distribution in Sample Bamboo

We used age and DBH factors to show the biomass allocation in various components, and the results are shown in Table 2.
We found that the DBH, H and biomass of various sections varied with age, but a clear age trend was not observed. For example, aboveground biomass was higher in 3-year-old individuals (18.701 kg), while it was lower in 1-year-old individuals (9.797 kg). However, a clear trend regarding DBH was observed, where all of the above attributes increased with increasing DBH.
We used the ratio scale to show the proportion of foliage, branches and culms to AGB for each age and DBH class. The results are shown in Figure 1.
Among the age classes, the proportion of foliage ranged from 8.9 to 15.1%; that of branches ranged from 19.3 to 28.8%; that of the culms ranged from 59.3 to 72.2% (Figure 1a). Among the DBH classes, the proportion of foliage ranged from 8.7 to 15.5%; that of branches ranged from 20.8 to 30.5%; that of culms ranged from 54.7 to 70.4% (Figure 1b). Overall, the proportions of foliage, branches and culms to AGB were 11.1, 23.7 and 65.2%, respectively, for all samples.

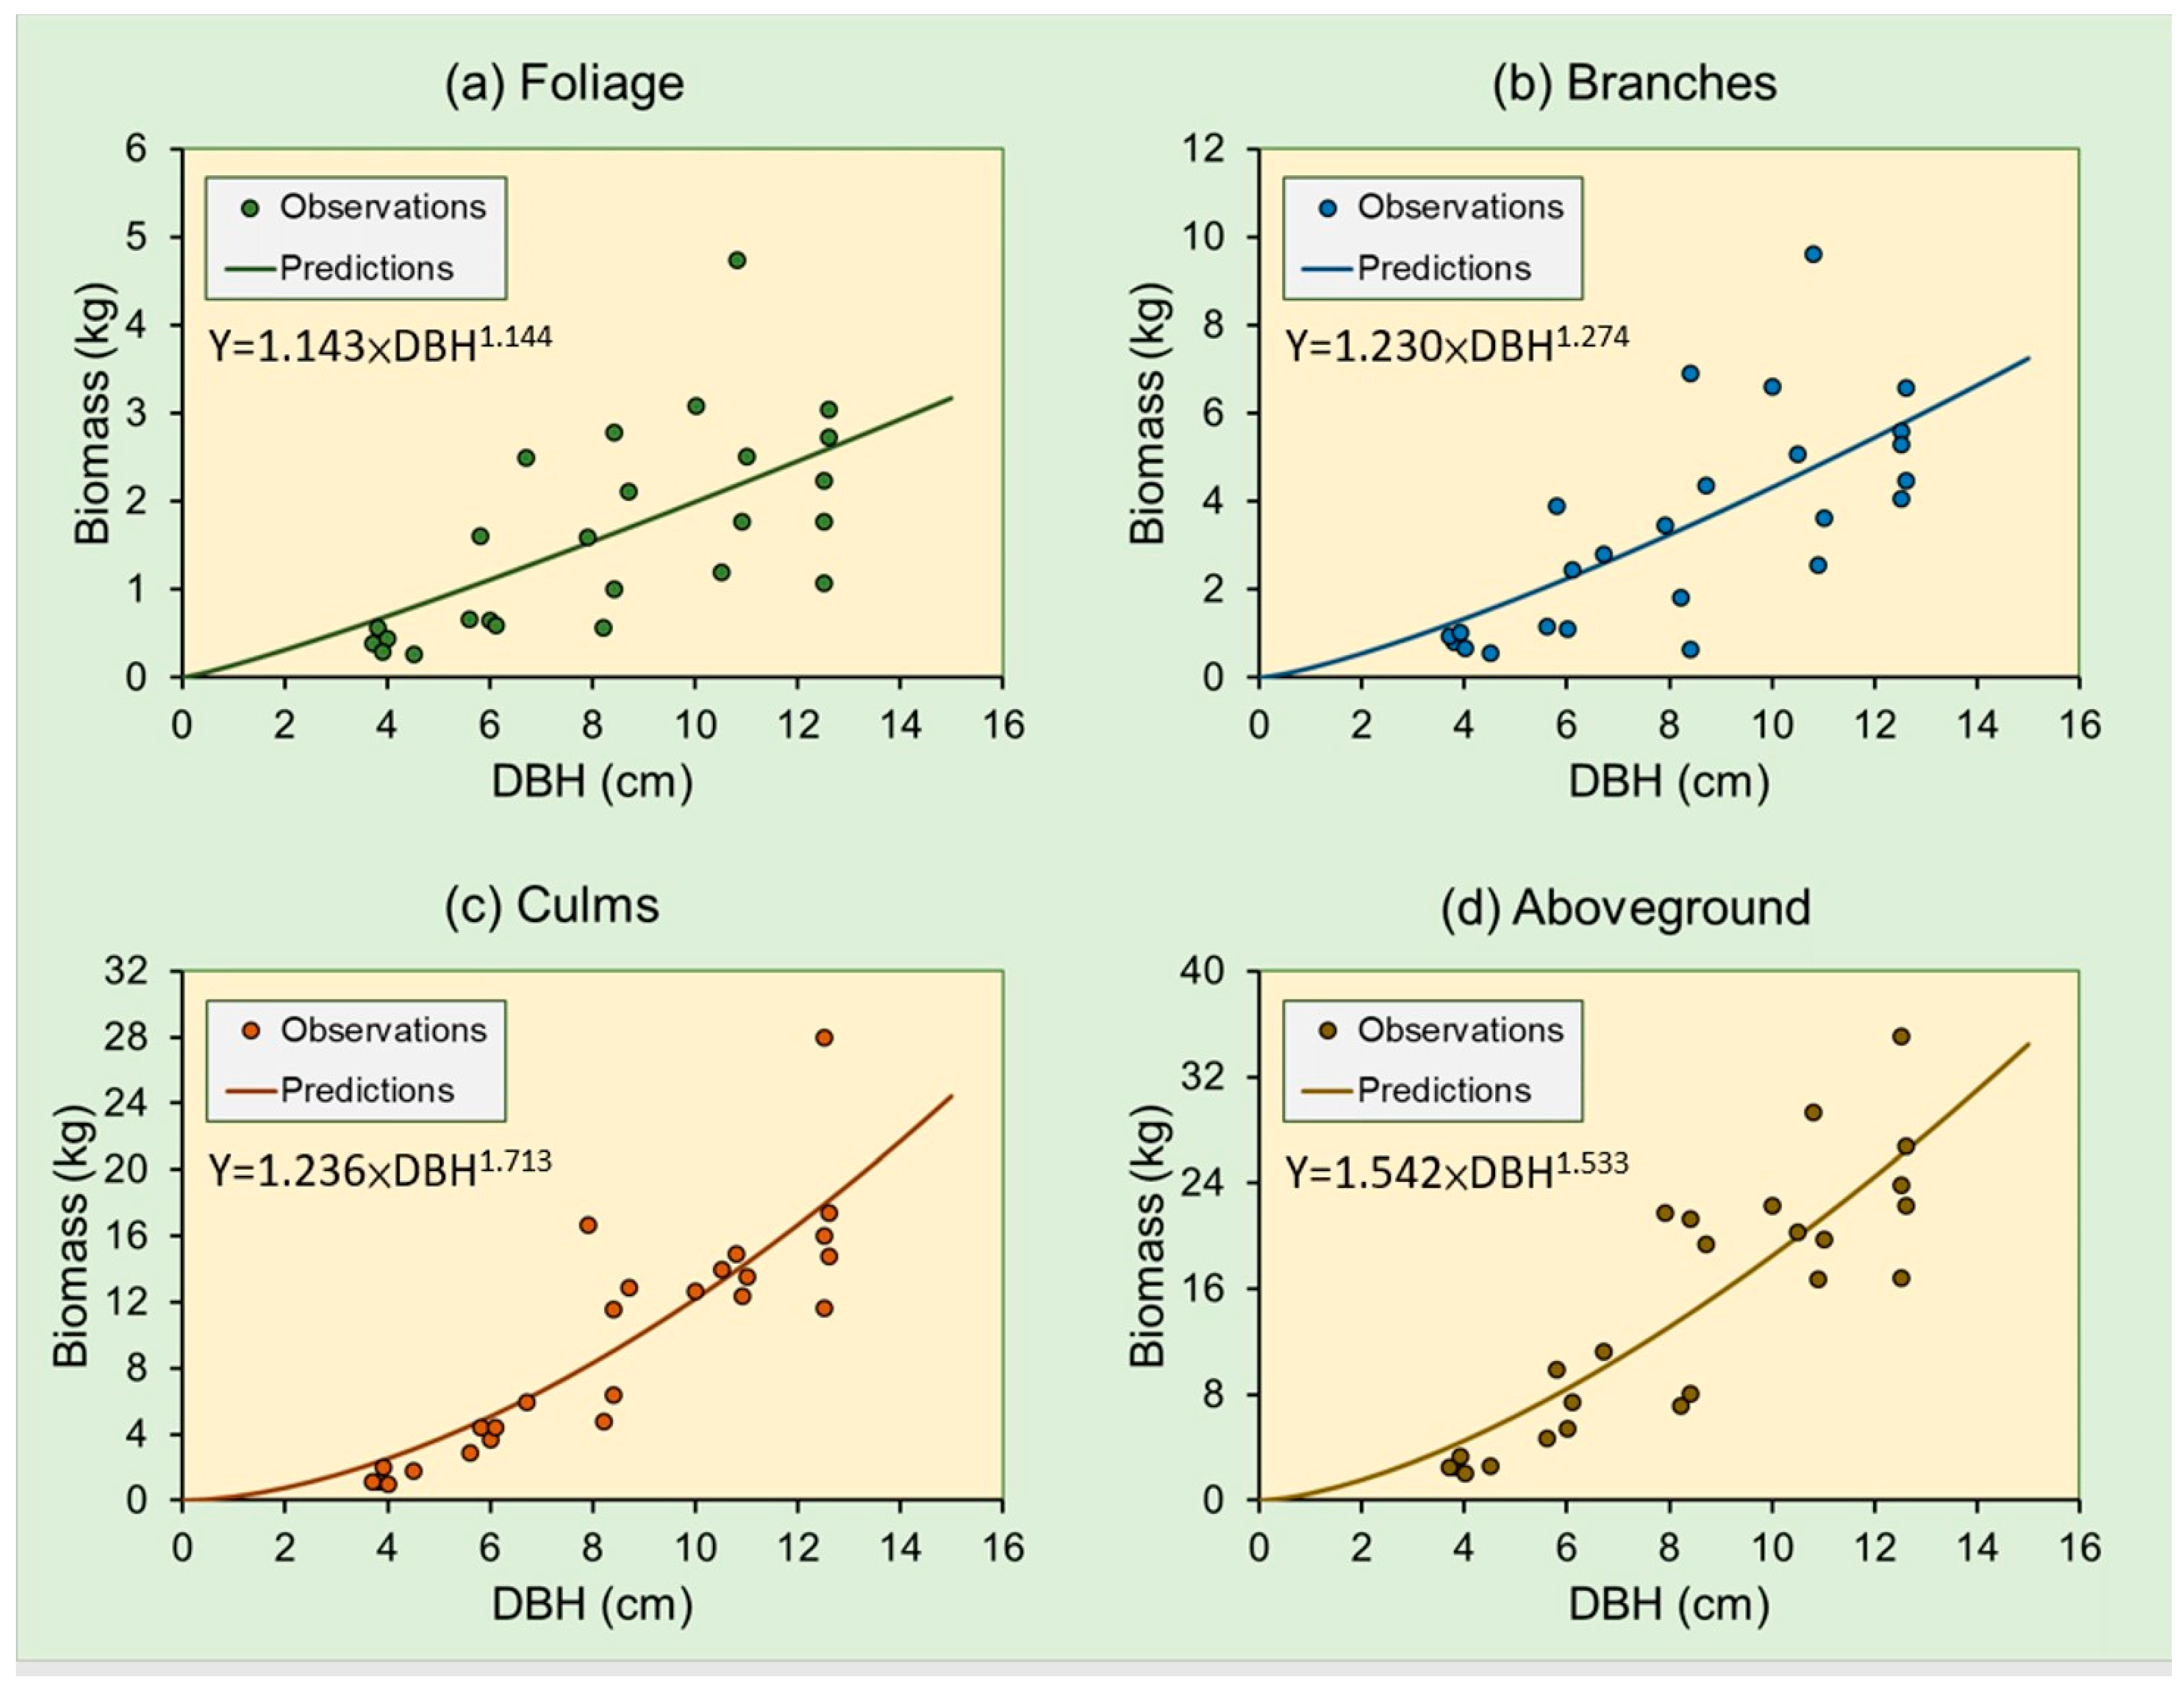
3.2. Predicting Biomass by the Allometric Model

We used an allometric equation to predict the biomass of various sections for each age class and all age classes for Ma bamboo, and the results are shown in Table 3.
In general, a lower R2 was found for the foliage biomass, but a higher R2 was found for the culm biomass and AGB, regardless of age (Table 3). We pooled all the age data for each section, and the relationships between the observations and the curves predicted by allometric equations are shown in Figure 2. The allometric equation well simulated the culm biomass and AGB, with a higher R2 (0.747–0.748) than that of the biomass of other sections (R2 from 0.423 to 0.500) (Table 3 and Figure 2).

3.3. Percent Carbon Contents of Different Sections

The PCC of the foliage, branches and culms for each age class of Ma bamboo are shown in Figure 3.
For the PCC of each section, a clear age trend, such as an increase or decrease with age, was not observed. The PCC seemed to be distributed within a certain range for various sections. The ranges of PCC values were 40.49%–42.58%, 43.46%–45.46% and 46.37%–47.09% for foliage, branches and culms, respectively. These results indicated that the PCC was higher in culms and lower in foliage, and all ages showed the same trend, where culms > branches > foliage (Figure 3). Overall, the mean PCC calculated from all ages was 41.68 ± 0.81%, 44.21 ± 0.72% and 46.72 ± 0.30% for foliage, branches and culms, respectively.

3.4. Biomass and Carbon Yield

We used allometric functions with and without an age factor to predict AGB at the clump and stand levels. The results are shown in Table 4.
The ABG predicted by the model with an age factor was based on Equations 1–A, 2–A, 3–A, 4–A and 5–A, and that predicted by the model without an age factor was based on Equation T-A (Table 3). According to the former and latter models, the range of ABG was predicted to be 54.0–118.7 and 56.9–117.7 kg clump−1 for clump level, respectively, and 32.4–39.1 and 32.6–35.3 Mg ha−1 for stand level, respectively. Since a higher R2 was found in the former model (R2 from 0.831 to 0.960) for predicting AGB, we used that model as the basis for calculating the relative error (RE), where RE (%) = [(ABG predicted by model without age − ABG predicted by model with age)/ABG predicted by model with age)] × 100% for stand level. The RE ranged from −16.56 to 5.26%.
On the other hand, the AGB predicted by the DDM is shown in Figure 4.
For the DDM, the number of culms per hectare predicted by the number of culms of sample clumps was 3400, 3300 and 1750 for stands A, B and C, respectively [14]. The stand DBH distribution quantified by the Weibull function was completed in a previous study [14]. According to the whole stand culms and the parameters of the Weibull function, the theoretical culms were calculated for each DBH class. We used a 1 cm interval to combine the theoretical culms and biomass equation (Equation T–A) to predict the AGB within each DBH class. Consequently, the AGB of the stands was obtained from the summation of that from each DBH class and was 61.7, 37.6 and 23.5 Mg ha−1 for stands A, B and C, respectively.
A comparison of the AGB predicted by the DDM and allometric model with the age factor is shown in Figure 5.
From Figure 5, the AGB predicted by the two approaches seemed inconsistent, and we adopted the RE to calculate their difference based on the allometric model with the age factor. As a result, the values of RE were 71.7, 16.0 and −40.0% for stands A, B and C, respectively. This result indicated that the AGB predicted by the DDM was overestimated for stand C and underestimated for stands A and B compared to the allometric model with the age factor.
Since the allometric model with the age factor well simulated the AGB, we used it to combine the PCC for predicting the ABCS of all of the stands. The PCC used to determine the AGB of individual bamboo plants was calculated by the summation of the proportion of each section to the AGB × the PCC of each section. In this study, the proportions of foliage, branches and culms were 11.1, 23.7 and 65.2%, respectively. The PCCs of those sections were 41.68, 44.21 and 46.72%, respectively. As a result, the PCC of the aboveground parts was calculated to be 45.57%. Consequently, the AGCS was predicted to be 16.2, 14.8 and 17.8 Mg ha−1 for stands A, B and C, respectively.

4. Discussion

Bamboo resources are important income sources for people in the villages and mountainous areas of Taiwan. Bamboo forests grown for economic benefits are usually planted and managed by farmers on plantations [6,22]. Bamboo species with economic value are also called “economic bamboo”, which the culms and shoots are two main products in Taiwan [6,22,23,24]. Ma bamboo is one of the most important economic bamboo species and is widely planted around Taiwan because its culms can provide raw material and its shoots are considered delicious [14]. In addition to Ma bamboo, other economic bamboo species include Makino bamboo, Moso bamboo, thorny bamboo (Bambusa stenostachya Hackel), long-branch bamboo (Bambusa dolichoclada Hayata) and green bamboo (Bambusa oldhamii Munro) [1,4,22].
Due to the economic value of these bamboo species, numerous studies have evaluated their economic benefits, biomass accumulation and productivity [1,2,3,4,6,14,25,26]. Their results confirmed that intensive management of bamboo plantations could improve their productivity and increase farmers’ income. However, the productivity of bamboo plantations might be reflected in the harvesting of a large number of bamboo shoots. Because fewer bamboo shoots remained for further development and for cutting older bamboo culms (usually over 4 years old) each year, lower stocks of bamboo plantations existed when their focus was on harvesting bamboo shoots [6]. In contrast, higher stocks of bamboo stands existed when their focus was on harvesting bamboo culms because more new shoots remained to support further harvests [6]. Therefore, the stock of current bamboo forests mainly reflects whether they focus on harvesting bamboo culms or shoots but not on their productivity [6].
In recent years, high-potential carbon storage has been found in bamboo forests worldwide because bamboo is a fast-growing plant [2,3,5,6,7,8,10]. Those studies also covered various economic bamboo species in Taiwan [2,3,7,10]. Moreover, many relevant studies of carbon storage were found in bamboo research, such as biomass accumulation for bamboo forests. The biomass accumulation evaluated by these studies could be calculated to determine carbon storage [4]. Liu and Yen [4] collected bamboo data from publications on biomass and carbon storage in Taiwan and transformed the biomass data into carbon storage based on biomass × PCC. Consequently, all the data were pooled to analyze carbon storage for various bamboo species, and Ma bamboo possessed high carbon storage, but it had a high deviation value (48.94± 41.06 Mg ha−1). This result implied that Ma bamboo has a high potential for carbon storage, while the large variation in carbon storage might result from different management patterns, such as the focus on harvesting bamboo culms or shoots.
Due to economic concerns, bamboo shoots have been regarded as a major product of bamboo plantations in recent decades because they possess more benefits than bamboo culms. Therefore, farmers favor bamboo management that is focused on harvesting bamboo shoots, especially since 1980 [6]. The Ma bamboo plantations used in the present study followed this pattern, where most bamboo shoots were harvested and only a few remained. However, maintaining some culms and cutting older culms is necessary in bamboo forest management because this helps the bamboo shoots sprout from rhizomes [1,2]. Therefore, lower biomass and carbon storage were expected in our study due to the harvesting of a large number of bamboo shoots.
Although various bamboo species display a similar aboveground structure, individual bamboo plants still show different proportions of biomass among sections [2,3,25]. In general, the culm biomass occupies a main component of AGB. However, in Ma bamboo, the proportion of culms to AGB was lower than that of other economic bamboo species, such as Makino and Moso bamboos. In the present study, the proportions of foliage, branches and culms to AGB were 11.1, 23.7 and 65.2% for Ma bamboo, respectively. However, these values were 7.16, 15.49 and 77.35% for Makino bamboo and 5.21, 14.82 and 79.97% for Moso bamboo, respectively [2,25]. On the other hand, the PCC was higher in culms (46.72%), followed by that in branches (44.21%), and it was lower in foliage (41.68%) for Ma bamboo in this study. The PCC displayed the same pattern (culms > branches > foliage) in other bamboo spices. For example, the PCCs of foliage, branches and culms were 41.68, 44.21 and 46.72%, respectively, for Makino bamboo and 44.69, 49.29 and 49.43%, respectively, for Moso bamboo, respectively [2,25].
Usually, harvesting culms as samples to build a model should cover the full range of age and DBH for bamboo plantations. From the relevant bamboo studies, the number of samples over 20–25 culms is necessary [3,7,9,27,28,29]. In general, models consider many variables or factors that might have better effects on prediction [30]. Our study followed this rule, indicating that the allometric model with the age factor was better than that without the age factor. For example, using the former model to predict AGB resulted in a higher R2 (0.831–0.960) and a lower RMSE (1.853–4.925 kg) than those of the latter model (R2 = 0.749 and RMSE = 4.971 kg). Therefore, we used the allometric equation with the age factor as the basis for comparing the AGB predicted by the allometric equation without the age factor at the stand level. The RE ranged from −16.56 to 5.26%, indicating that the former model might underestimate or overestimate AGB.
The DDM contains 3 main components [2,11,20]. For the number of culms of whole stands, we did not use the sample plots but instead used the sample clump for Ma bamboo in the present study. Because Ma bamboo has a pachymorphic rhizome morphology, it has a clump distribution on land. The number of culms could be predicted based on the sample clumps when the number of clumps in the stands was obtained. Quantifying the stand diameter distribution plays a key role in the DDM because the DDM cannot be performed when the stand diameter distribution is not quantified. This is also a limitation in performing the DDM [2,11,20]. However, there are advantages to using this model to predict biomass yield, display the biomass distribution in each DBH class and obtain the biomass yield of whole stands [2].
This study quantified the stand diameter distribution based on the Weibull function. The advantages of this function have been reported in its application to various forest types [2,10,14,21,31,32,33,34]. Fortunately, the three stands used in this study were successfully quantified by the Weibull function because all of them passed the K-S test [14]. This result indicated that the DDM was suitable for use in the three stands. However, the allometric equation used for the DDM could not include an age factor because the theoretical culms with each DBH class predicted by the Weibull function did not contain age information. The AGB predicted by the DDM shows more information, which displays AGB not only at the DBH level but also at the stand level.
In the present study, we used two types of allometric models and the DDM to predict the AGB for Ma bamboo plantations. According to the allometric model with the age factor, the values of RE ranged from −16.56 to 5.26% for the allometric model without the age factor and from −40.0 to 71.7% for the DDM. Although using the DDM to predict AGB showed more abundant information, this model still showed a higher RE than the allometric model with the age factor. Overall, we recommended the allometric model with the age factor to predict AGB for Ma bamboo plantations when the attribute of culm age was obtained. However, if the culms do not contain the age information, the allometric model without the age factor was another alternative. On the other hand, using the DDM to predict AGB for Ma bamboo plantations, the disadvantage was that this model showed higher bias in prediction.
Since AGCS was derived from AGB × PCC, the same pattern was expected for the AGCS as that of the above AGB prediction approaches. Therefore, we used the allometric model with the age factor to predict an AGCS value of 16.3 ± 1.5 Mg ha−1 for the three Ma bamboo stands. There was a lower AGCS value in the present study than in the previous study (48.94 ± 41.06 Mg ha−1) [4]. Because the farmers address the economic benefit of bamboo forests, the purpose of current bamboo forest management mainly focuses on bamboo shoot production in Taiwan. The results also reflected the current status of Ma bamboo management, which is intensive management, where the focus is on harvesting bamboo shoots.
The limitation of the present study was the small sample size used for developing the allometric function. If the researchers consider using the age factor and DBH factor for developing the allometric function in bamboo forests, we suggest that a larger sample size would be beneficial. Moreover, the potential value of a larger sample and use of a mixed model that fully represents the nested sampling and it is suggested for this bamboo species because Ma bamboo appears as an aboveground clump structure on land (culm within clump within stand).

5. Conclusions

The aim of this study was to predict the stand AGB and AGCS for Ma bamboo plantations with intensive management. A total of 25 bamboo samples were used to develop allometric models based on ages and DBH classes. The AGB was predicted by various models. The AGCS was obtained based on the AGB and PCC. We obtained the following conclusions:
  • At the individual bamboo level, the proportions of foliage, branches and culms to AGB were 11.1, 23.7 and 65.2%, respectively. The mean PCC was predicted to be 41.68, 44.21 and 46.72% for foliage, branches and culms, respectively;
  • The allometric equation with the age factor had better predictive ability than that without the age factor because the former equation had higher R2 and lower RMSE values;
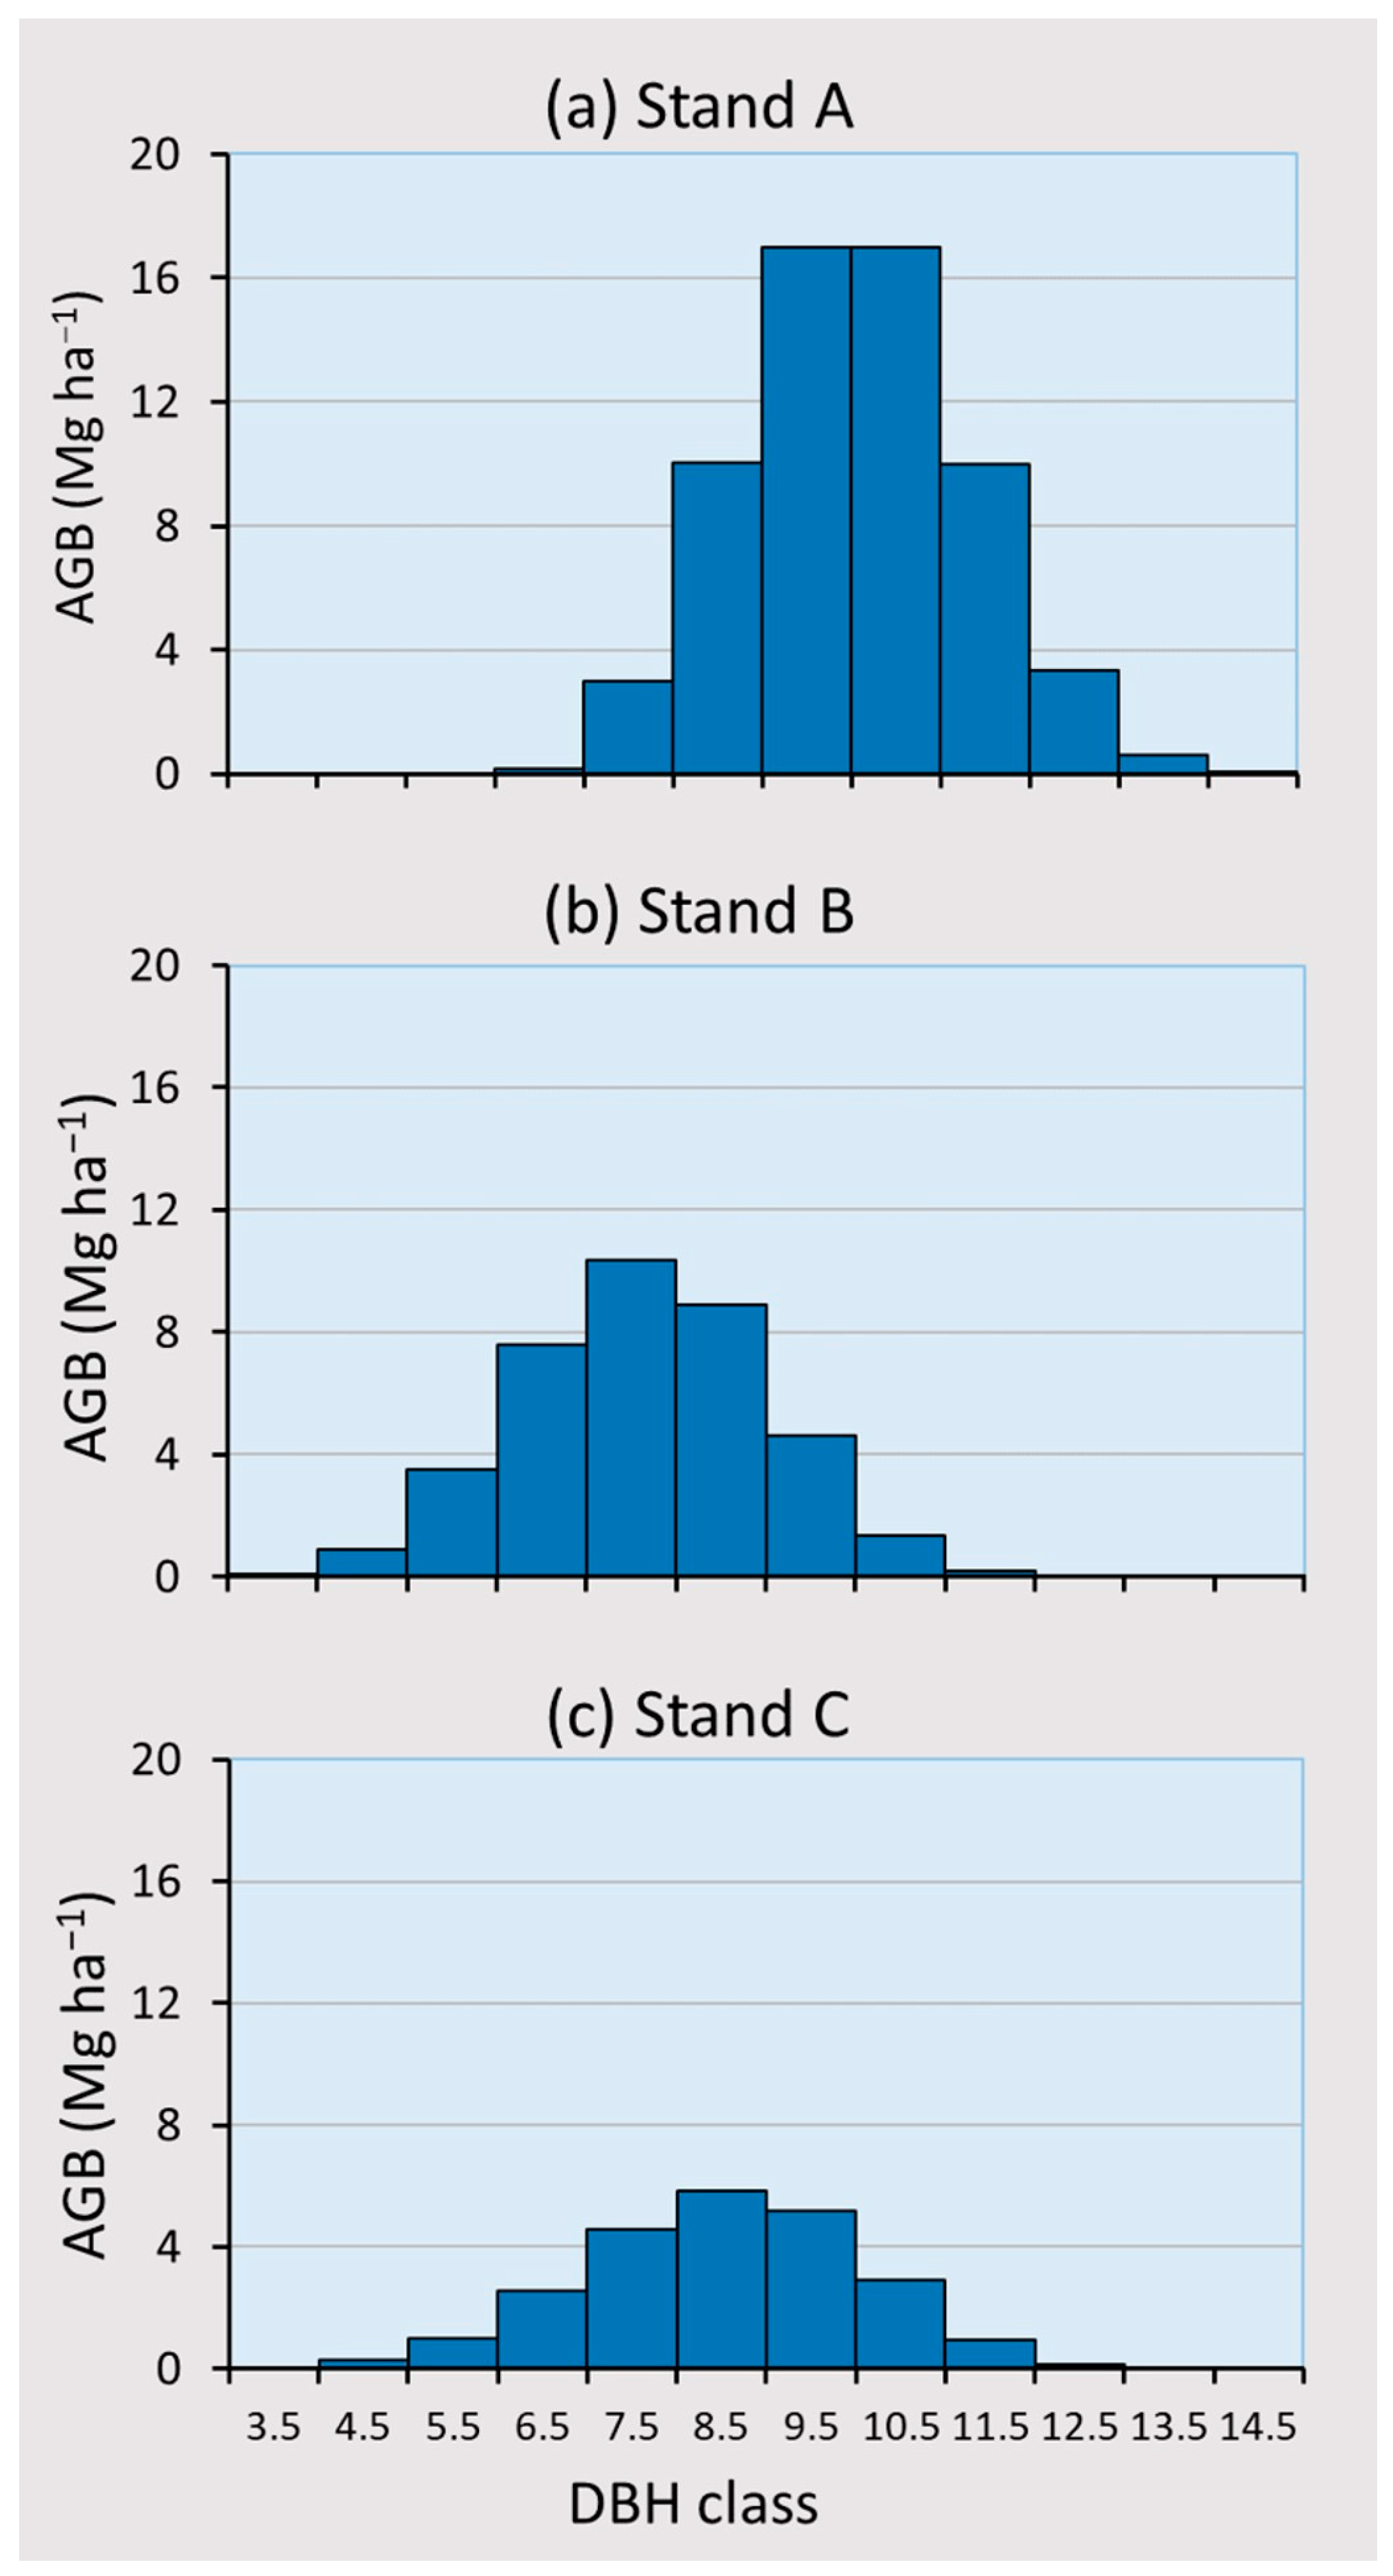
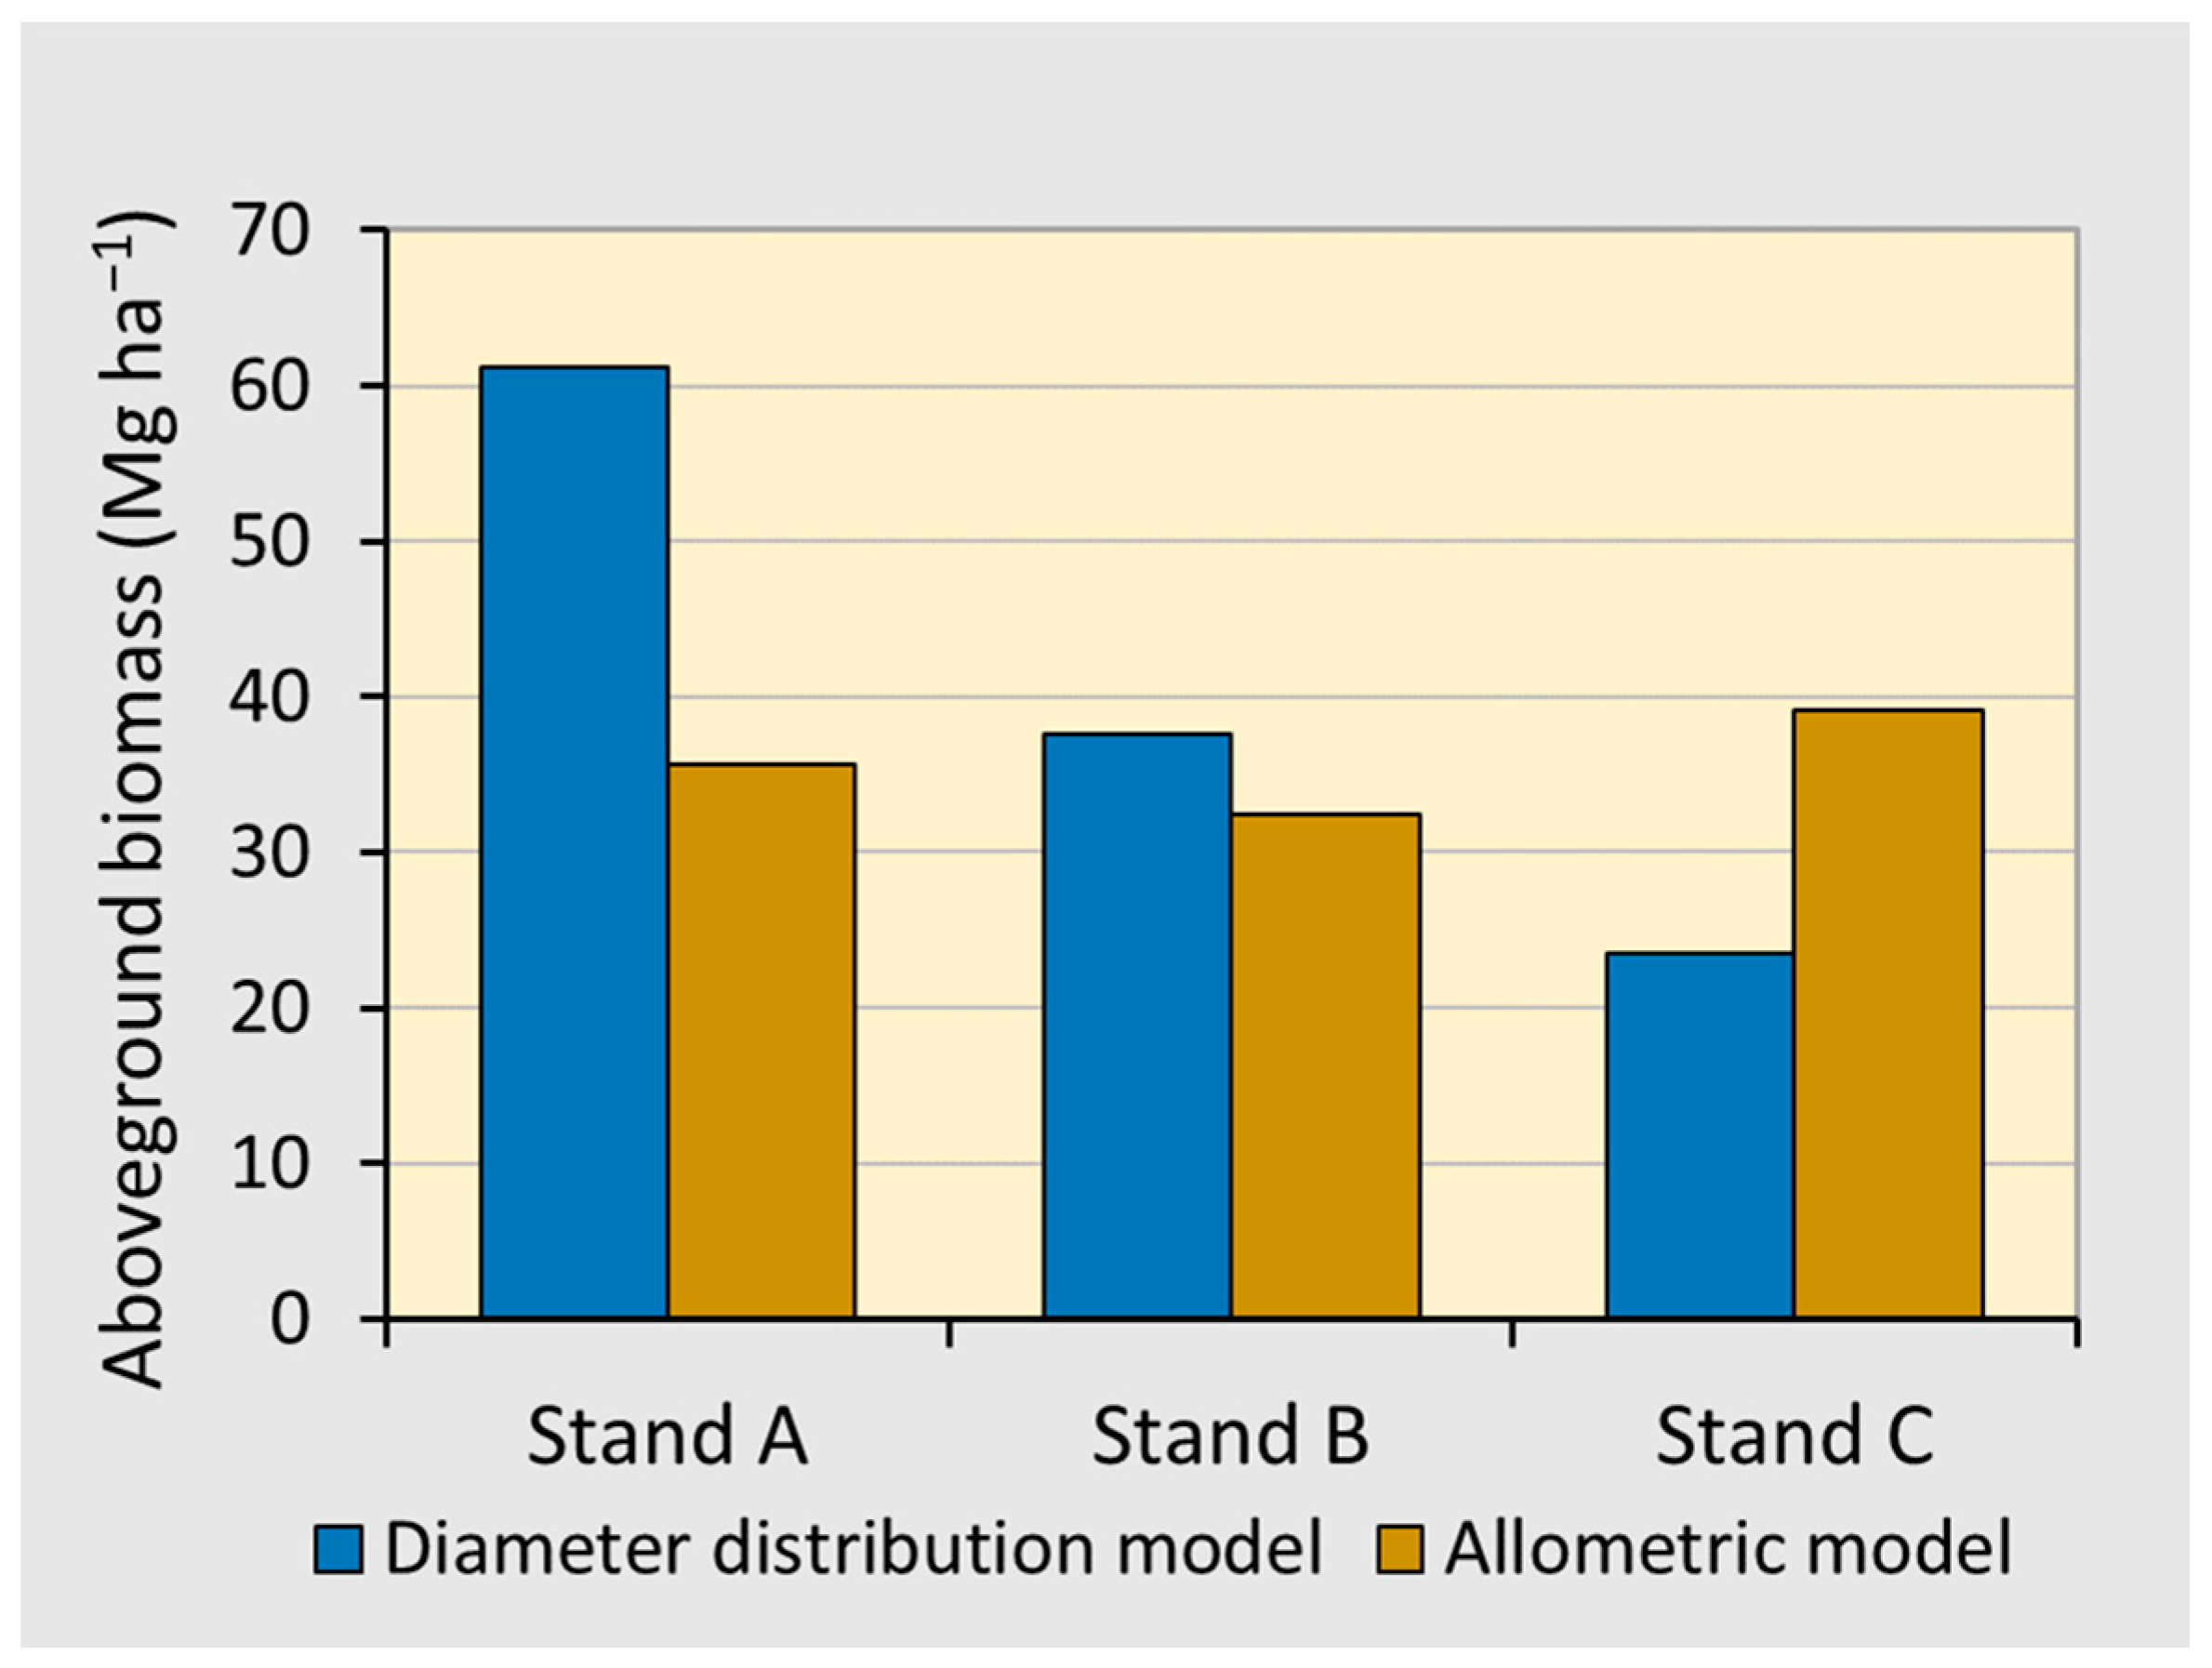
  • At the stand level, although the AGB predicted by the DDM showed more abundant information, this model still had a higher RE than that predicted by the allometric model with the age factor;
  • The AGB and AGCS were predicted to be 35.7 ± 3.4 and 16.3 ± 1.5 Mg ha−1, respectively, in Ma bamboo plantations;
  • Our study reflected that the current status of Ma bamboo management is intensive management, where the focus is on harvesting bamboo shoots;
  • The limitation of the present study was the small sample size used for developing the allometric function. The potential value of a larger sample and the use of a mixed model that fully represents the nested sampling and it is suggested for this bamboo species because Ma bamboo appears as an aboveground clump structure on land.

Author Contributions

Conceptualization, T.-M.Y., P.-K.S. and L.-E.L.; methodology, T.-M.Y., P.-K.S. and L.-E.L.; software, P.-K.S. and L.-E.L.; validation, T.-M.Y. and P.-K.S.; formal analysis, P.-K.S. and T.-M.Y.; investigation, P.-K.S. and L.-E.L.; resources, P.-K.S. and L.-E.L.; data curation, P.-K.S.; writing—original draft preparation, T.-M.Y. and P.-K.S.; writing—review and editing, T.-M.Y., P.-K.S. and L.-E.L.; visualization, T.-M.Y., P.-K.S. and L.-E.L.; supervision, T.-M.Y.; project administration, T.-M.Y. All authors have read and agreed to the published version of the manuscript.

Funding

This research was funded by the National Science Council, grant number NSC100-2313-B-005-018-.

Acknowledgments

We thank the farmers who provided the bamboo forest materials for the experiments.

Conflicts of Interest

The authors declare no conflict of interest.

References

  1. Lu, C.-M. Cultivation and Management of Bamboo Forests; Taiwan Forestry Research Institute: Taipei, Taiwan, 2001; pp. 1–204. [Google Scholar]
  2. Yen, T.-M.; Ji, Y.-J.; Lee, J.-S. Estimating biomass production and carbon storage for a fast-growing makino bamboo (Phyllostachys makinoi) plant based on the diameter distribution model. For. Ecol. Manag. 2010, 260, 339–344. [Google Scholar] [CrossRef]
  3. Yen, T.-M.; Lee, J.-S. Comparing aboveground carbon sequestration between moso bamboo (Phyllostachys heterocycla) and China fir (Cunninghamia lanceolata) forests based on the allometric model. For. Ecol. Manag. 2011, 261, 995–1002. [Google Scholar] [CrossRef]
  4. Liu, Y.-H.; Yen, T.-M. Assessing aboveground carbon storage capacity in bamboo plantations with various species related to its affecting factors across Taiwan. For. Ecol. Manag. 2021, 481, 118745. [Google Scholar] [CrossRef]
  5. Nath, A.J.; Das, G.; Das, A.K. Above ground standing biomass and carbon storage in village bamboos in North East India. Biomass Bioenergy 2009, 33, 1188–1196. [Google Scholar] [CrossRef]
  6. Yen, T.-M. Comparing aboveground structure and aboveground carbon storage of an age series of moso bamboo forests subjected to different management strategies. J. For. Res. 2015, 20, 1–8. [Google Scholar] [CrossRef]
  7. Li, L.-E.; Lin, Y.-J.; Yen, T.-M. Using allometric models to predict the aboveground biomass of thorny bamboo (Bambusa stenostachya) and estimate its carbon storage. Taiwan J. For. Sci. 2016, 31, 37–47. [Google Scholar]
  8. Yuen, J.Q.; Fung, T.; Ziegler, A.D. Carbon stocks in bamboo ecosystems worldwide: Estimates and uncertainties. For. Ecol. Manag. 2017, 393, 113–138. [Google Scholar] [CrossRef]
  9. Inoue, A.; Koshikawa, K.; Sato, M.; Shima, H. Allometric equations for predicting the aboveground biomass of square bamboo, Chimonobambusa quadrangularis. J. For. Res. 2019, 4, 376–381. [Google Scholar] [CrossRef]
  10. Liu, Y.H.; Lin, Z.R.; Yen, T.M. Comparison of biomass prediction by various approaches for a makino bamboo (Phyllostachys makinoi Hayata) plantation. Q. J. Chin. For. 2019, 41, 203–215. [Google Scholar]
  11. Hyink, D.M.; Moser, J.W. A generalized framework for projecting forest yield and stand structure using diameter distributions. For. Sci. 1983, 29, 85–95. [Google Scholar]
  12. Hussain, M.; Lin, Z.-R.; Yen, T.-M.; Lin, C.-C. Application of models to predict stand volume, aboveground biomass accumulation, and carbon storage capacity for a Konishii fir (Cunninghamia konishii Hayata) plantation in central Taiwan. Forests 2021, 12, 1406. [Google Scholar] [CrossRef]
  13. Chen, T.-H.; Wang, D.-H.; Chung, H.-Y. Effects of management strategy on growth and shoot products in Dendrocalamus latiflorus. Q. J. For. Res. 2012, 34, 297–304. [Google Scholar]
  14. Sun, B.-K.; Yen, T.-M. Predicting stand structure and carbon storage for ma bamboo (Dendrocalamus latiflorus) and moso bamboo (Phyllostachys pubescens) plantations subjected to different management types in central Taiwan. J. Agric. For. 2017, 64, 233–244. [Google Scholar]
  15. Li, Z.-Y.; Chen, T.-H. The growth and shoot production of Dendrocalamus latiforus by different propagation methods. Q. J. For. Res. 2018, 40, 149–159. [Google Scholar]
  16. Taiwan Central Weather Bureau. 2020. Available online: http://www.cwb.gov.tw/eng/index.htm. (accessed on 20 February 2020).
  17. Baskerville, G.L. Estimation of dry weight of tree components and total standing crop in conifer stands. Ecology 1965, 46, 867–869. [Google Scholar] [CrossRef]
  18. Zianis, D.; Mencuccini, M. On simplifying allometric analyses of forest biomass. For. Ecol. Manag. 2004, 187, 311–332. [Google Scholar] [CrossRef]
  19. Draper, N.R.; Smith, H. Applied Regression Analysis, 2nd ed.; John Wiley & Sons: New York, NY, USA, 1981. [Google Scholar]
  20. Strub, M.R.; Burkhart, H.E. A class-interval-free method for obtaining expected yields from diameter distributions. For. Sci. 1975, 21, 67–69. [Google Scholar]
  21. Bailey, R.; Dell, T. Quantifying Diameter Distributions with the Weibull function. For. Sci. 1973, 19, 97–104. [Google Scholar]
  22. Lin, Y.-J. Review, current status, and prospects of the bamboo industry in Taiwan. Taiwan J. For. Sci. 2011, 26, 99–111. [Google Scholar]
  23. Yen, T.-M.; Hu, H.-L.; Lee, J.-S. Economic study on culms of Moso bamboo (Phyllostachys heterocycle) in Chu-Sun area. Q. J. For. Res. 2003, 25, 25–36. [Google Scholar]
  24. Yen, T.-M.; Hu, H.-L.; Lee, J.-S. The shoots of Moso bamboo (Phyllostachys heterocycle) in Chu-Sun area. Q. J. For. Res. 2003, 25, 43–54. [Google Scholar]
  25. Sun, B.-K.; Chen, Y.-T.; Yen, T.-M.; Li, L.-E. Stand characteristics, aboveground biomass and carbon storage of moso bamboo (Phyllostachys pubescens) stands under different management levels in central Taiwan. Q. J. For. Res. 2013, 35, 23–32. [Google Scholar]
  26. Yen, T.-M. Culm height development, biomass accumulation and carbon storage in an initial growth stage for a fast-growing moso bamboo (Phyllostachy pubescens). Bot. Stud. 2016, 57, 10. [Google Scholar] [CrossRef]
  27. Jember, A.A.; Taye, M.A.; Gebeyehu, G.; Mulu, G.; Long, T.T.; Jayaraman, D.; Abebe, S. Carbon stock potential of highland bamboo plantations in northwestern Ethiopia. Carbon Balance Manag. 2023, 18, 3. [Google Scholar] [CrossRef] [PubMed]
  28. Huy, B.; Thanh, G.T.; Poudel, K.P.; Temesgen, H. Individual plant allometric equations for estimating aboveground biomass and its components for a common bamboo species (Bambusa procera A. Chev. and A. Camus) in tropical forests. Forests 2019, 10, 316. [Google Scholar] [CrossRef]
  29. Abebe, S.; Gebeyehu, G.; Teketay, D.; Long, T.T.; Jayaraman, D. Allometric models for estimating biomass storage and carbon stock potential of Oldeania alpina (K. Schum.) Stapleton forests of south-western Ethiopia. Adv. Bamboo Sci. 2023, 2, 100008. [Google Scholar] [CrossRef]
  30. Lin, Z.-R.; Yen, T.-M. Assessing prediction effects among height-diameter models with varied structures for a Taiwania (Taiwania cryptomerioides Hayata) plantation. Taiwan J. For. Sci. 2021, 36, 111–125. [Google Scholar]
  31. Lee, J.-S.; Chen, C.-T. Study on the stand structure and composition of species in natural forests of Cho-Kou watershed. Annu. Taiwan Mus. 1991, 34, 11–32. [Google Scholar]
  32. Lee, J.-S.; Yen, T.-M. Study on thinning effect of Chamaecyparis formosensis by diameter distribution in Ta-Hsueh-Shan area. Bull. Exp. For. Natl. Chung Hsing Univ. 1992, 14, 89–101. [Google Scholar]
  33. Lee, J.-S.; Jong, S.-S. A study on the stand structure of natural forest in Ta-Hsueh-Shan area. Exp. For. Natl. Chung Hsing Univ. 1996, 18, 43–57. [Google Scholar]
  34. Yen, T.-M.; Ai, L.-M.; Li, C.-L.; Lee, J.-S.; Huang, K.-L. Aboveground carbon contents and storage of three major Taiwanese conifer species. Taiwan J. For. Sci. 2009, 24, 91–102. [Google Scholar]
Figure 1. The proportion of foliage, branch and culm biomass to aboveground biomass by (a) age class and (b) DBH class.
Forests 14 00854 g001
Figure 2. Relationships between observations and predicted curves by the allometric function (Y = a × DBHb) for the biomass of different sections of Ma bamboo.
Forests 14 00854 g002
Figure 3. Percent carbon contents of foliage, branches and culms of Ma bamboo of different ages.
Forests 14 00854 g003
Figure 4. The aboveground biomass (AGB) predicted by the diameter distribution model for the three stands of Ma bamboo, where the stand diameter distribution predicted by the Weibull function and the a, b and c parameters were predicted to be 1.53, 5.80 and 2.94; 1.80, 5.39 and 4.15; 4.50, 7.00 and 3.60 for stands A, B and C, respectively. These parameters were cited from Sun and Yen [14], and the biomass equation (Equation T–A) was used to predict AGB for each diameter class.
Forests 14 00854 g004
Figure 5. Comparison of aboveground biomass predicted by the diameter distribution model and allometric model with age factor for Ma bamboo stands.
Forests 14 00854 g005
Table 1. Detailed information on the Ma bamboo stands used in this study [14].
CodeStand TypeElevation (m)Longitude and LatitudeTreatment
APure stand348120°42′10″ E and 23°42′42″ NThinning, fertilizing and irrigation
BPure stand348120°42′06″ E and 23°42′45″ NThinning, fertilizing and irrigation
CPure stand524120°42′18″ E and 23°42′20″ NThinning, fertilizing and irrigation
DMixed stand534120°42′23″ E and 23°42′03″ NThinning, fertilizing and irrigation
EPure stand528120°42′29″ E and 23°41′58″ NThinning
FPure stand538120°42′29″ E and 23°41′56″ NThinning
Table 2. The distribution of the diameter at breast height (DBH), culm height (H) and biomass of different sections of age and DBH classes in Ma bamboo samples.
ItemClassNDBH (cm)H (m)Biomass (kg)
FoliageBranchesCulmsAboveground
Age1-year-old58.4 ± 3.3 111.3 ± 2.60.870 ± 0.5832.034 ± 1.3656.893 ± 4.8309.797 ± 6.590
2-year-old58.5 ± 3.512.2 ± 4.21.930 ± 1.0752.477 ± 1.6988.400 ± 5.68912.807 ± 8.182
3-year-old58.2 ± 3.610.0 ± 3.32.218 ± 1.6374.904 ± 3.30810.949 ± 7.57218.071 ± 11.438
4-year-old58.2 ± 3.39.8 ± 3.71.831 ± 1.2334.446 ± 2.7559.161 ± 6.21515.439 ± 9.924
5-year-old58.2 ± 3.510.1 ± 4.61.211 ± 0.7583.400 ± 2.12111.986 ± 10.52216.598 ± 13.030
DBH 2I54.0 ± 0.36.0 ± 1.50.395 ± 0.1240.809 ± 0.1901.452 ± 0.4492.656 ± 0.448
II56.0 ± 0.48.7 ± 1.61.206 ± 0.8412.292 ± 1.1764.308 ± 1.1297.807 ± 2.800
III58.3 ± 0.311.3 ± 0.71.618 ± 0.8763.449 ± 2.41310.501 ± 4.86215.568 ± 7.273
IV510.6 ± 0.412.8 ± 2.82.664 ± 1.3645.503 ± 2.75913.528 ± 1.03621.696 ± 4.718
V512.5 ± 0.114.5 ± 2.22.177 ± 0.7815.208 ± 0.98217.599 ± 6.20424.985 ± 6.716
1 Mean ± standard deviation. 2 I: DBH < 5 cm; II: 5 cm ≤ DBH < 7.5 cm; III: 7.5 cm ≤ DBH <10 cm; IV: 10 cm ≤ DBH < 12.5 cm; V: DBH >12.5 cm.
Table 3. The a and b parameters, R2 and root mean squared error (RMSE) of each allometric model for predicting the biomass of various sections of Ma bamboo.
AgeSections Y = a × DBHbEquation Number
abR2RMSE (kg)p-Value
1-year-oldFoliage (kg)0.0561.2840.6020.4250.0341–-F
Branches (kg)0.0351.8620.9660.288<0.0011–B
Culms (kg)0.1431.7820.9081.6880.0041–C
Aboveground (kg)0.2211.7450.9411.8530.0021–A
2-year-oldFoliage (kg)0.2071.0430.5910.7940.0232–F
Branches (kg)0.0761.5890.6401.1760.0312–B
Culms (kg)0.1801.7600.9611.2990.0012–C
Aboveground (kg)0.3721.6220.9022.9600.0042–A
3-year-oldFoliage (kg)0.1681.2270.6081.1830.0413–F
Branches (kg)0.3751.2210.7002.1090.0233–B
Culms (kg)0.7881.2520.7544.3370.0183–C
Aboveground (kg)1.3291.2410.8614.9250.0063–A
4-year-oldFoliage (kg)0.1771.1170.5740.9290.0384–F
Branches (kg)0.4831.0620.6301.9350.0264–B
Culms (kg)0.3261.5690.9231.9960.0034–C
Aboveground (kg)0.9001.3470.8314.7110.0094-A
5-year-oldFoliage (kg)0.1391.0330.5950.5570.0305–F
Branches (kg)0.1831.3740.9000.7750.0045–B
Culms (kg)0.0382.6040.9602.4230.0025–C
Aboveground (kg)0.1682.1040.9603.0080.0025–A
TotalFoliage (kg)0.1431.1440.4230.885<0.001T–F
Branches (kg)0.2301.2740.5001.754<0.001T–B
Culms (kg)0.2361.7130.7473.526<0.001T–C
Aboveground (kg)0.5421.5330.7484.971<0.001T–A
Table 4. The prediction of aboveground biomass (AGB) at the clump and stand levels based on the allometric functions with and without an age factor for Ma bamboo, where the relative error (%) was calculated as [(ABG predicted by model without age − ABG predicted by model with age)/ABG predicted by model with age] × 100%.
StandClump Level (kg clump−1)Stand Level (Mg ha−1)Relative Error (%)
ABG Predicted by Model with AgeABG Predicted by Model without AgeABG Predicted by Model with AgeABG Predicted by Model without Age
A118.7 ± 23.9 1117.7 ± 24.135.635.3−0.89
B54.0 ± 17.456.9 ± 20.832.434.15.26
C78.2 ± 43.365.3 ± 35.639.132.6−16.58
1 Mean ± standard deviation.
Disclaimer/Publisher’s Note: The statements, opinions and data contained in all publications are solely those of the individual author(s) and contributor(s) and not of MDPI and/or the editor(s). MDPI and/or the editor(s) disclaim responsibility for any injury to people or property resulting from any ideas, methods, instructions or products referred to in the content.

