Article

Simulation and Prediction of Sea Level Rise Impact on the Distribution of Mangrove and Spartina alterniflora in Coastal China

College of Forestry, Nanjing Forestry University, Nanjing 210037, China
*
Author to whom correspondence should be addressed.
These authors contributed equally to this work.
Forests 2023, 14(4), 831; https://doi.org/10.3390/f14040831
Submission received: 24 March 2023 / Revised: 10 April 2023 / Accepted: 12 April 2023 / Published: 18 April 2023
(This article belongs to the Special Issue Coastal Forested Wetland Conservation and Carbon Function)

Abstract

:
Sea level rise (SLR) has a significant impact on the vegetation ecosystem in coastal wetlands. Taking coastal China as the study area, the SLAMM (sea level rise affecting marsh model) was used to simulate the continuous long-term (2015–2100) effects of the spatiotemporal changes in mangrove and Spartina alterniflora in the four shared socioeconomic pathway scenarios (SSP1-2.6, SSP2-4.5, SSP3-7.0, and SSP5-8.5) of sea level rise by 2100; then, ArcGis was used to assess and compare the impact of SLR on land use. The results are as follows. (1) The dramatic reduction in the vegetation area is positively correlated with the rate of sea level rise. (2) Tidal differences and sedimentation rates affect the response of mangrove and S. alterniflora distribution to sea level rise, as well as interactions between organisms. (3) The reasonable land use of coastal wetlands is important to researchers. Land use is one of the tools for effective mangrove conservation. In conclusion, in scientific research and production practice, it is important to combine the biotic and abiotic factors affecting the distribution of mangroves and S. alterniflora.

1. Introduction

Mangroves and salt marshes, as important parts of coastal wetland ecosystems, cover less than 2% of the total global ocean area, but their carbon stocks exceed 50% of the ocean carbon stocks, making them some of the most productive ecosystems in the world [1,2]. They play a pivotal role in mitigating sea level rise, reducing the rate of climate warming, and protecting biodiversity. Mangroves are tidally influenced woody plant communities that grow in the intertidal zone of tropical and subtropical beaches [3], and they possess great ecological value for human beings, society, and the environment; as producers of coastal wetland ecosystems, they can form soil sediments through carbon sequestration. C assimilation in mangroves may have been underestimated due to methodological shortcomings and insufficient data on the key components of C dynamics [4], in addition to having multiple functions such as detecting and filtering pollutants to purify water bodies and providing ideal habitats for aquatic animals. Mangrove forests in China cover 22,700 hectares, and are mainly in Guangdong, Guangxi, Fujian, and Hainan. The carbon stock of Chinese mangroves is 6.91 ± 0.57 Tg C, whereby 82% of which exists in the surface to 1 m soil and 18% comes from mangrove biomass [5]. According to preliminary estimates, the average annual net carbon sequestration of Chinese mangroves exceeds 200 g/cm2, which is higher than the global average of 174 g/cm2 [6]. Tidal swamp is an important salt marsh vegetation with a similar living environment to mangroves, which mainly grows in the coastal wetlands of Bohai Sea, Yellow Sea, and East Sea in China, mainly including Phragmites australis, Suaeda glauca, Spartina alterniflora, and other species.
Since the 1970s, mankind has been increasingly concerned with studying global change and climate change. The Intergovernmental Panel on Climate Change (IPCC) Fourth Assessment Report (AR4) highlights that significant changes, mainly characterised by global warming, are an important element of the global climate system experienced in the last 100 years. Warming-induced increases in sea surface temperature, sea level rising, and extensive glacial melting will have a significant impact on coastal zones. The coastal zone is located in the transition zone between ocean and land, and is sensitive to climate-change-induced SST rise, sea level rise, seawater intrusion, storm surge, and coastal zone erosion [7]. The fifth report (AR5) released by the IPCC suggests that the global mean sea level has risen by 0.19 m from 1901 to 2010. The direct impact of sea level rise on estuarine wetlands is a reduction in area. The front edge of estuarine wetlands, due to lower elevation, may lead to ecological problems, such as the degradation of ecosystem functions because of sea level rise, in addition to area reduction. However, species distribution is not only influenced by climatic conditions [8], but studies have shown that biological effects are also important factors affecting species distribution. In areas such as China, the mangrove ecosystem has been damaged by the invasion of S. alterniflora, resulting in the degradation of this vegetation and a significant increase in the distribution of S. alterniflora. Thus, the development of mangroves and salt marshes is regulated by both biotic and abiotic factors, and the development trend is different according to geographical differences. As highly productive species, the stable development of mangroves and salt marshes plays an important role in mitigating climate change and maintaining the ecosystem cycle. Therefore, it is crucial to understand the development patterns and regulatory factors of mangroves and salt marshes, as well as their responses to future climate change, in order to promote the stable development of this ecosystem.
Understanding the distribution characteristics of population ecosystems is necessary to take appropriate measures to promote the stable development of communities and protect ecosystems. There are numerous methods to analyse the distribution characteristics of species. Initially, species distribution characteristic curves were obtained via controlled experiments, and the optimal ecological position of species could be roughly obtained. On this basis, various species distribution models were gradually applied to the simulation and prediction of species distribution. Species distribution models (SDMs) can clearly help researchers to determine the ecological requirements of various species and predict the potential range of species based on ecology and biogeography. Currently, the main species distribution models commonly used are BIOCLIM (bioclimatic modelling) [9], DOMAIN (domain environmental envelope) [10], ENFA (ecological niche factor analysis) [11], GAM (generalised additive model) [12], GARP (genetic algorithm for rule-set production) [13] and Maxent (maximum entropy) [14]. Among these models, the Maxent model is the most widely used model value, which can obtain good results even in the case of incomplete data. The Maxent model has been widely used in many fields such as plant and animal conservation [14,15], endangered species management [16], invasive species control [17], and agricultural zoning [16,18]. Hu [19] used Maxent to analyse the potential distribution areas of mangrove and salt marsh communities, and obtained more accurate results in the corresponding scale range. It was found that in terrestrial ecosystems, climatic conditions are basically the main determinants of species distribution [20], and in marine ecosystems, oceanographic features are important in determining species distribution. However, the special living environment of mangroves and salt marshes makes their existence conditions more stringent and their response to environmental and other conditions more sensitive. In the process of analysing their potential distribution areas, considering terrestrial or marine influences alone is far from sufficient to explain their distribution characteristics. Hu [19], in 2020, analysed the potential distribution areas of mangroves in China based on climate, marine, and topographic factors, and obtained more satisfactory results in this scale range. Therefore, a more comprehensive consideration of species distribution regulators is a prerequisite for the accurate analysis of mangrove and salt marsh species distribution characteristics. At the same time, Craig W. Benkman [21] emphasised that in our analysis of species distribution, in addition to environmental conditions, interactions between species are also important factors that regulate species distribution. By summarising past studies, the main influencing factors of species distribution can be divided into two types of biotic and abiotic influences. Biotic influences mainly include synergistic and competitive effects, while abiotic effects mainly include factors such as climate, ocean, soil, and topography. Therefore, studies that integrate biotic and abiotic factors need to be further developed.
The study uses version 6.7 of the SLAMM (Sea Level Affecting Marshes Model), which was first developed in the 1980s with funding from the U.S. Environmental Protection Agency (EPA) by Warren Pinnacle Consulting, with Dr. Richard A. Park making significant contributions to the first five versions. The model simulates the major processes involved in wetland conversion and shoreline displacement during long-term sea level rise. Tidal marshes are probably one of the ecosystems most vulnerable to climate change, especially with regard to accelerating sea level rise. The model divides the entire study area into cells of equal size (typically between 5 m and 30 m), simulating each cell’s feature type separately. The transfer between coastal feature types is demonstrated through a flexible and complex decision tree that combines geometric and qualitative relationships. It predicts the future distribution of wetlands under sea level rise and illustrates the results in graphs and tables containing area sizes. In order to understand the distribution of wetland organisms in more detail and to protect the diversity of coastal wetland organisms and ecosystems, many scholars at home and abroad have used the SLAMM to simulate and predict the future distribution and to assess the coastal wetland ecosystems under the influence of global climate change. Lee [22] and Henry [23] used initial indicators of land classification and elevation to model future feature distribution in northeast Florida’s coastal wetlands and Yaquina Bay, respectively. After that, Wu [24], Wang [25], Li [26], and Wang [27] considered the sedimentation rate, and the study areas were Chongming Dongtan in Shanghai, Guangxi coastal zone, and Florida, U.S.A. Wu [24] and Wang [25] added sedimentation to the sea level rise scenario. Sasha Li used SLAMM 6.0 to quantitatively assess the effects of sea level rise on mangrove forests in Guangxi [28] and Song Pan and Hui Wang et al. conducted a comparative study of the different deposition rates of Guangxi coastal mangroves in response to sea level based on the SLAMM [29]. Most of these studies were conducted for a single region, considering only environmental or biological factors, and did not integrate the results from multiple regions or integrate biotic and abiotic factors to obtain predictions of mangrove belt adaptation to sea level rise in the corresponding region.
The ecological environment of mangrove forests and S. alterniflora is facing many problems and challenges. In recent years, with climate change and socioeconomic development, mangrove and miscanthus ecosystems have been seriously affected. The future trends are not yet clear. By studying the distribution patterns of coastal wetlands, especially mangroves and S. alterniflora, we can understand the current progress and simulate and predict the future scenarios, as well as accomplish the important task of protecting coastal wetland ecosystems. This project uses the SLAMM to establish the basis of model simulation for the coastal areas of mainland China, integrates the joint role of biotic and abiotic factors in the distribution of mangroves and salt marshes, investigates the factors influencing the change in species in the region under future climate change and their responses to climate change, analyses the main causes of the decrease in the area of mangroves and S. alterniflora, and provides practical guidance for the development of mangrove and salt marsh ecosystems. This study will provide practical guidance for the development of mangrove and salt marsh ecosystems and promote the stable development of coastal ecosystems.

2. Materials and Methods

2.1. Research Design
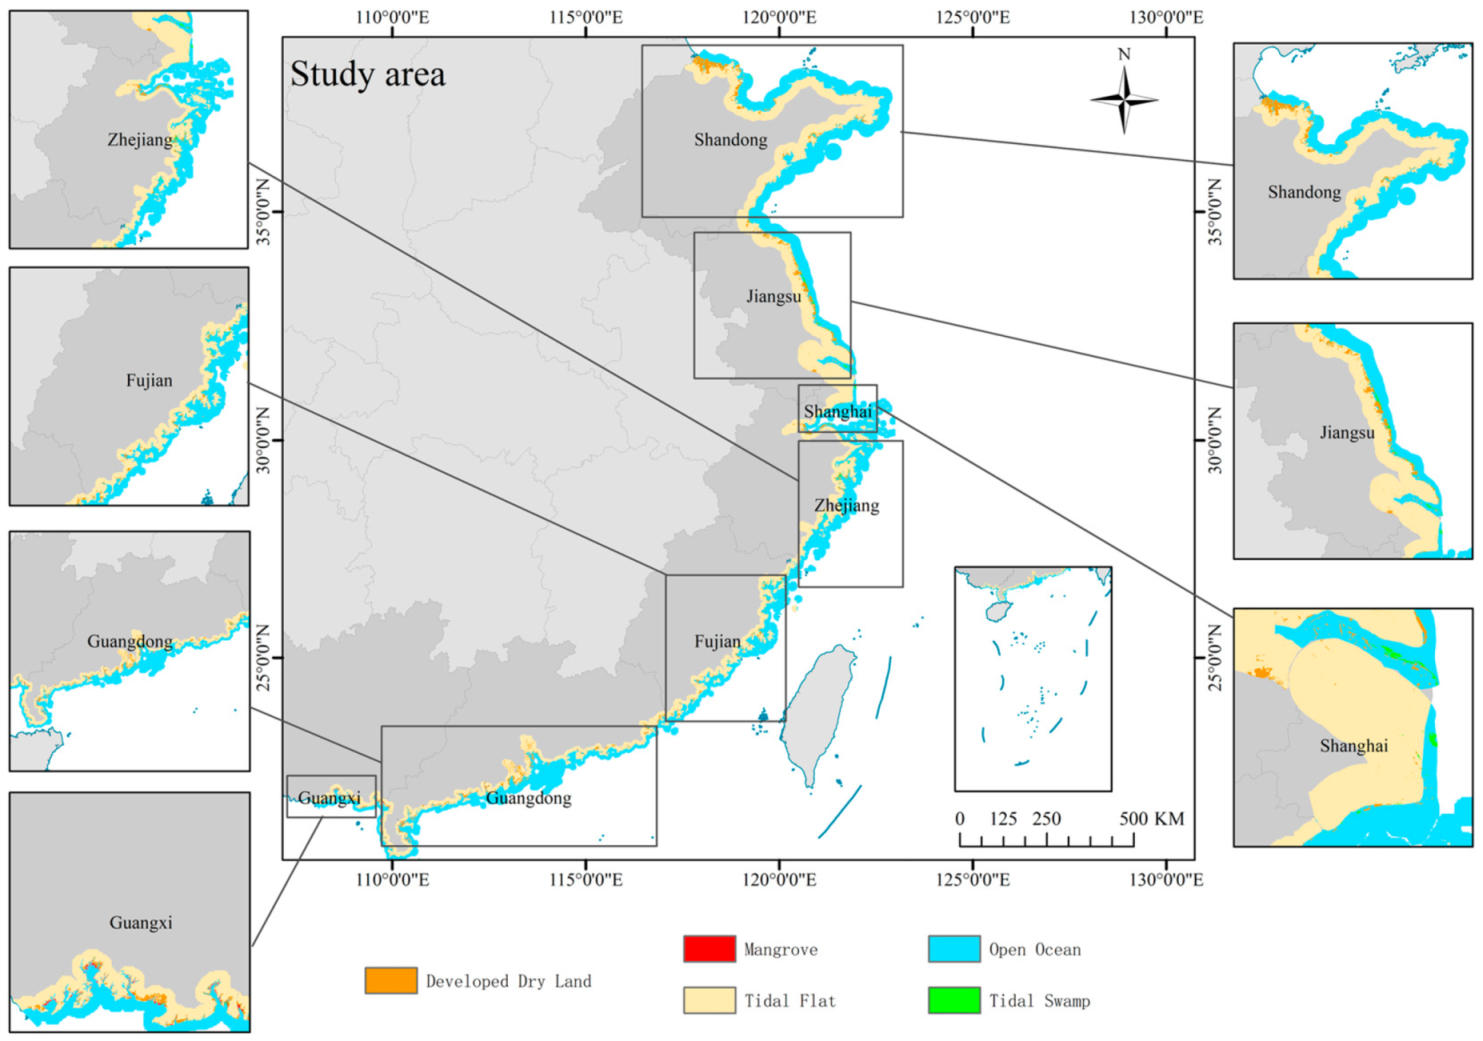
Figure 1 shows the flow chart of the method used in the study. In this study, remote sensing data, observational data, and historical data were collected for coastal mangroves and S. alterniflora in mainland China. On this basis, sea level rise scenarios with different sedimentation rates and four SSP scenarios were set up, and the SLAMM was applied to assess the future changes in wetland ecosystem patterns in mainland China in multiple simulation scenarios formed by the intersection of two factors, and to further analyse the short-term and long-term trends in mangrove and S. alterniflora distribution patterns in China under the combined influence of climate change. The spatial and temporal changes in wetland patterns in China in recent years were combined with the analysis of future trends, and countermeasures for the conservation of coastal wetlands in mainland China based on realistic production practices are proposed.

2.2. Study Areas

The study area (Figure 2) shows seven coastal provinces (Shandong, Jiangsu, Shanghai, Zhejiang, Fujian, Guangdong, and Guangxi Province). The geographical range of the study area is between 20.22°–38.40° N and 104.45°–122.83° E. The climates in this area vary from tropical monsoon to a warm temperate monsoon climate. Fuding (Fujian Province) is the northern boundary of the naturally grown mangroves in China, with the lowest monthly mean temperature being 8.4 °C [30]. Tides across the coastlines varied in type and amplitude (Figure 1). Figure 2 also shows the land use categories of the locations, and more detailed information about the categories is listed in Table 1.

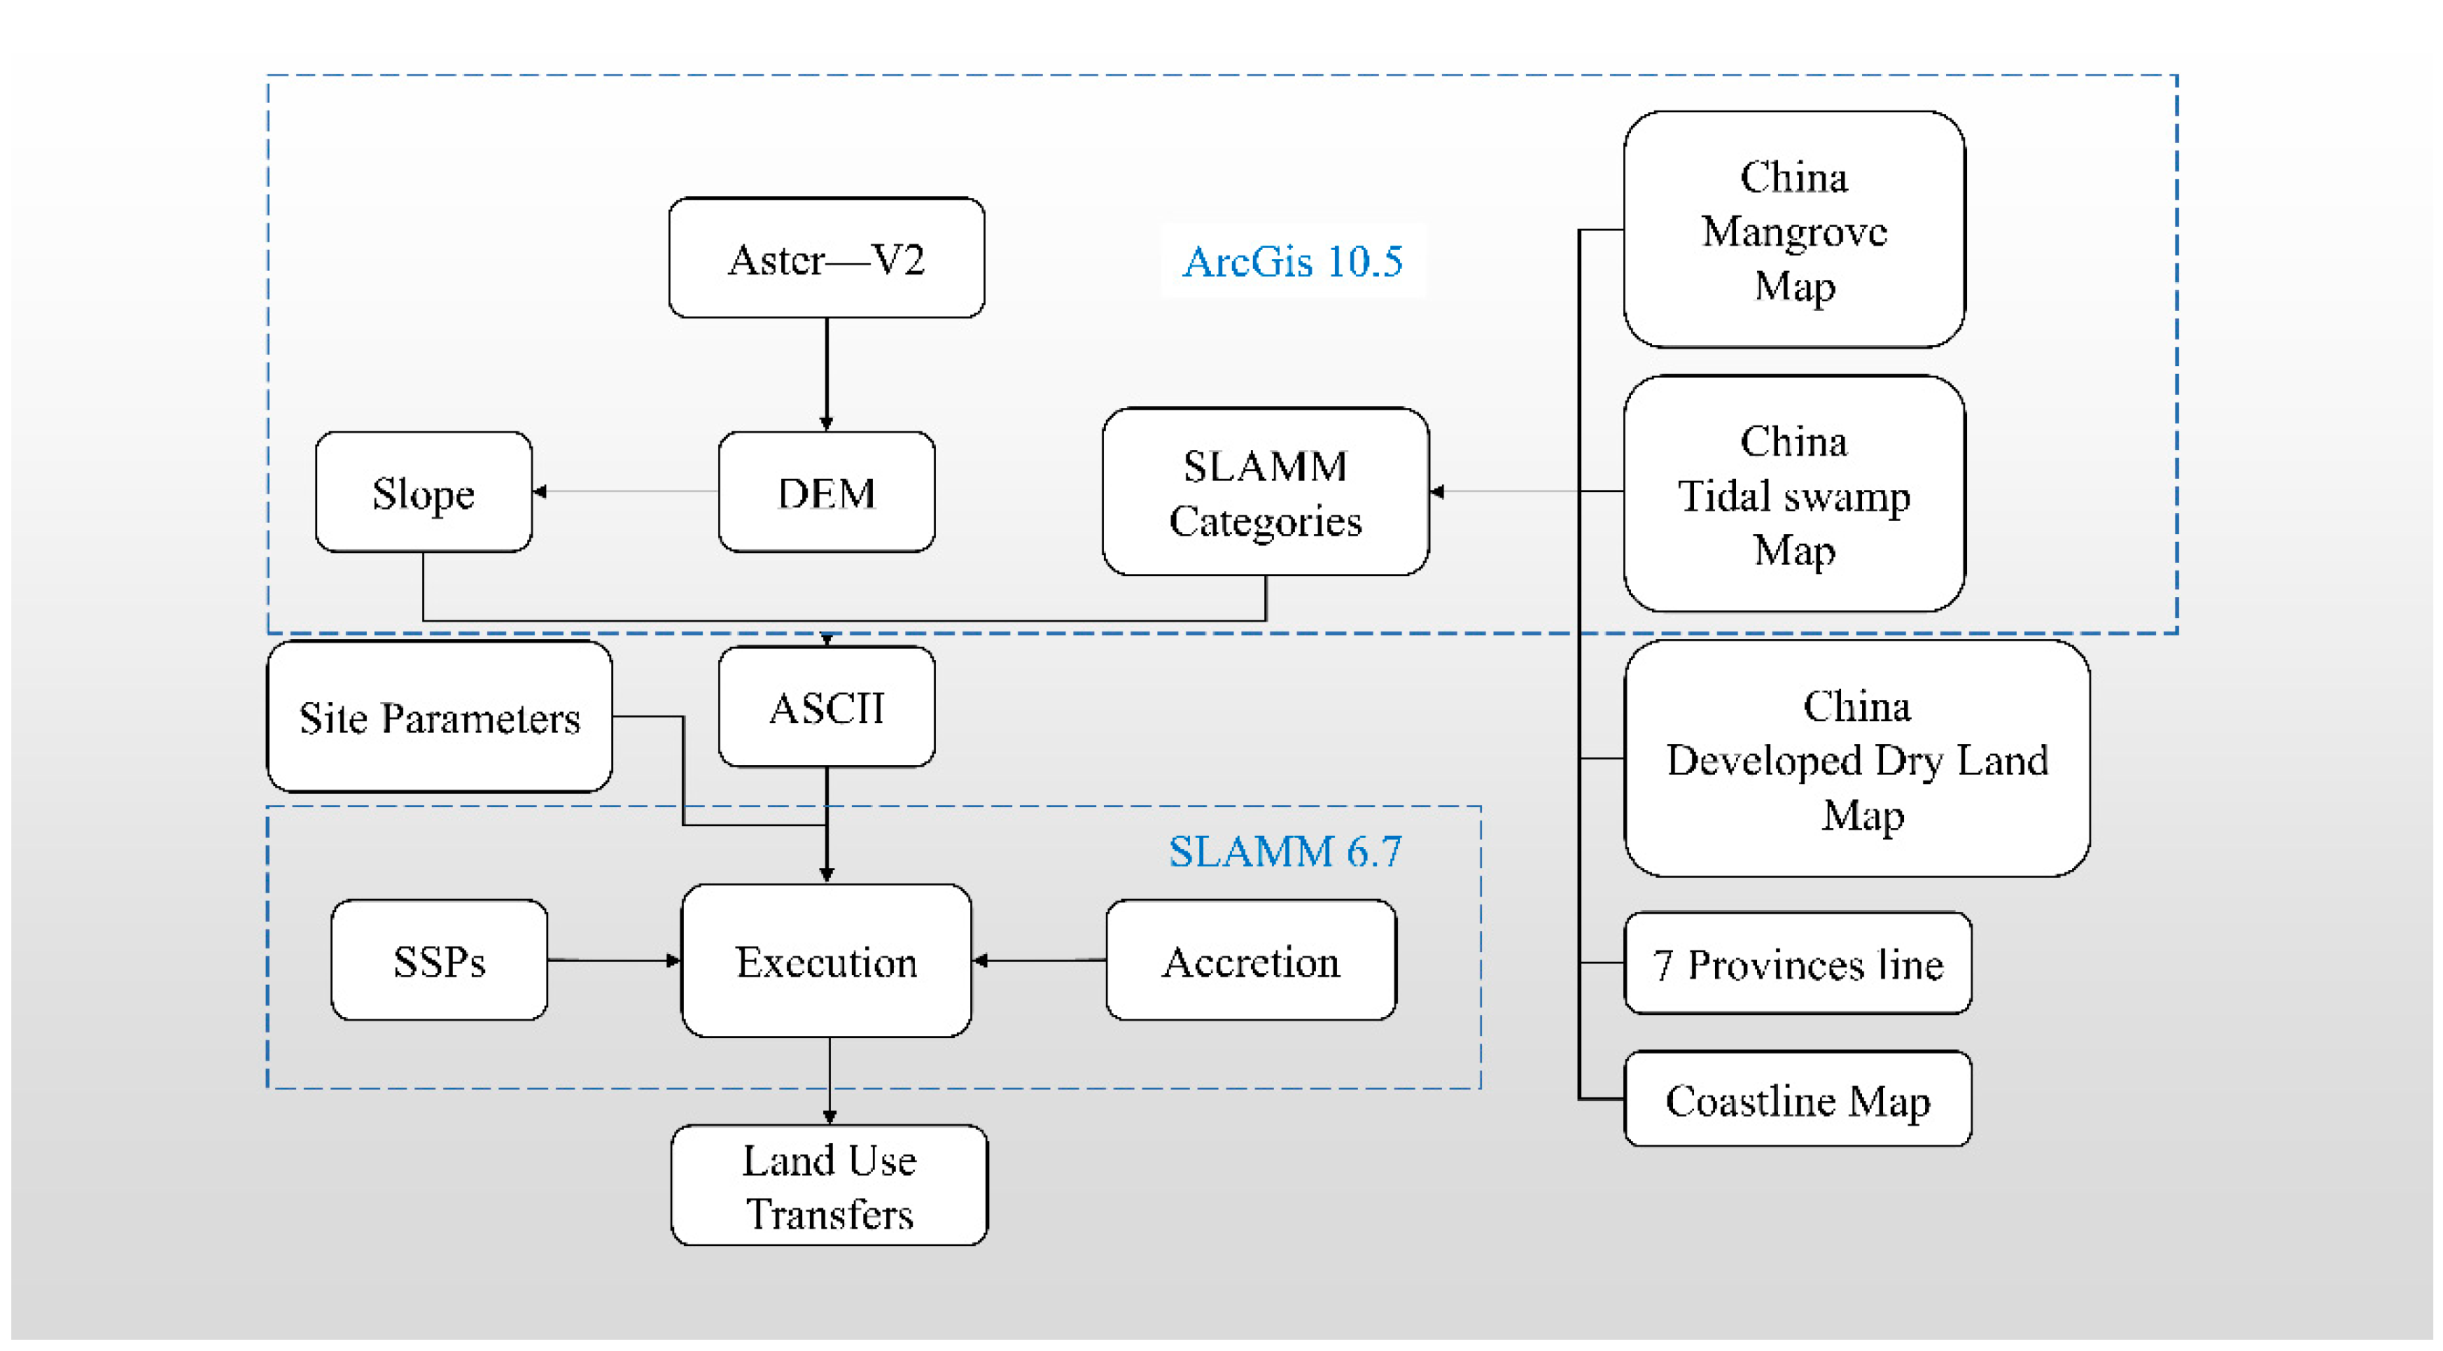
2.3. SLAMM Simulation

SLAMM version 6.7 was used for this study. The Sea Level Affecting Marshes Model (SLAMM) simulates the dominant processes involved in wetland conversions and shoreline modifications during long-term sea level rise. Tidal marshes can be among the most susceptible ecosystems to climate change, especially with regard to accelerated sea level rise (SLR).

2.3.1. Digital Elevation Maps and Slope

High-vertical-resolution elevation data may be the most important SLAMM data requirement. The Terra Advanced Spaceborne Thermal Emission and Reflection Radiometer (ASTER) Global Digital Elevation Model (GDEM) Version 3 (ASTGTM) provides a global digital elevation model (DEM) of the land areas on Earth at a spatial resolution of 1 arc second (approximately 30 m horizontal posting at the equator) (from LP DAAC-ASTGTM accessed on 1 September 2022 (https://lpdaac.usgs.gov/products/astgtmv003/)). In an ArcGis environment, DEM was converted to slope maps using “Surface” of “Spatial Analysis”.

2.3.2. SLAMM Categories

There are 26 land feature models defined in SLAMM, and each type has its unique code. The model determines whether the relative sea level rise exceeds the survivable elevation range of a vegetation by means of subduction and erosion conditions. We joined the map of China’s coastline and the map of mangrove [30,31], S. alterniflora [32,33], and developed dry land [34] distribution (National Earth System Science Data Center, National Science and Technology Infrastructure of China accessed on 1 September 2022 (http://www.geodata.cn)), and corrected it using the provincial boundary map.
Then, DEM and slope maps were extracted using the mask of the SLAMM map; then, the 3 maps were converted from “raster” to “ascii” files.
Input parameters required for SLAMM displayed in Table 2.

2.3.3. SLR Scenarios

Shared socioeconomic pathways (SSPs) are scenarios of projected socioeconomic global changes up to 2100. They are used to derive greenhouse gas emission scenarios with different climate policies [41,42]. Chapter 9 of the IPCC Sixth Assessment Report Working Group I report provides a comprehensive assessment of the latest monitoring and numerical modelling results related to sea level, indicating that the current rate of sea level rise (3.7 mm/a) is accelerating (2006–2018) and will continue to rise in the future, with an irreversible trend. In the high-emission scenario (SSP5-8.5), the estimated global mean sea level (GMSL) will rise by 0.20–0.30 m by 2050, and by 0.63–1.02 m by 2100, respectively [43]. The projected sea level rise under different shared socioeconomic pathway scenarios during 2030–2050 with a baseline of 1995–2014 (Table 3).

2.4. Land Use Transfers

In order to predict the future number of pixels of each land type in the study area, the Markov model was applied in the simulation of land use change [44]. In an ArcGis environment, several maps from continuous time can be inputted to find out transformations, including categories and areas in the land use transfers matrix. Changes in developed dry land were the focus in this study, since the type combines costal vegetation and human activities tightly.

3. Results

3.1. Dynamic Changes in Coastal China under Four SLR Scenarios

The land use changes in coastal China in 2100 are shown in Figure 3 under different SLR scenarios. The most visible change is that the number of land use categories increased from 5 to 9, including estuarine open water, transitional marsh, open beach, and regularly flooded marsh, showing some transition. Compared to 2015, S. alterniflora had different levels of loss in the latter two scenarios, with the SSP3-7.0 scenario showing a loss of 19.59% by 2080 and 18.88% by 2100. The SSP5-8.5 scenario showed a damage of 19.61% by 2060, a loss of 19.92% by 2080, and a decline of 20.48% by 2100. Mangrove loss started from 2020 in all four scenarios, and the faster the rate of sea level rise, the more pronounced the change. Compared with 2015, SSP1-2.6 minimised 2.0839% by 2100, SSP2-4.5 dropped 2.0853% by 2100, SSP3-7.0 reduced 6.0343% by 2100, and SSP5-8.5 lost 6.2195% by 2100.

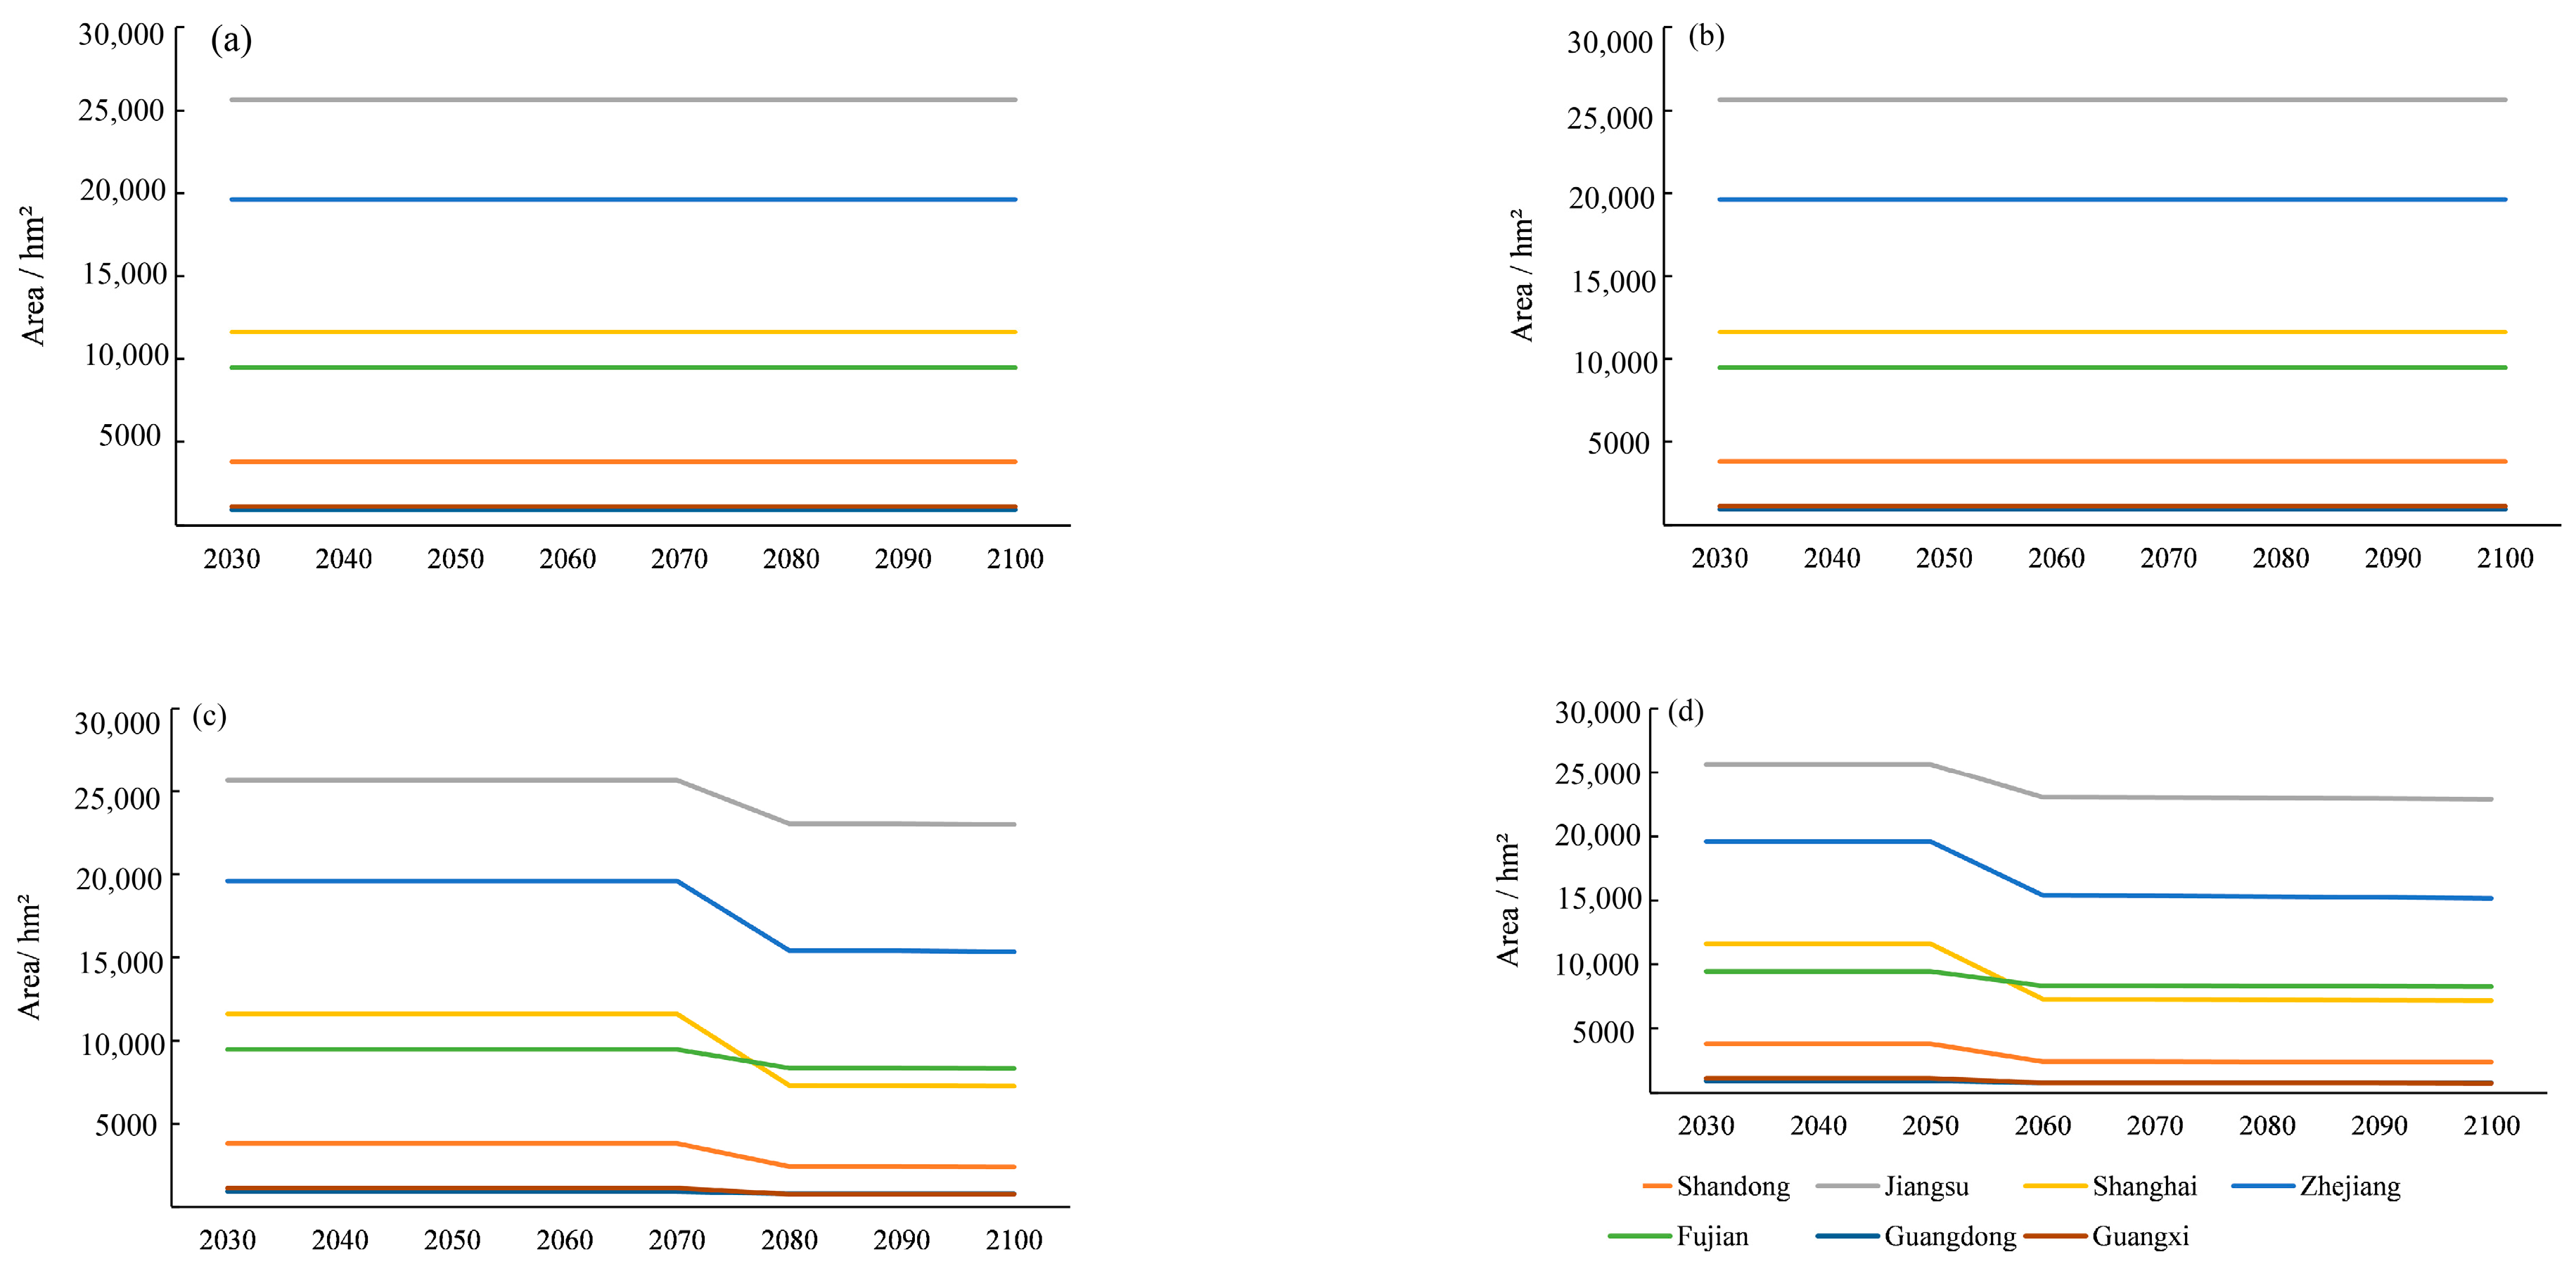
3.2. S. alterniflora Changes by Regions

Figure 4 illustrates the variation in area of intercalary S. alterniflora in different scenarios in different regions. The degree of drastic loss was in the following order, taking the year 2100 in SSP5-8.5 as an example: Jiangsu (10.76%) < Fujian (12.56%) < Guangdong (117.87%) < Zhejiang (22.65%) < Guangxi (33.63%) < Shandong (37.45%) < Shanghai (37.78%), and the tidal difference was as follows: Shandong (1.25 m) < Guangdong (1.95 m) < Guangxi (2.2 m) < Jiangsu (2.5 m) < Fujian (2.65 m) < Shanghai (2.8 m) < Zhejiang (4.68 m), according to Table 4. The tidal difference and the degree of loss patterns in Jiangsu and Shanghai were in the same direction in the areas where only S. alterniflora grows. In the mangrove areas, the main mangrove species was Kandelia obovata, and the tidal difference between Zhejiang and Fujian was the same as the degree of loss. The tidal difference and the degree of loss pattern were in the same direction in the two regions of Guangdong (where the main species of mangroves is Avicennia marina).

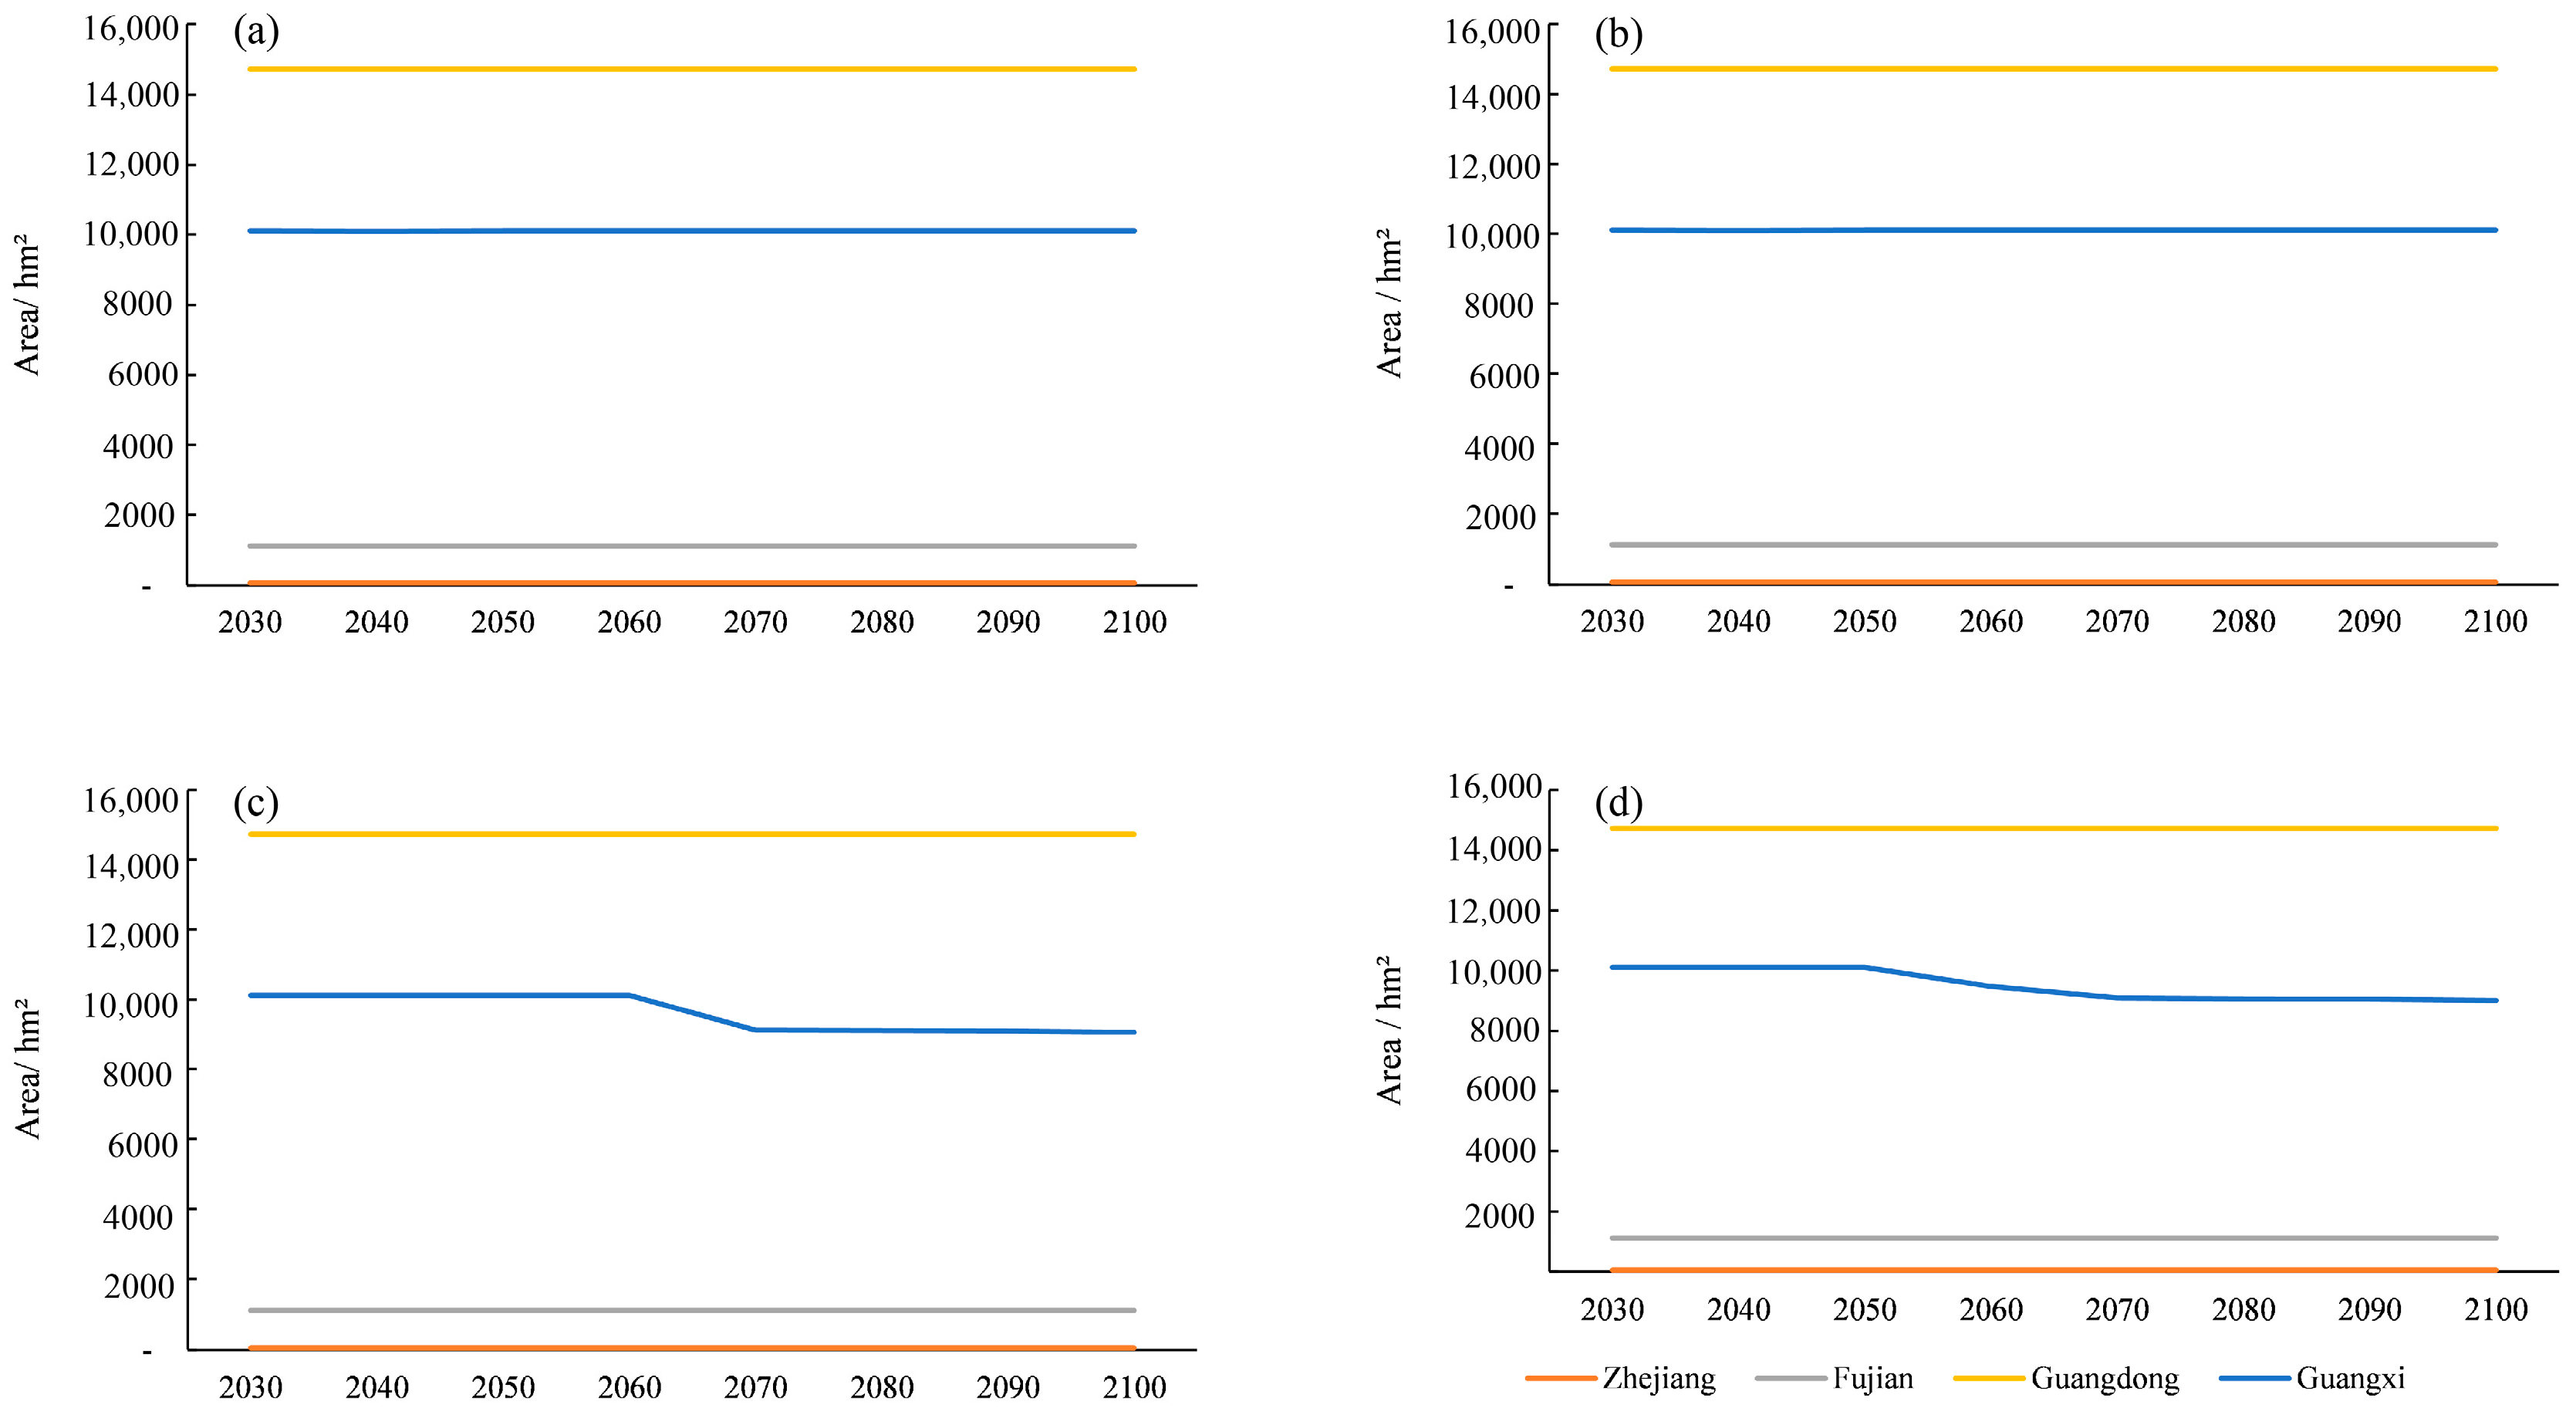
3.3. Mangrove Changes by Regions

Mangrove forests grow in four provinces of our study area: Zhejiang, Fujian, Guangdong, and Guangxi. Figure 5 shows the changes in mangrove forests in these four provinces in different scenarios, and it can be found that the loss in mangrove forests in Guangxi was the most visible, and the rest of the provinces tended to be stable. The area of mangrove forests in Guangxi Province until 2100 will be 10,108.9868 hm2 (SSP1-2.6), 10,108.6283 hm2 (SSP2-4.5), 9059.5832 hm2 (SSP3-7.0), and 9010.384 hm2 (SSP5-8.5), respectively.
The original sedimentation rate of mangroves in Guangxi province is 6.7 mm/a, and the simulations were conducted by taking this and multiplying it by 1.5 times (10.05 mm/a) and 2 times (13.4 mm/a), respectively. It could be found, as seen in Figure 6, that the ability of mangroves to resist sea level rise was gradually increasing. At a rate of 10.05 mm/a, the area of mangroves will not be drastically reduced. Therefore, the rate of 6.7 mm/a was used as the starting standard, and 0.5 mm/a was used as the interval to increase sequentially. The first two scenarios were almost unchanged. In the latter two scenarios, the mangrove area decreased year by year for a rate less than 9.7 mm/a, while it did not decrease and even appeared to be larger than the original area for the scenarios equal to or exceeding 9.7 mm/a.

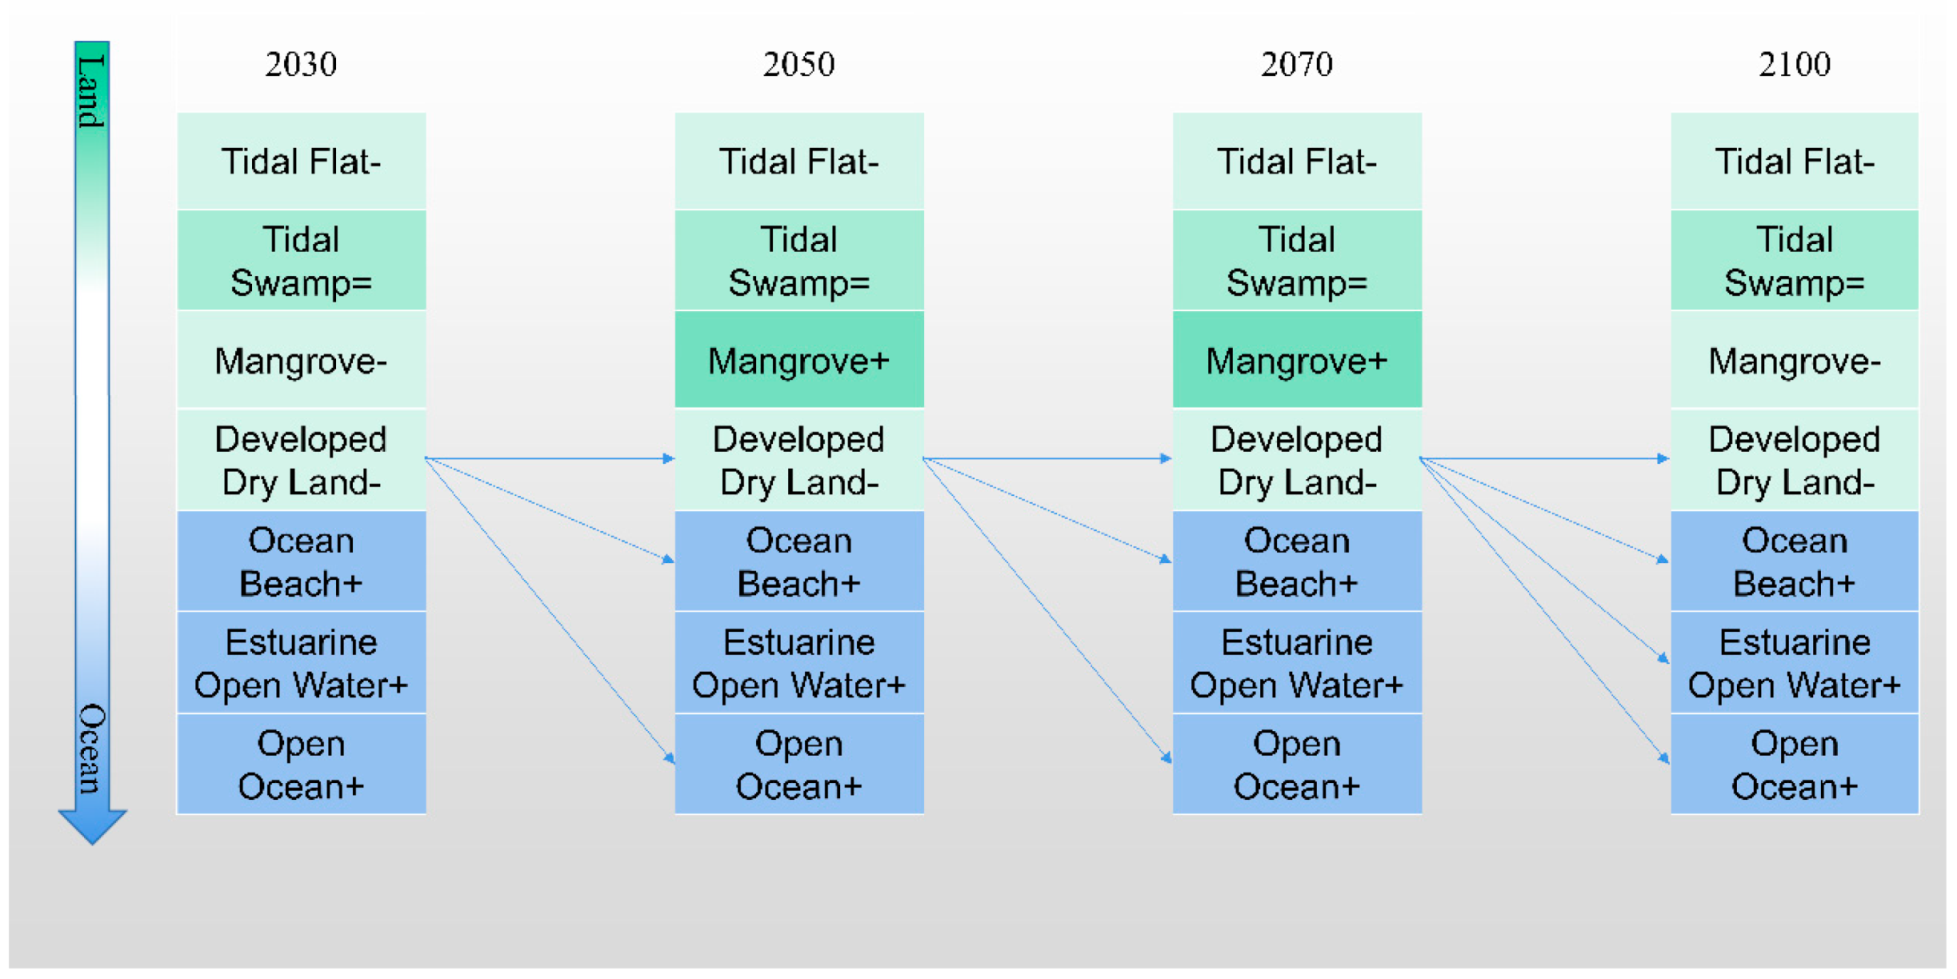
3.4. Land Use Transfers with Guangxi in SSP2-4.5 as Example

Since the SSP2-4.5 scenario is mild, Guangxi region under the SSP2-4.5 scenario was selected as a typical example, and the “land use transfer” function was run in ArcGis to obtain land use type changes, including type and area, during four continuous periods (2020–2030, 2030–2050, 2050–2070, and 2070–2100), paying special attention to developed dry land. From Figure 7, we can see that the areas of tidal flat (418,214.59 hm2 in 2030, 418,137.33 hm2 in 2050, 418,062.43 hm2 in 2070, and 417,929.17 hm2 in 2100) and developed dry land (34,116.81 hm2 in 2030, 34,058.23 hm2 in 2050, 34,006.64 hm2 in 2070, and 33,948.23 hm2 in 2100) were decreasing all the time and the area of tidal swamp (1132.84 hm2) was staying the same, while the areas of ocean beach (326.54 hm2 in 2030, 340.56 hm2 in 2050, 351.05 hm2 in 2070, and 355.31 hm2 in 2100), estuarine open water (2051.31 hm2 in 2030, 2167.23 hm2 in 2050, 2276.53 hm2 in 2070, and 2448.25 hm2 in 2100) and open ocean (342,973.23 hm2 in 2030, 342,978.30 hm2 in 2050, 342,984.68 hm2 in 2070, and 342,999.45 hm2 in 2100) were increasing persistently, and the area of mangroves was increasing and decreasing. For the developed dry land, it has been shifting to ocean beach, estuarine open water, and open ocean, except for the areas that themselves remain unchanged.

4. Discussions

Comparing the changes in mangrove and S. alterniflora in China’s inland coastal provinces during sea level rise, the main factors for the differences were influenced by climate differences between latitudes, tidal difference magnitude, sea level rise rate, plant community deposition rate, and seawall obstruction.

4.1. Tidal Difference and Deposition Effects

In 2014, Fu [45] proposed “The smaller the tidal difference, the more sensitive mangroves are to sea level rise”. As S. alterniflora and mangroves have similar habitats [46,47], we hypothesise that the tidal difference in the S. alterniflora plant communities has a similar pattern in response to sea level rise. The tidal differences in the coastal provinces of China tended to decrease roughly from north to south, and the tidal differences in Guangdong and Guangxi were significantly smaller than those in Jiangsu and Fujian, and so they were more sensitive to sea level rise, and the area of S. alterniflora changed more rapidly, in line with the pattern. However, not all areas in the experiment consistent with this relationship, and the opposite even occurred when classified according to whether or not S. alterniflora or mangroves were growing. From the perspective of plant community species composition and community structure, different tree species in the plant communities of the seven coastal provinces of China respond differently to sea level rise. In our analysis, in addition to the narrowing of the width of the mangrove and S. alterniflora forest belts in front of the dikes, which affects their smaller distribution areas, the relative sea level rise also inevitably changes the community structure of both. In terms of biological factors, their mutual constraints influence the response to sea level rise.

4.2. Exploration of Suitable Tree Species for Mangrove Forest Planting in Guangxi

Estuarine wetlands are also the most prominent zone of sea–land interaction and human activities, and are the focus of conflicts between environmental protection and economic development [48]. With the development of coastal cities and ports, more anthropogenic factors are also testing the adaptability of mangrove vegetation to the environment. China’s largest coastal project to date has been the construction of seawalls, and the “seawall + mangrove forest in front of the dike” is the main protection model in China to ensure ecological, economic, and social benefits, and the protection, management, and restoration of China’s mangrove communities are carried out according to this model. However, under the future sea level rise, the construction of sea dikes will block the retreat of mangroves and become a major barrier to the landward migration of mangroves. When the increase in surface elevation of mangroves in front of the dikes is lower than the relative sea level rise, the mangroves in front of the dikes will be squeezed, the area will be reduced, and the community structure will be changed and even disappear [49].
Due to their own sedimentation and potential for expansion, there is evidence that mangroves can actively resist the harmful effects of sea level rise [50]. It was pointed out in one article that “if the sedimentation rate in mangrove areas can keep up with the rate of sea level rise, sea level rise will not have a great impact on mangroves [45]”. Since the lowest sedimentation rate (6.7 mm/a) was found in Guangxi mangroves (with Zhejiang at 12.4 mm/a, Fujian at 56.5 mm/a, and Guangdong at 13.8 mm/a), Figure 5 shows the most pronounced variation in Guangxi. From the results in Figure 6, it is known that the deposition rate of Avicennia marina originally planted in Guangxi was 6.7 mm/a, and the area was lost in all four of the future climate scenarios, because the deposition had a positive effect on sea level rise; we used different deposition rates to conduct experiments and found that the area was not lost when the deposition rate of mangrove plants was 9.7 mm/a and above. That is, mangrove plants with a sedimentation rate ≥9.7 mm/a are suitable to be promoted and planted in the Guangxi area. The results of the SLAMM simulations of mangroves in response to sea level rise in this study area show that different tree species have different sedimentation rates and different sensitivities to sea level rise; so, it is necessary to suggest more suitable tree species for mangrove-growing areas based on the results of the simulations.

4.3. Production Guidance for Human Activities

A global mangrove decrease has been attributed primarily to human activity [51]. Anthropogenic loss hotspots across Southeast Asia and around the world have highly threatened the ecosystem, though natural processes such as erosion can also play a vital role. It was estimated that 62% of global losses between 2000 and 2016 resulted from land use change [52]. The study by Dan Xinqiu and Liao Baowen mentioned that environmental pollution has affected the healthy growth of more than half of China’s mangrove forests, and the construction of dikes and reclamation, infrastructure and urban construction, excessive fishing and harvesting, invasive alien species, sediment siltation, etc., constitute the main threats to more than 30% of China’s mangrove wetlands [53]. In conjunction with the aforementioned seawalls that can cut off the retreat of mangroves, the link between mangrove protection and land use should be strengthened to maintain normal production activities. In addition to quality monitoring and supervision work on the surrounding environment, the formulation and improvement of laws and regulations to punish overfishing and harvesting, and the attention paid to the competition between mangroves and other species, etc., in land use, attention should be paid to combining urban progress and ecological protection, formulating policies to restore and rebuild mangroves from a macroscopic perspective [54], and moderately building nearby building sites for economic development. Therefore, based on the simulation results of SLAMM 6.7, the coastal zone around mangroves should be designed rationally to reduce coastal erosion, restore the light beach, and cope with the slowdown of the sea level.
Based on the results of the land use transfer matrix, recommendations are made for developed dry land production practices, such as the following: (1) Transitional swamps, frequently flooded swamps, mangroves, light beaches, beaches, and open seawater areas that can be converted from developed dry land can be resisted by the appropriate planting of vegetation. (2) Light beaches, beaches, and open seawater areas that can be transformed into developed dry land need to be restored with better management. (3) The farms themselves should be adapted to local conditions.

5. Conclusions

As a highly productive species, the stable development of mangroves and salt marshes plays an important role in mitigating climate change and maintaining the development of ecosystem cycles. At the same time, mangrove invasion alters the plant and microbial structure of mangrove communities and weakens the carbon sink, and the two interact at the biological level. Warming-induced increases in sea temperature, sea level rise, and extensive glacial melt will have a significant impact on the coastal zone where they live. Therefore, understanding the development and regulation of mangroves and salt marshes, as well as their response to future climate change, is essential for the stable development of these ecosystems. This paper used the SLAMM to simulate and predict the effects of sea level rise on the distribution of mangroves and S. alterniflora along the Chinese coast. The results are as follows: (1) The dramatic reduction in the vegetation area is positively correlated with the rate of sea level rise. (2) Tidal differences and sedimentation rates affect the response of mangrove and S. alterniflora distribution to sea level rise, as well as interactions between organisms. (3) The reasonable land use of coastal wetlands is important to researchers. Land use is one of the tools for effective mangrove conservation.
In this study, there were only five categories of “farm, mangrove, tidal flat, open ocean, and tidal swamp” when setting up the feature classification, while the total classification of SLAMM has 26 species; so, improving the fine classification may make the results more accurate (but there was a test to remove the “tidal swamp” classification, and it was found that it had little effect on the distribution of mangroves). The model does not take into account elevation changes and the erosion effect on the light beach, which can further increase the numerical model of elevation dynamics and input the erosion rate of the light beach; because the study area is wide, the tidal difference, sedimentation rate, and sea level rise rate were taken as the averages of the relevant studies in each province, which were not as accurate as the small-area-specific data. In SLAMM, accretion data can only be inputted by wetland habitats, but neglecting types such as developed dry land [55]. Additionally, as an empirical model with static values for its parameters, the modelling results have certain limitations [56]. The results obtained are the general trend. The SLAMM can be coupled with the land-use-related model to guide the production practice by combining the land use transfer matrix as mentioned in the previous section. The abovementioned points are the parts of this study that need to be improved. For the researchers, it is expected that mangrove ecology will be taken to a new stage by building upon the existing theoretical basis of mangrove and mangrove distribution, continuously establishing and updating research methods and tools, improving and refining prediction models, and conducting in-depth studies on the adaptability of mangroves and their evolutionary mechanisms.

Author Contributions

Conceptualisation, Y.Z., L.C., and J.J.; methodology, Y.Z., L.C., and J.J.; software, Y.Z.; resources, Y.Z. and D.X.; writing—original draft preparation, Y.Z. and L.C.; writing—review and editing, Y.Z., L.C., D.X., and J.J.; visualisation, Y.Z.; supervision, J.J.; project administration, J.J. All authors have read and agreed to the published version of the manuscript.

Funding

This work was supported by Zhejiang Province-Chinese Academy of Forestry cooperative project (Grant No. 2019SY01), Jiangsu Postgraduate Research and Practice Innovation Program (KYCX21_0856) and the Qing Lan Project of Jiangsu Province.

Data Availability Statement

Data available on request due to restrictions eg privacy or ethical. The data presented in this study are available on request from the corresponding author.

Acknowledgments

For the data support we acknowledge the “National Earth System Science Data Center, National Science and Technology Infrastructure of China (http://www.geodata.cn (accessed on 1 September 2022))”, “NASA EOSDIS Land Processes DAAC (https://lpdaac.usgs.gov/products/astgtmv003/ (accessed on 1 September 2022))”.

Conflicts of Interest

The authors declare no conflict of interest.

References

  1. Donato, D.C.; Kauffman, J.B.; Murdiyarso, D.; Kurnianto, S.; Stidham, M.; Kanninen, M. Mangroves among the most carbon-rich forests in the tropics. Nat. Geosci. 2011, 4, 293–297. [Google Scholar] [CrossRef]
  2. Kauffman, J.B.; Adame, M.F.; Arifanti, V.B.; Schile-Beers, L.M.; Bernardino, A.F.; Bhomia, R.K.; Donato, D.C.; Feller, I.C.; Ferreira, T.O.; Jesus Garcia, M.d.C.; et al. Total ecosystem carbon stocks of mangroves across broad global environmental and physical gradients. Ecol. Monogr. 2020, 90, e01405. [Google Scholar] [CrossRef]
  3. Krauss, K.W.; McKee, K.L.; Lovelock, C.E.; Cahoon, D.R.; Saintilan, N.; Reef, R.; Chen, L. How mangrove forests adjust to rising sea level. New Phytol. 2014, 202, 19–34. [Google Scholar] [CrossRef]
  4. Lee, S.Y.; Primavera, J.H.; Dahdouh-Guebas, F.; McKee, K.; Bosire, J.O.; Cannicci, S.; Diele, K.; Fromard, F.; Koedam, N.; Marchand, C.; et al. Ecological role and services of tropical mangrove ecosystems: A reassessment. Glob. Ecol. Biogeogr. 2014, 23, 726–743. [Google Scholar] [CrossRef]
  5. Liu, H.; Ren, H.; Hui, D.; Wang, W.; Liao, B.; Cao, Q. Carbon stocks and potential carbon storage in the mangrove forests of China. J. Environ. Manag. 2014, 133, 86–93. [Google Scholar] [CrossRef]
  6. Alongi, D.M. Carbon cycling and storage in mangrove forests. Ann. Rev. Mar. Sci. 2014, 6, 195–219. [Google Scholar] [CrossRef] [PubMed]
  7. Li, S.; Meng, X.; Ge, Z.; Zhang, L. Vulnerability assessment on the mangrove ecosystems in qinzhou bay under sea level rise. Acta Ecol. Sin. 2014, 34, 2702–2711. (In Chinese) [Google Scholar]
  8. Zhu, F.; Wang, H.; Li, M.; Diao, J.; Shen, W.; Zhang, Y.; Wu, H. Characterizing the Effects of Climate Change on Short-Term Post-Disturbance Forest Recovery in Southern China from Landsat Time-Series Observations (1988–2016). Front. Earth Sci. 2020, 14, 816–827. [Google Scholar] [CrossRef]
  9. Csuti, B.; Margules, C.R.; Austin, M.P. Nature Conservation: Cost Effective Biological Surveys and Data Analysis. J. Wildl. Manag. 1991, 34, 2702–2711. [Google Scholar] [CrossRef]
  10. Carpenter, G.; Gillison, A.N.; Winter, J. DOMAIN: A flexible modelling procedure for mapping potential distributions of plants and animals. Biodivers. Conserv. 1993, 2, 667–680. [Google Scholar] [CrossRef]
  11. Hirzel, A.; Guisan, A. Which is the optimal sampling strategy for habitat suitability modelling. Ecol. Model. 2002, 157, 331–341. [Google Scholar] [CrossRef]
  12. Guisan, A.; Lehmann, A.; Ferrier, S.; Austin, M.; Overton, J.M.C.; Aspinall, R.; Hastie, T. Making better biogeographical predictions of species’ distributions. J. Appl. Ecol. 2006, 43, 386–392. [Google Scholar] [CrossRef]
  13. Vermeersch, E.; Denorme, F.; Maes, W.; De Meyer, S.F.; Vanhoorelbeke, K.; Edwards, J.; Shevach, E.M.; Unutmaz, D.; Fujii, H.; Deckmyn, H.; et al. The role of platelet and endothelial GARP in thrombosis and hemostasis. PLoS ONE 2017, 12, e0173329. [Google Scholar] [CrossRef] [PubMed]
  14. Phillips, S.J.; Anderson, R.P.; Schapire, R.E. Maximum entropy modeling of species geographic distributions. Ecol. Model. 2006, 190, 231–259. [Google Scholar] [CrossRef]
  15. Zhang, K.; Yao, L.; Meng, J.; Tao, J. Maxent modeling for predicting the potential geographical distribution of two peony species under climate change. Sci. Total Environ. 2018, 634, 1326–1334. [Google Scholar] [CrossRef]
  16. Ashraf, U.; Ali, H.; Chaudry, M.; Ashraf, I.; Batool, A.; Saqib, Z. Predicting the Potential Distribution of Olea ferruginea in Pakistan incorporating Climate Change by Using Maxent Model. Sustainability 2016, 8, 722. [Google Scholar] [CrossRef]
  17. Ficetola, G.F.; Thuiller, W.; Miaud, C. Prediction and validation of the potential global distribution of a problematic alien invasive species—The American bullfrog. Divers. Distrib. 2007, 13, 476–485. [Google Scholar] [CrossRef]
  18. Hu, X.-G.; Jin, Y.; Wang, X.-R.; Mao, J.-F.; Li, Y. Predicting Impacts of Future Climate Change on the Distribution of the Widespread Conifer Platycladus orientalis. PLoS ONE 2015, 10, e0132326. [Google Scholar] [CrossRef]
  19. Hu, W.; Wang, Y.; Dong, P.; Zhang, D.; Yu, W.; Ma, Z.; Chen, G.; Liu, Z.; Du, J.; Chen, B.; et al. Predicting potential mangrove distributions at the global northern distribution margin using an ecological niche model: Determining conservation and reforestation involvement. For. Ecol. Manag. 2020, 478, 118517. [Google Scholar] [CrossRef]
  20. Zhang, K.; Zhang, Y.; Tao, J. Predicting the Potential Distribution of Paeonia veitchii (Paeoniaceae) in China by Incorporating Climate Change into a Maxent Model. Forests 2019, 10, 190. [Google Scholar] [CrossRef]
  21. Benkman, C.W. Biotic interaction strength and the intensity of selection. Ecol. Lett. 2013, 16, 1054–1060. [Google Scholar] [CrossRef] [PubMed]
  22. Matejicek, L.; Engst, P.; Janour, Z. A GIS-based approach to spatio-temporal analysis of environmental pollution in urban areas: A case study of Prague’s environment extended by LIDAR data. Ecol. Model. 2006, 199, 261–277. [Google Scholar] [CrossRef]
  23. Linhoss, A.C.; Underwood, W.V. Modeling Salt Panne Land-Cover Suitability under Sea-Level Rise. J. Coast. Res. 2016, 32, 1116–1125. [Google Scholar] [CrossRef]
  24. Wu, W.; Yeager, K.M.; Peterson, M.S.; Fulford, R.S. Neutral models as a way to evaluate the Sea Level Affecting Marshes Model (SLAMM). Ecol. Model. 2015, 303, 55–69. [Google Scholar] [CrossRef]
  25. Wang, H.; Ge, Z.; Yuan, L.; Zhang, L. Evaluation of the combined threat from sea-level rise and sedimentation reduction to the coastal wetlands in the Yangtze Estuary, China. Ecol. Eng. 2014, 71, 346–354. [Google Scholar] [CrossRef]
  26. Li, S.; Meng, X.; Ge, Z.; Zhang, L. Evaluation of the threat from sea-level rise to the mangrove ecosystems in Tieshangang Bay, southern China. Ocean Coast. Manag. 2015, 109, 1–8. [Google Scholar] [CrossRef]
  27. Wang, B.; Su, S.; Peng, Z.; Yang, F. Coastal Wetlands Impact Assessment of Sea Level Rise. J. Tongji Univ. 2015, 43, 569–575. (In Chinese) [Google Scholar]
  28. Li, S. Vulnerability Assessment of the Coastal Mangrove Ecosystems in Guangxi, China to Sea-Level Rise. Ph.D. Thesis, East China Normal University, Shanghai, China, 2015. (In Chinese). [Google Scholar]
  29. Pan, S.; Wang, H.; Li, H.; Li, W.; Xu, H.; Jin, B. Study on impact of sea level rise on mangrove in Guangxi of China based on SLAMM model. Mar. Sci. Bull. 2020, 39, 325–334. (In Chinese) [Google Scholar]
  30. Jia, M.; Wang, Z.; Zhang, Y.; Mao, D.; Wang, C. Monitoring loss and recovery of mangrove forests during 42 years: The achievements of mangrove conservation in China. Int. J. Appl. Earth Obs. Geoinf. 2018, 73, 535–545. [Google Scholar] [CrossRef]
  31. Jia, M.; Wang, Z.; Wang, C.; Mao, D.; Zhang, Y. A New Vegetation Index to Detect Periodically Submerged Mangrove Forest Using Single-Tide Sentinel-2 Imagery. Remote Sens. 2019, 11, 2043. [Google Scholar] [CrossRef]
  32. Liu, M.; Mao, D.; Wang, Z.; Li, L.; Man, W.; Jia, M.; Ren, C.; Zhang, Y. Rapid Invasion of Spartina alterniflora in the Coastal Zone of Mainland China: New Observations from Landsat OLI Images. Remote Sens. 2018, 10, 1933. [Google Scholar] [CrossRef]
  33. Mao, D.; Liu, M.; Wang, Z.; Li, L.; Man, W.; Jia, M.; Zhang, Y. Rapid Invasion of Spartina alterniflora in the Coastal Zone of Mainland China: Spatiotemporal Patterns and Human Prevention. Sensors 2019, 19, 2308. [Google Scholar] [CrossRef]
  34. Ren, C.; Wang, Z.; Zhang, Y.; Zhang, B.; Chen, L.; Xi, Y.; Xiao, X.; Doughty, R.B.; Liu, M.; Jia, M.; et al. Rapid expansion of coastal aquaculture ponds in China from Landsat observations during 1984–2016. Int. J. Appl. Earth Obs. Geoinf. 2019, 82, 101902. [Google Scholar] [CrossRef]
  35. Riahi, K.; van Vuuren, D.P.; Kriegler, E.; Edmonds, J.; O’Neill, B.C.; Fujimori, S.; Bauer, N.; Calvin, K.; Dellink, R.; Fricko, O.; et al. The Shared Socioeconomic Pathways and their energy, land use, and greenhouse gas emissions implications: An overview. Glob. Environ. Chang. 2017, 42, 153–168. [Google Scholar] [CrossRef]
  36. Rogelj, J.; Popp, A.; Calvin, K.V.; Luderer, G.; Emmerling, J.; Gernaat, D.; Fujimori, S.; Strefler, J.; Hasegawa, T.; Marangoni, G.; et al. Scenarios towards limiting global mean temperature increase below 1.5 °C. Nat. Clim. Chang. 2018, 8, 325–332. [Google Scholar] [CrossRef]
  37. Zhang, T.; Yu, Y.; Xiao, C.; Hua, L.; Yan, Z. Interpretation of IPCC AR6 report: Monitoring and projections of global and regional sea level change. Clim. Chang. Res. 2022, 18, 12–18. (In Chinese) [Google Scholar]
  38. Feng, H. The Study on the Surface Elevation Change with the Spartina alterniflora Invasion in Coastal Wetlands of China. Master’s Thesis, Xiamen University, Xiamen, China, 2020. (In Chinese). [Google Scholar]
  39. Xie, H. A Comparative Study on the Accumulation of Heavy Metals in Phragmites australis and Spartina alterniflora in the Tidal Flats of the Yangtze Estuary. Master’s Thesis, East China Normal University, Shanghai, China, 2006. (In Chinese). [Google Scholar]
  40. Wang, A.; Chen, J.; Jing, C.; Ye, G.; Wu, J.; Huang, Z.; Zhou, C. Monitoring the Invasion of Spartina alterniflora from 1993 to 2014 with Landsat TM and SPOT 6 Satellite Data in Yueqing Bay, China. PLoS ONE 2015, 10, e0135538. [Google Scholar] [CrossRef]
  41. Wang, Q.; Duarte, C.; Song, L.; Christakos, G.; Agusti, S.; Wu, J. Effects of Ecological Restoration Using Non-Native Mangrove Kandelia obovata to Replace Invasive Spartina alterniflora on Intertidal Macrobenthos Community in Maoyan Island (Zhejiang, China). J. Mar. Sci. Eng. 2021, 9, 788. [Google Scholar] [CrossRef]
  42. Fu, H. The Surface Elevation Changes of Mangrove Forests in China and Impacts of Sea-Level Rise on Mangrove Forests. Ph.D. Thesis, Xiamen University, Xiamen, China, 2019. (In Chinese). [Google Scholar]
  43. Lai, H. Study on the Growth Characteristics of Kandelia candel in Yanpu Bay and Its Relationship with Sediments. Master’s Thesis, Zhejiang Ocean University, Zhoushan, China, 2021. (In Chinese). [Google Scholar]
  44. Wang, J.; Zhang, J.; Xiong, N.; Liang, B.; Wang, Z.; Cressey, E. Spatial and Temporal Variation, Simulation and Prediction of Land Use in Ecological Conservation Area of Western Beijing. Remote Sens. 2022, 14, 1452. [Google Scholar] [CrossRef]
  45. Fu, H.; Tao, Y.; Wang, W. Some issues about the impacts of sea level rise on mangroves in China. Chin. J. Ecol. 2014, 33, 2842–2848. (In Chinese) [Google Scholar] [CrossRef]
  46. Gao, G.F.; Li, P.F.; Shen, Z.J.; Qin, Y.Y.; Zhang, X.M.; Ghoto, K.; Zhu, X.Y.; Zheng, H.L. Exotic Spartina alterniflora invasion increases CH4 while reduces CO2 emissions from mangrove wetland soils in southeastern China. Sci. Rep. 2018, 8, 9243. [Google Scholar] [CrossRef] [PubMed]
  47. Wang, W.; Sardans, J.; Wang, C.; Zeng, C.; Tong, C.; Chen, G.; Huang, J.; Pan, H.; Peguero, G.; Vallicrosa, H.; et al. The response of stocks of C, N, and P to plant invasion in the coastal wetlands of China. Glob. Chang. Biol. 2019, 25, 733–743. [Google Scholar] [CrossRef]
  48. Chen, J. To Exploiting Lower Tidal Flats for Expending Living Space of China. Strateg. Study CAE 2000, 2, 27–31. (In Chinese) [Google Scholar]
  49. Chen, L.; Zheng, W.; Yang, S.; Wang, W.; Zhang, Y. Research Progresses of Mangrove Cold-tolerant Classes and Seral Classes, and Their Responses to Climate Change. J. Xiamen Univ. 2017, 56, 305–313. (In Chinese) [Google Scholar]
  50. Kirwan, M.L.; Megonigal, J.P. Tidal wetland stability in the face of human impacts and sea-level rise. Nature 2013, 504, 53–60. [Google Scholar] [CrossRef]
  51. Mentaschi, L.; Vousdoukas, M.I.; Pekel, J.-F.; Voukouvalas, E.; Feyen, L. Global long-term observations of coastal erosion and accretion. Sci. Rep. 2018, 8, 12876. [Google Scholar] [CrossRef]
  52. Goldberg, L.; Lagomasino, D.; Thomas, N.; Fatoyinbo, T. Global declines in human-driven mangrove loss. Glob. Chang. Biol. 2020, 26, 5844–5855. [Google Scholar] [CrossRef]
  53. Dan, X.; Liao, B.; Wu, Z.; Wu, H.; Bao, D.; Dan, W.; Liu, S. Resources, Conservation Status and Main Threats of Mangrove Wetlands in China. Ecol. Environ. Sci. 2016, 25, 1237–1243. (In Chinese) [Google Scholar] [CrossRef]
  54. Yu, L.; Lin, S.; Jiao, X.; Shen, X.; Li, R. Ecological Problems and Protection Countermeasures of Mangrove Wetland in Guangdong-Hong Kong-Macao Greater Bay Area. Acta Sci. Nat. Univ. Pekin. 2019, 55, 782–790. (In Chinese) [Google Scholar] [CrossRef]
  55. Prado, P.; Alcaraz, C.; Benito, X.; Caiola, N.; Ibanez, C. Pristine vs. human-altered Ebro Delta habitats display contrasting resilience to RSLR. Sci. Total Environ. 2019, 655, 1376–1386. [Google Scholar] [CrossRef]
  56. Zhi, L.H.; Gou, M.Z.; Li, X.W.; Bai, J.H.; Cui, B.S.; Zhang, Q.Y.; Wang, G.J.; Bilal, H.; Abdullahi, U. Effects of Sea Level Rise on Land Use and Ecosystem Services in the Liaohe Delta. Water 2022, 14, 841. [Google Scholar] [CrossRef]
Figure 1. Workflow of the approach followed for this study.
Forests 14 00831 g001
Figure 2. Location of the study area.
Forests 14 00831 g002
Figure 3. Dynamic changes in coastal China under 4 SLR scenarios. (e): the mangrove distribution areas at different scenarios. (f) the tidal swamp distribution areas at different scenarios.
Forests 14 00831 g003
Figure 4. S. alterniflora changes by regions. The color of the line indicates different regions (Shandong, Jiangsu, Shanghai, Zhejiang, Fujian, Guangdong, Guangxi), (a) SSP1-2.6, (b) SSP2-4.5, (c) SSP3-7.0, (d) SSP4-8.5.
Forests 14 00831 g004
Figure 5. Mangrove changes by regions. The color of the line indicates different regions (Ze jiang, Fujian, Guangdong, Guangxi). (a) SSP1-2.6, (b) SSP2-4.5, (c) SSP3-7.0, (d) SSP4-8.5.
Forests 14 00831 g005
Figure 6. Mangrove changes in Guangxi in SSP5-8.5.
Forests 14 00831 g006
Figure 7. Land use transfers highlighting developed dry land: Guangxi in SSP2-4.5.
Forests 14 00831 g007
Table 1. Description of the study areas with their equivalent SLAMM categories.
CodeSLAMM CategoryDescription
1Developed Dry LandSLAMM assumes developed land will be defended against sea level rise. Category 1 needs to be distinguished manually.
9MangroveEstuarine intertidal forested and scrub–shrub; broad-leaved evergreen
11Tidal FlatEstuarine intertidal unconsolidated shore (mud or organic) and aquatic bed; marine intertidal aquatic bed
17Estuarine Open WaterEstuarine subtidal
19Open OceanMarine subtidal and marine intertidal aquatic bed and reef
23Tidal SwampTidally influenced swamp
Table 2. Input parameters required for SLAMM.
DescriptionShandongJiangsuShanghaiZhejiangFujianGuangdongGuangxi
National Wetlands Inventory Photo Date (YYYY)2015
DEM Date (YYYY)2015
Historic Trend (mm/year)3
GT Great Diurnal Tide Range (m)1.25 [35]2.5 [35]2.8 [36]4.68 [37,38]2.65 [39]1.95 [39]2.2 [39]
Mangrove Accretion (mm/ year) 12.4 [40]56.5 [39]13.8 [39]6.7 [39]
Tidal Swamp Accretion (mm/ year)7.2 [35]
Table 3. The projected sea level rise under different shared socioeconomic pathway scenarios during 2030–2050 with a baseline of 1995–2014.
Year/SLR (m) SSP1-2.6 SSP2-4.5 SSP3-7.0 SSP5-8.5
2030 0.09 0.09 0.1 0.1
2050 0.19 0.21 0.22 0.23
2090 0.39 0.48 0.56 0.64
2100 0.44 0.56 0.68 0.77
Table 4. S. alterniflora changes by regions compared with the year 2015.
(a) S. alterniflora changes by regions compared with the year 2015 under SSP3-7.0.
SSP3-7.0ShandongJiangsuShanghaiZhejiangFujianGuangdongGuangxi
208036.56%10.18%0.00%21.36%11.79%16.04%32.15%
209036.61%10.22%37.22%21.45%11.84%16.17%32.26%
210036.81%10.37%37.27%21.79%12.05%16.68%32.68%
(b) S. alterniflora changes by regions compared with the year 2015 under SSP5-8.5.
SSP5-8.5ShandongJiangsuShanghaiZhejiangFujianGuangdongGuangxi
206036.57%10.19%0.00%21.42%11.80%16.05%32.16%
207036.68%10.27%37.22%21.63%11.92%16.36%32.43%
208036.85%10.39%37.35%21.86%12.07%16.75%32.69%
209037.08%10.56%37.52%22.27%12.31%17.32%32.95%
210037.45%10.76%37.78%22.65%12.56%17.87%33.63%
Disclaimer/Publisher’s Note: The statements, opinions and data contained in all publications are solely those of the individual author(s) and contributor(s) and not of MDPI and/or the editor(s). MDPI and/or the editor(s) disclaim responsibility for any injury to people or property resulting from any ideas, methods, instructions or products referred to in the content.

