Article

Effects of Seedling Size, Stock Type, and Mechanical Site Preparation Method on Initial Survival and Growth of Japanese Larch (Larix kaempferi) Seedlings

1
Forestry and Forest Products Research Institute, Matsunosato 1, Tsukuba 305-8687, Japan
2
Hokkaido Research Center, Forestry and Forest Products Research Institute, Hitsujigaoka 7, Toyohira-ku, Sapporo 062-8516, Japan
3
KITARIN Lab, 2-16-1101 Minami 13-jo Nishi 1-chome, Chuo-ku, Sapporo 064-0913, Japan
*
Author to whom correspondence should be addressed.
Forests 2023, 14(4), 784; https://doi.org/10.3390/f14040784
Submission received: 3 March 2023 / Revised: 30 March 2023 / Accepted: 7 April 2023 / Published: 11 April 2023
(This article belongs to the Special Issue Production in Forest Nurseries and Field Performance of Seedlings)

Abstract

:
It is important to understand the characteristics of Japanese larch (Larix kaempferi) seedlings that allow them to grow vigorously after planting and quickly exceed the height of surrounding vegetation, resulting in lower weeding costs. Seven stock types, including bareroot and container-grown seedlings, were planted in two plots with different mechanical-site-preparation (MSP) methods and evaluated for survival, height, and root collar diameter (RCD) for four consecutive years. Three-year-old bareroot seedlings, which were one year older and larger than normal, had low survival rates in the mulcher MSP. Initial seedling height significantly differed among the seven stock types, while almost no significant differences were observed after four growing seasons. Model analyses showed that initial seedling height and RCD had a significant effect on seedling height after planting until the second growing season, while the effect of planted seedling age and plot became increasingly significant after the third growing season. The difference in seedling type, bareroot versus container-grown seedlings, had no effect on the seedling height during the four growing seasons after planting. A decision tree analysis suggests that the seedlings with sufficiently large RCD and young age, regardless of seedling type, can grow taller than surrounding vegetation more quickly.

1. Introduction

Seedling quality is one of the most important factors in determining the success of afforestation [1,2,3,4]. Morphological traits, such as seedling height and root collar diameter (RCD), the root system, and the ratio of aboveground to belowground biomass allocation (i.e., top:root ratio), are associated with initial field performance of survival and growth after planting [1,2,5]. These traits can vary widely between the two typical seedling types, namely bareroot and container-grown seedlings, and can also be altered by the nursery practices in each seedling type [4,6,7,8].
Japanese larch (Larix kaempferi (Lamb.) Carrière) is an important forestry tree species in cool temperate regions of Japan [9,10]; it can have a rapid initial growth in the regions in Japan as well as in Europe and North America [11,12,13]. The planted area of Japanese larch in Japan has rapidly increased in recent years, from approximately 5000 ha year−1 from 2012 to 2017 to approximately 9000 ha year−1 in 2021, and the annual number of shipped planting seedlings has correspondingly increased from approximately 10 million to 16 million. Only bareroot seedlings were previously planted in Japan. However, with the aging and decreasing number of forestry workers and seedling producers, the production of container-grown seedlings started in 2012 in response to the expectation that container-grown seedlings will extend the planting period and reduce the labor required for seedling production, and the proportion of container-grown seedlings in planted seedlings has rapidly increased from 3% in 2018 to 19% in 2021. Container-grown seedlings are produced by dozens of relatively small nurseries, using a variety of cultivation methods. In Japanese larch, container-grown seedlings are smaller in size than bareroot seedlings, but they sell for 1.3 to 2 times the price. It has been reported that the small container-grown seedlings do not grow taller than bareroot seedlings after planting [14,15]. Some studies have recently been conducted on methods to produce high-quality container-grown seedlings; however, knowledge regarding what characteristics contribute to the effective performance of container-grown Japanese larch seedlings after planting is still insufficient [16,17,18,19].
The performance of the planted seedlings can also be influenced by the reforestation site conditions, such as soil moisture, nutrients, and light, as well as by competing vegetation [1,2]. Japanese larch has low shade tolerance and is therefore susceptible to significant loss of survival and growth, due to competition from surrounding vegetation [14,20]. Meanwhile, the vegetation growth is also influenced by site environmental conditions [21]. The influence of environmental conditions and vegetation growth on seedling performance must be considered when evaluating seedling quality based on the survival and growth in planting trials.
Mechanical site preparation (MSP) is a major technique for vegetation control in afforestation sites [22,23]. Vegetation in Japan grows intensively, with humid and warm temperatures during the growing season, often exceeding 200 cm in height in summer. The use of herbicides in forests is discouraged; thus, vegetation release with motor-manual brush cutters is typically performed yearly for four years after planting in Japanese larch plantations [24]. This method increases the cost of reforestation and is thus a major factor in the low reforestation rate, of approximately 30%, after harvest [25]. Site preparation is still typically performed manually mainly due to the steep slopes of many reforestation sites in Japan; however, MSP has been increasingly applied to sites with gentle slopes in recent years in the expectation of inhibiting vegetation growth and thus reducing vegetation release costs [26].
Excavators with a 0.5 m3 bucket are the most commonly used machines for MSP in Japan. The bucket is typically used to pile up logging residues at the edge of the reforestation area by dragging and pushing them with the claws of the bucket and scraping the topsoil to remove vegetation by the roots throughout the reforestation area. Oya et al. (2021) found that bucket MSP was more effective in suppressing vegetation and reducing the number of weeding years than manual site preparation. However, surface soil removal by bucket MSP negatively affected the height growth of planted Japanese larch and Japanese cedar (Cryptomeria japonica) seedlings, probably due to reduced soil nutrients [26]. Meanwhile, the use of excavators with forestry mulchers has been tested in recent years for reforestation in logging areas by forest harvester machines, which generate large amounts of logging residue [27]. The mulcher shreds the vegetation and logging residues of branches and stumps through a fixed blade attached to a high-speed rotating drum, and the shredded debris mulches the ground surface, potentially inhibiting vegetation development as much as, or more than, the bucket MSP [28]. The mulcher MSP slightly disturbs the soil; thus, this mulcher is expected to have less of the negative effect on tree growth [29] observed with the bucket MSP. However, its effect on the growth of planted seedlings has only been partially elucidated.
Here, a total of seven stock types, container-grown Japanese larch seedlings from five nurseries and two types of bareroot seedlings from another nursery using their own growing practices, were planted in a bucket and mulcher MSP plot in a general reforestation site in Hokkaido, Japan. Their survival and growth were evaluated annually for four consecutive growing seasons. The objective of this study was to determine what characteristics allow planted seedlings, especially container-grown seedlings, to grow taller than the surrounding vegetation more quickly, thus reducing weeding costs, while considering the effects of plot factors, including MSP methods. Thus, the effects of planting seedling characteristics (such as initial height, initial RCD, seedling type (bareroot or container-grown), and seedling age) and plot (including MSP) on planting seedling height, were quantitatively evaluated using generalized linear mixed models and decision tree analysis.

2. Materials and Methods

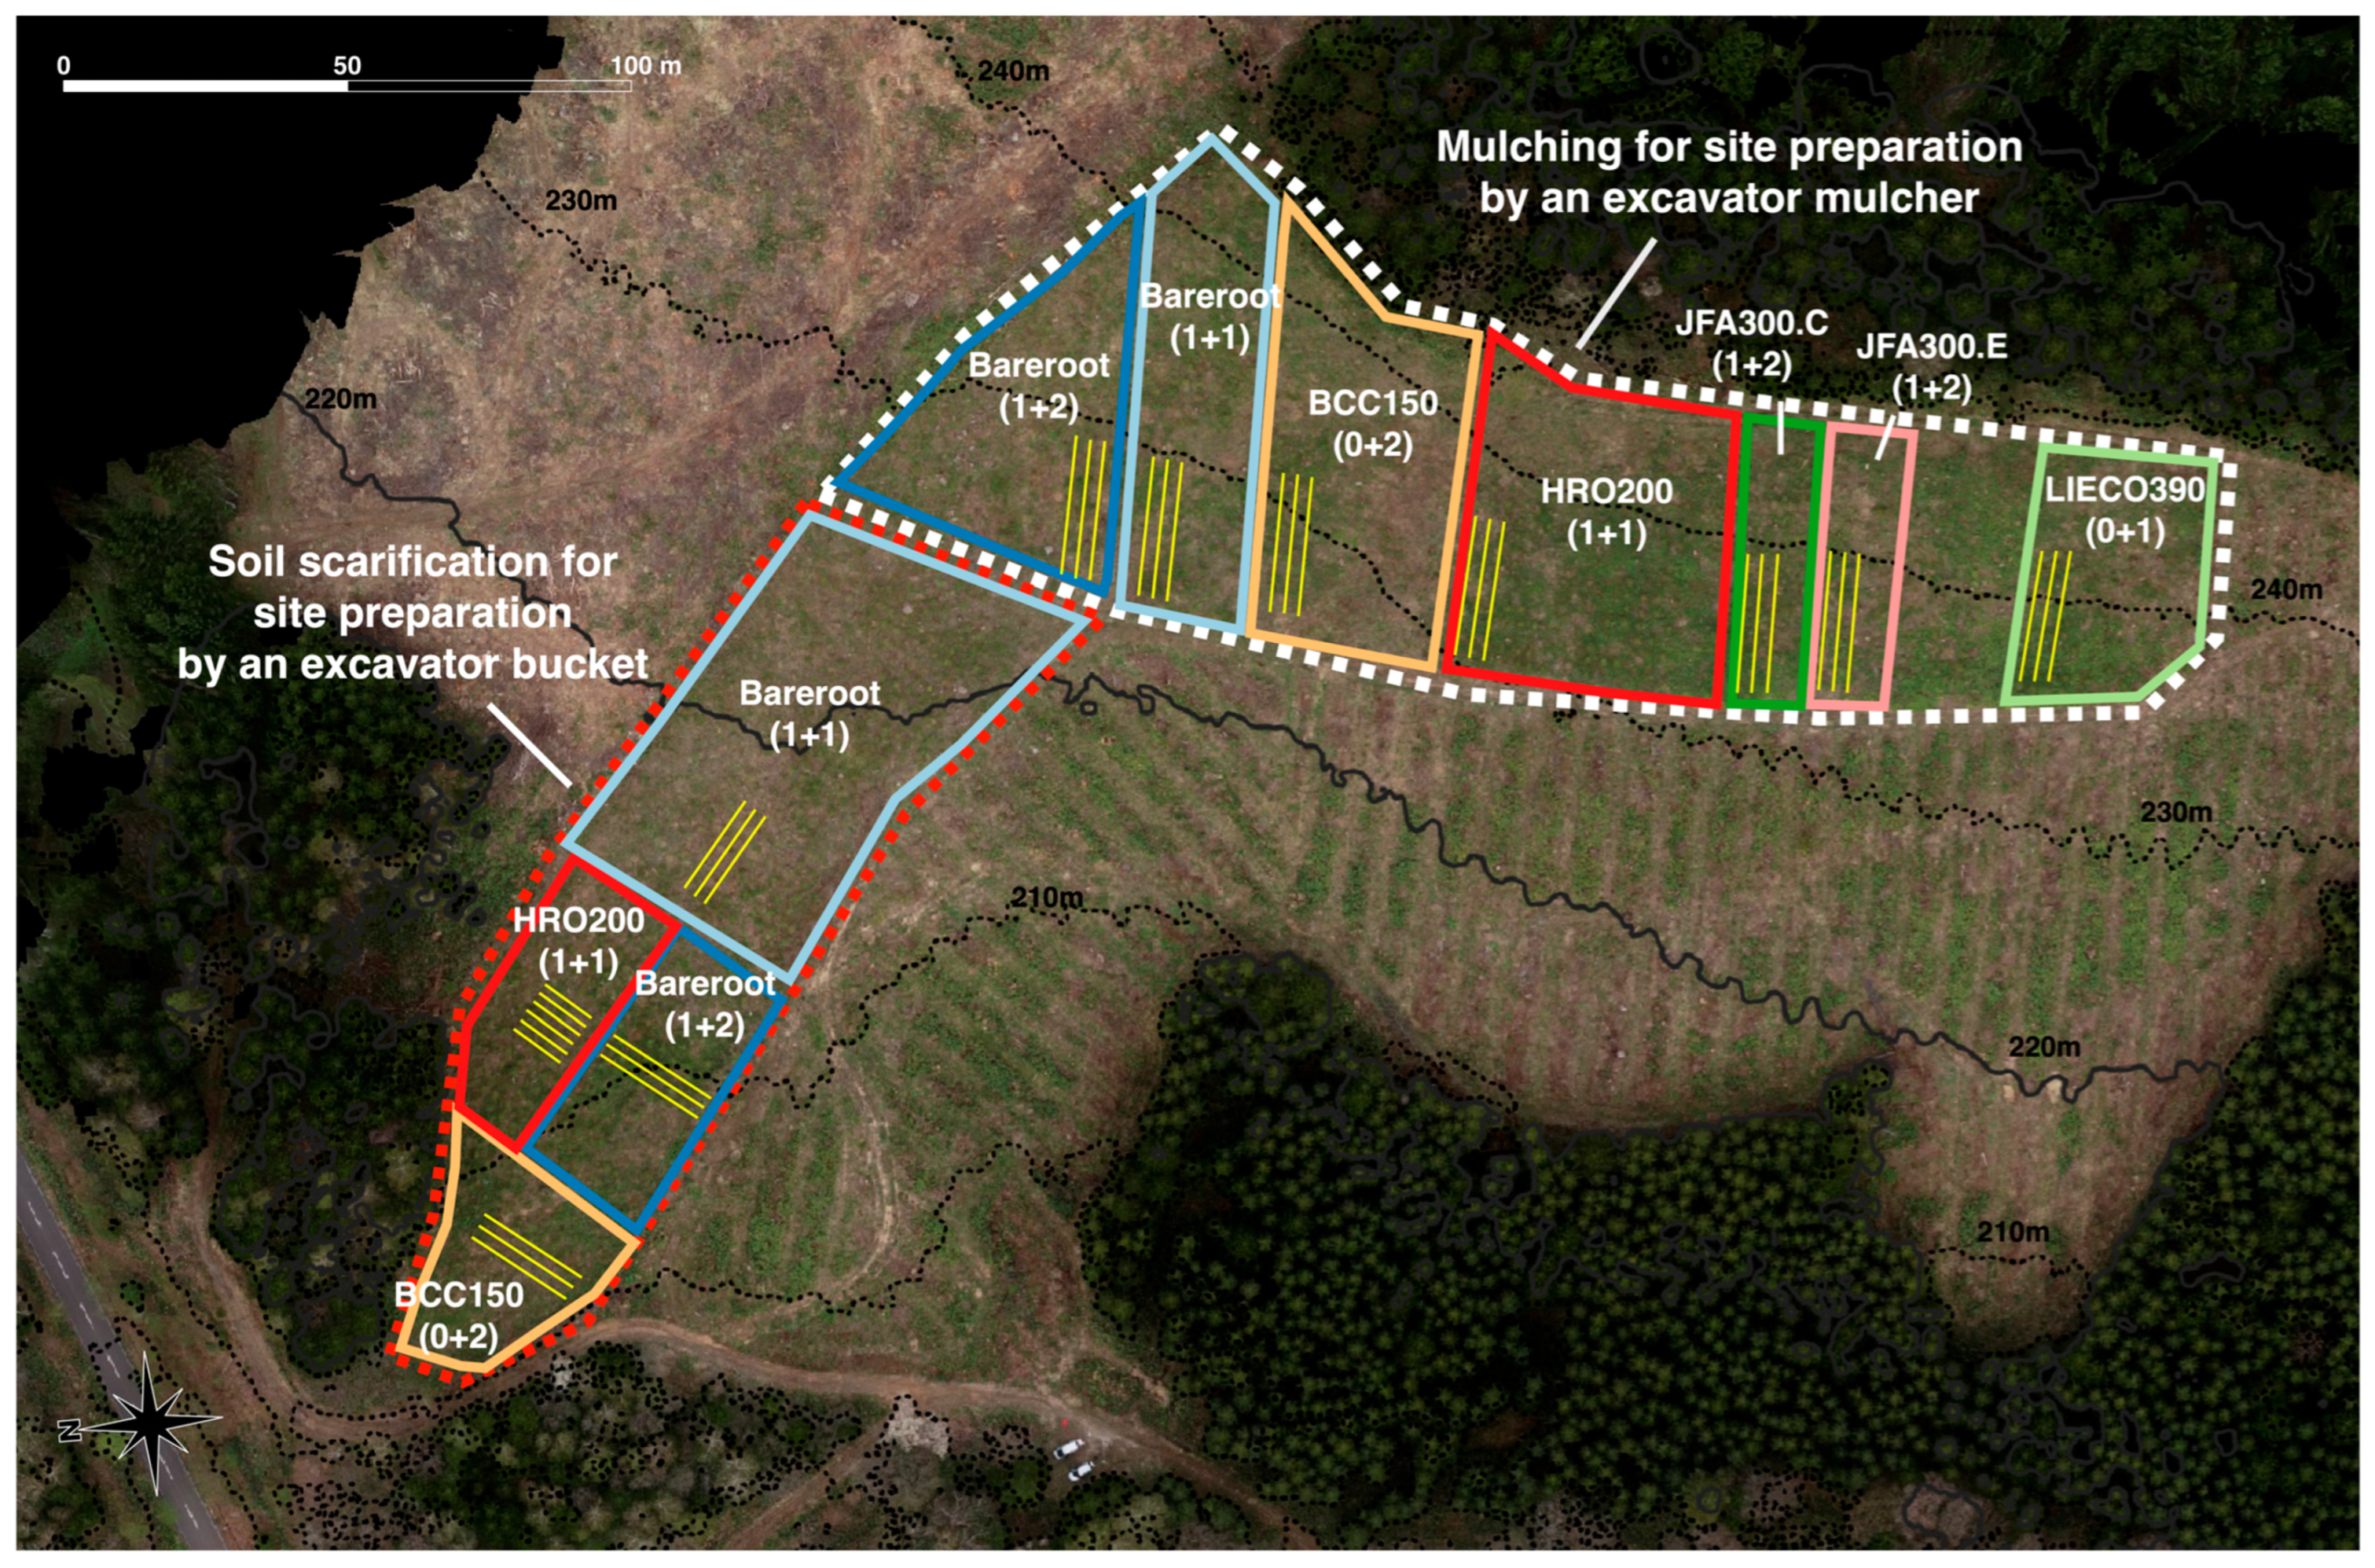
2.1. Study Site and Stock Types

The study site was located in a town-owned forest in Shimokawa Town, Hokkaido, northern Japan (44°18′ N, 142°41′ E, 200–240 m elevation). The 1991–2020 averages recorded at the nearest weather station (44°18′ N, 142°37′ E, 140 m elevation) approximately 3 km from the study site revealed the following: the annual mean air temperature was 5.4 °C, the monthly mean daily maximum and minimum air temperatures were 25.0 °C in August and −8.8 °C in January, the annual precipitation was 965 mm, and the deepest snowfall was 116 cm, in March.
In February 2017, 220 m3 ha−1 of timber from a 1.7 ha 50-year-old Abies sachalinensis plantation with snow cover was cleared and logged by harvesters and transported by forwarders. The slope of the site was relatively gentle, with an average slope angle of 10–16°. The site was divided into two plots, and MSP was conducted using a 0.5 m3-capacity excavator bucket (approximately 0.6 ha) and an excavator mulcher (approximately 1.1 ha), in early May 2017 after snowmelt (Figure 1). The mulcher MSP plot was located on the same slope at an elevation of approximately 225–240 m, while the bucket MSP plot was located on a lower slope at an elevation of 200–225 m. In the excavator bucket MSP (Figure S1A), the bucket was used to drag, push, and pile the logging residues, such as tree tops and branches, around the reforestation area and remove vegetation and scrape the soil surface (Figure S1B). In the MSP with the excavator mulcher (MINI-BMS 125, Seppi, Italy), the logging residues and vegetation were crushed by the mulching head (Figure S1C). The mulcher also shredded stumps that obstructed the path of the excavator. Consequently, 93% of the ground surface was mulched with crushed woody debris (Figure S1D), which ranged in height from 1 cm to 13 cm (mean 5 cm ± 1 cm standard error, median 1–2 cm) throughout the mulcher MSP plot [30]. Due to site and forest-management constraints, it was not possible to place the two MSP plots on the same slope or to establish replications.
After the MSP, seedlings of seven stock types were planted in the mulcher MSP plot, and four of the seven stock types were planted in the bucket MSP plot at 2.58 m spacing (1503 seedlings ha−1). The number of prepared seedlings varied widely among the stock types; thus, five of the seven stock types with low seedling numbers were not planted in the bucket MSP plot (Figure 1 and Table 1). Of the seven stock types, two were two-year-old (bareroot (1+1)) and three-year-old (bareroot (1+2)) bareroot seedlings from a single nursery in central Hokkaido. The five remaining stock types were container-grown seedlings varying in seedling age, container type (volume, density, and with/without side slits), and nursery (Table 1).
LIECO 390 (0+1) was sown directly into LIECO 15 blue containers (LIECO GmbH & Co KG, Kalwang, Austria) with a cell volume of 390 mL and density of 198 cells m−2 filled with peat-moss-based growing media, and grown in containers for one year by a nursery in western Hokkaido. JFA300.C (1+2) and JFA300.E (1+2) were grown by a nursery in central and eastern Hokkaido, respectively, in JFA300 containers (Zenbyouren, Tokyo, Japan) of 300 mL volume and 178 cells m−2 density. Seedlings grown in a field for one year after sowing were transplanted to JFA300 containers and grown in these containers for two years. HRO200 (1+1) was grown by a nursery in northeastern Hokkaido in HRO200 containers (Dobyouso, Hokkaido, Japan) with a volume of 200 mL and a density of 112 cells m−2. Seedlings were also grown in the field for one year after sowing, and then transplanted and grown in HRO200 containers for one year. BCC150 (0+2) was grown by a nursery in northern Hokkaido in a 150 mL capacity BCC SideSlit Cell 150 container (BCC, Landskrona, Sweden) at a density of 362 cells m−2 in FlexiFrame 77 (BCC, Landskrona, Sweden). Seedlings were transplanted into the container immediately after germination, and grown for two years. All containers used coconut-husk-based growing media except for LIECO 390 (0+1), which used peat-moss-based media. Containers other than JFA300 had side slits to prevent root rolling, while JFA300 had no side slits, but ribs on the inside of the cell wall. The label of the container-grown seedling indicated the product name and cell volume, followed by the two numbers in parentheses, which indicated the number of years grown in the field after sowing and in the container. Except for LIECO390 (0+1) and HRO200 (1+1), different seed lots were used to produce bareroot and container-grown seedlings (Table 1). Seed orchards are not well developed in Japan. Therefore, the seeds were collected from common plantations in each town, and were not genetically verified.

2.2. Measurement of the Dry Mass of the Planted Seedlings

Nine seedlings of each stock type were taken to the laboratory in plastic bags to prevent desiccation. The seedlings were then cut into stems, branches, leaves, and thick and fine roots based on 2 mm diameter, dried in a 70 °C oven to constant mass, and measured for dry mass (accuracy 1 mg). The top:root and top:fine root ratios were calculated by dividing the top mass (stems + branches) by the root mass (thick + fine roots) or by the fine root mass, respectively.

2.3. Field Measurement

In each stock type of each MSP plot, 3 adjacent rows with 10 planting seedlings each were selected, to investigate seedling survival and growth, except for HRO200 (1+1) in the bucket MSP plot, wherein 6 rows of 5 seedlings each were selected (n = 30 per stock type in each MSP plot, Figure 1). Seedling height (accuracy 1 cm) and RCD (accuracy 0.1 mm, the average of two cross-measurements) were measured at planting in mid-May 2017, after the first and second growing seasons (GS) in mid-October 2017 and 2018, and after the third and fourth GS in mid-May 2020 and 2021. Survival, animal damage, and miscutting during brush-cutter weeding (conducted in the summer of the second and third GS) were also recorded. Height:RCD ratio and annual (i.e., during one GS) growth of height and RCD were calculated. Relative growth rates (RGRs) of height and RCD during each of the first to fourth GS and for all the four GS after planting were calculated as follows [31]:
RGR = (ln(dimension after the GS) − ln(dimension before the GS))/GS,
where dimension was height or RCD and ln() was the natural logarithm.
Many seedlings in the study area suffered from feeding damage by wild voles, and died between the first and second GS during the winter of 2017–2018, increasing the difficulty in continuing the study with only the initially selected seedlings. Therefore, in order to be able to continuously compare average and annual growth, an additional 5–20 seedlings for each stock type were selected in each preparation area for seedlings close to the row to be measured at the end of the second GS, to facilitate the investigation of 21 or more seedlings per stock type per MSP method. Animal damage and miscutting also occurred during the other periods. Consequently, the number of seedlings for which growth could be calculated was 21–30, 4–26, 17–31, and 11–29 after the first, second, third, and fourth GS, respectively, per stock type in each MSP plot.

2.4. Statistical Analyses

All statistical analyses were performed using R (Version 4.1.2, Vienna, Austria) [32]. For the field measurement data, seedlings affected by animal damage or miscutting were excluded from analyses to assess intrinsic seedling growth potential.
Linear models (LMs) with Tukey–Kramer post hoc comparisons using the “glht” function from the “multcomp” package [33] were used to evaluate differences in organ dry mass (such as stem, branches, leaves, roots, and thick and fine roots) and organ allocation (such as top:root and top:fine-root ratios) among all stock types and among stock types of container-grown seedlings. The methods were also used to evaluate differences in seedling height, RCD, and height:RCD ratio at planting and after each first to fourth GS, annual height and RCD growth, and RGR of height and RCD during each first to fourth GS among four stock types in the bucket MSP plot and seven stock types in the mulcher MSP plot (i.e., a total of 11 treatments). A general linear model with binomial distribution and logit-link function followed by post hoc comparisons was used for survival after a GS among the total 11 treatments, using the “brglm2” [34] and “eemeans” [35] packages. The significance level for post hoc comparisons was set at α = 0.05.
To quantify the effect of seedling characteristics on post-planting seedling height, linear mixed models (LMMs) were constructed for surviving seedlings in both MSP plots, with height at the end of each first-through-fourth GS as the objective variable, seedling characteristics such as initial height, initial RCD, seedling type as bareroot or container-grown, and seedling age as explanatory variables, and plot as a random effect, using the “lmer” function of the “lme4” package [36]. In addition, to quantify the effects of seedling characteristics as well as plots with different MSP, LMMs were constructed for the data of four stock types (bareroot (1+1), bareroot (1+2), HRO200 (1+1), and BCC150 (0+2)) planted in both MSP plots, with seedling height after each growing season as the objective variable and seedling characteristics (initial height, initial RCD, and seedling type as bareroot or container-grown), as well as plot as explanatory variables. The individual was treated as a random effect to account for variance due to differences in the individuals and planting microsites for each study individual. All numeric explanatory variables were standardized to have a mean of 0 and standard deviation of 1, using the “scale” function to compare effects among explanatory variables. The contribution ratio of each explanatory variable was calculated in each model as the ratio of the absolute value of the coefficient of each explanatory variable to the sum of the absolute values of the coefficients of all explanatory variables. In Japan, the seedling buyer is typically provided with the information that was added to the explanatory variables in these model analyses, but is not provided with information about the type of container, growing medium, or seed source, which were not added to the explanatory variables.
Three years after planting, approximately half of the planted seedlings had exceeded 200 cm, which is the maximum height of competing vegetation. If the height of the planted seedlings rapidly exceeds that of the competing vegetation, subsequent weeding can be unnecessary, resulting in successful and less-costly reforestation. Therefore, a decision tree analysis was performed using the packages of “rpart” [37] and “rpart.plot” [38] to evaluate what seedling characteristics at planting and MSP methods would determine the probability of seedling height exceeding 200 cm after the third GS. The analysis used a binary variable, 1 for growth to 200 cm height after the third GS, and 0 for no growth, as the objective variable, with initial height, RCD, height:RCD ratio, seedling type (bareroot or container-grown), age of planted seedlings, and MSP method (bucket or mulcher) as explanatory variables.

3. Results

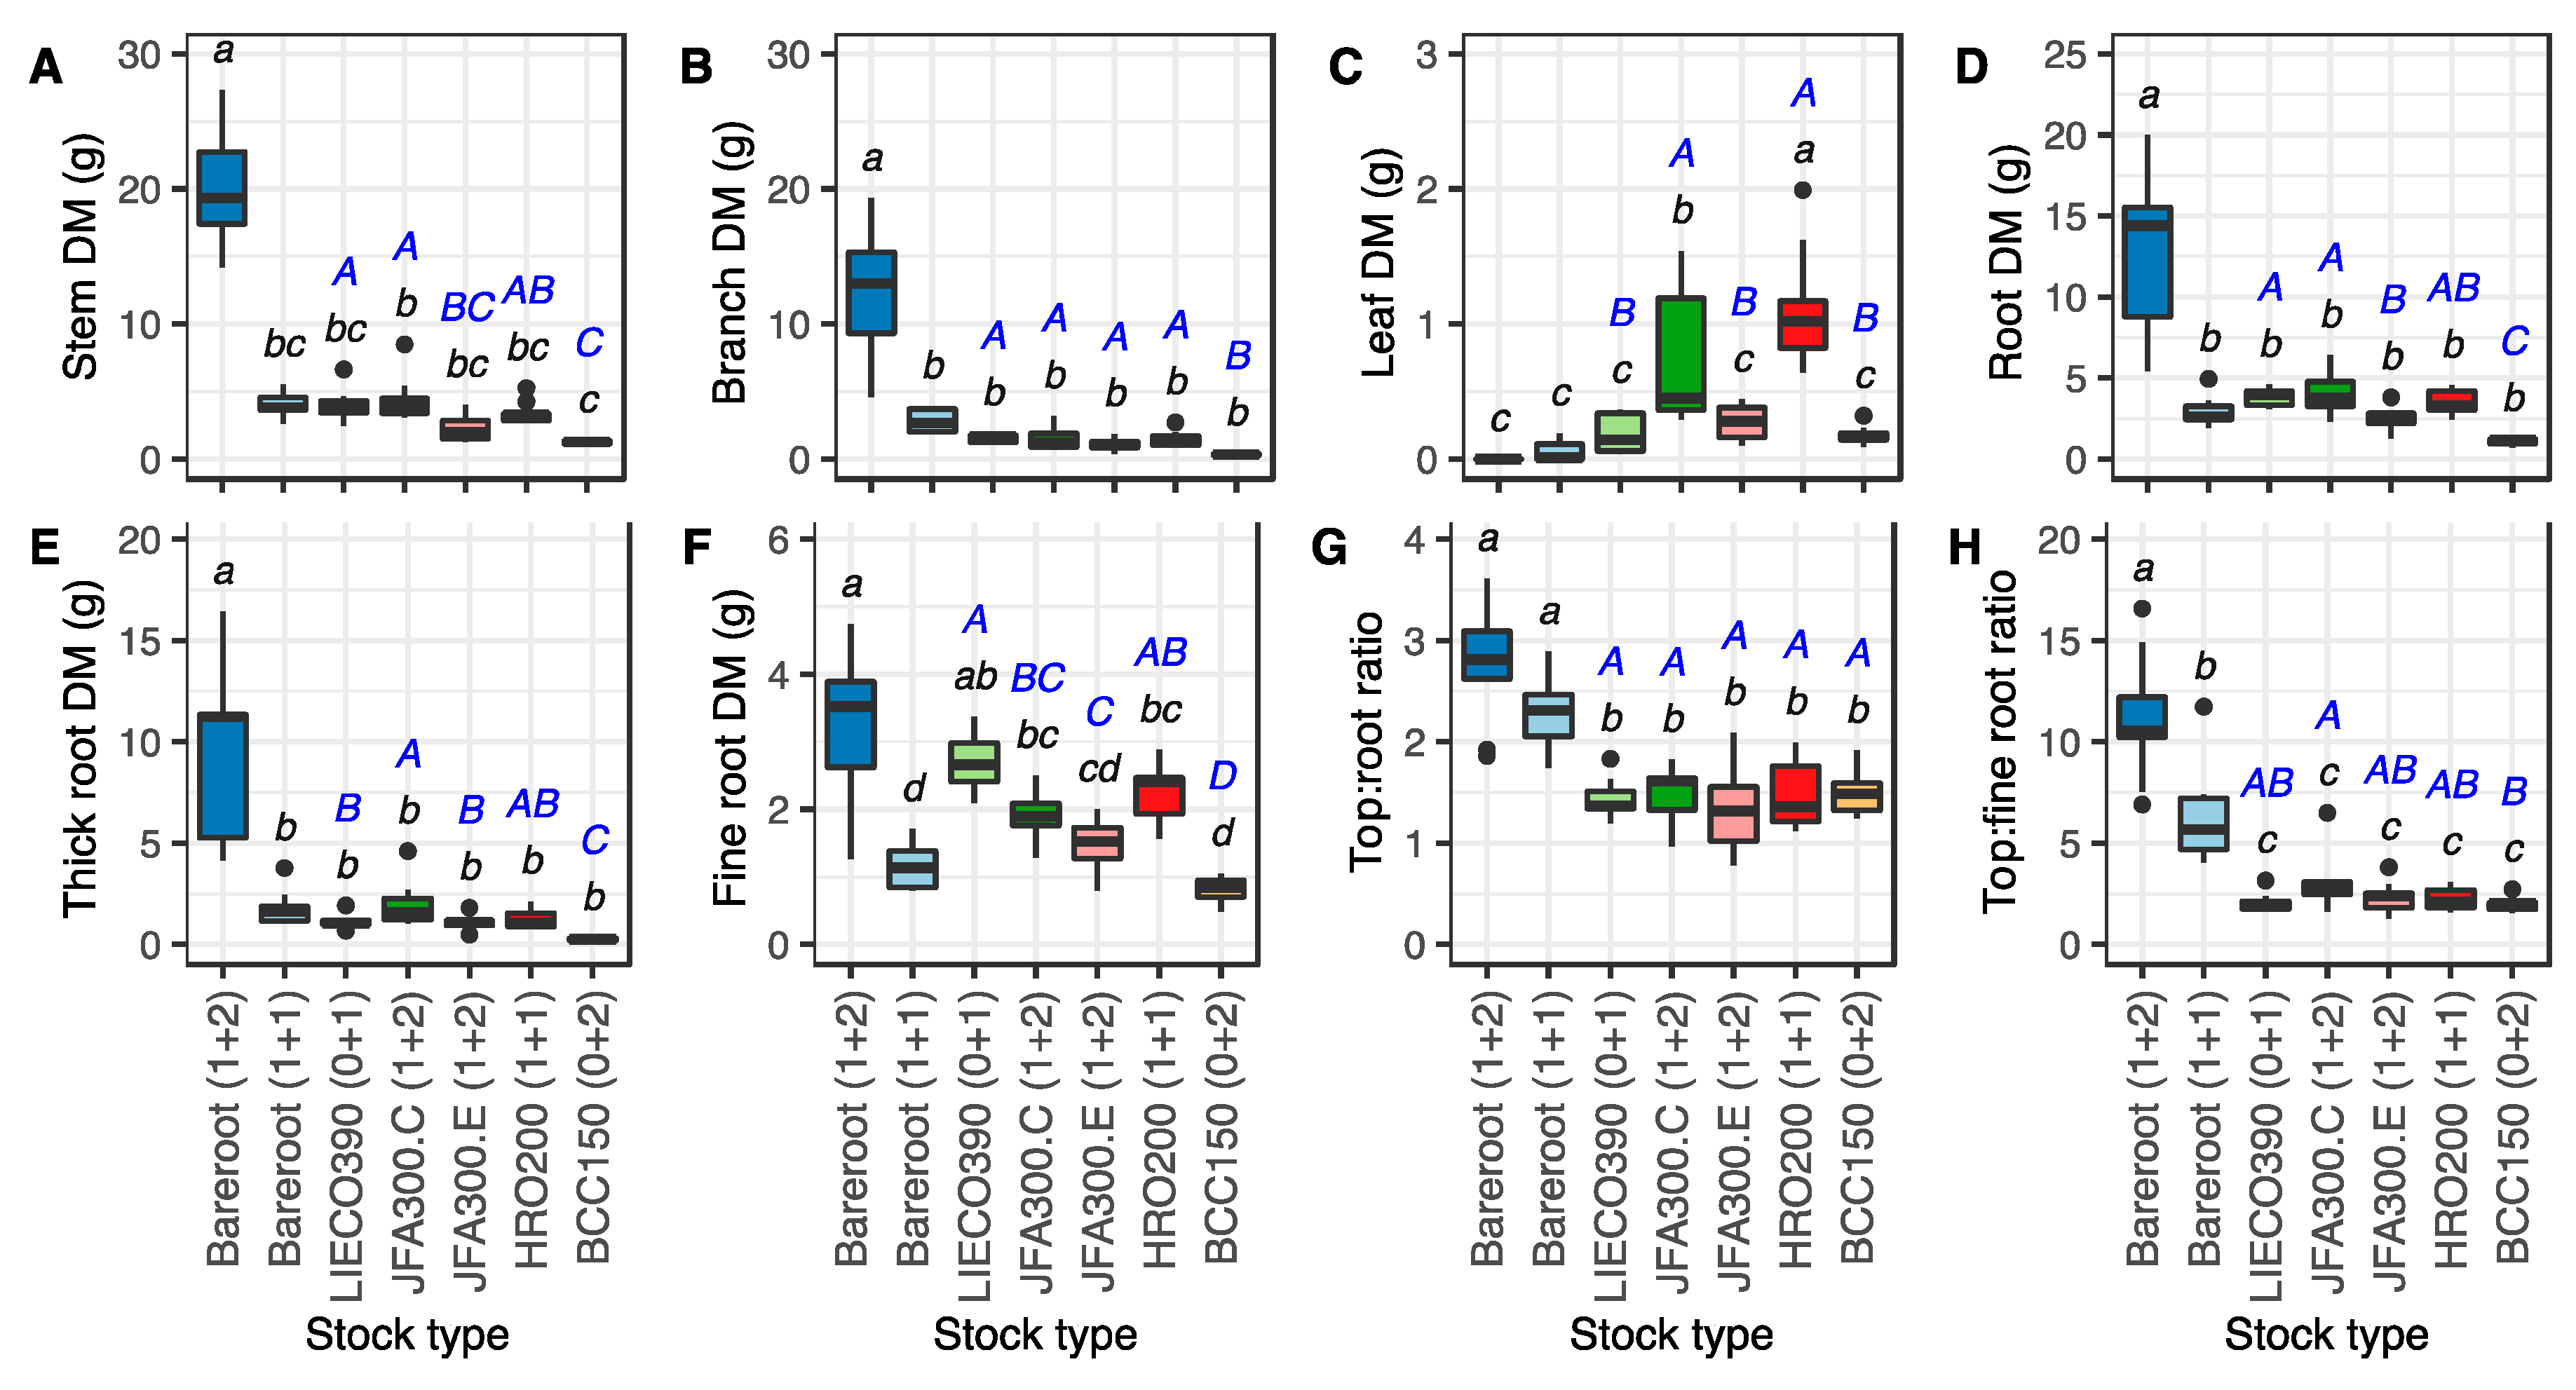
3.1. Dry Mass by Organ and Allocation for Seedlings of Each Stock Type

Bareroot (1+2) seedlings had significantly higher stem, branch, and total thick- and fine-root DM than other stock types (Figure 2A,B,D–F). Bareroot (1+1) seedlings were insignificantly different from all stock types of container-grown seedlings in stem, branch, and root DM. Top: root and top:fine-root ratios were lower in container-grown seedlings than in bareroot seedlings (Figure 2G,H). Comparisons among container-grown stock types showed that BCC150 (0+2) had significantly lower stem, branch, and root DM than the other stock types (Figure 2A,B,D–F). Stem and total and thick-root DM were significantly higher in JFA300.C (1+2) than in JFA300.E (1+2), despite being grown in the same container for the same number of growing years (Figure 2A,D,E). Dormant Japanese larch seedlings are normally planted before flushing, but JFA300.C (1+2) and HRO200 (1+1) seedlings were already flushed, and had leaves at planting (Figure 2C).

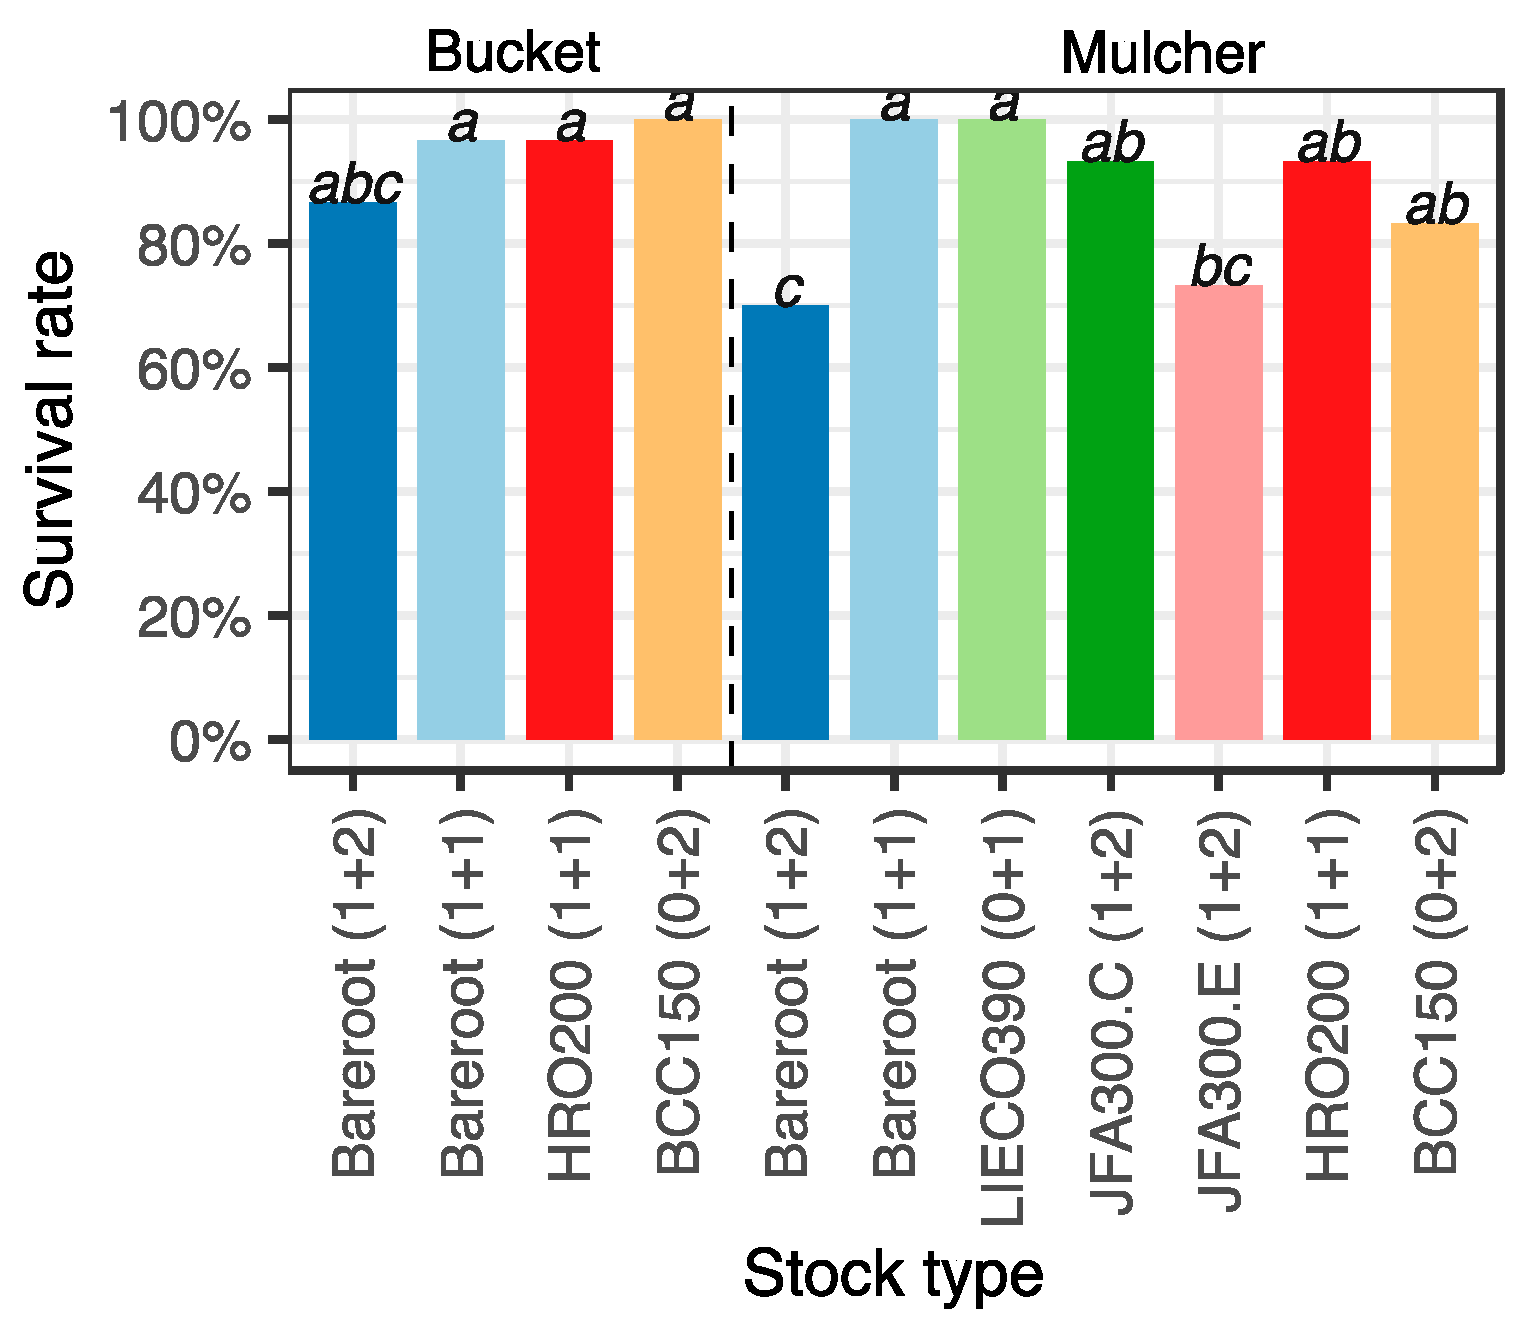
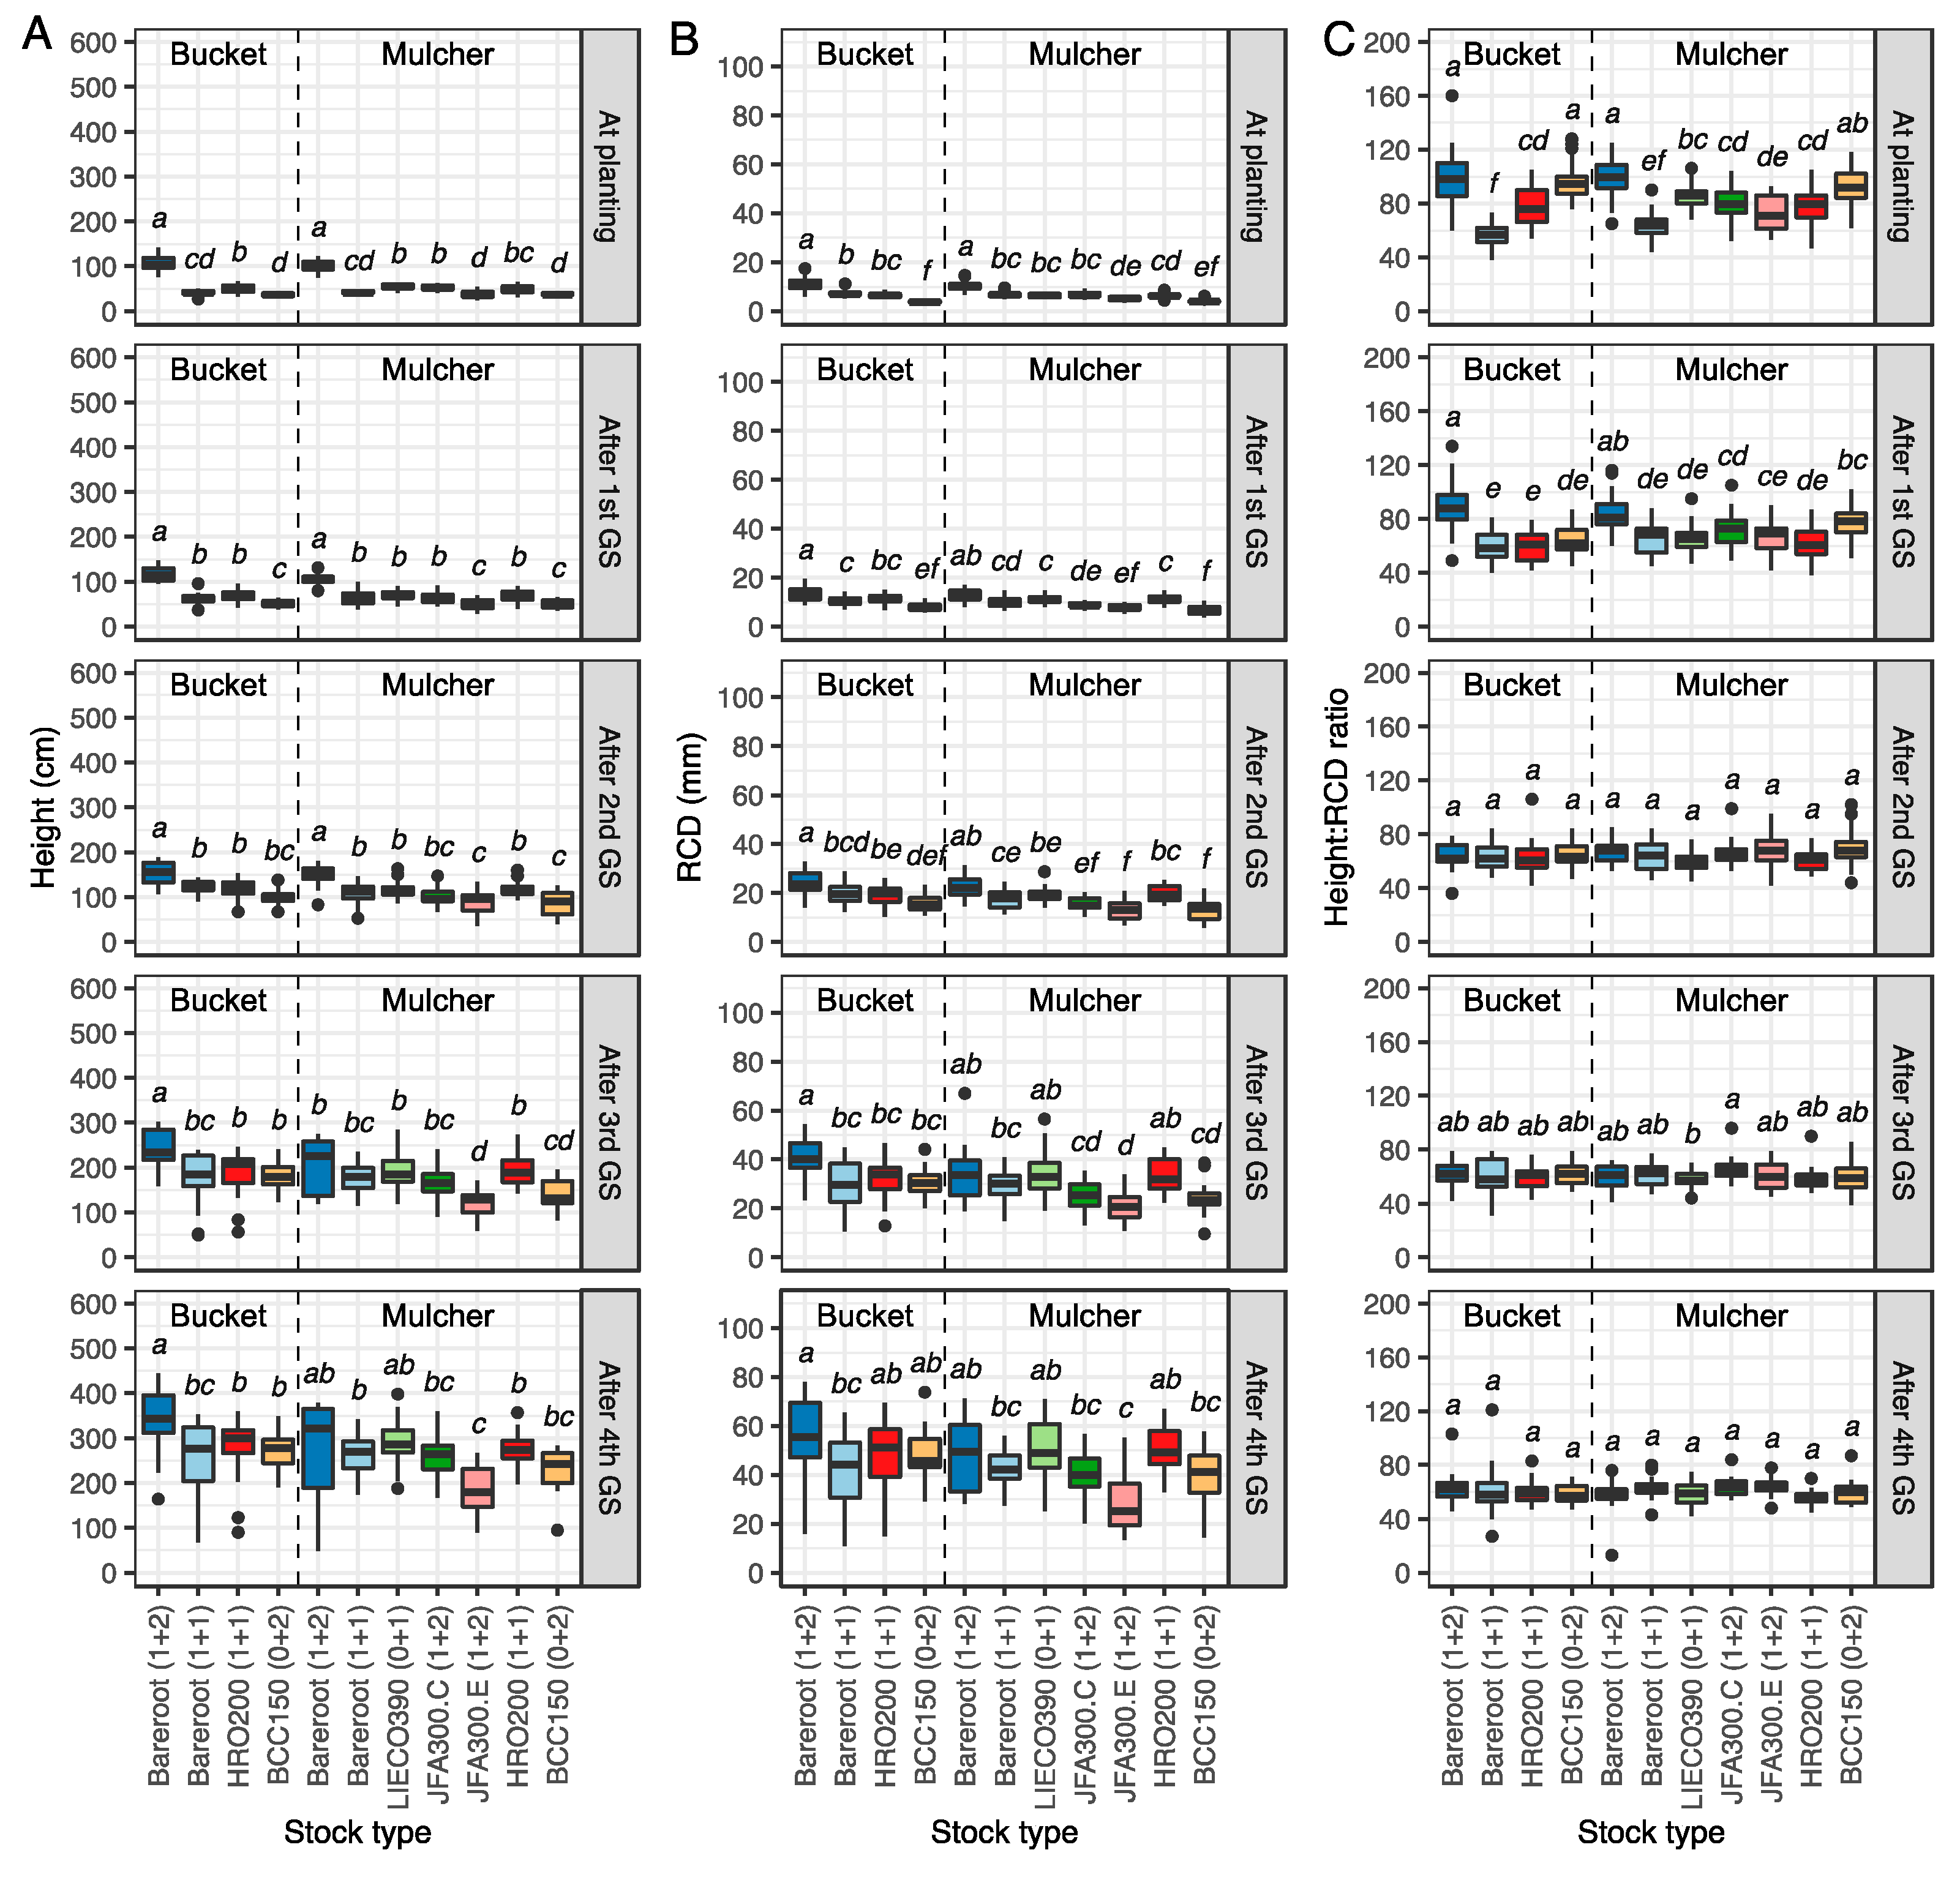
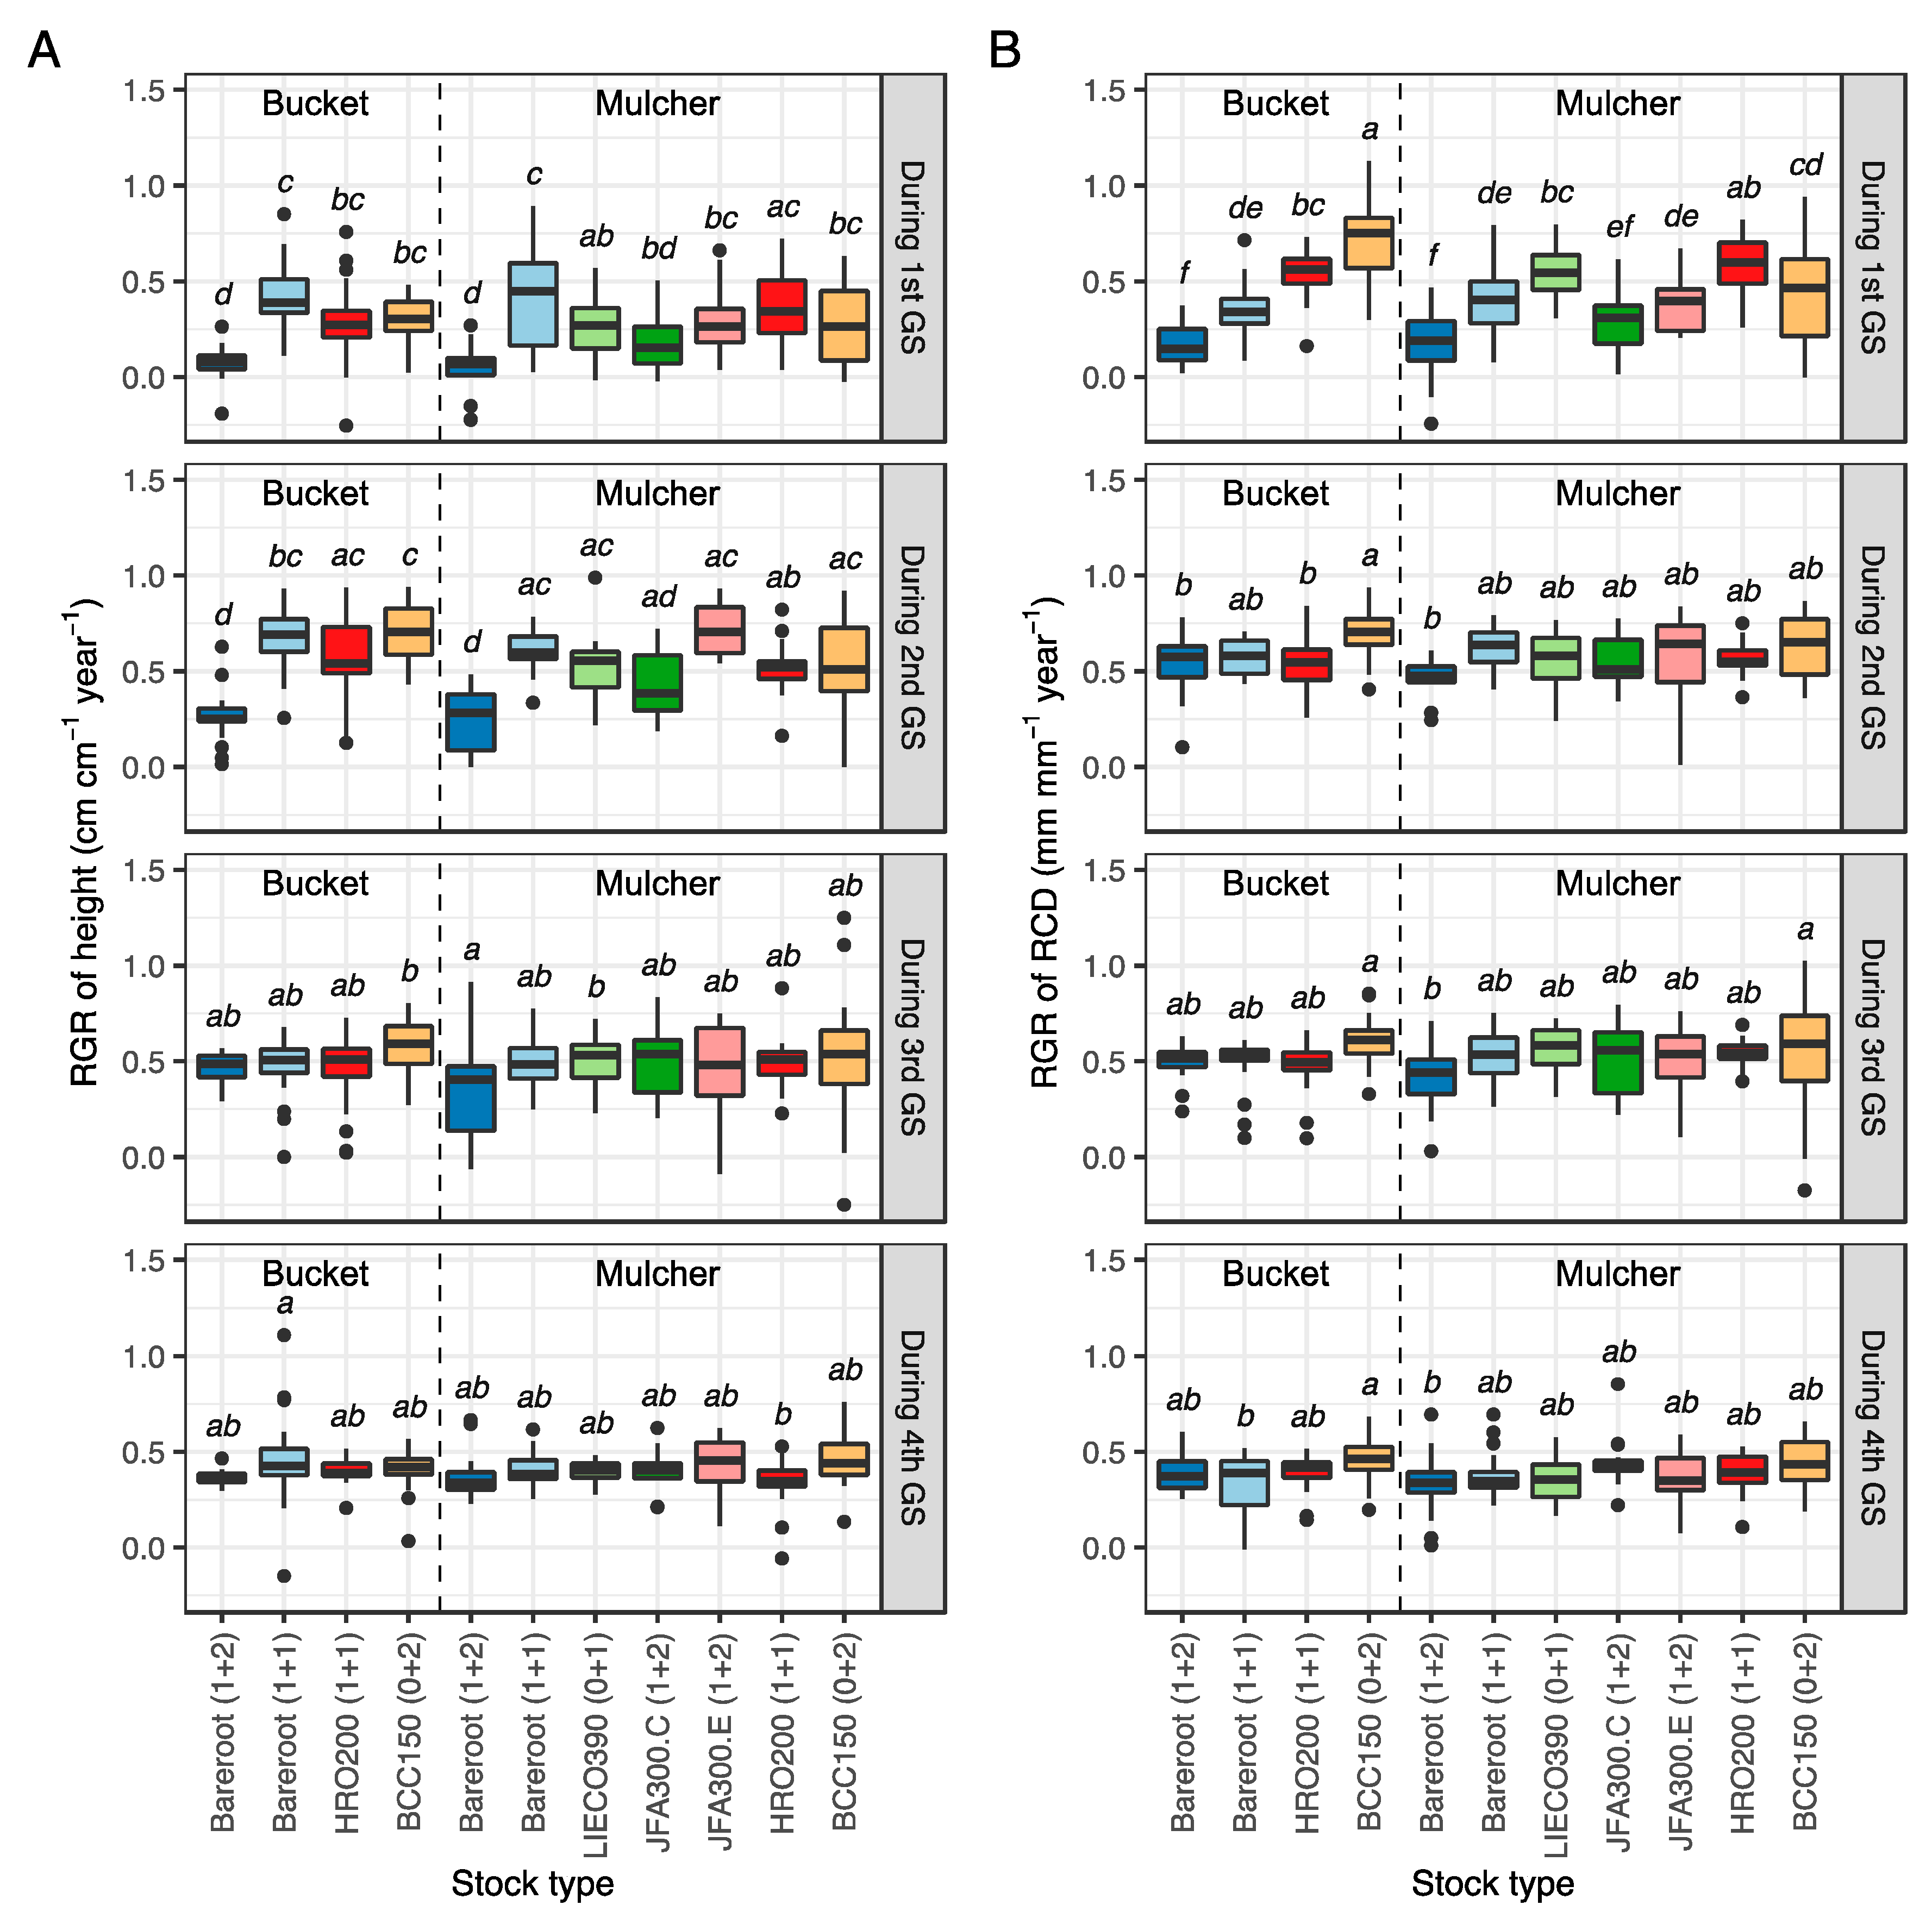
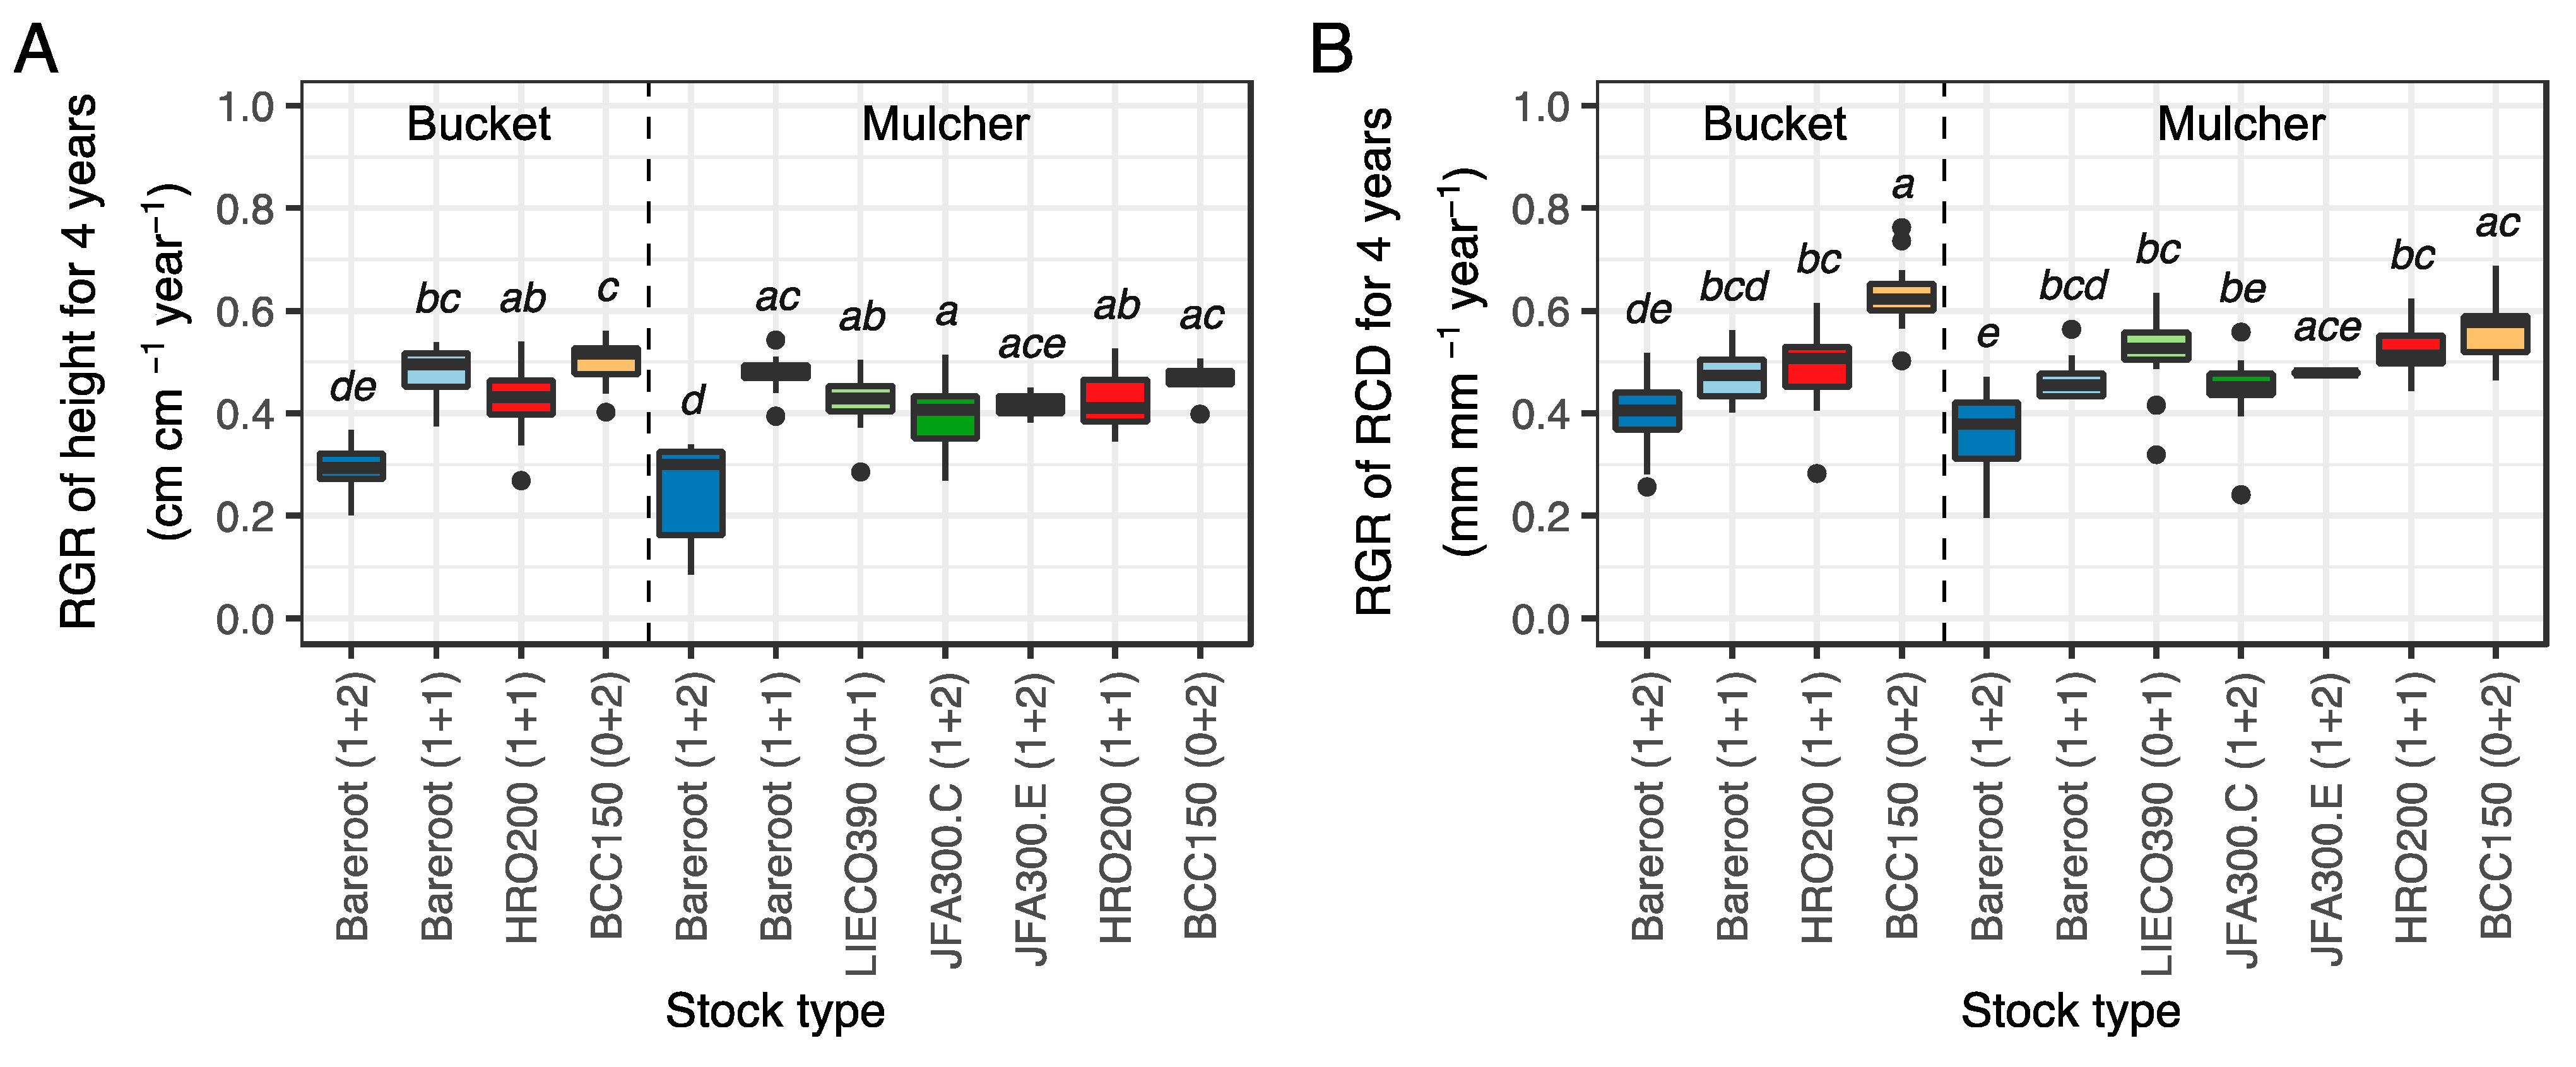
3.2. Survival and Growth of Each Stock Type

Survival rate after one GS from planting ranged from 70% to 100% among seedlings of stock type with bucket and mulcher MSP (Figure 3). Bareroot (1+2) and JFA300.E (1+2) seedlings in the mulcher plot showed low survival rates. Bareroot (1+1), HRO200 (1+1), and BCC150 (0+2) in the bucket plot and bareroot (1+2) and LIECO390 (0+1) in the mulcher plot demonstrated the highest survival rate.
Seedling height at planting was highest for bareroot (1+2) seedlings of 104 ± 15 cm (mean ± standard deviation), followed by LIECO390 (0+1), JFA300.C (1+2), and HRO200 (1+1), of 54 ± 7 cm, 53 ± 6 cm, and 49 ± 9 cm, respectively (Figure 4A). The lowest heights were reached by JFA300.E (1+2) and BCC150 (0+2) seedlings of 38 ± 8cm and 37 ± 3 cm, respectively. Bareroot (1+2) seedlings in the bucket plot were the tallest of the stock types in all four GSs, while JEA300.E (1+2) and BCC150 (0+2) seedlings in the mulcher plot were the lowest in all four GSs. LIECO390 (0+1) seedlings in the mulcher plot, which were the same height as many other container-grown stock-type seedlings at planting, became the tallest of the container-grown stock types after the fourth GS and were insignificantly different from bareroot (1+2) seedlings in the bucket plot.
At planting, bareroot (1+2) seedlings demonstrated the highest RCD of all stock types, and this trend continued throughout the four GSs, especially in the bucket plot (Figure 4B). BCC150 (0+2) had the smallest RCD of all stock types at planting. As the GS progressed, the difference in RCD of BCC150 (0+2) between the bucket and mulcher plots increased: BCC 150 (0+2) in the bucket plot had a high RCD, which was insignificantly different from that of the largest bareroot (1+2) seedlings after the fourth GS, while BCC 150 (0+2) in the mulcher plot was one of the stock types with a low RCD. JFA300.E (1+2) in the mulcher plot showed the lowest RCD among stock types after the fourth GS.
The height:RCD ratio was high, around 100 in bareroot (1+2) and BCC150 (0+2) seedlings, and low, around 60 in bareroot (1+1) seedlings, at planting (Figure 4C). After the second GS, the height:RCD ratio was around 60 for all stock types, demonstrating almost no significant differences among stock types after the second to fourth GS.
The RGRs of the height of the bareroot (1+2) seedlings in the bucket and mulcher MSP plot were the lowest of the stock types in the first growing season (Figure 5A). This trend continued in the second GS. For the other stock types, no significant differences were observed in the first and second GSs, except between bareroot (1+1) and LIECO390 (0+1) or JFA300.C (1+2) in the first growing season and between BCC150 (0+2) in the bucket plot and JFA300.C (1+2) in the mulcher plot in the second growing season. Almost no significant differences were observed during the third and fourth GS. There was no trend for JFA300.E (1+2), which had a low height until the four GS, to have a lower RGR of height. Bareroot (1+2) seedlings had the lowest annual RGR of RCD among the stock types during the first GS (Figure 5B). Almost no significant difference in the RGR of RCD was observed among the stock types during the second to fourth GS.
RGR for height growth during the first four years after planting was significantly lower for bareroot (1+2) than for the other stock types (Figure 6A). RGR of height tended to be higher for bareroot (1+1) in both MSP plots and BCC150 (0+2) in the bucket MSP plot, although few significant differences in RGR of height for four years were observed among the other stock types, due to the small number of individuals that could be measured for four consecutive years due to mortality from feeding damage. In the RGR of RCD for four years, bareroot (1+2) was also significantly lower than the other stock types, and BCC150 (0+2) was significantly higher (Figure 6B).

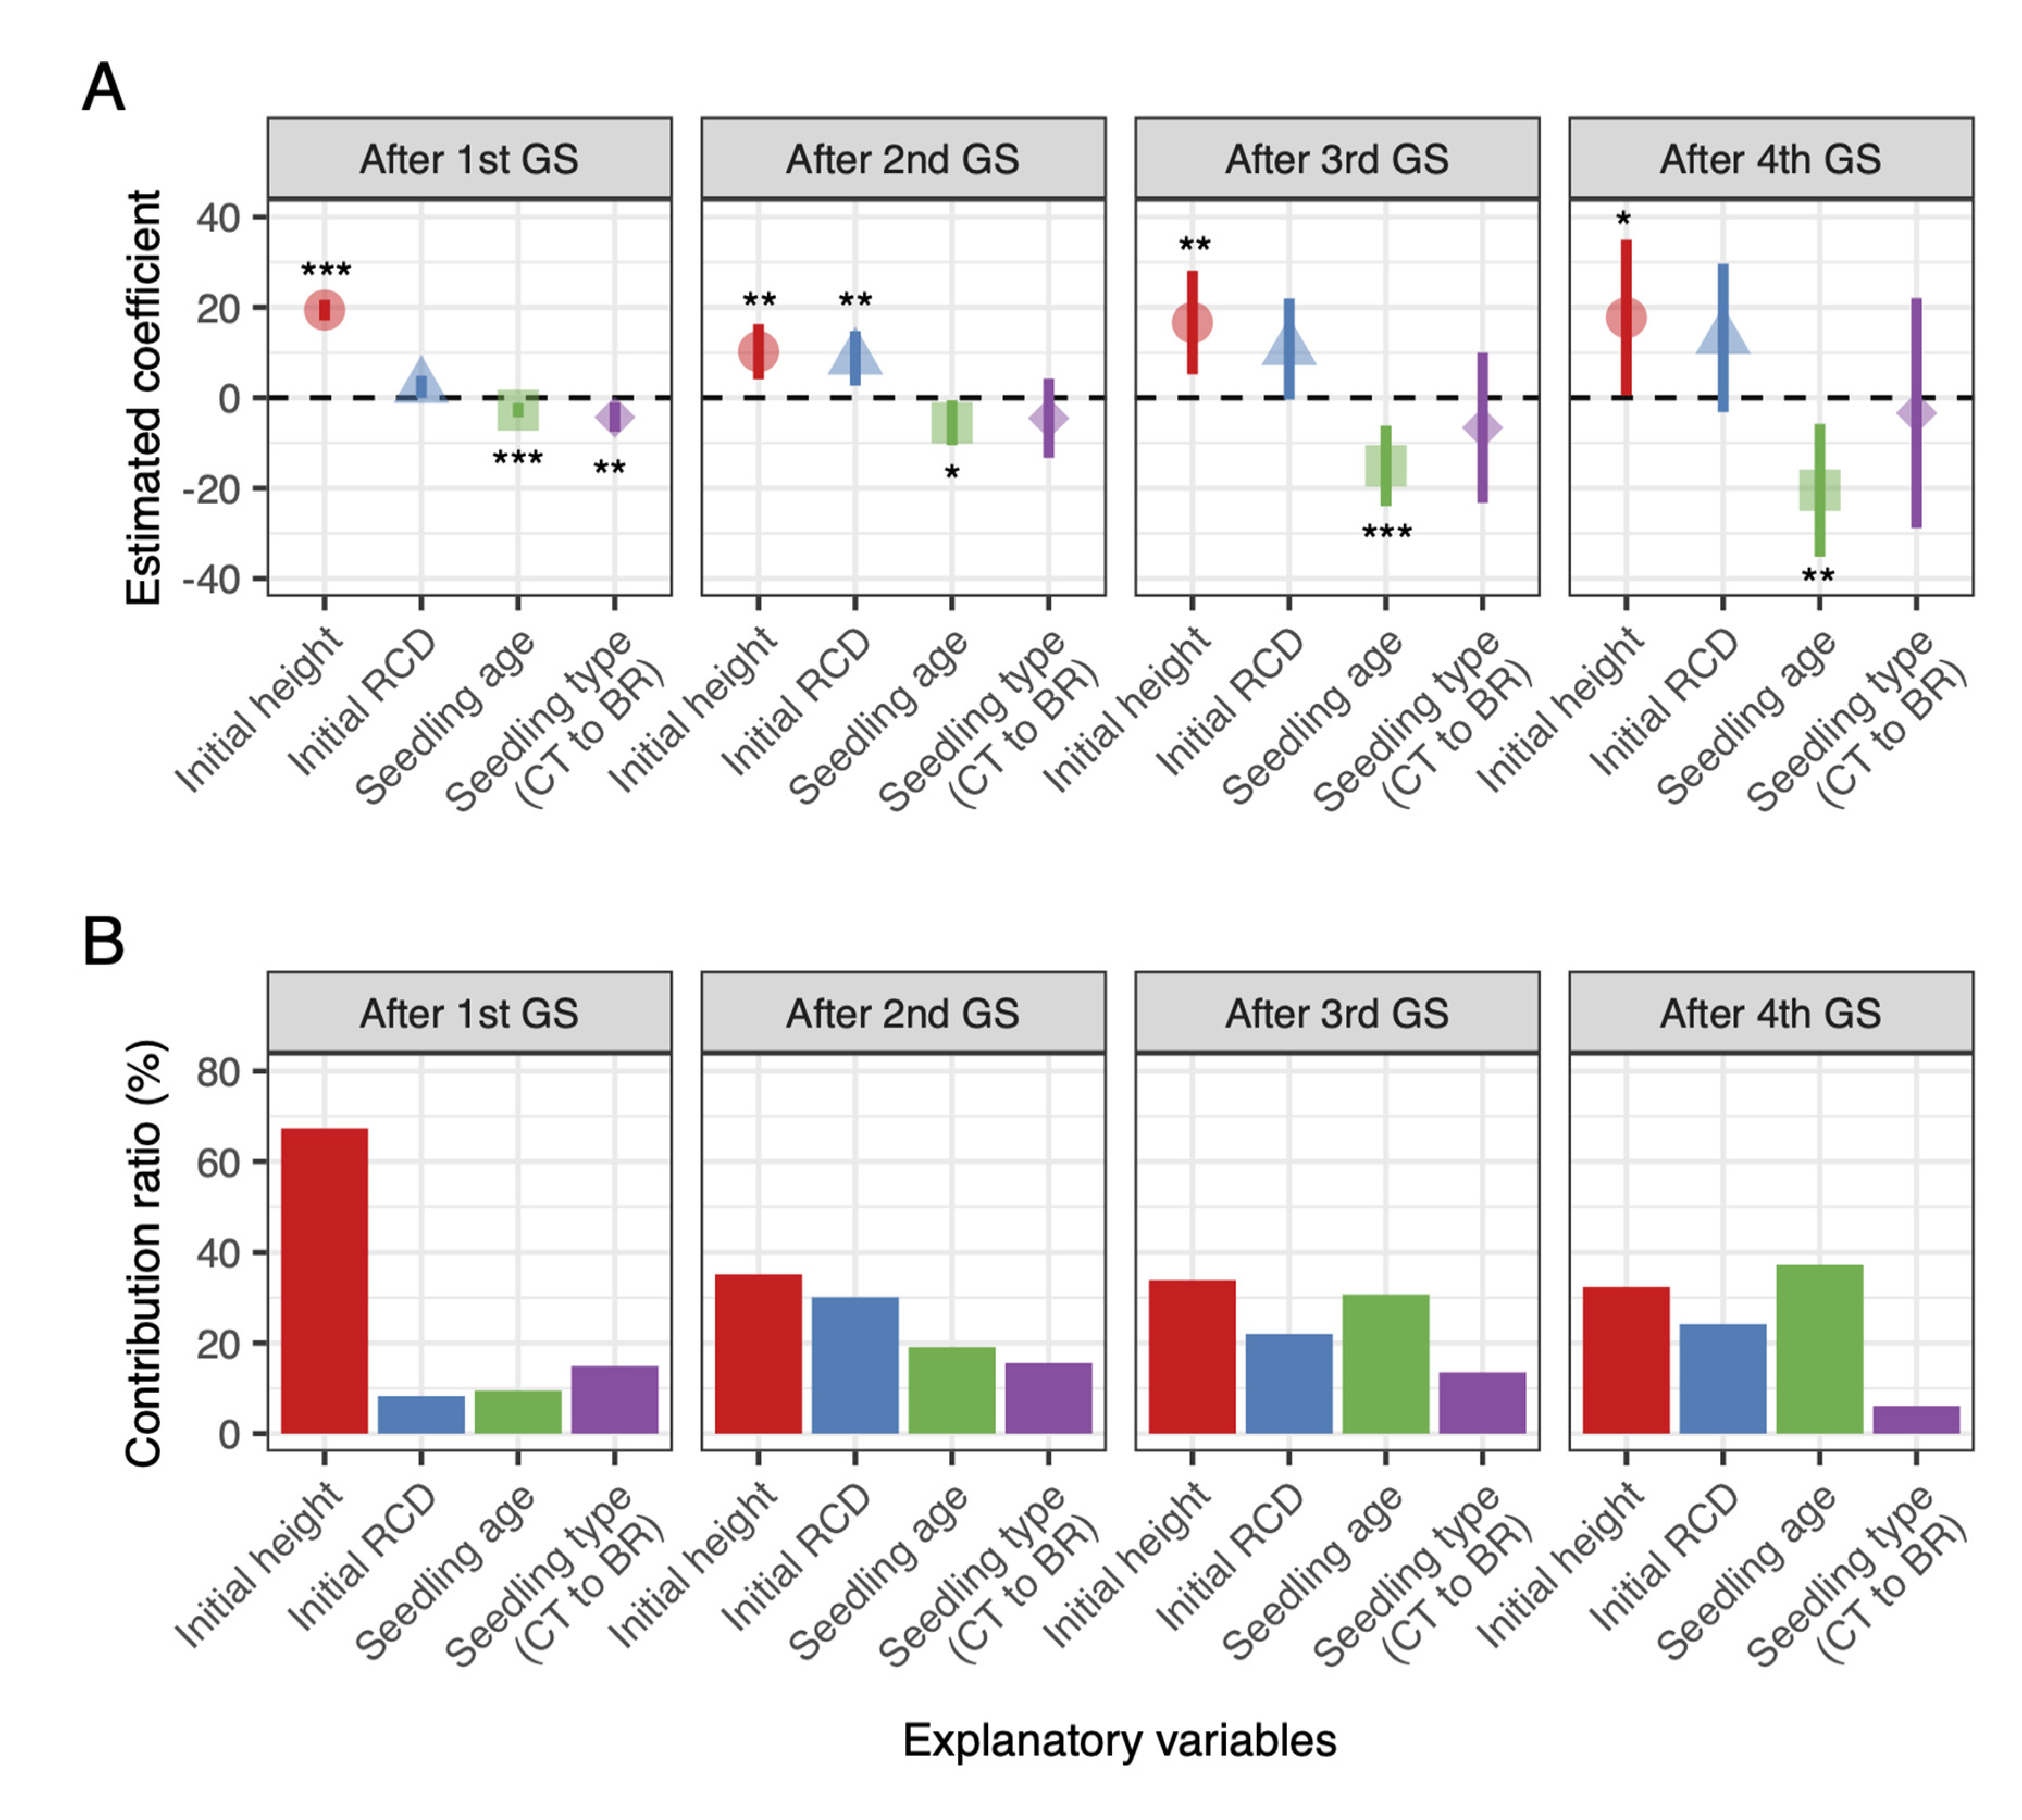
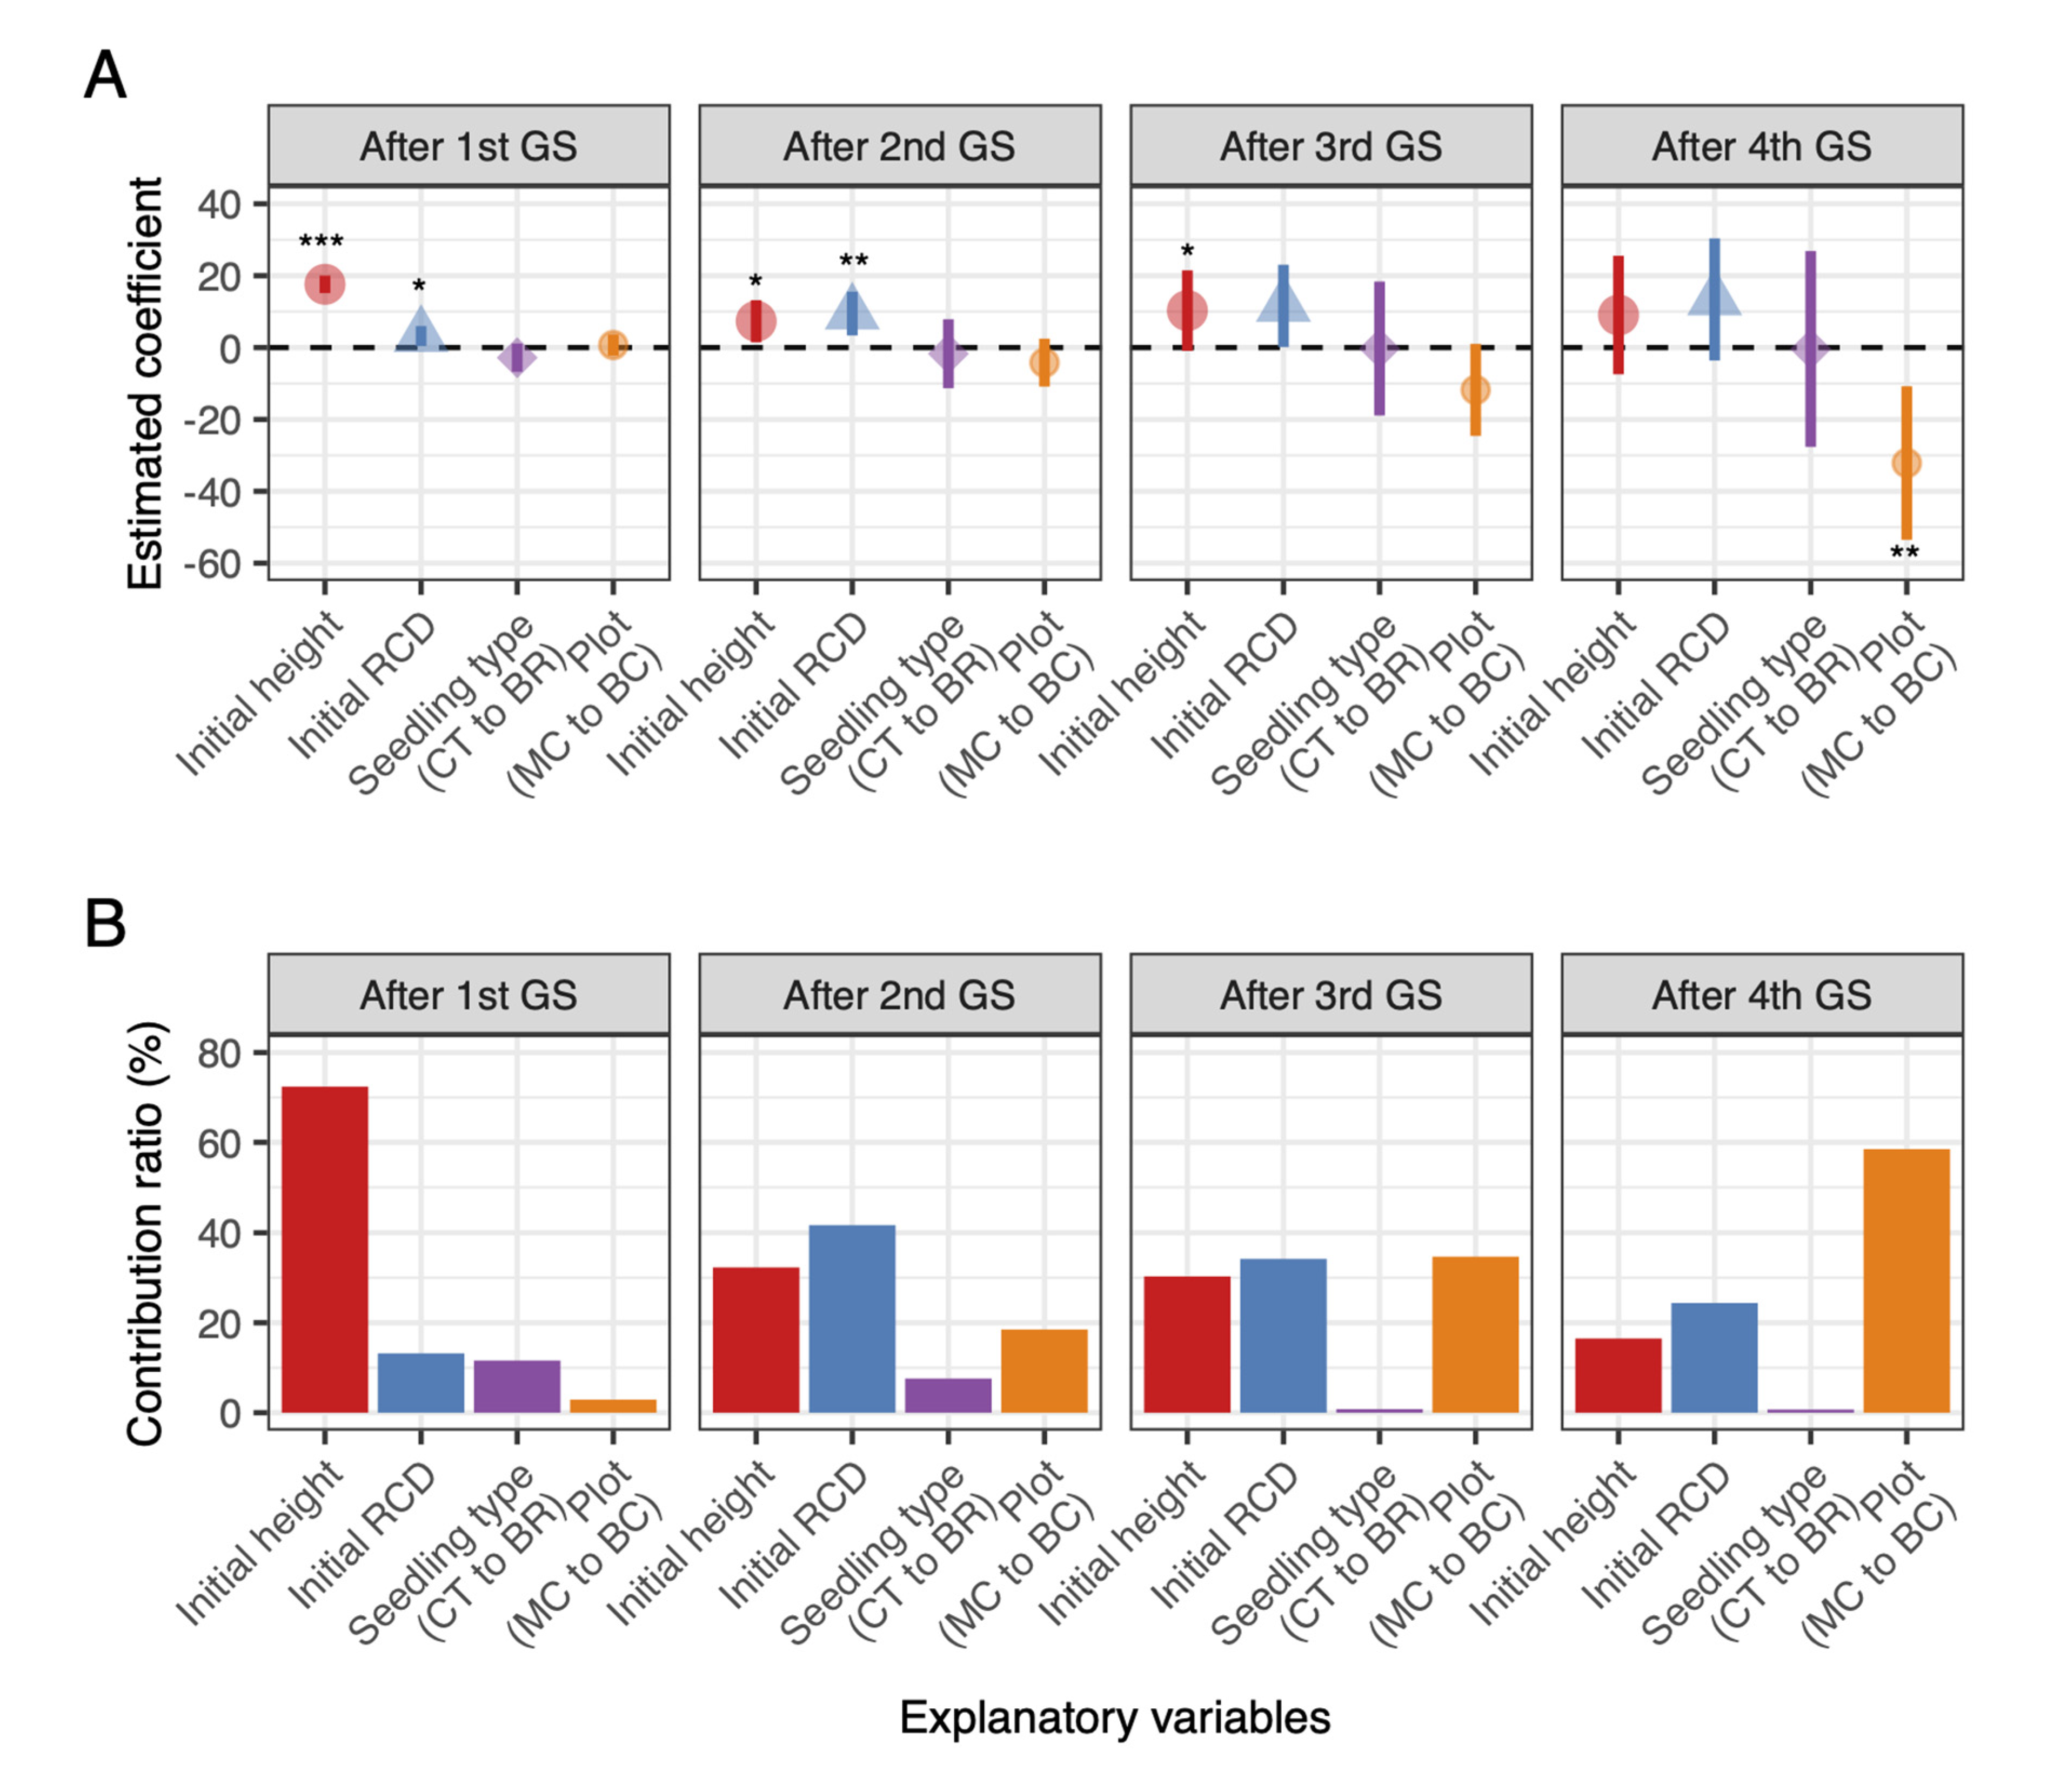
3.3. Model Analysis of the Effects of Seedling Quality and Plot on Seedling Height after Planting

The LMM analysis of seven stock types in the mulcher plot revealed a significant positive and negative effect of initial seedling height and seedling age, respectively, on seedling height after the first GS from planting (Figure 7A), and the initial tree height had the highest percentage of contribution (Figure 7B). A negative effect was also observed for seedling type (i.e., container seedlings as compared to bareroot seedlings). The significant positive effect of initial seedling height and the negative effect of seedling age continued until the fourth GS. The contribution rate of seedling age gradually increased, and became the highest contributor after the fourth GS. The significant negative effect of seedling type was not observed after the second GS.
Results of the LM analysis of four stock types planted in mulcher and bucket plots revealed significant positive effects of initial seedling height and RCD on seedling height after the first and second GS after planting (Figure 8A). The positive effects persisted until after the fourth GS, but were no longer significant after the third and fourth GS for initial height and RCD, respectively. Initial height had the highest contribution ratio to the LM among the explanatory variables after the first GS, but the contribution ratio decreased over time; meanwhile, RCD also demonstrated a high contribution rate after the second GS (Figure 8B). The plot effect was negligible after the first GS. After the second to fourth GS, the negative effect of the mulcher plot relative to the bucket plot increased with GS, and the plot effect became significant after the fourth GS. The contribution ratio was the largest among the explanatory variables. The effect of seedling type was small and insignificant throughout the four GSs.
A decision tree analysis indicated that the most important factor for a planted seedlings to exceed the 2 m height of the competing vegetation after the third GS was an initial RCD of 7.3 mm or larger, and the probability increased from 0.46 to 0.75 for this criterion (Figure 9). None of the small seedlings with an initial RCD of less than 7.3 mm and an initial height of less than 34 cm reached 2 m. Seedling age was a factor for the third bifurcation point, with seedlings less than three years old having a high probability of reaching a height of 2 m. Seedling type (bareroot or container-grown) and plot with mulcher or bucket MSP were not selected as criteria.

4. Discussion

4.1. Effects of Stock Type and MSP Method on Survival

The survival of Japanese larch seedlings after the first GS differed among stock types and plots with varying MSP methods (Figure 3). Bareroot (1+2) seedlings with a high top:root ratio of approximately three (Figure 2A) had low survival rates, especially in the mulcher plot. It is usually considered desirable to have a top:root ratio of about two for bareroot seedlings [39], and bareroot seedlings with a top:root ratio around three often have an imbalance between shoot transpiration and root water uptake, resulting in a low survival rate as the top:root ratio increases from two to three [5]. The monthly precipitation in May 2017 at this study site during planting of seedlings was 41.5 mm, which was 34% lower than in the previous years (1991–2020 average). Thus, the low survival of bareroot (1+2) seedlings in the mulcher plot is attributed to their inability to withstand the drought stress of low precipitation, due to their low drought tolerance with high top:root ratio. In the mulcher MSP, mulched woody residues covered the soil (Figure S1D), which can prevent water loss from the soil surface due to evaporation, and thus should allow for high soil moisture content [40,41]. However, the survival rate of bareroot (1+2) seedlings was lower than in the bucket MSP plot (Figure 3), wherein the soil surface was exposed, and thus was highly susceptible to desiccation. This discrepancy may have occurred due to the large roots of bareroot (1+2) seedlings (Figure 2), which required substantially large planting holes for planting, resulting in the entrance of woody debris in the planting hole and prevention of the root growth and root water uptake in the mulcher MSP plot.
JFA300.E (1+2) seedlings had low survival rates (Figure 3), despite the absence of significant differences in organ dry mass or organ allocation of the seedlings compared to other container-grown stock types (Figure 2). JFA300.E (1+2) seedlings had a nursery period of three years (Table 1) but had smaller seedling size at planting than other container-grown stock types, which had a short nursery period of one or two years (Figure 4A,B). In addition, JFA300.E (1+2) seedlings did not grow well after planting (Figure 5A and Figure 6A); thus, these seedlings were smaller in size after the fourth GS (Figure 4A,B). These results suggest that seed lots for JFA300.E (1+2) seedlings may be of low quality, which may have resulted in poor nursery and post-planting growth and low post-planting survival [42].

4.2. Effects of Stock Type on Growth

Seedling height and RCD, which differed significantly among stock types at planting, became less different over the years after planting; after the fourth GS, no significant differences were found among most stock types (Figure 4). This phenomenon can be attributed to the gradual dilution of the effect of seedling size at planting, because the growth of each planted seedling is influenced by the environmental conditions at each seedling microsite and the intrinsic growth potential of each seedling [1]. The model analyses showed that the contribution of the negative effects of seedling age at planting on seedling height after each GS increased over time, and was the highest among the explanatory variables after four GSs (Figure 7). The negative effect of seedling age could be attributed to seedling height:RCD ratio, especially in bareroot seedlings. The RGR of height of bareroot (1+2) seedlings was low until the second GS (Figure 5A), while that of RCD was comparable to the other stock types in the second GS (Figure 5B), suggesting that bareroot (1+2) seedlings preferred RCD growth to height growth until the proper height:RCD ratio was reached. Similarly, the negative effect of high height:RCD ratio on initial height growth has also been reported in Japanese cedar [43] and Austrian pine [44]. The bareroot (1+2) seedlings in the current study were leftover bareroot (1+1) seedlings, which are commonly used in Japan. The bareroot (1+2) seedlings used in this study were grown at high density in the nursery for an additional year, without transplanting the commonly used bareroot (1+1) seedlings, resulting in a higher height: RCD ratio at planting than other stock types [45]. The high height:RCD ratio of bareroot (1+2) seedlings was eliminated after the second GS after planting (Figure 4C). Thus, the negative effect of seedling age derived from height:RCD ratio on seedling height after planting should be limited to the second GS.
On the other hand, for container-grown seedlings, the negative effect of age appears to be unrelated to height:RCD ratio. Theoretically, height:RCD and top:root ratios could increase with seedling age in container-grown seedlings, because root growth and growth density are fixed during the nursery period, resulting in a negative effect of seedling age on height growth after planting [6]. However, in this study, height:RCD ratio (Figure 4C) and top: root ratio (Figure 2G) did not increase in three-year-old container-grown seedlings, JFA300.C (1+2) and JFA300.E (1+2). This is because the three-year-old container-grown seedlings in this study took longer to reach a shipping size, due to poor growth in the container during the nursery period, and were therefore older. In fact, among the 3-year-old container-grown seedlings, JFA300E tended to have less root mass than some other 1- and 2-year-old container-grown seedlings (Figure 2F). Seed quality may be another factor contributing to the negative effect of seedling age on post-planting seedling height. The age of the stock types varied from one to three years. However, the seedling height at planting was relatively the same among the stock types, ranging from 30 cm to 50 cm, except for the bareroot (1+2) seedlings (Figure 4A). This suggests that the stock type with older seedlings at planting grew slower in the nursery. The slow growth in the nursery can be partly attributed to the use of low-quality seeds, including genetic characteristics [46], which may have influenced the subsequent slow growth after planting.
LMM analyses showed that the effect of initial seedling height and RCD contributed more to seedling height in the first to fourth GSs in Japanese larch than differences in seedling type (bareroot or container-grown seedlings) (Figure 7 and Figure 8, respectively). The results were consistent with the general trend that once seedlings are established, field performance of bareroot and container-grown seedlings can be comparable [7] and large initial height and RCD can lead to subsequent height growth after planting [1]. The seedling height advantage is generally beneficial on sites with competing vegetation [47], and Japanese larch growth is sensitive to competing vegetation [20]; thus, the size of planted seedlings will be an important trait in Japanese larch. Among the container-grown stock types in this study, JFA300 (1+2) and BCC150 (0+2) had significantly lower initial height and RCD than LIECO390 (0+1) and HRO200 (1+1), and this significant trend continued until the third GS (Figure 4). The small initial size of BCC150 (0+2) seedlings can be attributed to the smallest cell capacity and highest growing density among the container-grown stock types [7].

4.3. Effects of Plots with Different MSP Method on Growth

The effect of plots with different MSP methods on seedling height was unclear in the comparisons among stock types (Figure 4). However, LMM analyses revealed that the effect of plots with different MSP methods on seedling height increased with rising GS after planting, and that mulcher MSP had a negative effect (significant at the fourth GS) on seedling height after planting, compared to bucket scarification MSP (Figure 8). Contrary to the seedling growth trends in this study, previous studies have shown that mulcher MSP can provide better soil nutrient availability and less growth of competing vegetation for the successful growth of planted seedlings than bucket MSP. Sikström, et al. [48] reviewed studies on the growth of seedlings planted after five major MSP techniques, including scarification. They reported that scarification removes the humus layer and thus reduces nutrient availability for seedlings planted in pure mineral soil, which may occasionally consequently weaken the positive effect of weed suppression by MSP on seedling height growth. By contrast, in mulcher MSP, soil nitrogen availability could remain the same compared to the control [49] or even increase, due to additions from woody residues generated by the mulching treatment [40]. Moreover, the amount of first summer competing vegetation after planting at this site was comparable to the bucket MSP plot up up to 2 cm thick of mulch residue in the mulcher MSP plot, and less than that of the bucket MSP plot when mulch residue thickness in the mulcher MSP plot was greater than 2 cm [30]. The discrepancy between the potentially favorable environmental conditions for rapid seedling growth in the mulcher MSP reported in these previous studies and the poor seedling growth in the current study may be partially due to the plot location at the study site. The mulcher plot was located higher upslope than the bucket plot; therefore, the mulcher plot was expected to have minimal soil moisture and strong winds, potentially resulting in reduced growth of Japanese larch [18,50,51]. In addition, seedling growth may also have been inhibited by allelopathy, caused by the fermentation of the mulch material [52,53]. The plot design of this study was inadequate to detect the effect of MSP, because there was no MSP replication and different MSP plots were placed at different slope locations. Further research with an adequately randomized study design [8] is needed to clarify whether the effect of plots on the height growth of Japanese larch seedlings, which increased in the years after planting, is due to differences in MSP methods.

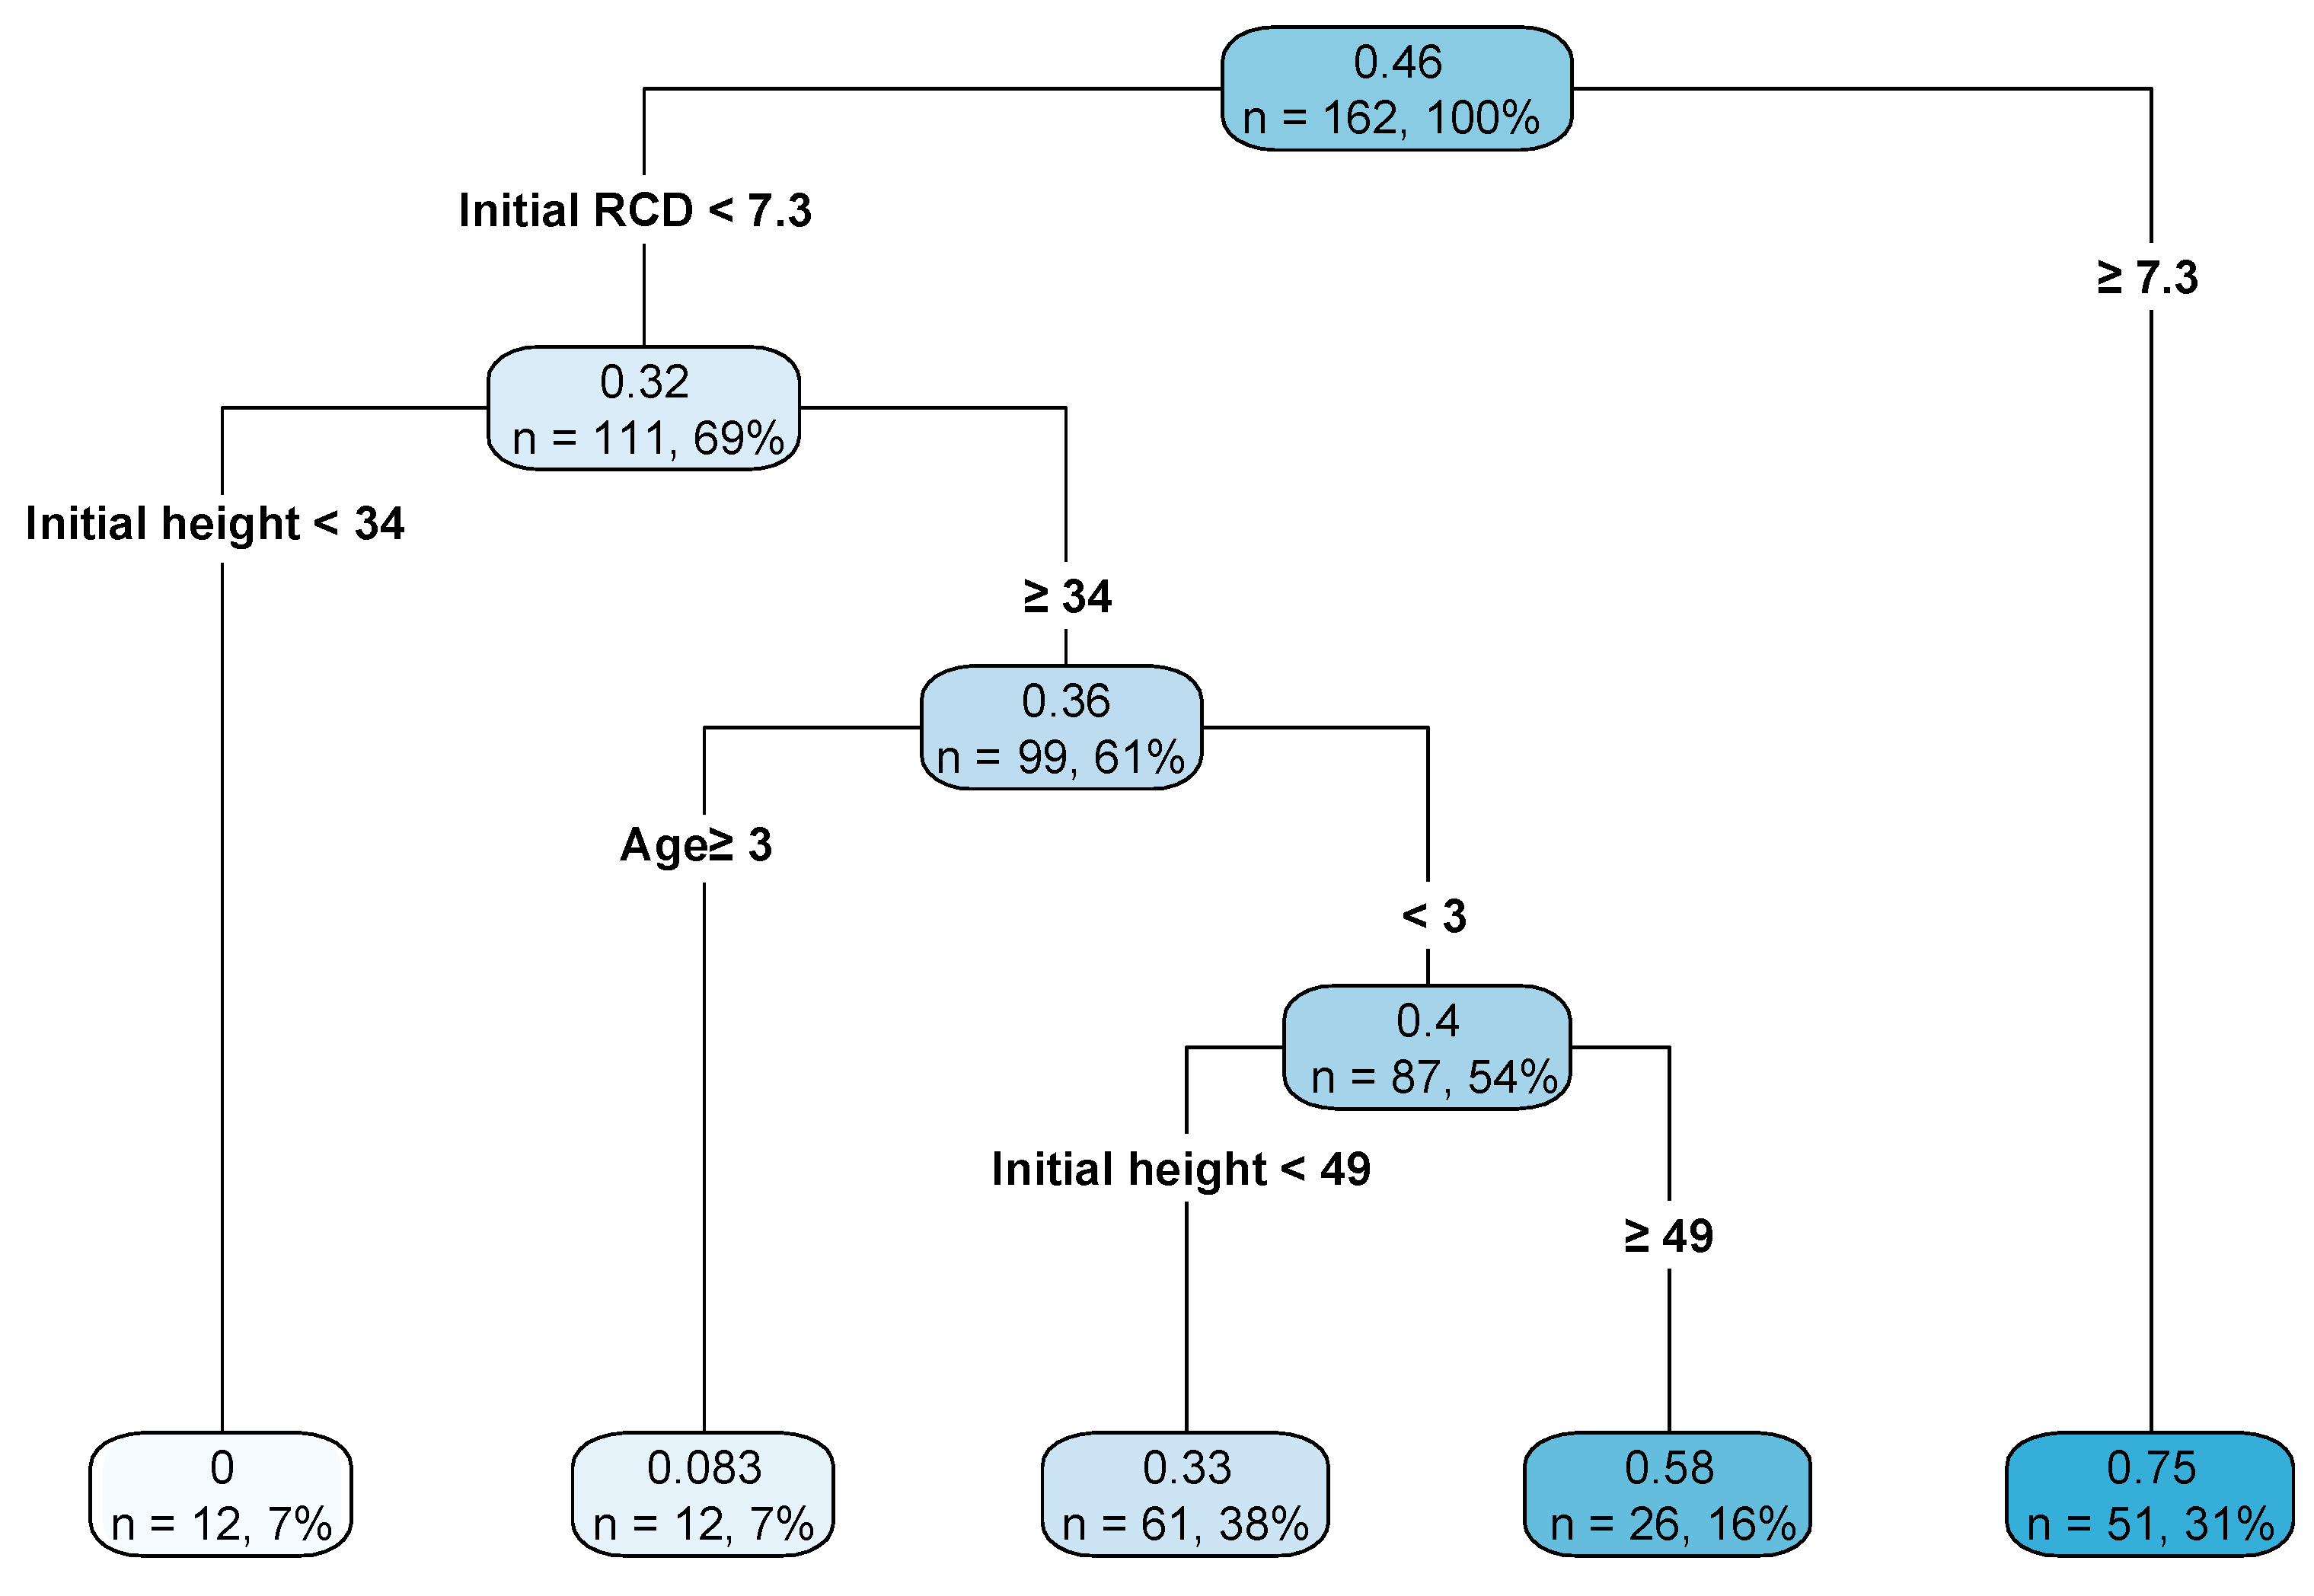
4.4. Characteristics of Seedlings That Grow Faster up to the Height of Surrounding Vegetation

Seedling height after planting was affected by initial seedling height and RCD, seedling age, and plots with different MSP methods, and their effects varied with GSs after planting (Figure 7 and Figure 8). Despite these complex effects, the decision tree analysis identified criteria traits that could grow taller faster than the height of the surrounding vegetation (Figure 9). The primary criterion was an initial RCD ≥ 7.3 mm (Figure 9), and the percentage of seedlings exceeding this criterion was 18%–30% for LIECO390 (0+1), JFA300.C (1+2), and HRO200 (1+1) but 0% for JFA300.E (1+2) and BCC150 (0+2) in container-grown stock types (Figure 4B, Table S1). For container-grown seedlings, the RCD of seedlings generally increases with large cell volume and low growing density of the container [54,55,56]; in Japanese larch, lower RCD was reported in JFA150 containers (cell volume: 150 mL, growing density: 292 cells m−2) with lower cell volume and higher seedling density compared to JFA300 containers (cell volume: 300 mL, growing density: 178 cells m−2) [57]. Thus, the low initial RCD of the BCC150 (0+2) can be attributed to the smallest cell volume and highest density of this container in the stock type of this study (Table 1). The small cell volume and high growing density of the BCC150 container can reduce seedling production costs [56]. However, the BCC150 container would be unsuitable for Japanese larch seedlings if the goal is to reduce weeding costs, because they did not grow taller after planting.
JFA300.E (1+2) was another stock type that failed to meet the primary criterion for height after three GSs (initial RCD ≥ 7.5 mm) (Figure 4B, Table S1). As mentioned above, this stock type had a low initial RCD and a low height, despite a long nursery period of three years, indicating poor growth in containers during the nursery. This suggests that the quality of the seed, including genetic quality, used for this stock type may be poor [8], although the quality of seed collected from ordinal plantations had never been evaluated in this study. Seedling age was selected as the third determinant in the decision tree (Figure 9), and contribution of the seedling age to the seedling height after planting increased over time (Figure 7 and Figure 8). These results implied that in order to produce high-growth seedlings of Japanese larch after planting, it is important that the seedlings are planted in the appropriate morphology, as well as that the seedlings are not old, reflecting high growth during the nursery period, which can be partly attributed to good seed quality. In general, tree growth is genetically controlled [58,59]. Japanese larch breeding in Japan began in the 1950s, and more than 530 trees have been selected to produce improved seeds [13]. However, the establishment of seed orchards has not developed, and most of the seeds used in nurseries are not from the selected trees, but from ordinal plantations without genetic assessment. Early establishment of seed orchards composed of the selected trees is important for the production of high-growth seedlings. In Japanese larch, seed weight had a positive effect on the RCD of seedlings grown in containers for one year, and the Seed Quality Index (SQI) calculated from three near-infrared wavelengths showed a good separation of seed weight and germination potential [57]. Therefore, the SQI may be useful for selecting high-quality seeds from those collected from ordinal plantations, and consequently for producing high-growth seedlings. High growth in the nursery, associated with the use of high-quality seed, will also help reduce costs by reducing the number of production years and will increase the size of containerized seedlings, which are currently more expensive but smaller than bareroot seedlings.

5. Conclusions

A four-year consecutive measurement of seven Japanese larch stock types planted on two different MSPs showed that the combination of large bareroot seedlings and mulcher MSP can reduce post-planting survival. Model analysis showed that initial height, RCD, seedling age, and plot influenced post-planting seedling height, but seedling type (bareroot or container-grown seedlings) did not, and the effect of initial size decreased with the number of years since planting. The determinant tree analysis indicated that the most important factor for fast-growing tall seedlings after planting, which is suitable for reducing weeding costs, was a large diameter, regardless of seedling type (bareroot or container-grown). Older seedlings had lower survival and height growth after planting, reflecting high top: root and height:RCD ratios in bareroot seedlings and slow nursery growth in container seedlings.

Supplementary Materials

The following supporting information can be downloaded at https://www.mdpi.com/article/10.3390/f14040784/s1, Figure S1: Photographs of the mechanical site preparation (A, C) and the forest floor after preparation (B, D); Table S1: Percentage of number of planted seedlings that had an initial root collar diameter (RCD) of 7.3 mm or larger and number of observations (n) by stock type.

Author Contributions

Conceptualization, H.H. and T.Y.; methodology, H.H., I.T. and T.Y.; formal analysis, H.H. and I.T.; investigation, H.H., I.T, M.K., T.Y., N.F., H.U. and S.S.; data curation, H.H. and T.Y.; writing—original draft preparation, H.H.; writing—review and editing, H.H., I.T, M.K., T.Y., N.F., H.U. and S.S.; visualization, H.H. and S.S.; supervision, H.U. and S.S.; project administration, H.U. and S.S.; funding acquisition, H.U. and S.S. All authors have read and agreed to the published version of the manuscript.

Funding

This research was funded by the Ministry of Agriculture, Forestry, and Fisheries of Japan (grant number 18064868) and the New Energy and Industrial Technology Development Organization (“Decarbonized electric robot for forest management in rural area”).

Data Availability Statement

The data presented in this study are available on request from the corresponding author.

Acknowledgments

We would like to thank Shimokawa Town, especially Tomohiro Saitou, for providing the planting site for this study, and Hokkaido Tree Nursery Cooperative for providing seed information. We are also grateful to Kazuhito Kita, Hirokazu Kon, Akira Uemura, Kenichi Yazaki, Mitsutoshi Umemura, Tetsuto Sugai, Tatsuya Sasaki, and Haruka Yamamoto for their assistance in the field and laboratory work.

Conflicts of Interest

The authors declare no conflict of interest. The funders had no role in the design of the study; in the collection, analyses, or interpretation of data; in the writing of the manuscript, or in the decision to publish the results.

References

  1. Grossnickle, S.C.; MacDonald, J.E. Why seedlings grow: Influence of plant attributes. New For. 2018, 49, 1–34. [Google Scholar] [CrossRef]
  2. Grossnickle, S.; MacDonald, J. Seedling Quality: History, Application, and Plant Attributes. Forests 2018, 9, 283. [Google Scholar] [CrossRef] [Green Version]
  3. Mattsson, A. Predicting field performance using seedling quality assessment. New For. 1997, 13, 227–252. [Google Scholar] [CrossRef]
  4. Duryea, M.L. Nursery cultural practices: Impacts on seedling quality. In Forestry Nursery Manual: Production of Bareroot Seedlings; Duryea, M.L., Landis, T.D., Perry, C.R., Eds.; Springer: Dordrecht, The Netherlands, 1984; Volume 11, pp. 143–164. [Google Scholar]
  5. Grossnickle, S.C. Why seedlings survive: Influence of plant attributes. New For. 2012, 43, 711–738. [Google Scholar] [CrossRef]
  6. Landis, T.D.; Dumroese, R.K.; Haase, D.L. Seedling processing, storage and outplanting. In The Container Tree Nursery Manual; USA Department of Agriculture, Forest Service: Washington, DC, USA, 2010; Volume 7, p. 192. [Google Scholar]
  7. Grossnickle, S.C.; El-Kassaby, Y.A. Bareroot versus container stocktypes: A performance comparison. New For. 2016, 47, 1–51. [Google Scholar] [CrossRef]
  8. Pinto, J.R.; Dumroese, R.K.; Davis, A.S.; Landis, T.D. Conducting seedling stock type trials: A new approach to an old question. J. For. 2011, 109, 293–299. [Google Scholar] [CrossRef]
  9. Nagamitsu, T.; Nagasaka, K.; Yoshimaru, H.; Tsumura, Y. Provenance tests for survival and growth of 50-year-old Japanese larch (Larix kaempferi) trees related to climatic conditions in central Japan. Tree Genet. Genomes 2013, 10, 87–99. [Google Scholar] [CrossRef]
  10. Qu, L.; Wang, Y.; Masyagina, O.; Kitaoka, S.; Fujita, S.; Kita, K.; Prokushkin, A.; Koike, T. Larch: A promising deciduous conifer as an eco-environmental resource. In Conifers—Recent Advances; Gonçalves, A.C., Fonseca, T.F., Eds.; IntechOpen: London, UK, 2022; pp. 1–37. [Google Scholar]
  11. Da Ronch, F.; Caudullo, G.; Tinner, W.; de Rigo, D. Larix decidua and other larches in Europe: Distribution, habitat, usage and threats. In European Atlas of Forest Tree Species; San-Miguel-Ayanz, J., de Rigo, D., Caudullo, G., Houston Durrant, T., Mauri, A., Eds.; Publication Office of the European Union: Luxembourg, 2016. [Google Scholar]
  12. Greenwood, M.S.; Roth, B.E.; Maass, D.D.; Irland, L.C. Near rotation-length performance of selected hybrid larch in Central Maine, U.S.A. Silvae Genet. 2015, 64, 73. [Google Scholar] [CrossRef] [Green Version]
  13. Kurinobu, S. Forest tree breeding for Japanese larch. Eurasian J. For. Res. 2005, 8, 127–134. [Google Scholar]
  14. Harayama, H.; Tsuyama, I.; Kuramoto, S.; Uemura, A.; Kitao, M.; Han, Q.; Yamada, T.; Sasaki, S. Effects of weed competition on the survival and initial growth of planted seedlings of Japanese larch (Larix kaempferi). J. Jpn. For. Soc. 2018, 100, 158–164, (In Japanese with English summary). [Google Scholar] [CrossRef] [Green Version]
  15. Tsuyama, I.; Harayama, H.; Kita, K. Evaluation on the effectiveness of containerized seedlings in Hokkaido. Boreal For. Res. 2018, 66, 69–72. (In Japanese) [Google Scholar] [CrossRef]
  16. Agathokleous, E.; Kitao, M.; Komatsu, M.; Tamai, Y.; Saito, H.; Harayama, H.; Uemura, A.; Tobita, H.; Koike, T. Effects of soil nutrient availability and ozone on container-grown Japanese larch seedlings and role of soil microbes. J. For. Res. 2020, 31, 2295–2311. [Google Scholar] [CrossRef] [Green Version]
  17. Harayama, H.; Tobita, H.; Kitao, M.; Kon, H.; Ishizuka, W.; Kuromaru, M.; Kita, K. Enhanced summer planting survival of Japanese larch container-grown seedlings. Forests 2021, 12, 1115. [Google Scholar] [CrossRef]
  18. Kitao, M.; Agathokleous, E.; Harayama, H.; Kitaoka, S.; Uemura, A.; Yazaki, K.; Tobita, H. Tolerance of Japanese larch to drought is modified by nitrogen and water regimes during cultivation of container seedlings. Eur. J. For. Res. 2022, 141, 699–712. [Google Scholar] [CrossRef]
  19. Agathokleous, E.; Kitao, M.; Komatsu, M.; Tamai, Y.; Harayama, H.; Koike, T. Single and combined effects of fertilization, ectomycorrhizal inoculation, and drought on container-grown Japanese larch seedlings. J. For. Res. 2022, 1–18. [Google Scholar] [CrossRef]
  20. Harayama, H.; Tsuyama, I.; Uemura, A.; Kitao, M.; Han, Q.; Kuramoto, S.; Utsugi, H. Growth and survival of hybrid larch F1 (Larix gmelinii var. japonica × L. kaempferi) and Japanese larch under various intensities of competition. New For. 2022, 1–17. [Google Scholar] [CrossRef]
  21. Kitao, M.; Harayama, H.; Yazaki, K.; Tobita, H.; Agathokleous, E.; Furuya, N.; Hashimoto, T. Photosynthetic and growth responses in a pioneer tree (Japanese white birch) and competitive perennial weeds (Eupatorium sp.) grown under different regimes with limited water supply to waterlogging. Front. Plant Sci. 2022, 13, 835068. [Google Scholar] [CrossRef]
  22. Löf, M.; Dey, D.C.; Navarro, R.M.; Jacobs, D.F. Mechanical site preparation for forest restoration. New For. 2012, 43, 825–848. [Google Scholar] [CrossRef]
  23. Dumas, N.; Dassot, M.; Pitaud, J.; Piat, J.; Arnaudet, L.; Richter, C.; Collet, C. Four-year-performance of oak and pine seedlings following mechanical site preparation with lightweight excavators. Silva Fenn. 2021, 55, 10409. [Google Scholar] [CrossRef]
  24. Nakagawa, M.; Kanno, M.; Yasaka, M. A weeding-duration model for Larix kaempferi plantations in Hokkaido, northern Japan. J. For. Res. 2017, 16, 319–324. [Google Scholar] [CrossRef]
  25. Masaki, T.; Oguro, M.; Yamashita, N.; Otani, T.; Utsugi, H. Reforestation following harvesting of conifer plantations in Japan: Current issues from silvicultural and ecological perspectives. Reforesta 2017, 3, 125–141. [Google Scholar] [CrossRef] [Green Version]
  26. Oya, S.; Kuramoto, S.; Koyama, Y.; Nakazawa, M.; Taki, S.; Utsugi, H. Effects of mechanical site preparation on controlling competing vegetation and weeding reduction. J. Jpn. For. Eng. Soc. 2021, 36, 99–110, (In Japanese with English summary). [Google Scholar] [CrossRef]
  27. Yamada, T.; Sasaki, S.; Kuramoto, S.; Uemura, A.; Harayama, H.; Utsugi, H.; Saito, T. Operational efficiency and effects on silvicultural works of the crusher for site preparation. J. Jpn. For. Eng. Soc. 2018, 33, 67–71. (In Japanese) [Google Scholar] [CrossRef]
  28. Harayama, H.; Uemura, A.; Tsuyama, I.; Sasaki, S.; Yamada, T.; Utsugi, H.; Kuramoto, S. Weed suppression effect of site preparation by a crusher. Boreal For. Res. 2016, 64, 61–62. [Google Scholar] [CrossRef]
  29. Jain, T.; Sikkink, P.; Keefe, R.; Byrne, J. To Masticate or not: Useful Tips for Treating Forest, Woodland, and Shrubland Vegetation; Rocky Mountain Research Station: Logan, UT, USA, 2018; p. 55. [Google Scholar]
  30. Harayama, H.; Uemura, A.; Tsuyama, I.; Sasaki, S.; Yamada, T.; Watanabe, I.; Utsugi, H. Effect of crashed branch on weed outbreak by a crusher for site preparation. Boreal For. Res. 2018, 66, 73–76. (In Japanese) [Google Scholar] [CrossRef]
  31. Hunt, R. Plant growth curves. In The Functional Approach to Plant Growth Analysis; Edward Arnold Ltd.: London, UK, 1982. [Google Scholar]
  32. R Core Team. R: A Language and Environment for Statistical Computing; R Foundation for Statistical Computing: Vienna, Austria, 2021. [Google Scholar]
  33. Hothorn, T.; Bretz, F.; Westfall, P. Simultaneous inference in general parametric models. Biom. J. 2008, 50, 346–363. [Google Scholar] [CrossRef] [Green Version]
  34. Kosmidis, I.; Firth, D. Jeffreys-prior penalty, finiteness and shrinkage in binomial-response generalized linear models. Biometrika 2021, 108, 71–82. [Google Scholar] [CrossRef]
  35. Lenth, R.V.; Bolker, B.; Buerkner, P.; Giné-Vázquez, I.; Herve, M.; Jung, M.; Love, J.; Miguez, F.; Riebl, H. Singmann HEmmeans: Estimated Marginal Means, aka Least-Squares Means. Available online: https://cran.r-project.org/web/packages/emmeans/emmeans.pdf (accessed on 3 February 2023).
  36. Bates, D.; Maechler, M.; Bolker, B.; Walker, S. Fitting linear mixed-effects models using lme4. J. Stat. Softw. 2015, 76, 1–48. [Google Scholar] [CrossRef]
  37. Therneau, T.; Atkinson, B. Rpart: Recursive Partitioning and Regression Trees. Available online: https://cran.r-project.org/web/packages/rpart/rpart.pdf (accessed on 3 February 2023).
  38. Milborrow, S. Rpart.plot: Plot ‘rpart’ Models: An Enhanced Version of ‘plot.rpart’. Available online: https://cran.r-project.org/web/packages/rpart.plot/rpart.plot.pdf (accessed on 3 February 2023).
  39. Bernier, P.Y.; Lamhamedi, M.S.; Simpson, D.G. Shoot:root ratio is of limited use in evaluating the quality of container conifer stock. Tree Plant. Notes 1995, 46, 102–106. [Google Scholar]
  40. Rhoades, C.C.; Battaglia, M.A.; Rocca, M.E.; Ryan, M.G. Short- and medium-term effects of fuel reduction mulch treatments on soil nitrogen availability in Colorado conifer forests. For. Ecol. Manag. 2012, 276, 231–238. [Google Scholar] [CrossRef]
  41. Massman, W.J.; Frank, J.M.; Jimenez Esquilin, A.E.; Stromberger, M.E.; Shepperd, W.D. Long term consequences of a controlled slash burn and slash mastication to soil moisture and CO2 at a southern Colorado site. In Proceedings of the 27th Conference on Agricultural and Forest Meteorology, Boston, MA, USA, 22 May 2006. [Google Scholar]
  42. Carrasquinho, I.; Gonçalves, E. Genetic variability among Pinus pinea L. provenances for survival and growth traits in Portugal. Tree Genet. Genomes 2013, 9, 855–866. [Google Scholar] [CrossRef]
  43. Yagihashi, T.; Nakaya, T.; Nakahara, K.; Nasuno, S.; Hitsuma, G.; Noguchi, M.; Yagi, T.; Saitoh, T.; Matsumoto, K.; Yamada, T.; et al. Correlation between height: Diameter ratio and shoot growth in containerised and bare-root seedlings of Cryptomeria japonica. J. Jpn. For. Soc. 2016, 98, 139–145, (In Japanese with English summary). [Google Scholar] [CrossRef] [Green Version]
  44. Ivetic, V.; Grossnickle, S.; Skoric, M. Forecasting the field performance of Austrian pine seedlings using morphological attributes. IForest—Biogeosci. For. 2017, 10, 99–107. [Google Scholar] [CrossRef] [Green Version]
  45. Schultz, R.C.; Thompson, J.R. Effect of density control and undercutting on root morphology of 1 + 0 bareroot hardwood seedlings: Five-year field performance of root-graded stock in the central USA. New For. 1997, 13, 301–314. [Google Scholar] [CrossRef]
  46. Landis, T.; Tinus, R.; Barnett, J. Seedling Propagation. In The Container Tree Nursery Manual; USA Forest Service: Washington, DC, USA, 1999; Volume 6, p. 167. [Google Scholar]
  47. Thiffault, N.; Jobidon, R.; Munson, A.D. Comparing large containerized and bareroot conifer stock on sites of contrasting vegetation composition in a non-herbicide scenario. New For. 2014, 45, 875–891. [Google Scholar] [CrossRef]
  48. Sikström, U.; Hjelm, K.; Holt Hanssen, K.; Saksa, T.; Wallertz, K. Influence of mechanical site preparation on regeneration success of planted conifers in clearcuts in Fennoscandia—A review. Silva Fenn. 2020, 54, 10172. [Google Scholar] [CrossRef] [Green Version]
  49. Moghaddas, E.E.Y.; Stephens, S.L. Thinning, burning, and thin-burn fuel treatment effects on soil properties in a Sierra Nevada mixed-conifer forest. For. Ecol. Manag. 2007, 250, 156–166. [Google Scholar] [CrossRef]
  50. Harayama, H.; Kita, K.; Kon, H.; Ishizuka, W.; Tobita, H.; Utsugi, H. Effect of planting season on survival rate, growth and ecophysiological properties of container seedlings of Japanese larch (Larix kaempferi). J. Jpn. For. Soc. 2016, 98, 158–166, (In Japanese with English summary). [Google Scholar] [CrossRef] [Green Version]
  51. Mitsuda, Y.; Yoshida, S.; Imada, M. Use of GIS-derived environmental factors in predicting site indices in Japanese larch plantations in Hokkaido. J. For. Res. 2001, 6, 87–93. [Google Scholar] [CrossRef]
  52. Bachheti, A.; Sharma, A.; Bachheti, R.K.; Husen, A.; Pandey, D.P. Plant allelochemicals and their various applications. In Co-Evolution of Secondary Metabolites; Springer: Berlin/Heidelberg, Germany, 2019; pp. 1–25. [Google Scholar]
  53. Kato-Noguchi, H.; Kurniadie, D. Allelopathy and Allelochemicals of Leucaenaleucocephala as an Invasive Plant Species. Plants 2022, 11, 1672. [Google Scholar] [CrossRef]
  54. Dominguez-Lerena, S.; Herrero Sierra, N.; Carrasco Manzano, I.; Ocaña Bueno, L.; Peñuelas Rubira, J.L.; Mexal, J.G. Container characteristics influence Pinus pinea seedling development in the nursery and field. For. Ecol. Manag. 2006, 221, 63–71. [Google Scholar] [CrossRef]
  55. Aphalo, P.; Rikala, R. Field performance of silver-birch planting-stock grown at different spacing and in containers of different volume. New For. 2003, 25, 93–108. [Google Scholar] [CrossRef]
  56. Landis, T.D. Containers: Types and functions. In The Container Tree Nursery Manual; USA Forest Service: Washington, DC, USA, 1990; Volume 2, p. 87. [Google Scholar]
  57. Kita, K.; Kon, H.; Ishizuka, W.; Matsuda, O. Characterization of Larix kaempferi seeds selected by near-infrared spectroscopy for germination and post-germination growth in nursery containers. J. For. Res. 2022, 27, 158–167. [Google Scholar] [CrossRef]
  58. Jansson, G.; Hansen, J.K.; Haapanen, M.; Kvaalen, H.; Steffenrem, A. The genetic and economic gains from forest tree breeding programmes in Scandinavia and Finland. Scand. J. For. Res. 2016, 32, 273–286. [Google Scholar] [CrossRef]
  59. Jansen, S.; Geburek, T. Historic translocations of European larch (Larix decidua Mill.) genetic resources across Europe—A review from the 17th until the mid-20th century. For. Ecol. Manag. 2016, 379, 114–123. [Google Scholar] [CrossRef]
Figure 1. Overview of the study site. Seven stock types were planted in the mulcher site preparation plot and four stock types were planted in the bucket site preparation plot in areas enclosed by solid lines of different colors, blue: bareroot (1+2), light blue: bareroot (1+1), red: HRO200 (1+1), orange: BCC150 (0+2), green: JFA300.C (1+2), pink: JFA300.E (1+2), and light green: LIECO390 (0+1). Yellow lines indicate the investigated planting rows. Details of stock types are shown in Table 1. The photograph was taken by S. Sasaki.
Forests 14 00784 g001
Figure 2. Dry mass by organ and allocation for each stock type. (A) stem, (B) branch, (C) leaf, (D) root, (E) thick root more than 2 mm in diameter, (F) fine root less than 2 mm in diameter, (G) top (stem + branch): root ratio, and (H) top:fine-root ratio. Different black lowercase and blue uppercase letters indicate significant differences at p < 0.05 among all stock types and among container-grown stock types, respectively. Details of stock types are shown in Table 1.
Forests 14 00784 g002
Figure 3. Survival rate after one growing season from planting in the mechanical-site-preparation (MSP) plot with bucket and mulcher. Different letters indicate significant differences at p < 0.05. Details of stock types are shown in Table 1.
Forests 14 00784 g003
Figure 4. (A) Height, (B) root collar diameter (RCD), and (C) height:RCD ratio of planting seedlings of each stock type in the bucket and mulcher MSP plot at planting and at the end of the first to fourth growing seasons (GS). Different letters indicate significant differences at p < 0.05. Details of stock types are shown in Table 1.
Forests 14 00784 g004
Figure 5. Relative growth rate (RGR) of (A) height and (B) root collar diameter (RCD) of planting seedlings of each stock type in the bucket and mulcher MSP plots during the first to fourth GS. Different letters indicate significant differences at p < 0.05. Details on stock types are shown in Table 1.
Forests 14 00784 g005
Figure 6. Relative growth rate (RGR) over the four years after planting of (A) height and (B) root collar diameter (RCD) of planting seedlings of each stock type in the MSP plot with the bucket and mulcher. Different letters indicate significant differences at p < 0.05. Details of stock types are shown in Table 1.
Forests 14 00784 g006
Figure 7. (A) Estimated coefficient and (B) contribution ratio of explanatory variables of the linear mixed model for each seedling height after the first to fourth GS. Numerical explanatory variables, such as initial height, RCD, and seedling age, were standardized to have a mean of 0 and standard deviation of 1. Seedling type is evaluated as the effect of container-grown (CT) seedlings relative to bareroot (BR) seedlings. Bars in panel (A) represent standard errors. *** p < 0.001, ** p < 0.01, * p < 0.05.
Forests 14 00784 g007
Figure 8. (A) Estimated coefficient and (B) contribution ratio of explanatory variables of linear model for each seedling height after the first to fourth GSs. Numerical explanatory variables, such as initial height and RCD, were standardized to have a mean of 0 and standard deviation of 1. Seedling type and plot are evaluated as the effect of container-grown (CT) seedlings relative to bareroot (BR) seedlings and mulcher site preparation plot (MC) relative to bucket site preparation plot (BC), respectively. Bars in panel (A) represent standard errors. *** p < 0.001, ** p < 0.01, * p < 0.05.
Forests 14 00784 g008
Figure 9. Results of the decision tree analysis of whether the height of planted seedlings exceeded 2 m, which is the height of competing vegetation, after the third GS. Explanatory variables include initial seedling height (cm) and RCD (mm), seedling age and type (bareroot or container-grown), and plot (mulcher or bucket site preparation). Probability of exceeding 200 cm, number of seedlings, and percentage of number of seedlings in each condition are also shown.
Forests 14 00784 g009
Table 1. Summary of planting stock types.
Name 1Bareroot (1+1)Bareroot (1+2)LIECO390 (0+1)JFA300.C (1+2)JFA300.E (1+2)HRO200 (1+1)BCC150 (0+2)
TypeBarerootBarerootContainerContainerContainerContainerContainer
Seedling age 21 + 11 + 20 + 11 + 21 + 21 + 10 + 2
Volume of cell (mL)--390300300200150
Density in container (cells m−2)--198178178112362
Side slit--YesNoNoYesYes
Product name of container--LIECO 15 blueJFA300JFA300HRO200BCC SideSlit cell 150
Nursery location in HokkaidoCentralCentralWesternCentralEasternNortheasternNorthern
Seed collection year
and town
2013
Ashoro
2011
Yuubetsu
2015
Aibetsu
2015
Asahikawa
2015
Bihoro
2015
Aibetsu
Unknown
Planted plotBothBothMulcherMulcherMulcherBothBoth
1 The label of a container-grown seedling comprises the product name and the cell capacity. The number in parentheses indicates the seedling age. 2 Seedling age is expressed as the number of years at sowing site + years at transplanting site. The latter number represents years in the field nursery and in the container after transplanting for bareroot and container seedlings, respectively.
Disclaimer/Publisher’s Note: The statements, opinions and data contained in all publications are solely those of the individual author(s) and contributor(s) and not of MDPI and/or the editor(s). MDPI and/or the editor(s) disclaim responsibility for any injury to people or property resulting from any ideas, methods, instructions or products referred to in the content.

