


Exploring the Dynamic Impact of Extreme Climate Events on Vegetation Productivity under Climate Change


Abstract
:1. Introduction
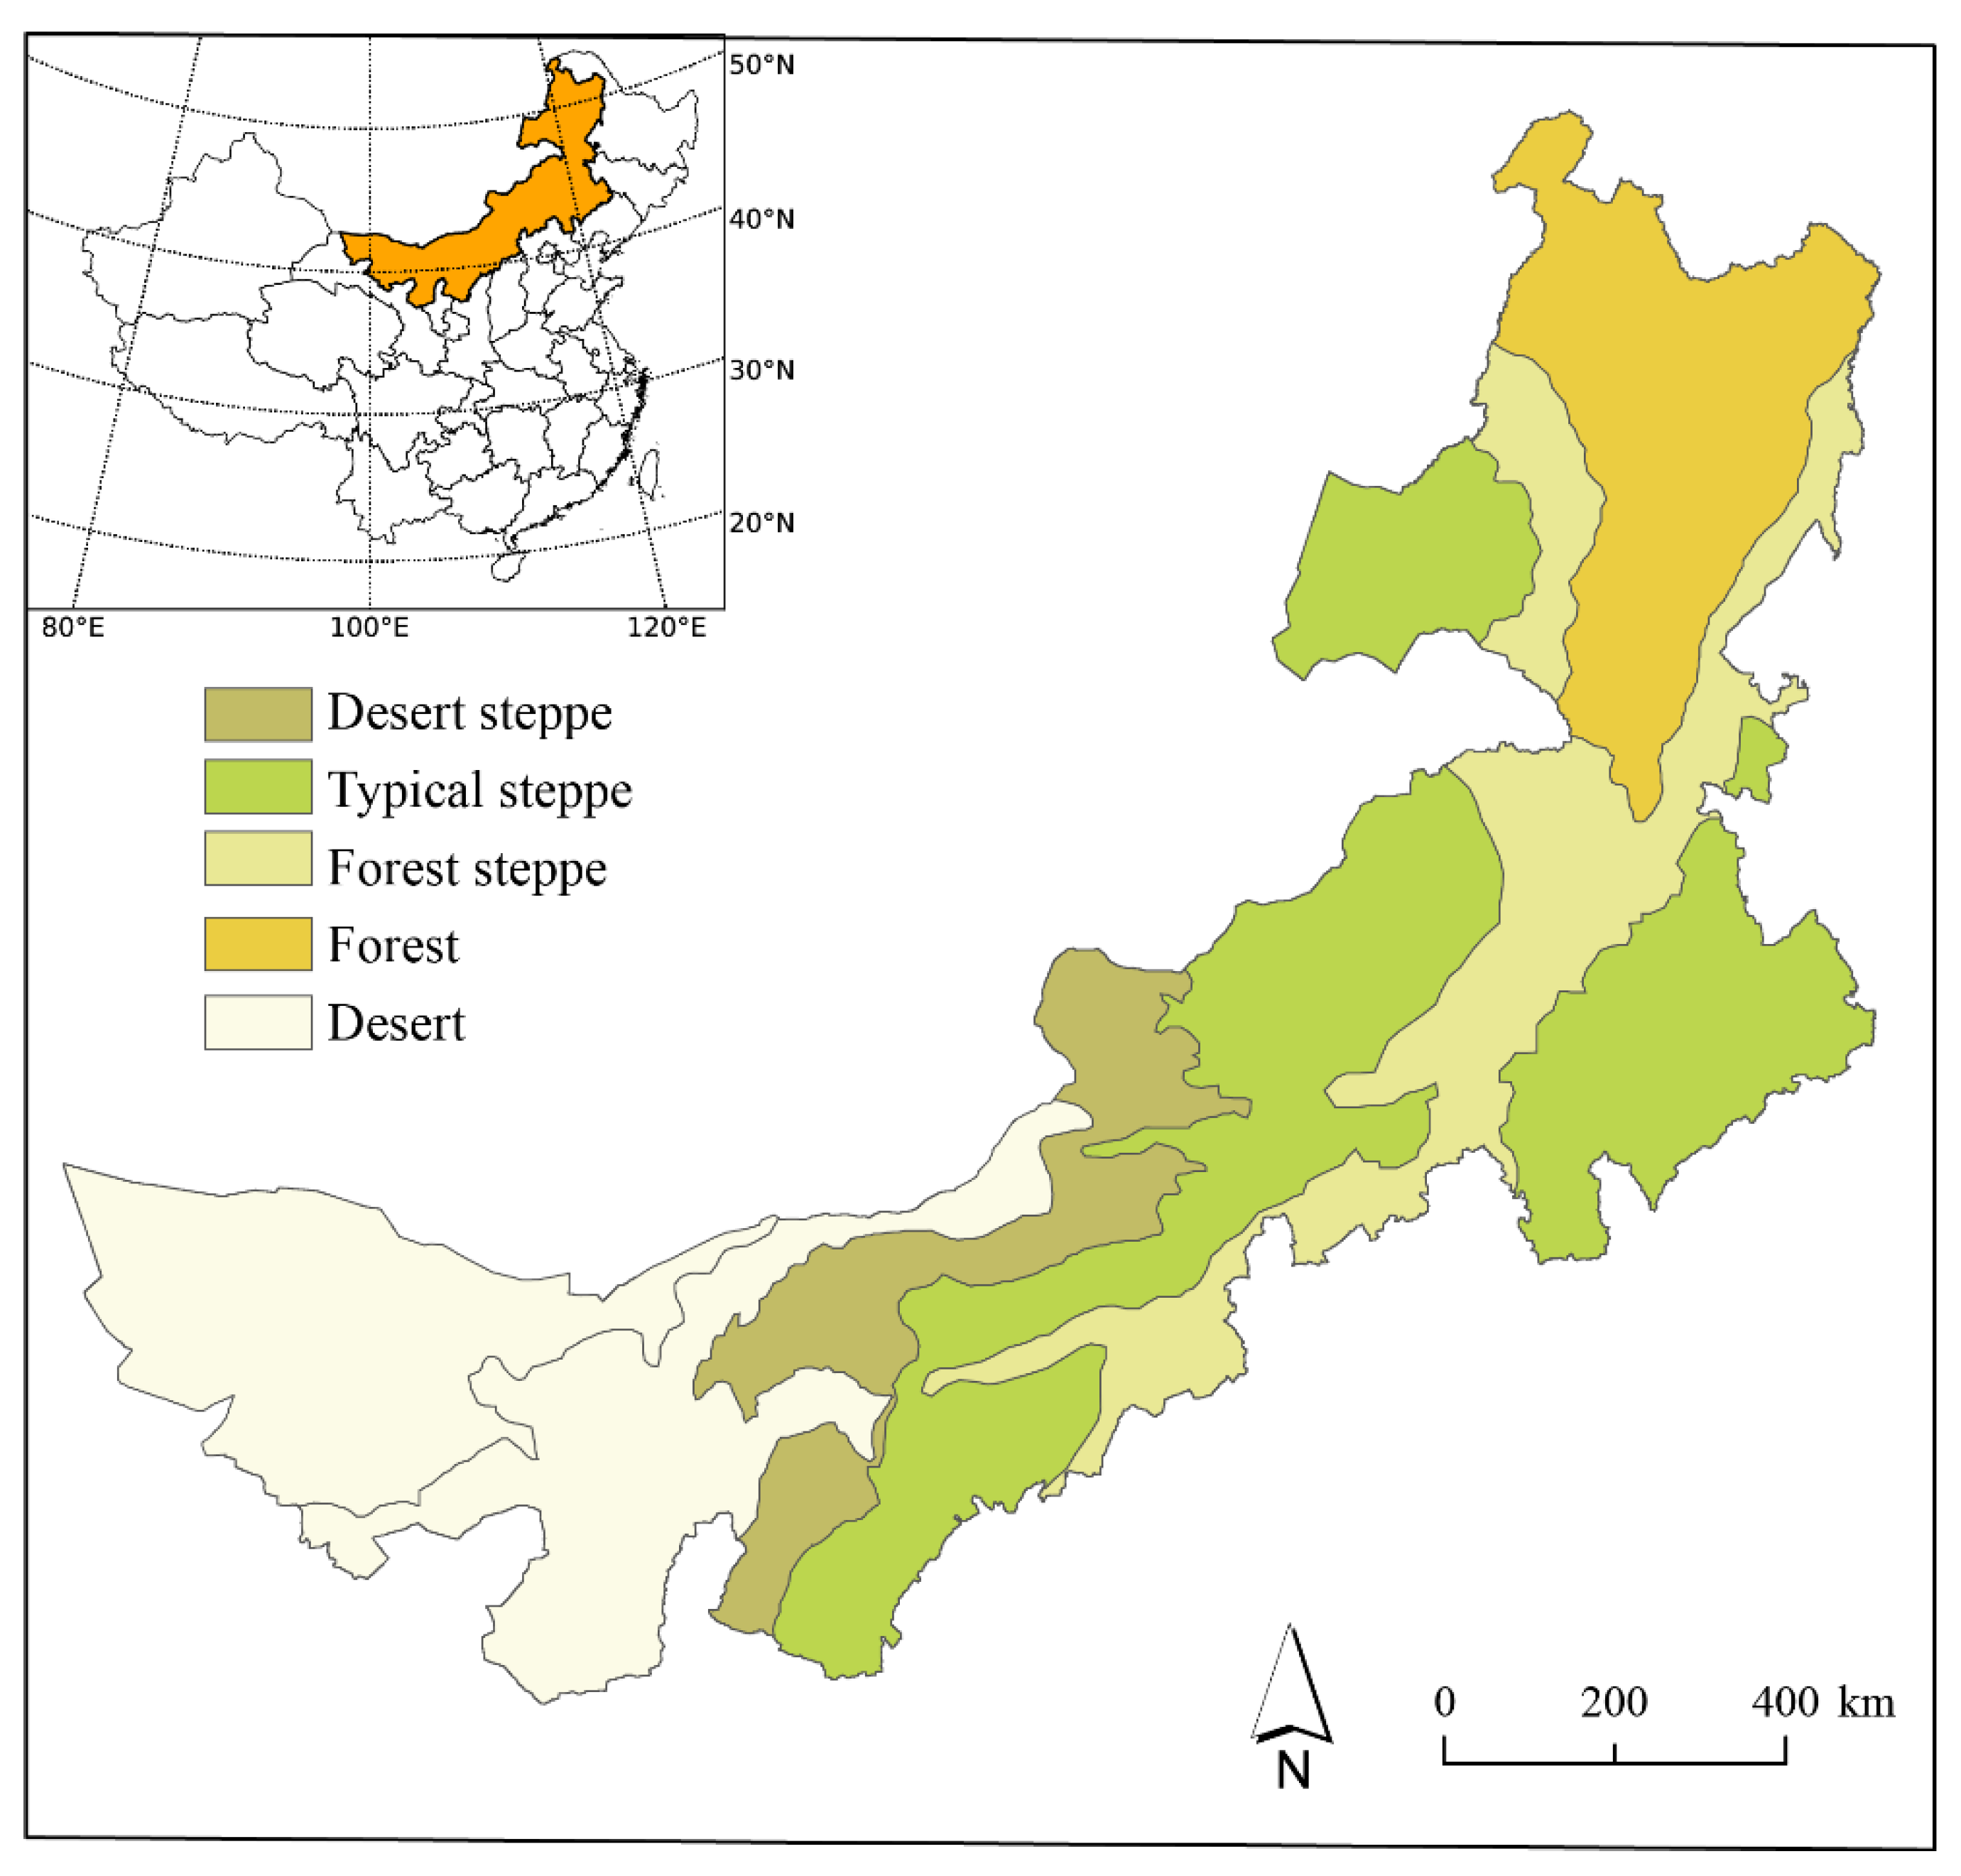
2. Research Area
3. Materials and Methods
3.1. Meteorological Data and Preprocessing
3.2. NDVI Data and Preprocessing
3.3. Maximum Value Composites
3.4. Dependence Modelling via Copulas
4. Results
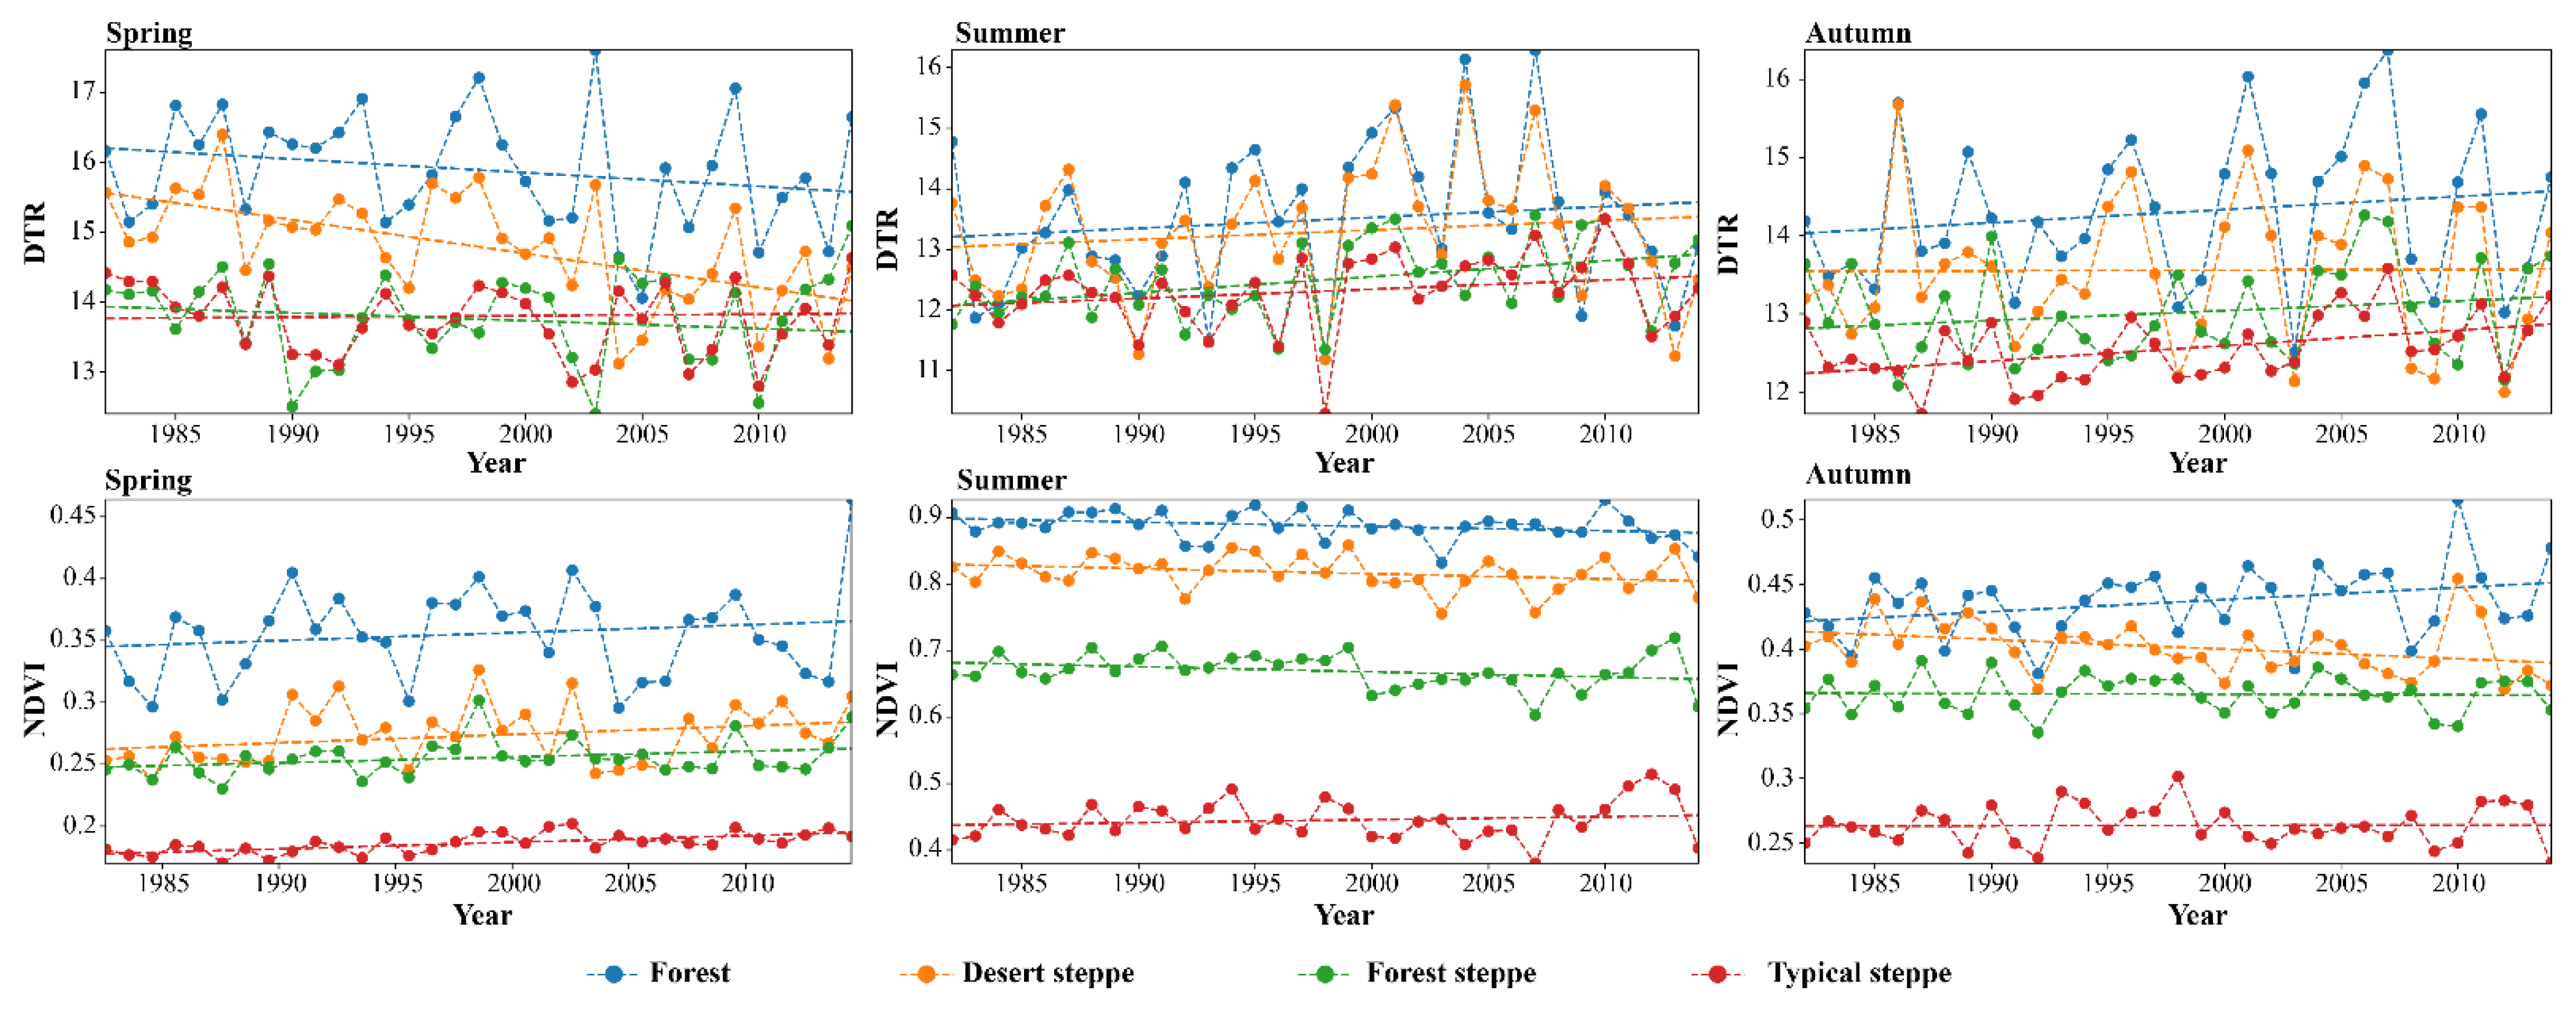
4.1. Trend Analysis of Seasonal DTR and NDVI
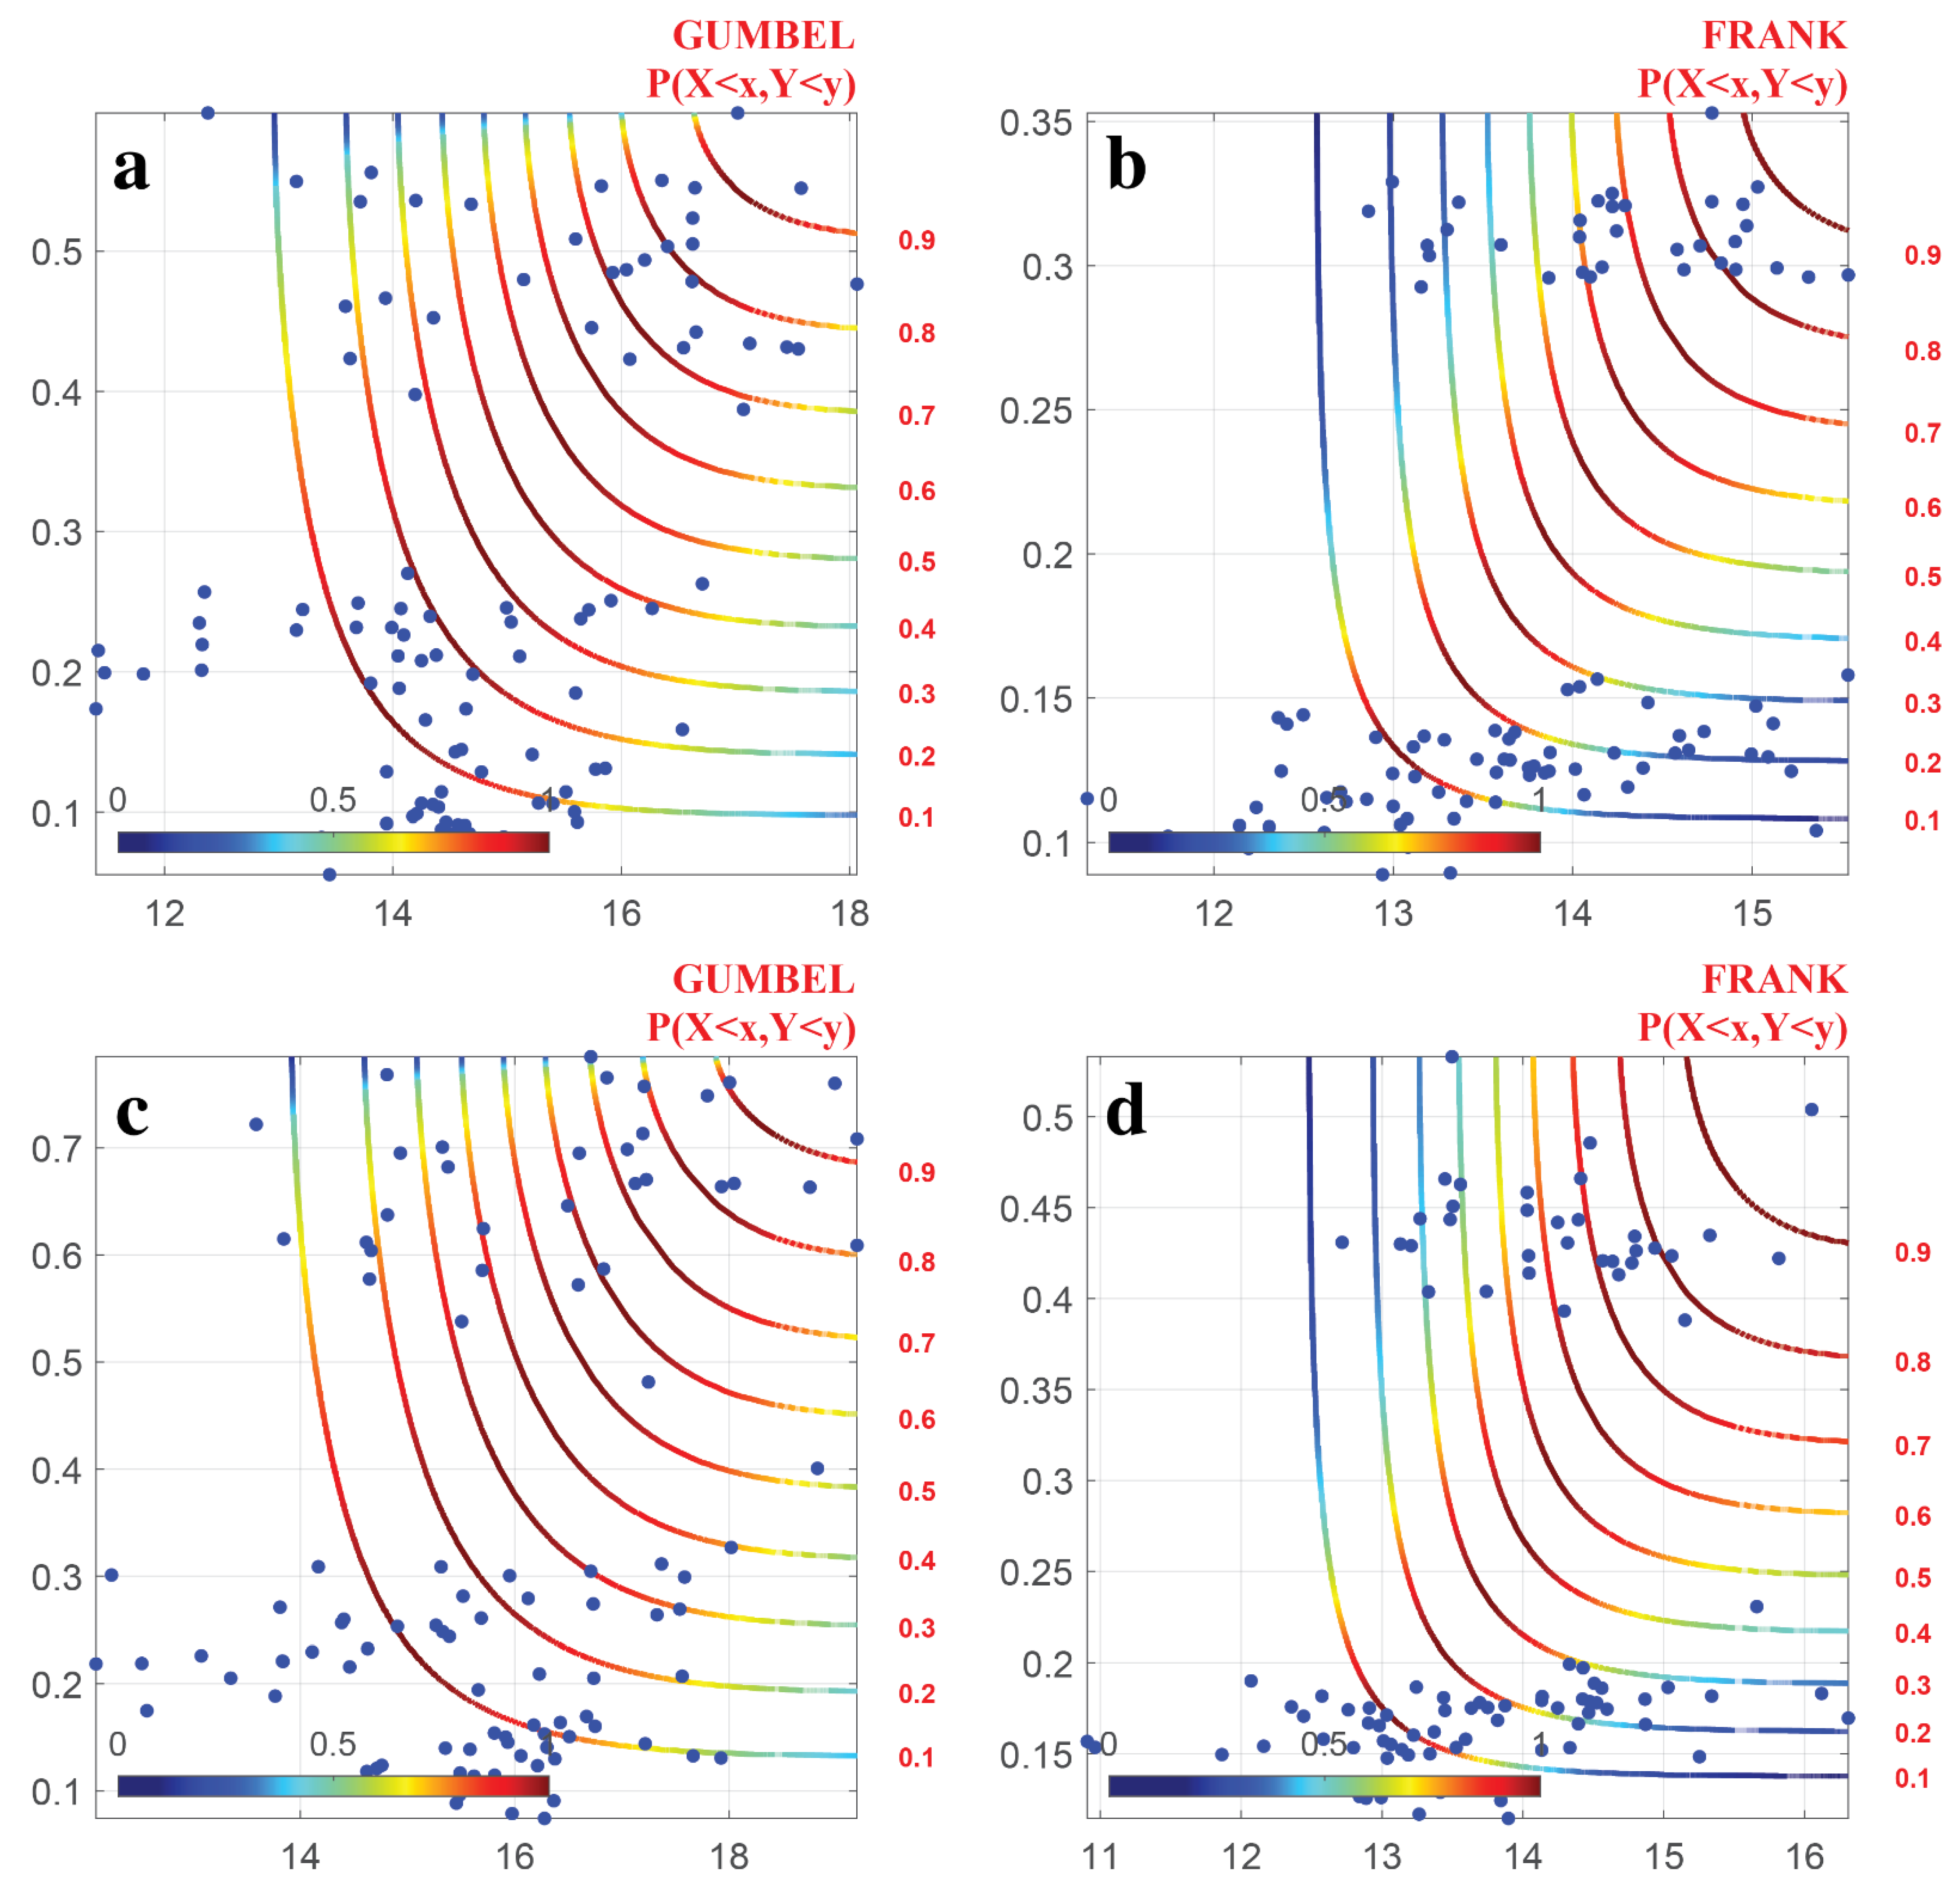
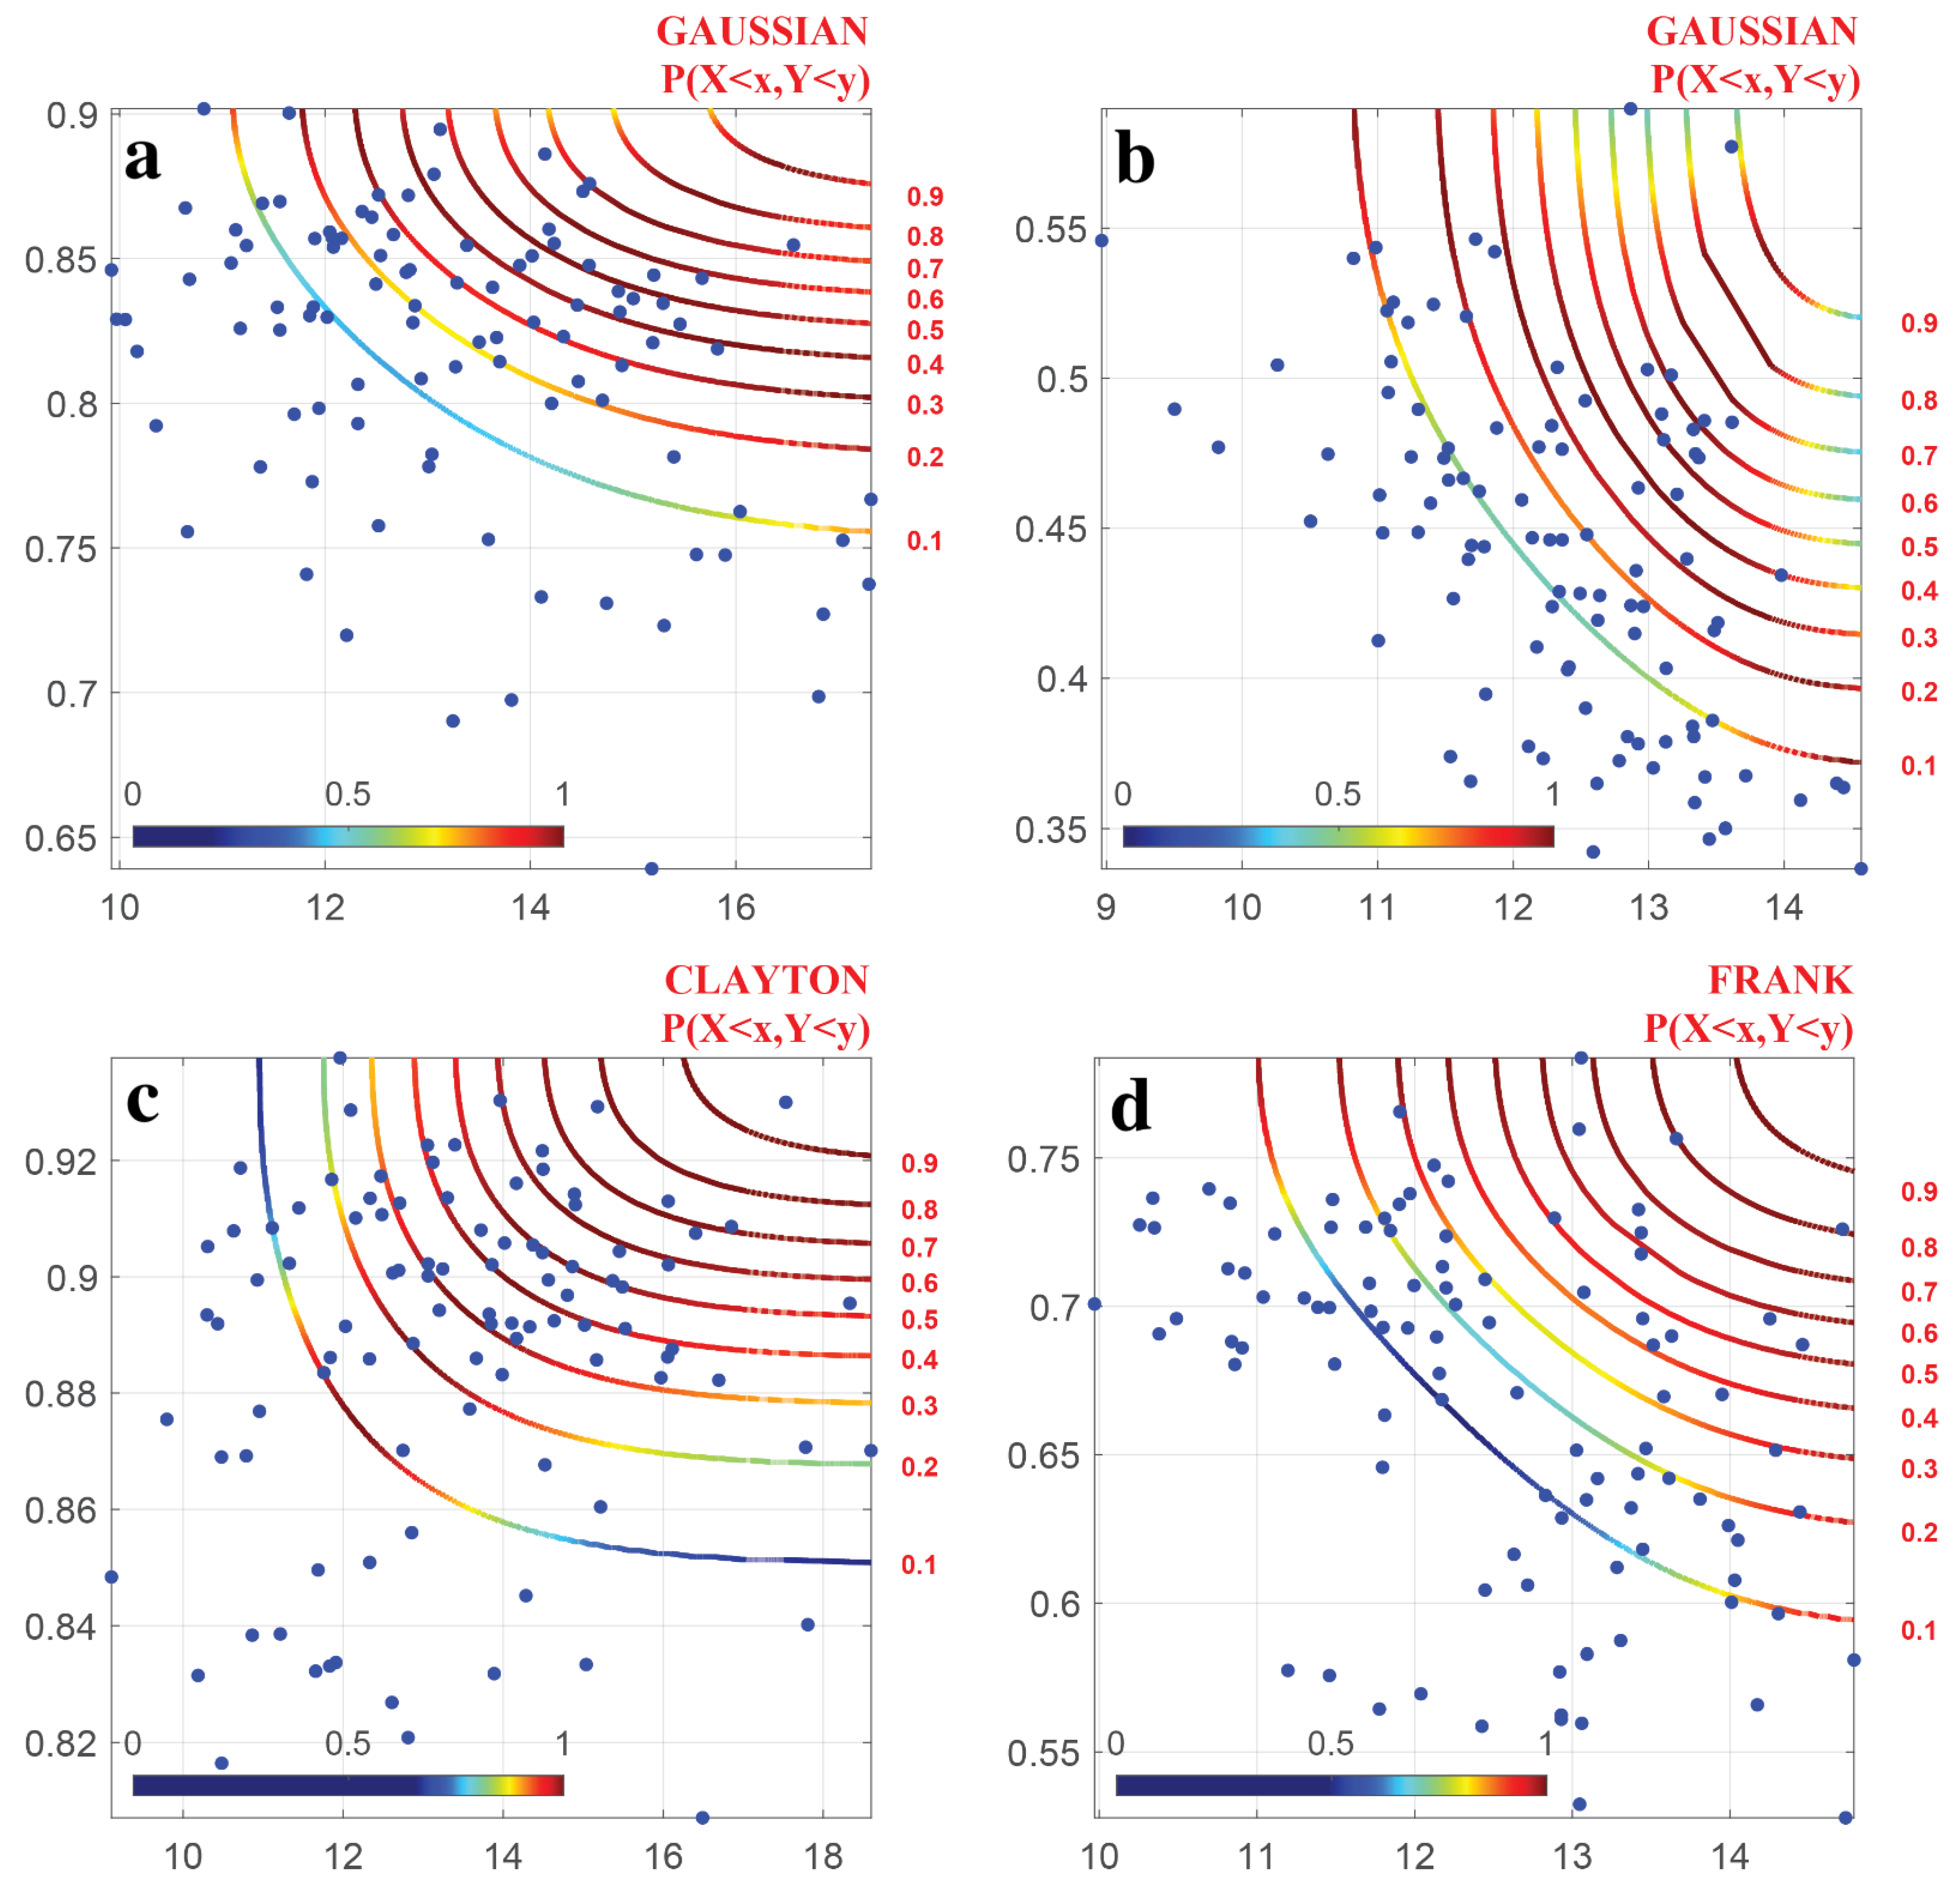
4.2. Dependency between DTR and NDVI
4.3. Parameter Estimation and Selection of Copula Function
5. Discussion
5.1. Change of NDVI in Different Land Use Types
5.2. Response of NDVI to DTR
5.3. Uncertainties in This Study
6. Conclusions
- (1)
- During 1982 to 2014, seasonal DTR trends indicated significant increases during summer and autumn, while showing decreases in spring for the four land types. Summer had the highest overall NDVI with a slightly decreasing trend, while the NDVI of forest, forest-steppe, typical steppe, and desert steppe showed an overall increasing trend. During summer, the NDVI of the forest, forest-steppe and desert steppe decreased, and that of the typical steppe increased. During autumn, the NDVI of the forest increased while others decreased.
- (2)
- We found that the effects of DTR on vegetation in different land types showed seasonal variations. NDVI was found to be highly responsive to DTR throughout the growing season. Vegetation in the typical steppe was more sensitive to changes in DTR as it promotes vegetation growth and development. In autumn and summer, DTR showed positive correlations with NDVI in forest and forest-steppe, while the coefficient of DTR and NDVI was lower than 0.3 during spring and summer.
- (3)
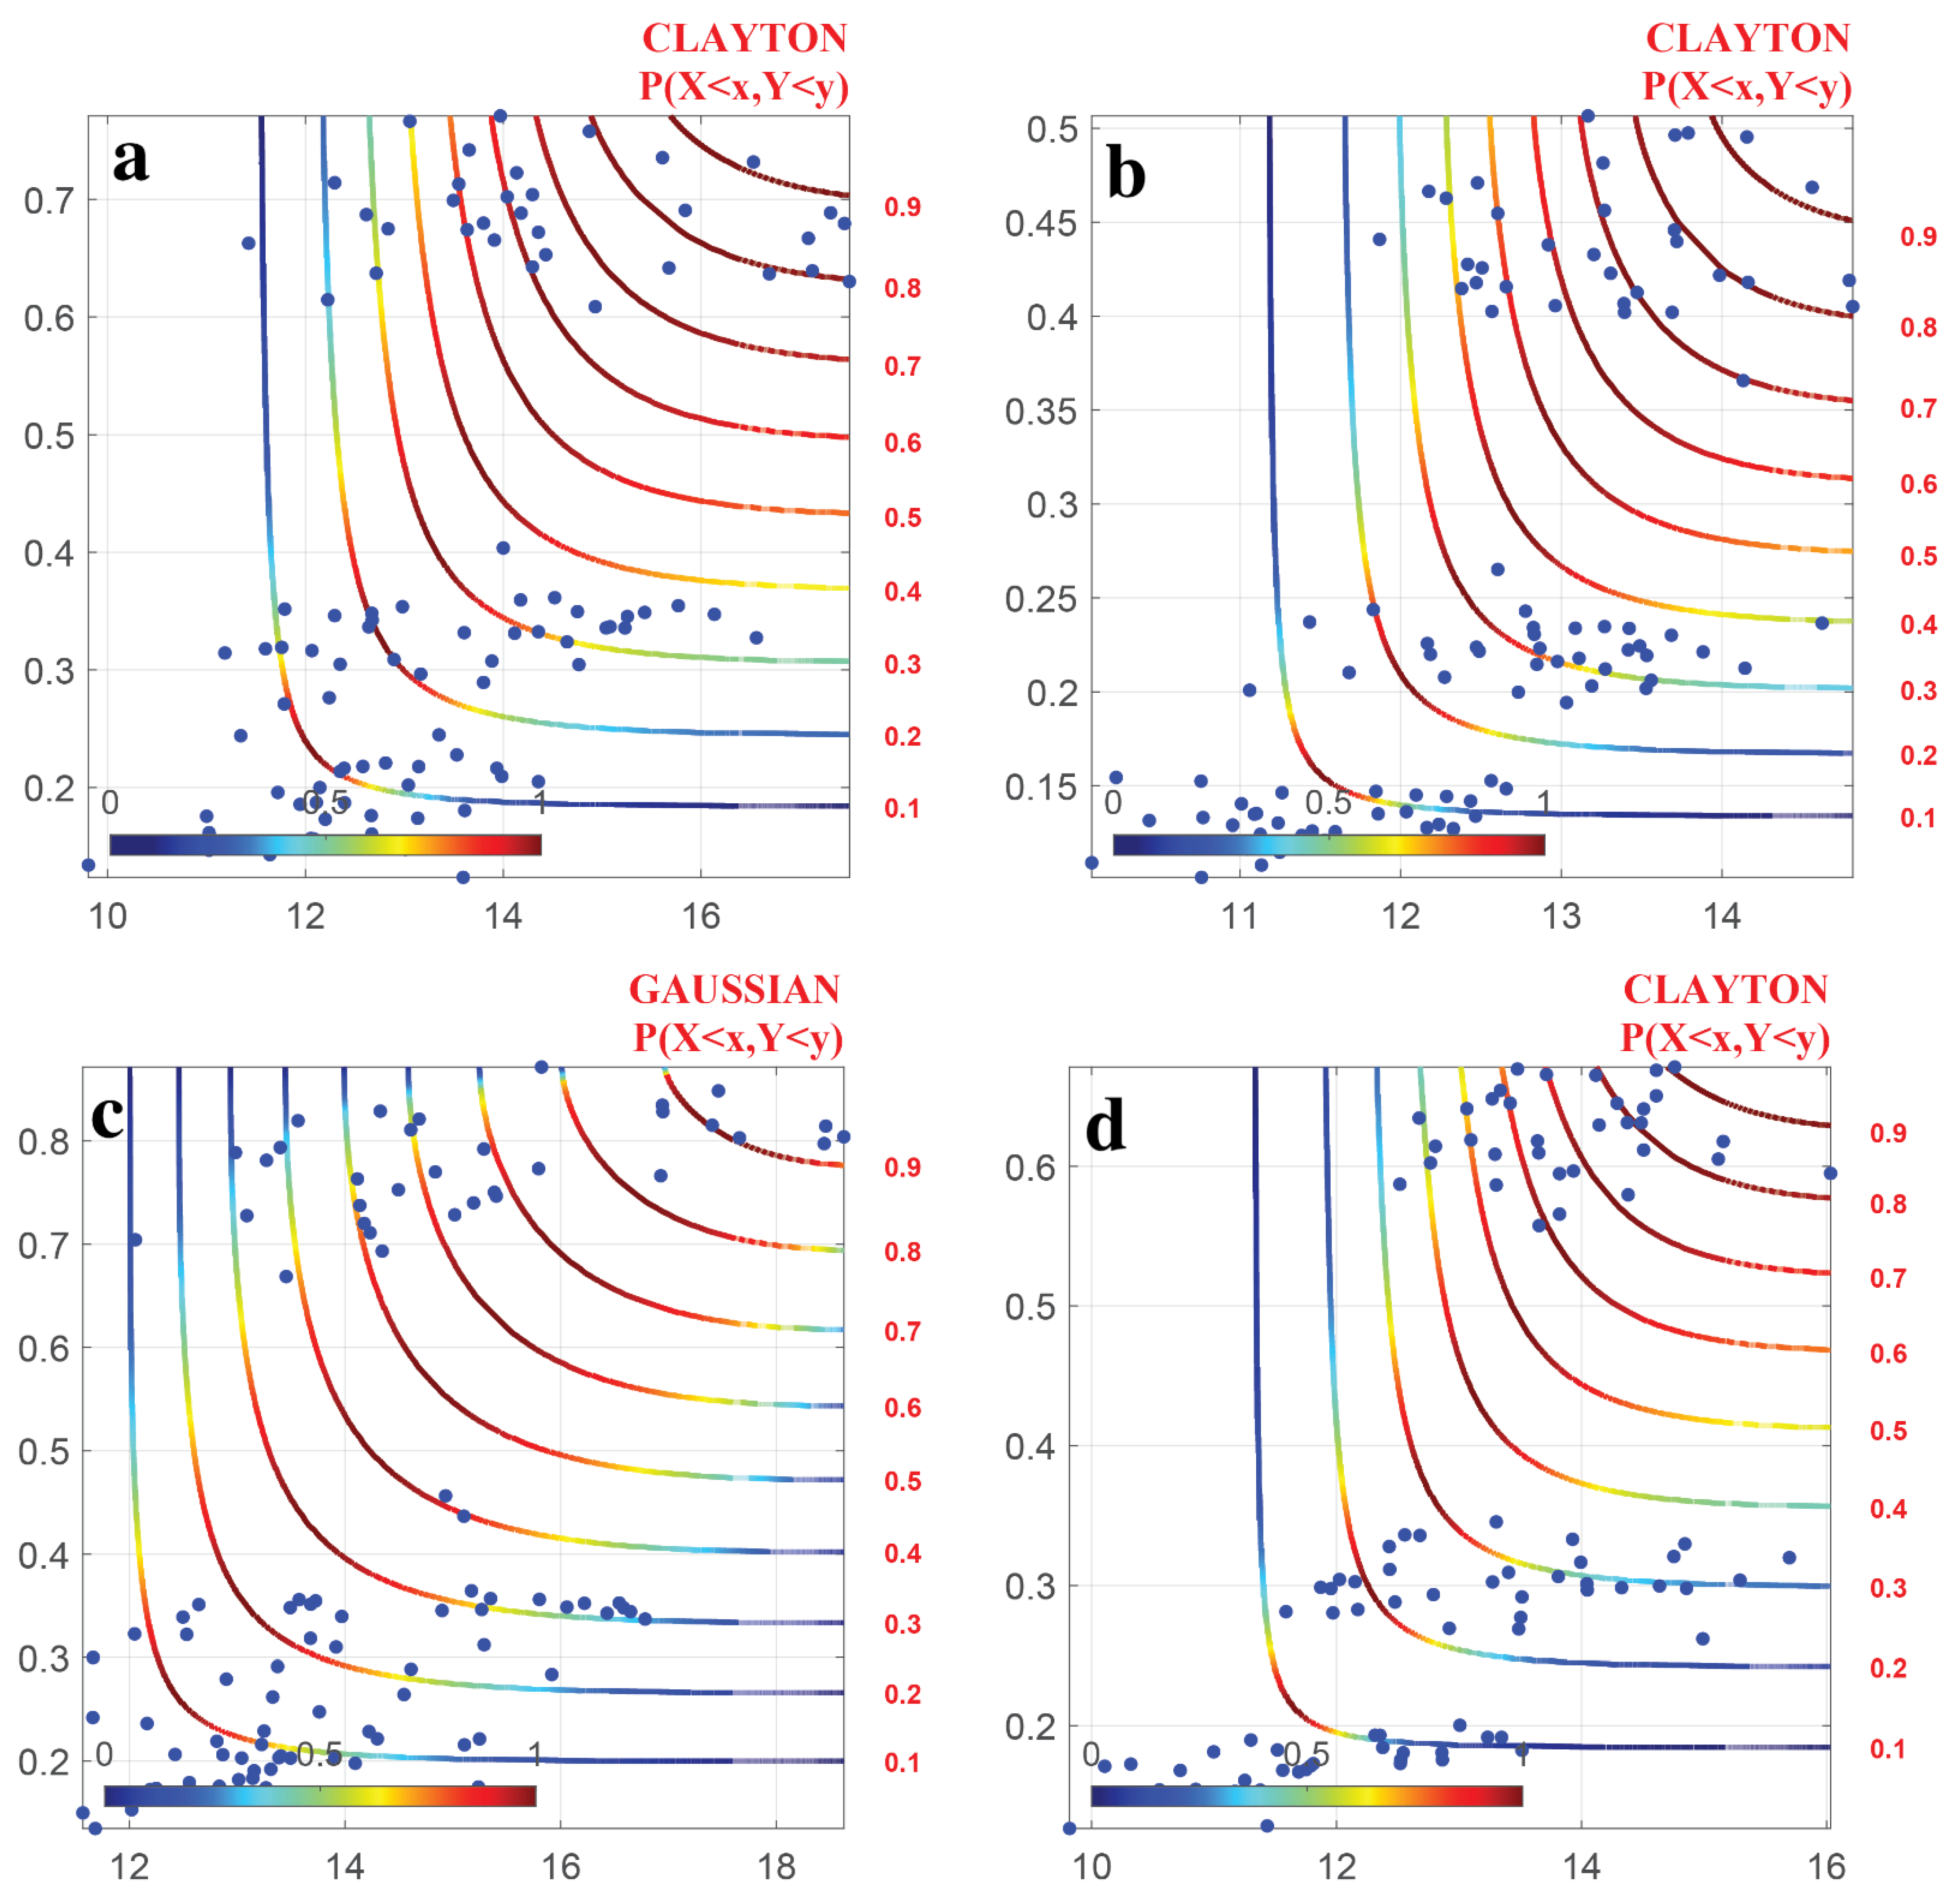
- The joint distribution of DTR and NDVI indicate that when DTR and NDVI reached their minimum values, DTR had little effect on NDVI, while they had a significant impact on NDVI when they reached their maximum values. The probability of plant growth inhibition was higher when the climate factor exceeded a certain threshold.
Author Contributions
Funding
Data Availability Statement
Acknowledgments
Conflicts of Interest
References
- Jiang, B.; Liang, S.; Yuan, W. Observational evidence for impacts of vegetation change on local surface climate over northern China using the Granger causality test. J. Geophys. Res. Biogeosciences 2015, 120, 1–12. [Google Scholar] [CrossRef]
- Zhao, Q.; Ma, X.; Liang, L.; Yao, W. Spatial–Temporal Variation Characteristics of Multiple Meteorological Variables and Vegetation over the Loess Plateau Region. Appl. Sci. 2020, 10, 1000. [Google Scholar] [CrossRef] [Green Version]
- Shen, M.; Piao, S.; Jeong, S.-J.; Zhou, L.; Zeng, Z.; Ciais, P.; Chen, D.; Huang, M.; Jin, C.-S.; Li, L.Z. Evaporative cooling over the Tibetan Plateau induced by vegetation growth. Proc. Natl. Acad. Sci. USA 2015, 112, 9299–9304. [Google Scholar] [CrossRef] [PubMed] [Green Version]
- Piao, S.; Nan, H.; Huntingford, C.; Ciais, P.; Friedlingstein, P.; Sitch, S.; Peng, S.; Ahlström, A.; Canadell, J.G.; Cong, N. Evidence for a weakening relationship between interannual temperature variability and northern vegetation activity. Nat. Commun. 2014, 5, 5018. [Google Scholar] [CrossRef] [Green Version]
- Piao, S.; Liu, Q.; Chen, A.; Janssens, I.A.; Fu, Y.; Dai, J.; Liu, L.; Lian, X.; Shen, M.; Zhu, X. Plant phenology and global climate change: Current progresses and challenges. Glob. Chang. Biol. 2019, 25, 1922–1940. [Google Scholar] [CrossRef]
- Piao, S.; Mohammat, A.; Fang, J.; Cai, Q.; Feng, J. NDVI-based increase in growth of temperate grasslands and its responses to climate changes in China. Glob. Environ. Chang. 2006, 16, 340–348. [Google Scholar] [CrossRef]
- Tang, R.; He, B.; Chen, H.W.; Chen, D.; Chen, Y.; Fu, Y.H.; Yuan, W.; Li, B.; Li, Z.; Guo, L. Increasing terrestrial ecosystem carbon release in response to autumn cooling and warming. Nat. Clim. Chang. 2022, 12, 380–385. [Google Scholar] [CrossRef]
- Dusenge, M.E.; Duarte, A.G.; Way, D.A. Plant carbon metabolism and climate change: Elevated CO2 and temperature impacts on photosynthesis, photorespiration and respiration. New Phytol. 2019, 221, 32–49. [Google Scholar] [CrossRef] [Green Version]
- Kong, D.; Miao, C.; Duan, Q.; Lei, X.; Li, H. Vegetation-Climate Interactions on the Loess Plateau: A Nonlinear Granger Causality Analysis. J. Geophys. Res. Atmos. 2018, 123, 11068–11079. [Google Scholar] [CrossRef]
- Tan, J.; Piao, S.; Chen, A.; Zeng, Z.; Ciais, P.; Janssens, I.A.; Mao, J.; Myneni, R.B.; Peng, S.; Peñuelas, J. Seasonally different response of photosynthetic activity to daytime and night-time warming in the Northern Hemisphere. Glob. Change Biol. 2015, 21, 377–387. [Google Scholar] [CrossRef]
- He, G.; Li, Z. Asymmetry of Daytime and Nighttime Warming in Typical Climatic Zones along the Eastern Coast of China and Its Influence on Vegetation Activities. Remote Sens. 2020, 12, 3604. [Google Scholar] [CrossRef]
- He, G.; Zhen, X.; Li, Z.; Shen, W.; Han, J.; Zhang, L.; Li, X.; Zhang, R. Influence of variations of hydrothermal conditions on normalized difference vegetation index in typical temperature zones along the east coast of China. Front. Earth Sci. 2020, 8, 574101. [Google Scholar] [CrossRef]
- Cui, L.; Wang, L.; Qu, S.; Singh, R.P.; Lai, Z.; Yao, R. Spatiotemporal extremes of temperature and precipitation during 1960–2015 in the Yangtze River Basin (China) and impacts on vegetation dynamics. Theor. Appl. Climatol. 2019, 136, 675–692. [Google Scholar] [CrossRef]
- Luo, M.; Sa, C.; Meng, F.; Duan, Y.; Liu, T.; Bao, Y. Assessing extreme climatic changes on a monthly scale and their implications for vegetation in Central Asia. J. Clean. Prod. 2020, 271, 122396. [Google Scholar] [CrossRef]
- Wang, S.; Liu, Q.; Huang, C. Vegetation Change and Its Response to Climate Extremes in the Arid Region of Northwest China. Remote Sens. 2021, 13, 1230. [Google Scholar] [CrossRef]
- Peng, S.; Piao, S.; Ciais, P.; Myneni, R.B.; Chen, A.; Chevallier, F.; Dolman, A.J.; Janssens, I.A.; Penuelas, J.; Zhang, G. Asymmetric effects of daytime and night-time warming on Northern Hemisphere vegetation. Nature 2013, 501, 88–92. [Google Scholar] [CrossRef]
- Liu, Z.; Peng, C.; Xiang, W.; Tian, D.; Deng, X.; Zhao, M. Application of artificial neural networks in global climate change and ecological research: An overview. Chin. Sci. Bull. 2010, 55, 3853–3863. [Google Scholar] [CrossRef]
- Bouraoui, F.; Vachaud, G.; Li, L.; Le Treut, H.; Chen, T. Evaluation of the impact of climate changes on water storage and groundwater recharge at the watershed scale. Clim. Dyn. 1999, 15, 153–161. [Google Scholar] [CrossRef]
- Vicente-Serrano, S.M.; Gouveia, C.; Camarero, J.J.; Beguería, S.; Trigo, R.; López-Moreno, J.I.; Azorín-Molina, C.; Pasho, E.; Lorenzo-Lacruz, J.; Revuelto, J. Response of vegetation to drought time-scales across global land biomes. Proc. Natl. Acad. Sci. USA 2013, 110, 52–57. [Google Scholar] [CrossRef] [Green Version]
- Zhao, J.; Huang, S.; Huang, Q.; Wang, H.; Leng, G.; Peng, J.; Dong, H. Copula-based abrupt variations detection in the relationship of seasonal vegetation-climate in the Jing River Basin, China. Remote Sens. 2019, 11, 1628. [Google Scholar] [CrossRef] [Green Version]
- Wu, Y.; Zhang, X.; Fu, Y.; Hao, F.; Yin, G. Response of vegetation to changes in temperature and precipitation at a semi-arid area of Northern China based on multi-statistical methods. Forests 2020, 11, 340. [Google Scholar] [CrossRef] [Green Version]
- Li, H.; Li, Y.; Huang, G.; Sun, J. Quantifying effects of compound dry-hot extremes on vegetation in Xinjiang (China) using a vine-copula conditional probability model. Agric. For. Meteorol. 2021, 311, 108658. [Google Scholar] [CrossRef]
- Won, J.; Seo, J.; Kim, S. A copula model integrating atmospheric moisture demand and supply for vegetation vulnerability mapping. Sci. Total Environ. 2022, 812, 151464. [Google Scholar] [CrossRef]
- Singh, B.R.; Singh, O. Study of impacts of global warming on climate change: Rise in sea level and disaster frequency. In Global Warming—Impacts and Future Perspective; Singh, B.R., Singh, O., Eds.; Intech Open: London, UK, 2012; p. 5816. [Google Scholar]
- Li, C.; Wang, J.; Hu, R.; Yin, S.; Bao, Y.; Ayal, D.Y. Relationship between vegetation change and extreme climate indices on the Inner Mongolia Plateau, China, from 1982 to 2013. Ecol. Indic. 2018, 89, 101–109. [Google Scholar] [CrossRef]
- Li, C.; Leal Filho, W.; Yin, J.; Hu, R.; Wang, J.; Yang, C.; Yin, S.; Bo, Y.; Ayal, D.Y. Assessing vegetation response to multi-time-scale drought across inner Mongolia plateau. J. Clean. Prod. 2018, 179, 210–216. [Google Scholar] [CrossRef]
- Li, C.; Wang, J.; Yin, S.; Bao, Y.; Li, Y.; Yu, S. Drought hazard assessment and possible adaptation options for typical steppe grassland in Xilingol League, Inner Mongolia, China. Theor. Appl. Climatol. 2019, 136, 1339–1346. [Google Scholar] [CrossRef]
- Na, R.; Na, L.; Du, H.; He, H.S.; Shan, Y.; Zong, S.; Huang, L.; Yang, Y.; Wu, Z. Vegetation Greenness Variations and Response to Climate Change in the Arid and Semi-Arid Transition Zone of the Mongo-Lian Plateau during 1982–2015. Remote Sens. 2021, 13, 4066. [Google Scholar] [CrossRef]
- Sklar, A. Random variables, joint distribution functions, and copulas. Kybernetika 1973, 9, 449–460. [Google Scholar]
- Salvadori, G.; De Michele, C. Frequency analysis via copulas: Theoretical aspects and applications to hydrological events. Water Resour. Res. 2004, 40, W12511. [Google Scholar] [CrossRef]
- Sun, D.; Pinker, R.T.; Kafatos, M. Diurnal temperature range over the United States: A satellite view. Geophys. Res. Lett. 2006, 33, L05705. [Google Scholar] [CrossRef] [Green Version]
- Yuan, G.; Zhang, L.; Liang, J.; Cao, X.; Guo, Q.; Yang, Z. Impacts of initial soil moisture and vegetation on the diurnal temperature range in arid and semiarid regions in China. J. Geophys. Res. Atmos. 2017, 122, 11568–11583. [Google Scholar] [CrossRef]


| Copula Function Name | Mathematical Description |
|---|---|
| Gaussian | |
| T | |
| Clayton | |
| Frank | |
| Gumbel |
| Land Type | Season | Kendall | Spearman |
|---|---|---|---|
| Desert steppe | Spring | 0.0509 | 0.0924 |
| Forest | Spring | 0.1526 | 0.2284 |
| Forest steppe | Spring | 0.2842 | 0.4364 |
| Typical steppe | Spring | 0.3608 | 0.5137 |
| Desert steppe | Summer | 0.3955 | 0.5595 |
| Forest | Summer | 0.0666 | 0.1078 |
| Forest steppe | Summer | 0.2684 | 0.4049 |
| Typical steppe | Summer | 0.3432 | 0.4736 |
| Desert steppe | Autumn | 0.2244 | 0.3608 |
| Forest | Autumn | 0.4282 | 0.6073 |
| Forest steppe | Autumn | 0.4966 | 0.6946 |
| Typical steppe | Autumn | 0.4523 | 0.6565 |
Disclaimer/Publisher’s Note: The statements, opinions and data contained in all publications are solely those of the individual author(s) and contributor(s) and not of MDPI and/or the editor(s). MDPI and/or the editor(s) disclaim responsibility for any injury to people or property resulting from any ideas, methods, instructions or products referred to in the content. |
© 2023 by the authors. Licensee MDPI, Basel, Switzerland. This article is an open access article distributed under the terms and conditions of the Creative Commons Attribution (CC BY) license (https://creativecommons.org/licenses/by/4.0/).
Share and Cite
Xu, H.; Tan, J.; Li, C.; Niu, Y.; Wang, J. Exploring the Dynamic Impact of Extreme Climate Events on Vegetation Productivity under Climate Change. Forests 2023, 14, 744. https://doi.org/10.3390/f14040744
Xu H, Tan J, Li C, Niu Y, Wang J. Exploring the Dynamic Impact of Extreme Climate Events on Vegetation Productivity under Climate Change. Forests. 2023; 14(4):744. https://doi.org/10.3390/f14040744
Chicago/Turabian StyleXu, Hanqing, Jinkai Tan, Chunlan Li, Yiying Niu, and Jun Wang. 2023. "Exploring the Dynamic Impact of Extreme Climate Events on Vegetation Productivity under Climate Change" Forests 14, no. 4: 744. https://doi.org/10.3390/f14040744