Article

Elucidating SNP-Based Population Structure and Genetic Diversity of Bruguiera gymnorhiza (L.) Savigny in Thailand

by
Panthita Ruang-areerate
1,
Chutima Sonthirod
1,
Duangjai Sangsrakru
1,
Pitchaporn Waiyamitra
1,
Chatree Maknual
2,
Poonsri Wanthongchai
2,
Pranom Chomriang
2,
Wirulda Pootakham
1 and
Sithichoke Tangphatsornruang
1,*
1
National Omics Center, National Science and Technology Development Agency (NSTDA), Pathum Thani 12120, Thailand
2
Department of Marine and Coastal Resources, The Government Complex, Chaengwatthana Rd., Thung Song Hong, Bangkok 10210, Thailand
*
Author to whom correspondence should be addressed.
Forests 2023, 14(4), 693; https://doi.org/10.3390/f14040693
Submission received: 31 January 2023 / Revised: 23 March 2023 / Accepted: 27 March 2023 / Published: 28 March 2023
(This article belongs to the Special Issue Genetic Diversity and Conservation of Forest Species)

Abstract

:
Bruguiera gymnorhiza (L.) Savigny is one of the most important and widespread mangrove species in the Indo-West Pacific region. Here, the population structure and genetic diversity of B. gymnorhiza along the coastlines of Thailand were examined. A total of 73 B. gymnorhiza accessions in 15 provinces were sequenced using RAD-seq to generate their SNPs. Based on the high-quality SNPs, the topology of the maximum likelihood phylogenetic tree clearly presented two genetically distinct groups corresponding to two geographic regions, the Gulf of Thailand and the Andaman Sea coasts. The results for the population structure provided by STRUCTURE and PCA also showed two main genetic clusters and their genetic admixture. A moderate genetic diversity was observed among the accessions, with average observed and expected heterozygosity values of 0.397 and 0.317, respectively. A high genetic differentiation (FST = 0.16, p < 0.001) between the two subpopulations was significantly found. An analysis of molecular variance revealed 83.95% of the genetic variation within populations and 16.05% of the genetic variation among populations. A high genetic variation within the populations and admixture may facilitate adaptation to local environments and climate changes. These results provide important information on the population genetic structure and genetic diversity of B. gymnorhiza in Thailand for further mangrove management.

1. Introduction

Mangroves are halophytes (salt-tolerant plants) that have adapted to the extreme conditions of intertidal zones in tropical and subtropical regions. They play important roles in coastal ecosystems, including coastal protection; carbon sequestration; metal absorption; nursery support; and food, wood, and medicine production [1,2]. Remarkably, mangrove forests absorb three to four times more carbon dioxide than other tropical forests [3]. Global mangrove forests have continually declined over several decades due to aquaculture, conversion to agriculture, overexploitation, and urban development [4,5]. The global area of mangrove forests was estimated at approximately 152,604 and 147,359 km2 in 1996 and 2020, respectively [6]. In Thailand, mangrove forests can be found mostly along the coastlines of the Andaman Sea and the Gulf of Thailand. Thailand’s mangrove forests lost more than 50% of their areas between 1961 and 1996 due to the expansion of shrimp and salt farms [7,8]. From 1996 to 2020, the areas of Thailand’s mangrove forests were estimated at approximately 2598 and 2528 km2, respectively [6]. Anthropogenic activities and climate change cause the reduction and fragmentation of mangrove forests, leading to the loss of mangrove genetic diversity. Therefore, the study of the genetic diversity of mangrove species is now essential, as understanding the population structure and remaining diversity is a key consideration for the conservation and management of this important coastal forest ecosystem.
Bruguiera gymnorhiza (L.) Savigny (large-leafed orange mangrove) is a true mangrove species belonging to the family Rhizophoraceae. It is an important mangrove species in the Indo-West Pacific (IWP) region [1,9], and it is widely distributed from Africa’s eastern coast through Asia to subtropical Australia and Oceania [1]. B. gymnorhiza has the ability to adapt to various conditions, such as a wide range of sunlight shade, saline soil, and water [1,10]. Its barks, leaves, fruits, and roots provide many medicinal properties that have been used in traditional medicines in several countries for treating common diseases, such as diarrhea, fever, malaria, and eye disease [11,12,13]. This mangrove is viviparous, producing seeds germinating on mother plants [1]. B. gymnorhiza is reported to possess a mixed mating system, mainly outcrossing with bird pollination [9,14,15,16]. B. gymnorhiza and other Bruguiera species have knee roots that emerge from the ground to exchange gases in oxygen-poor sediments. Among all Bruguiera species, B. gymnorhiza has the largest leaves (up to 25 cm in length) and solitary large flowers with calyces mostly pinkish to reddish [1,9,16,17]. Based on morphology, B. gymnorhiza is difficult to distinguish from other Bruguiera species, especially Bruguiera sexangula [1,18]. Currently, the whole and chloroplast genomes of the species have been sequenced [19,20,21]. Chloroplast sequence regions have been used to identify closely related species of mangroves and other plants [20,22,23]. Notably, molecular markers, such as nuclear genomic regions, chloroplast sequence regions, and random amplified polymorphic DNA (RAPD), can clearly distinguish B. gymnorhiza from B. sexangula [19,20,24,25].
For assessing the population structure and genetic diversity of plant species, the use of molecular markers is one of the most precise and efficient methods [26,27]. Among molecular markers, single-nucleotide polymorphisms (SNPs) have emerged as the most prevalent type of molecular marker in the postgenomic era due to their high density across genomes and rapidly falling costs [26,27,28]. SNPs, while individually less informative than microsatellites, are typically used in very large panels comprising hundreds or thousands of loci: they are therefore typically more precise than microsatellites in estimating genetic diversity, and they allow for the consideration of local adaptation [29,30]. SNP markers have been successfully used to evaluate the population structure and genetic diversity of mangrove species [31,32,33,34]. For B. gymnorhiza, the population structure and genetic diversity have been examined using various molecular markers, such as nuclear regions, chloroplast regions, RAPD, inter-simple sequence repeats, and microsatellites [14,25,35,36,37,38,39,40]; however, they have never been identified based on SNP markers. According to previous studies, the population structure of B. gymnorhiza was observed to be divided into two genetic clusters: the east and west clusters of the Malay Peninsula [37]. A low genetic diversity in B. gymnorhiza was found in the southwestern islands of Japan (Okinawa and Iriomote islands), South China, India, Indonesia, Malaysia, Micronesia, Thailand, and the IWP regions [14,35,36,37,39,40]. In contrast, a medium-to-high genetic diversity in B. gymnorhiza was observed in Rekawa of Sri Lanka [25] and in the Indian Sundarbans [38].
To date, there has been no study on the genetic diversity and population structure of the natural population of B. gymnorhiza along the coastlines of Thailand. In this study, we use high-quality SNP markers to assess the population genetic structure and diversity of 73 B. gymnorhiza accessions collected from 15 provinces along Thailand’s coasts. These results provide information on the level of genetic variation in B. gymnorhiza in Thailand to support mangrove forest conservation and management.

2. Materials and Methods

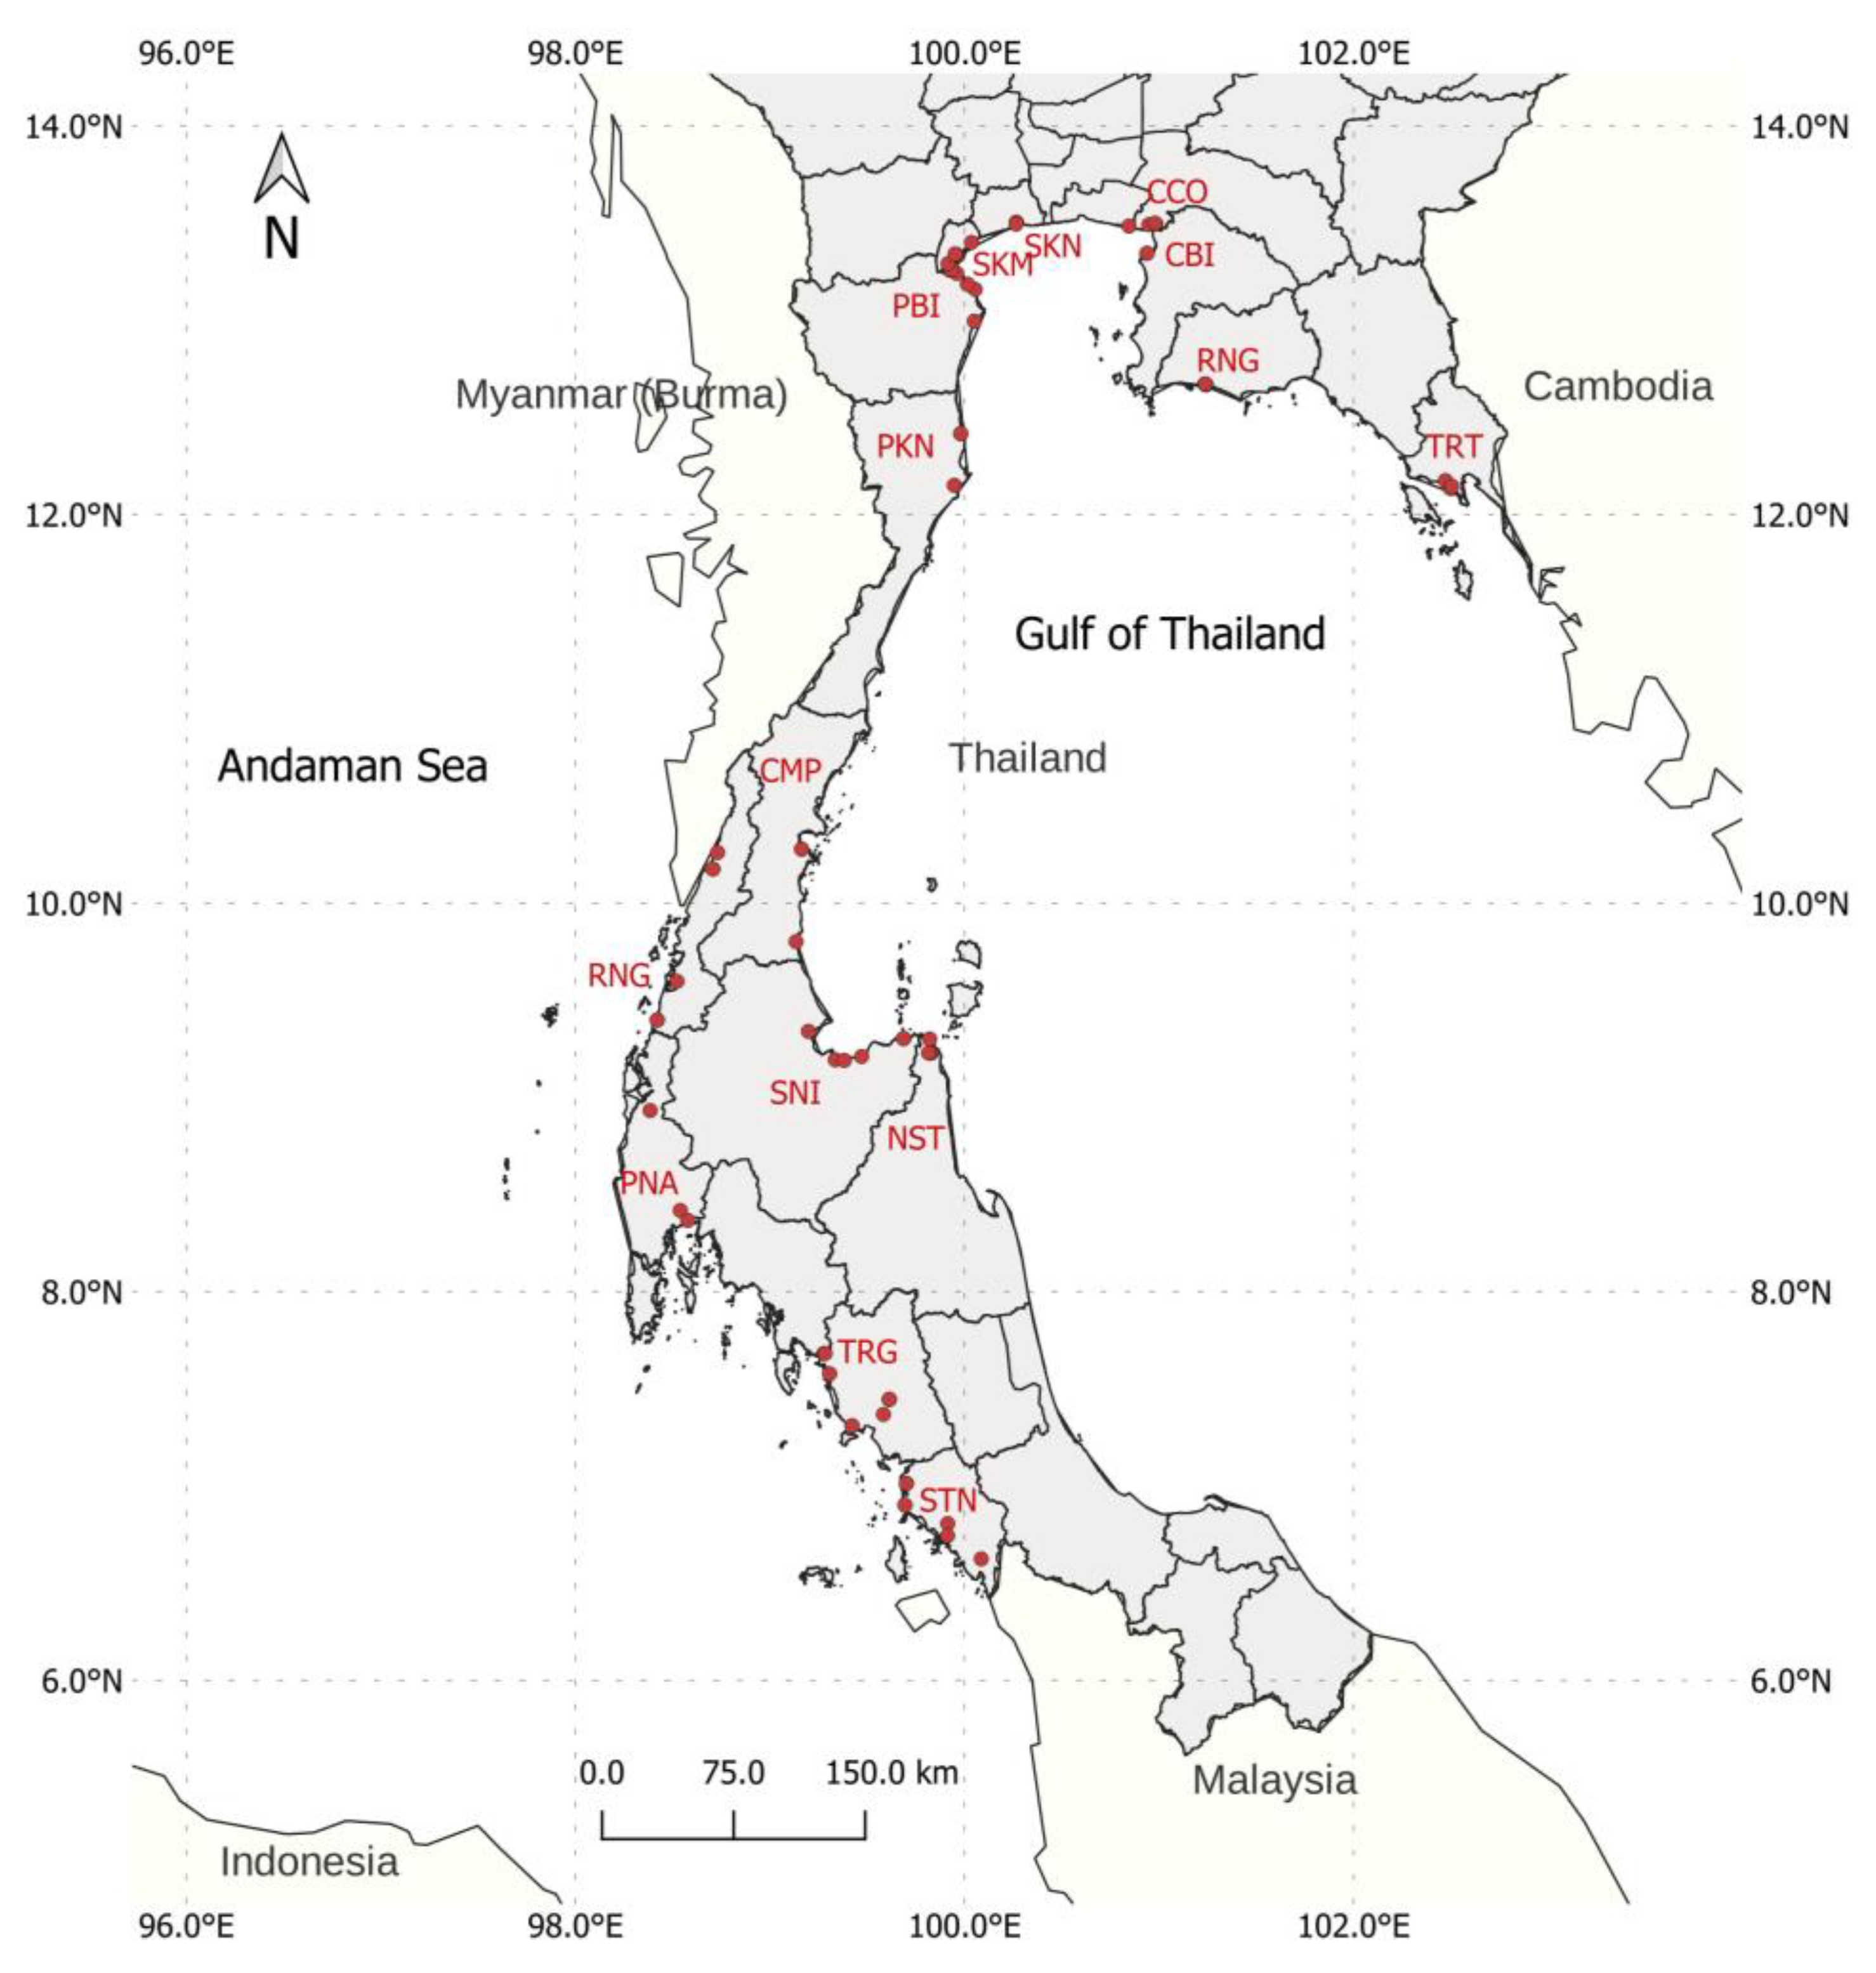
2.1. Sample Collection and DNA Extraction

In 2020 and 2021, the young leaves of 73 B. gymnorhiza accessions were collected in 15 provinces of Thailand (Table S1). A total of 47 sampling sites in 11 provinces (Chonburi: CBI, Chachoengsao: CCO, Chumphon: CMP, Nakhon Si Thammarat: NST, Phetchaburi: PBI, Prachuap Khiri Khan: PKN, Rayong: RYG, Samut Songkhram: SKM, Samut Sakhon: SKN, Surat Thani: SNI, and Trat: TRT) are located on the Gulf of Thailand, and 26 sampling sites in 4 provinces (Phang-nga: PNA, Ranong: RNG, Satun: STN, and Trang: TRG) are located on the Andaman Sea. The geographic locations of the sampling sites are presented in Figure 1, developed using QGIS software v3.24.2 (http://www.qgis.org, accessed on 6 December 2022).
The genomic DNA of the young leaves in each accession was extracted using the standard CTAB method [41] followed by a cleanup using a DNeasy Plant Mini Kit (Qiagen, Hilden, Germany). A Qubit fluorometer (Thermo Fisher Scientific, Waltham, MA, USA) and a Qubit dsDNA BR Assay kit (Invitrogen, Waltham, MA, USA) were used to measure the concentration of the extracted genomic DNA.

2.2. RAD-Seq Library Construction and RAD-Seq Sequencing

One of the reduced-representation library sequencing methods is restriction-site-associated DNA sequencing (RAD-seq), which enables the identification of a large number of genome-wide markers across numerous individuals [42,43]. RAD-seq has been shown to be a cost-effective and efficient method for SNP discovery and genotyping, especially in non-model organisms where whole-genome sequencing may be impractical [42,44,45]. RAD-seq libraries were constructed with ~1 µg of DNA using the MGIEasy RAD Library Prep Kit Instruction Manual (MGI Tech). Briefly, the TaqI restriction enzyme was used to cut genomic DNA. DNA fragments were obtained and ligated with unique barcoded adapters. Pooled RAD-seq libraries were sequenced to generate 150 bp paired-end reads using the MGISEQ-2000RS sequencing platform following the manufacturer’s protocol.

2.3. SNP Identification and LD Pruning

The sequence reads for each accession based on each unique barcode were aligned with the published whole genome of B. gymnorhiza (BioProject accession number PRJNA725949) [19] using BWA [46]. Variances were called using GATK v4.1.4.1 with the HaplotypeCaller mode [47]. SNPs were identified and filtered using BCFtools v1.12 [48] and VCFtools v0.1.16 [49] using the following criteria: (1) base quality scores > 30, (2) coverage depths between 10× and 200×, (3) missing data ≤ 5%, and (4) a minor allele frequency ≥ 0.05. The file format of the SNP data was a variant call format (VCF) file that was converted to other file formats for further analysis using PGDSpider v2.1.1.5 [50]. After filtering, SNPs in strong linkage disequilibrium (LD) were pruned out to reduce the effects of LD on genetic variance using PLINK with a variant pruning tool (--indep-pairwise 50 5 0.5) by defining a window of 50 SNPs, removing 1 of an SNP pair if r2 > 0.5 and then shifting the window by 5 SNPs and repeating the procedure [51].

2.4. Phylogenetic Analysis

Multiple sequence alignment and the best substitution model for the SNP data were performed using MUSCLE to find the best DNA/protein models embedded in MEGA X, respectively [52]. A maximum likelihood (ML) phylogenetic tree was preformed based on the best-fit nucleotide substitution model, Tamura-3-parameter (T92+G), and 1000 bootstrap replicates (estimating branch support) using MEGA X [52]. An unrooted tree was visualized using iTOL v6 [53].

2.5. Population Genetic Structure Analysis

The population structure of B. gymnorhiza was identified using two approaches: a Bayesian clustering approach and a principal component analysis (PCA). For the Bayesian clustering approach, the population structure pattern was inferred using the STRUCTURE program v2.3.4 with 20 runs per K (the number of subpopulations), 10,000 burn-in period iterations, and 10,000 MCMC iterations for K = 1–16 (based on 15 provinces of sampling sites) under a genetic admixture model [54]. To estimate the appropriate K value, the delta K value (∆K) based on the formula defined by Evanno et al. (2005) [55] was calculated using the STRUCTURE Harvester program v0.6.94 [56]. The average cluster membership proportions for the 1000 repetitions of a specific K value were calculated using CLUMPP v.1.1.2 [57]. For PCA, the eigenvalues of the SNP makers (the proportion of variance explained by SNPs) were generated from the VCF file using PLINK v1.9 [51]. The first two PCs scores were visualized using R software v3.3.4 with the package ggplot and the library tidyverse [58].

2.6. Genetic Diversity Analysis

Genetic diversity parameters, including gene diversity (heterozygosity), polymorphic information content (PIC), and minor allele frequency (MAF), were calculated using PowerMarker v.3.25 software [59]. In addition, the levels of genetic variation, including the average number of alleles per locus (Na), the effective number of alleles per locus (Ne), Shannon’s information index (I), observed heterozygosity (Ho), expected heterozygosity (He), the proportion of polymorphic loci (PPL), and the fixation index (F), were calculated for the clusters (subpopulations) defined by a population structure analysis using GenAlex v.6.502 [60]. Furthermore, an analysis of molecular variance (AMOVA) and population differentiation (FST) was carried out on the clusters using ARLEQUIN v.3.5 [61].

3. Results

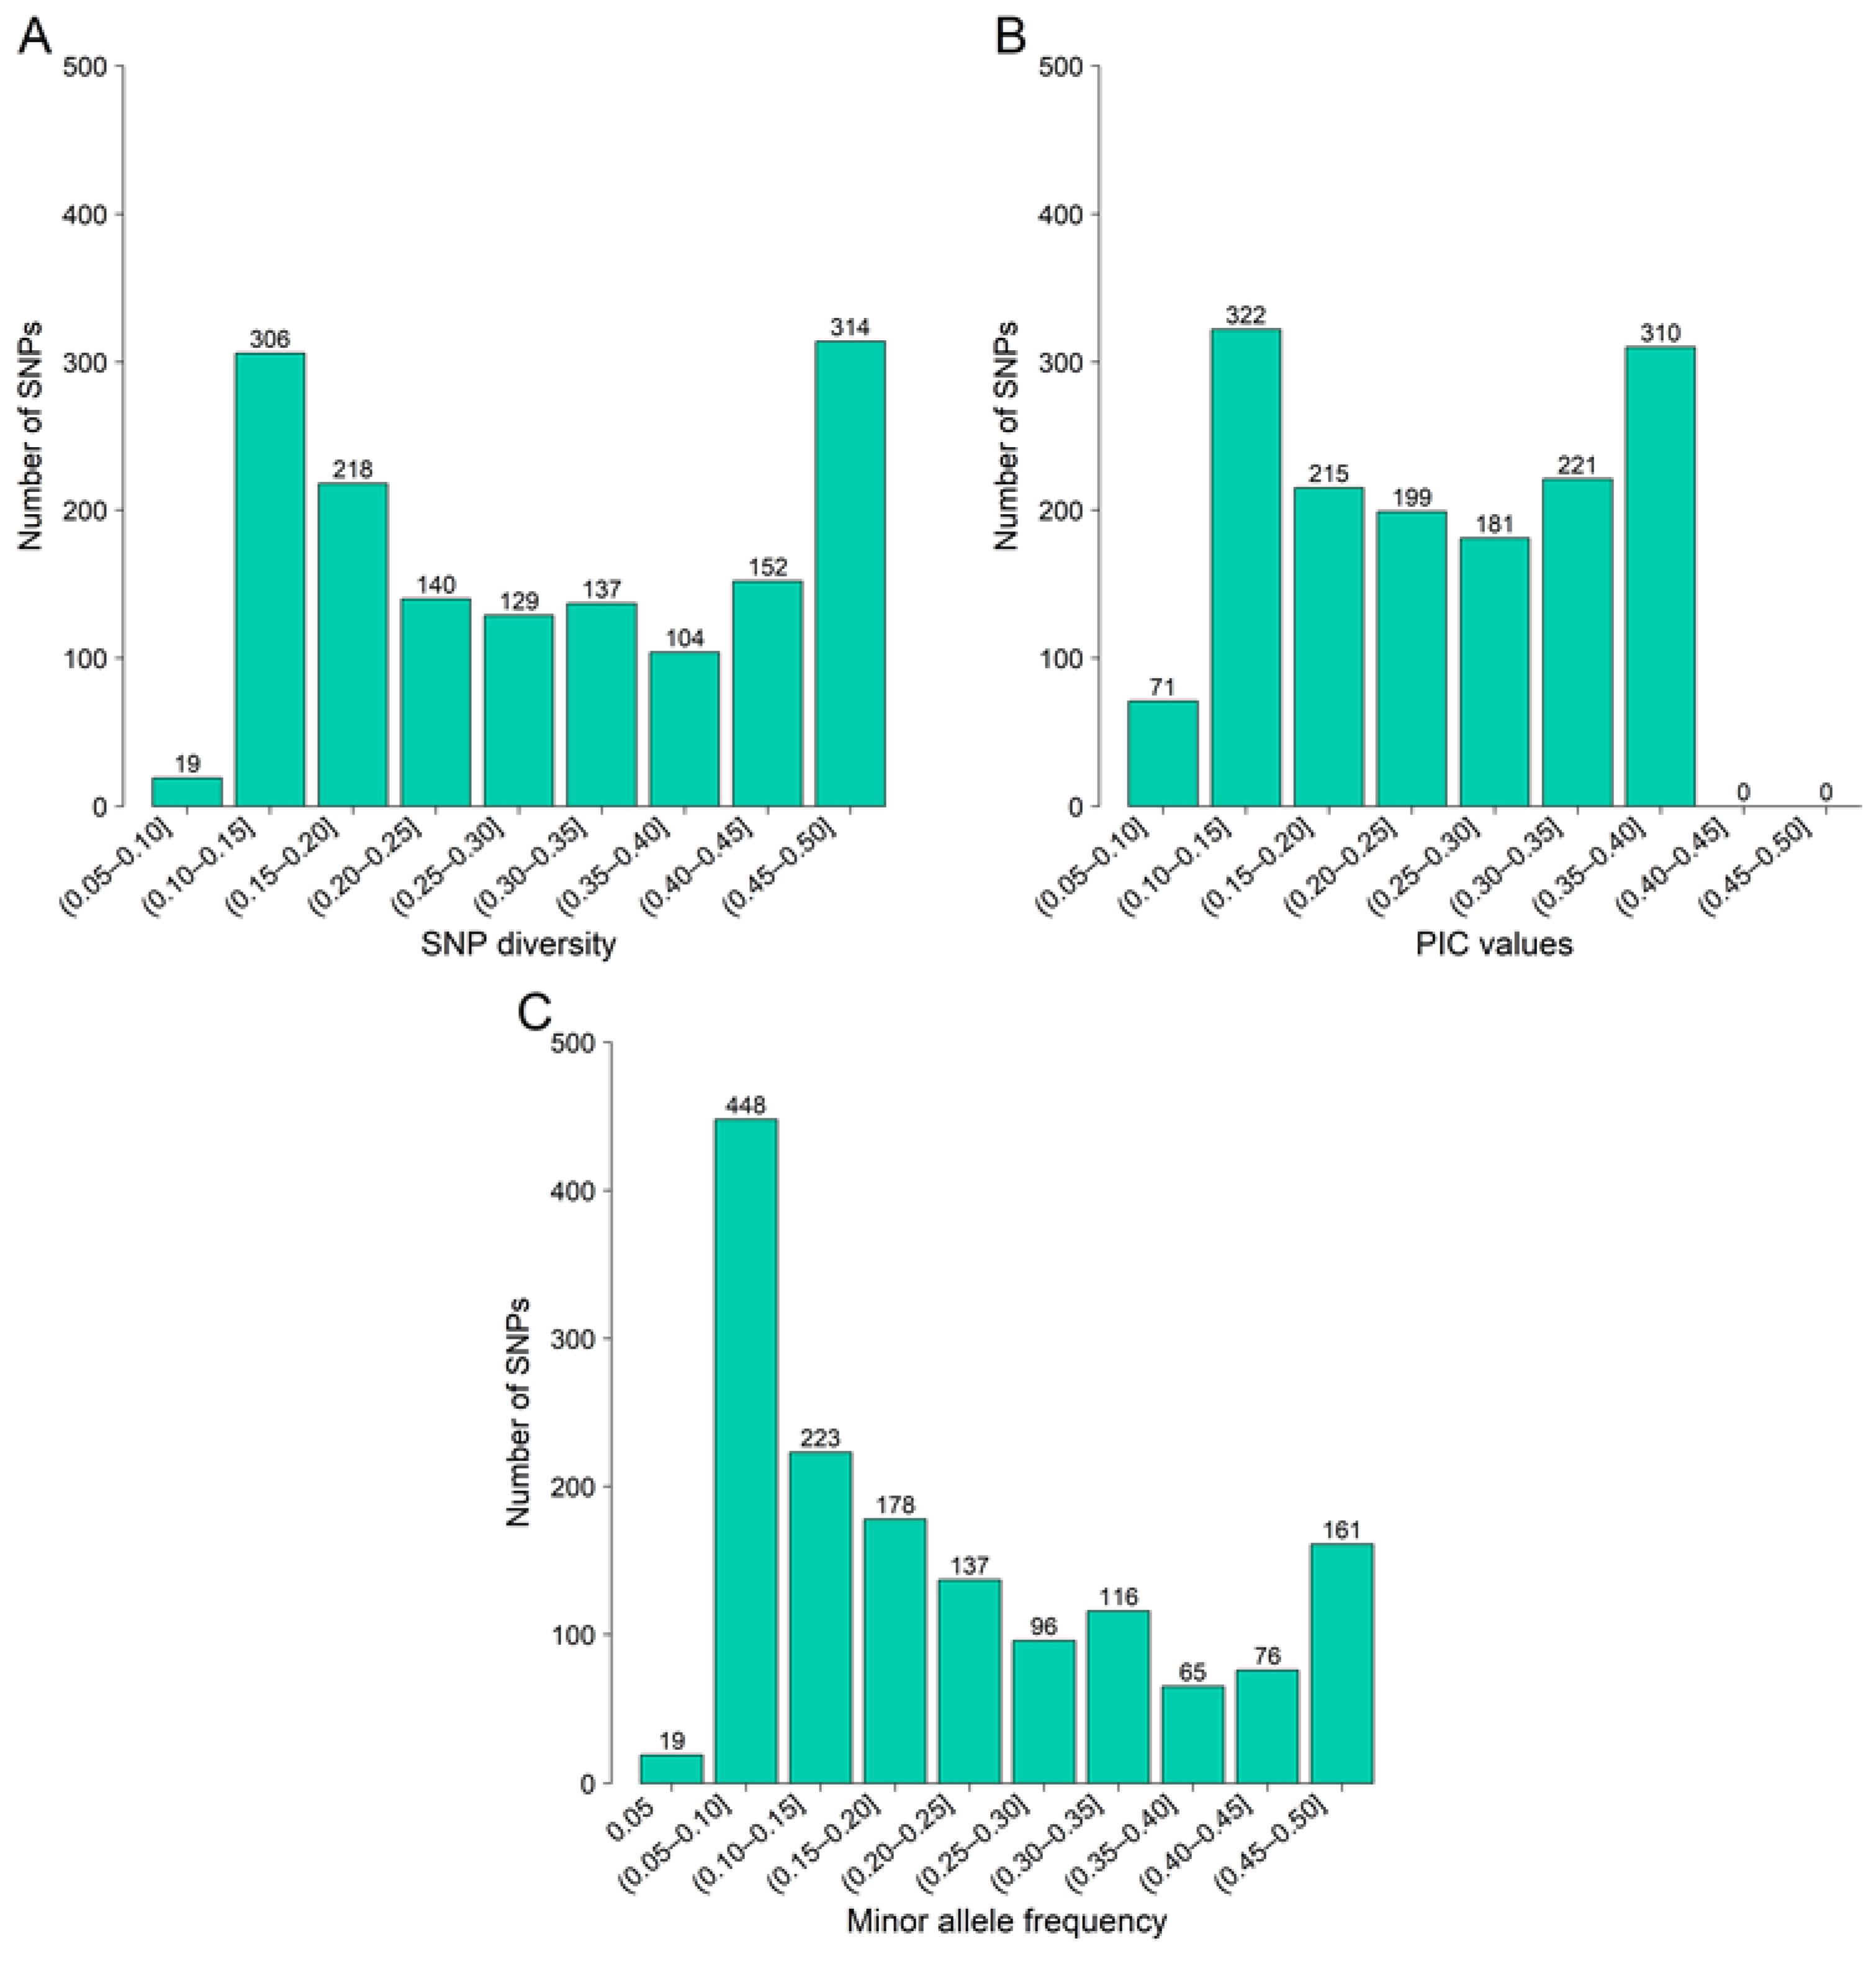
3.1. SNP Identification and Characterization

A total of 1,051,297,454 raw reads for 73 B. gymnorhiza accessions were obtained, with an average of 14,401,335 reads per accession (Table S2). An average of 13,032,114 reads (90.49%) were mapped onto the reference genome of B. gymnorhiza (Table S2). A total of 2,831,356 SNP loci based on the 73 accessions were initially identified. According to the SNP criteria mentioned in the Materials and Methods Section, the SNPs were filtered to obtain 2887 high-quality SNPs. After removing the SNPs in strong LD with a threshold of r2 > 0.5 (default), a total of 1519 SNP loci remained (Table S3).
The distributions of the values for SNP diversity, PIC, and MAF of the 1519 SNP markers in the 73 B. gymnorhiza accessions are presented in Figure 2 (Table S3). The diversity of these SNP markers ranged from 0.10 to 0.50, with a mean of 0.29 (Figure 2A). The PIC values for the SNP markers varied from 0.09 to 0.38, with a mean of 0.24, indicating low-to-moderate polymorphism information (Figure 2B). The distribution of MAF varied from 0.05 to 0.50, with a mean of 0.21 (Figure 2C). Approximately 31% (467 SNPs) of these SNPs were low MAF (0.05–0.10), revealing an excess of minor alleles at low frequencies (Figure 2C).

3.2. Phylogenetic Tree

The unrooted ML tree depicting the genetic relationships among the 73 B. gymnorhiza accessions based on the 1519 SNP markers showed 2 genetically distinct groups (Figure 3). The longest branch on the ML tree was the stem connecting the accessions from the Gulf of Thailand (blue) and the Andaman Sea (green). It had bootstrap support values greater than 90%. Four accessions (CCO_03, SNI_01, SNI_03, and SNI_05) from the Gulf of Thailand coast were located between the two genetic groups, suggesting admixed accessions.

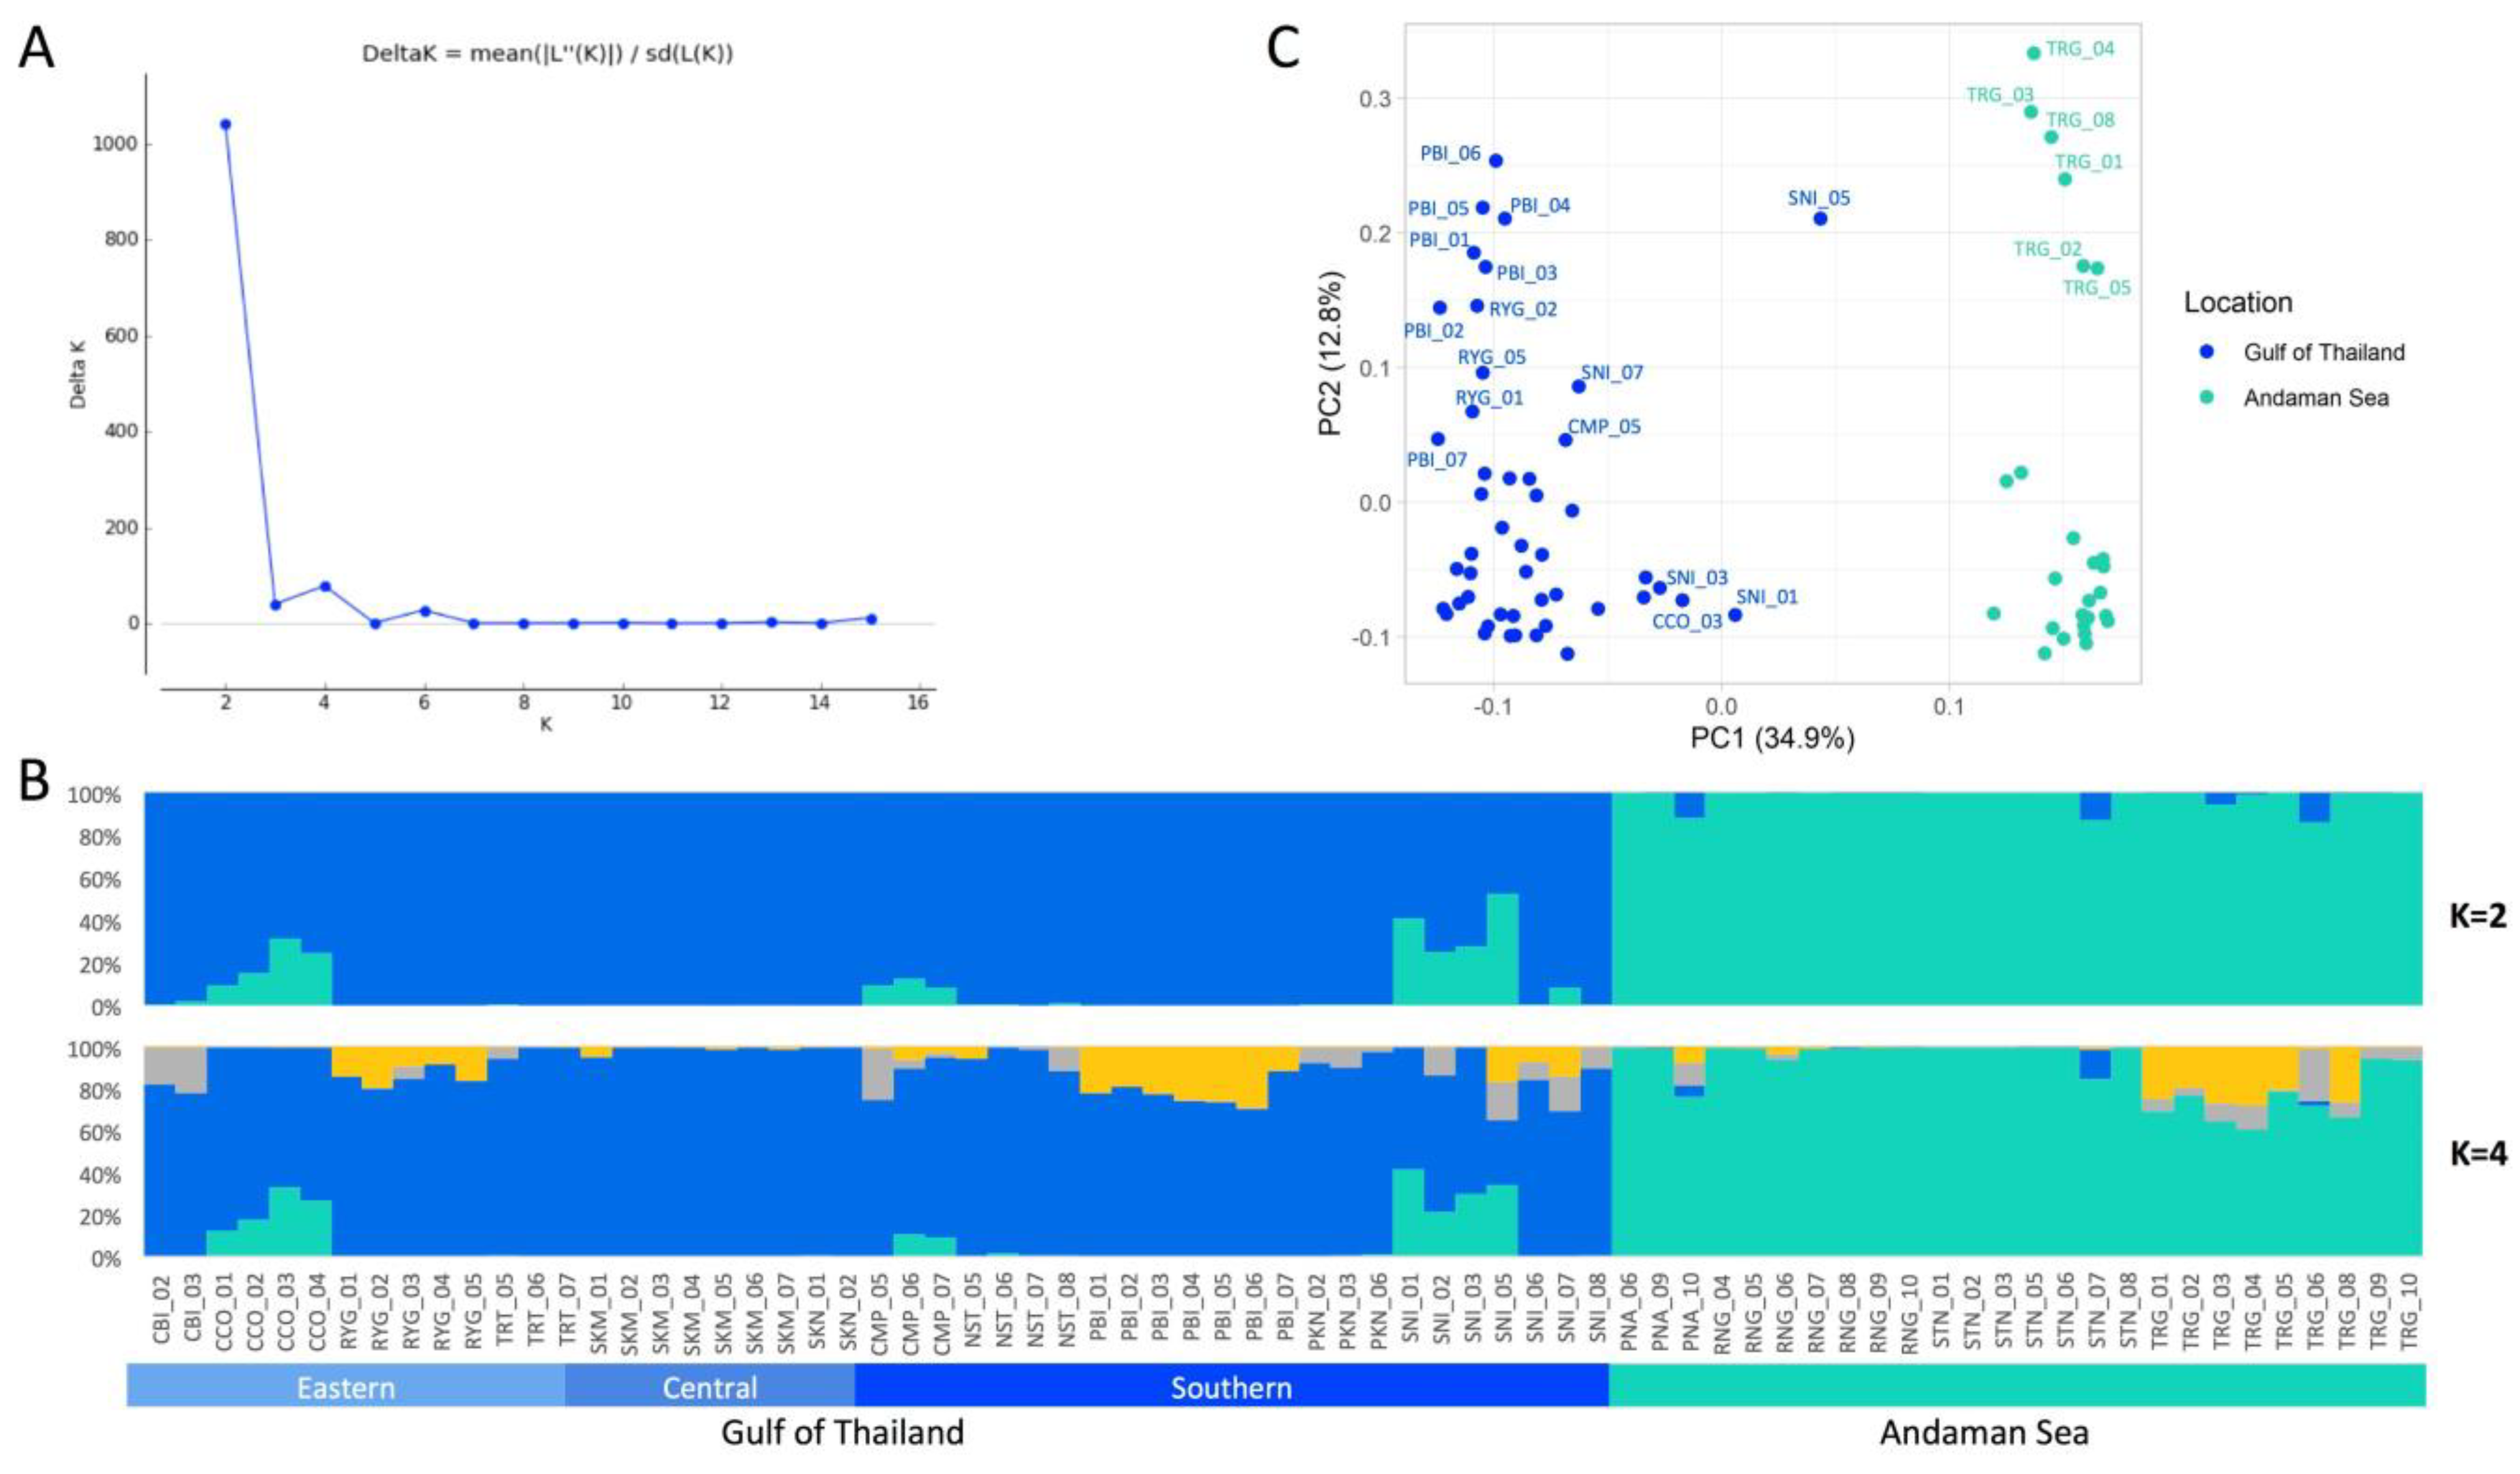
3.3. Population Genetic Structure and PCA

The genetic structure of the 73 B. gymnorhiza accessions based on the 1519 SNP markers was evaluated using Bayesian clustering and PCA (Figure 4). Based on Bayesian clustering in STRUCTURE, delta K showed a maximum peak at K = 2 (the optimal number of clusters), with a small peak again at K = 4 (Figure 4A). The distribution probabilities of clustering the accessions when K = 2 and K = 4 were plotted (Figure 4B). When K = 2, the accessions were assigned to the two genetic clusters (blue and green), corresponding to the east and west coastlines of Thailand. The accessions from Chachoengsao (CCO) and Surat Thani (SNI) were admixed with the admixture proportions in both the Gulf of Thailand and Andaman populations. SNI_05 collected from the Gulf of Thailand had the highest proportion of admixture from the Andaman population (52%). When K = 4, several accessions from Chonburi (CBI), Chumphon (CMP), Rayong (RYG), Phetchaburi (PBI), Surat Thani (SNI), and Trang (TRG) were also admixed. Based on PCA, the first two principal components of the PCA strongly support the two main genetic clusters (Figure 4C). The percentage of variance explained accounted for 34.9% and 12.8% of the total variation in PC1 and PC2, respectively. Additionally, the accessions from RYG, PBI, SNI, and TRG were far from their clusters, indicating a high genetic variation. In the Gulf of Thailand cluster, all PBI accessions and some RYG accessions formed a subcluster as unique individuals when K = 4 in STRUCTURE (Figure 4B,C). In the Andaman cluster, the subcluster in the upper, right quadrant contained only TRG accessions in the Andaman population as unique individuals when K = 4 in STRUCTURE (Figure 4B,C). SNI_05 was in the middle of the PCA plot, indicating an admixed accession.

3.4. Genetic Diversity and Differentiation

The parameters show a moderate level of genetic diversity in B. gymnorhiza (Table 1; Table S4). The average Na, Ne, I, Ho, and He values were 2.463 (2.417–2.510), 1.537 (1.517–1.557), 0.522 (0.515–0.529), 0.397 (0.383–0.410), and 0.317 (0.311–0.323), respectively. The average percentage of polymorphic loci (PPL) was 99.51%. The PPL of the accessions from the Gulf of Thailand coast was 100.00%, whereas that from the Andaman Sea coast was 99.01%. The inbreeding coefficient for all accessions and the accessions in each cluster was a negative value, indicating more heterozygous genotypes.
Based on the two main genetic clusters from STRUCTURE, the genetic differentiation of the populations based on AMOVA showed that 16.05% and 83.95% of the total variation occurred among populations and within populations, respectively (Table 2). The significant FST value between the subpopulations was 0.16 (p < 0.001), revealing a high genetic differentiation.

4. Discussion

4.1. Genetic Relationship and Genetic Structure

To understand the relationships among the B. gymnorhiza accessions in Thailand, an unrooted ML tree based on SNP markers revealed two genetic clusters (the cluster of the Gulf of Thailand and the cluster of the Andaman Sea), concordant with the result of PCA and a structure analysis. It is also consistent with previous studies on Bruguiera species [32,34,36,37,39] and other mangrove species [33,62,63,64,65,66,67]. For example, based on nuclear and chloroplast regions, B. gymnorhiza individuals collected from India, Indonesia, Malaysia, Micronesia, Thailand, and the southern islands of Japan formed three clusters: (1) the eastern region of the Malay Peninsula, including Indonesia, Malaysia, Micronesia, Thailand, and the southern islands of Japan; (2) the eastern coast of India and the western coast of the Malay Peninsula; and (3) the western coast of India [36] in which the two clusters agreed with our result. Using nuclear gene regions, ten B. gymnorhiza populations in the IWP region were divided into two genetic clusters: the east and west clusters [37]. Using ISSR, the Ceriops tagal population on the eastern coast of Thailand resembled the population from South China more than the population on the west coast of Thailand [62]. Two subpopulations of C. tagal and Rhizophora apiculata in Thailand corresponding to the eastern and western coasts of Thailand were reported using SNP markers [33,67]. These support the land barrier hypothesis of the Malay Peninsula promoting genetic divergence between the eastern and western sides [68]. In addition, genetic admixture was found in B. gymnorhiza and other Bruguiera species, such as B. cylindrica and B. parviflora [32,34], as well as in other mangrove species, such as R. apiculata [33]. Genetic admixture could increase the opportunity for mangrove species to adapt to local environments.

4.2. Genetic Diversity and Genetic Differentiation

The genetic diversity of the B. gymnorhiza accessions (mean Ho = 0.397 and mean He = 0.317) was relatively moderate compared with the published mangrove data of B. cylindrica (Ho = 0.289 and He = 0.257: a low genetic diversity) and R. apiculata (Ho = 0.478 and He = 0.360: a moderate genetic diversity) based on SNP markers [33,34]. To estimate the levels of genetic diversity, SNPs have more accuracy than microsatellites, which mostly assessed a higher diversity [29,30,69]. It seems that the genetic diversity of the B. gymnorhiza population based on SNP markers was higher than that of several Bruguiera populations in the IWP region based on various genetic markers [14,35,36,37,39,40]. For example, a very low variation in B. gymnorhiza (Ho = 0.025 and He = 0.035) was found in six populations from the southwestern islands of Japan based on allozyme data [35]. Using nuclear and chloroplast microsatellite markers, the low genetic diversity of B. gymnorhiza (Ho = 0.314 and He = 0.408) was observed in nine populations from Iriomote Island of the Ryukyu Archipelago in Japan [40]. The low genetic diversity of B. gymnorhiza (Ho = 0.316 and He = 0.356) was also reported in nine populations along the coastlines of South China based on chloroplast microsatellite markers [39]. In addition, the genetic diversity of B. gymnorhiza in this study was lower than that of other terrestrial plants [70,71,72]. For example, Trigonobalanus doichangensis, an endangered plant in China, had a high genetic diversity (Ho = 0.557 and He = 0.306) based on SNP markers [72]. Based on microsatellite markers, Eucalyptus urophylla, an economically important tropical forest tree, had a moderate-to-high genetic diversity (He = 0.510–0.720), and Shorea obtusa, a deciduous tropical tree, had a high genetic diversity (He = 0.664) [70,71]. Generally, mangrove plants have a low genetic diversity [26,27,29,30,32,33,62,63,64,65,66,73] that is mainly caused by population size reduction, habitat fragmentation, population bottlenecks, limited propagule dispersal, and climate fluctuations [64,73,74,75]. In Thailand, approximately 87% of the original mangrove areas have been lost compared to the mangrove forest in the 1960s [76], leading to less genetically diverse mangrove species. A low genetic diversity may have an impact on the long-term survival of mangrove populations.
A high level of genetic differentiation between two Bruguiera gymnorhiza subpopulations (FST = 0.16, p < 0.001) was observed. This level of genetic differentiation was similar to that of other B. gymnorhiza populations (FST = 0.16–0.89, p < 0.001) in the IWP region [37,39]. Indeed, pollination and seed dispersal in B. gymnorhiza appear to be limited [14,15,16,36,77]. B. gymnorhiza is pollinated by birds [14,15,16,77]. Seed dispersal in B. gymnorhiza is limited within an ocean [36]. Thus, significant genetic divergence was observed in the B. gymnorhiza accessions on different oceans.
The inbreeding coefficients of B. gymnorhiza (F = −0.162 to −0.146) were negative, indicating an excess of heterozygotes. They were similar to those of other mangroves, such as B. cylindrica (F = −0.229 to −0.162) and R. apiculata (F = −0.258 to −0.140), based on SNP markers [33,34]. In contrast, the inbreeding coefficients of B. gymnorhiza in South China based on allozyme markers (F = −0.076 to 0.132) and nuclear and chloroplast microsatellite markers (F = −0.096 to 0.401) varied from negative to positive values [14,39]. Positive inbreeding coefficients were observed in the southwest Islands of Japan based on allozyme markers (F = 0.051 to 0.462), in Iriomote island of Japan based on nuclear microsatellites (F = 0.016 to 0.422), and in the IWP region based on nuclear genes (F = 0.292) [35,37,40]. These results show that SNPs presented more heterozygotes than other molecular markers. In addition, the AMOVA results showed that the most genetic variation occurred within the B. gymnorhiza populations, concordant with other studies in Bruguiera species [25,34]. Indeed, most genetic variation occurs within populations in outcrossing plants, whereas self- and mixed-mating plants preserve the majority of genetic variation among populations [78,79]. The F values based on SNPs suggest that the B. gymnorhiza populations in Thailand may either be predominantly outcrossing, or that homozygous individuals produced by inbreeding may be strongly selected against, concordant with previous reports [9,14,15]. A higher genetic variation within populations would be beneficial, allowing them to evolve and adapt to cope with local environments, particularly climate changes.

5. Conclusions

The population structure of Bruguiera gymnorhiza populations along the coastlines of Thailand was shown to be strongly structured. Two main genetic clusters, the Gulf of Thailand and the Andaman Sea coasts, were identified based on a phylogenetic tree analysis, a STRUCTURE analysis, and PCA, suggesting that the genetic dispersal of B. gymnorhiza in Thailand is strongly driven by the geographic barrier of the Malay Peninsula. Although two distinct clusters were evident, some substructuring within the two coastal populations was also evident—for example, the TRG accessions were distinct from other Andaman Sea accessions. Some of these accessions were in admixture. B. gymnorhiza had a moderate genetic diversity and a high genetic differentiation. Based on AMOVA, 83.95% of the variation was found within populations, and 16.05% of the variation was found among populations. The results provide a clear understanding of the genetic structure and diversity of B. gymnorhiza in Thailand for mangrove conservation and management that support the preservation of genetic diversity and avoid mixing genetically distinct populations.

Supplementary Materials

The following supporting information can be downloaded at https://www.mdpi.com/article/10.3390/f14040693/s1, Table S1: List of collection sites and sample sizes of B. gymnorhiza; Table S2: Statistics for the mapping of B. gymnorhiza; Table S3: List of 1519 SNPs and their characteristics in B. gymnorhiza; Table S4: Summary of genetic diversity parameters for two main genetic clusters of 73 B. gymnorhiza accessions based on 1519 SNPs.

Author Contributions

Conceptualization, P.R.-a., W.P. and S.T.; methodology, P.R.-a., W.P. and S.T.; formal analysis, P.R.-a. and C.S.; investigation, D.S. and P.W. (Pitchaporn Waiyamitra); resources, C.M., P.W. (Poonsri Wanthongchai) and P.C.; writing—original draft preparation, P.R.-a.; writing—review and editing, P.R.-a., W.P. and S.T.; visualization, P.R.-a.; supervision, W.P. and S.T.; funding acquisition, S.T. All authors have read and agreed to the published version of the manuscript.

Funding

This research was funded by the National Science and Technology Development Agency, Thailand, No. P1952261.

Institutional Review Board Statement

Not applicable.

Informed Consent Statement

Not applicable.

Data Availability Statement

SNP data are available in Table S3.

Acknowledgments

The authors would like to thank the researcher team from Thailand Mangrove Forest Research Center for sample collection.

Conflicts of Interest

The authors declare no conflict of interest.

References

  1. Allen, J.A.; Duke, N.C. Bruguiera gymnorrhiza (large-leafed mangrove). In Species Profiles for Pacific Island Agroforestry; Elevitch, C.R., Ed.; Permanent Agriculture Resources (PAR): Holualoa, HI, USA, 2006; ISBN 0-9702544-5-8. [Google Scholar]
  2. Lee, S.Y.; Primavera, J.H.; Dahdouh-Guebas, F.; Mckee, K.; Bosire, J.O.; Cannicci, S.; Diele, K.; Fromard, F.; Koedam, N.; Marchand, C.; et al. Ecological role and services of tropical mangrove ecosystems: A reassessment. Glob. Ecol. Biogeogr. 2014, 23, 726–743. [Google Scholar] [CrossRef]
  3. Donato, D.C.; Kauffman, J.B.; Murdiyarso, D.; Kurnianto, S.; Stidham, M.; Kanninen, M. Mangroves among the most carbon-rich forests in the tropics. Nat. Geosci. 2011, 4, 293–297. [Google Scholar] [CrossRef]
  4. Alongi, D.M. Present state and future of the world’s mangrove forests. Environ. Conserv. 2002, 29, 331–349. [Google Scholar] [CrossRef] [Green Version]
  5. Giri, C.; Ochieng, E.; Tieszen, L.L.; Zhu, Z.; Singh, A.; Loveland, T.; Masek, J.; Duke, N. Status and distribution of mangrove forests of the world using earth observation satellite data. Glob. Ecol. Biogeogr. 2011, 20, 154–159. [Google Scholar] [CrossRef]
  6. Bunting, P.; Rosenqvist, A.; Hilarides, L.; Lucas, R.M.; Thomas, N.; Tadono, T.; Worthington, T.A.; Spalding, M.; Murray, N.J. Global mangrove extent change 1996–2020: Global mangrove watch version 3.0. Remote Sens. 2022, 14, 3657. [Google Scholar] [CrossRef]
  7. Plathong, S.; Plathong, J. Past and present threats on mangrove ecosystem in Peninsular Thailand. In Coastal Biodiversity in Mangrove Ecosystems: Paper Presented in UNU-INWEH-UNESCO International Training Course, Held at Centre of Advanced Studies; Annamalai University: Chidambaram, India, 2004; pp. 1–13. [Google Scholar]
  8. Boyd, C.E.; Davis, R.P.; McNevin, A.A. Perspectives on the mangrove conundrum, land use, and benefits of yield intensification in farmed shrimp production: A review. J. World Aquac. Soc. 2022, 53, 8–46. [Google Scholar] [CrossRef]
  9. Tomlinson, P.B.; Primack, R.B.; Bunt, J.S. Preliminary observations on floral biology in mangrove Rhizophoraceae. Biotropica 1979, 11, 256. [Google Scholar] [CrossRef]
  10. Zhu, Z.; Chen, J.; Zheng, H.L. Physiological and proteomic characterization of salt tolerance in a mangrove plant, Bruguiera gymnorrhiza (L.) Lam. Tree Physiol. 2012, 32, 1378–1388. [Google Scholar] [CrossRef] [Green Version]
  11. Haq, M.; Sani, W.; Hossain, A.B.M.S.; Taha, R.M.; Monneruzzaman, K.M. Total phenolic contents, antioxidant and antimicrobial activities of Bruguiera gymnorrhiza. J. Med. Plants Res. 2011, 5, 4112–4118. [Google Scholar] [CrossRef]
  12. Bibi, S.N.; Fawzi, M.M.; Gokhan, Z.; Rajesh, J.; Nadeem, N.; Kannan, R.R.R.; Albuquerque, R.D.D.G.; Pandian, S.K. Ethnopharmacology, phytochemistry, and global distribution of mangroves—A comprehensive review. Mar. Drugs 2019, 17, 40231. [Google Scholar] [CrossRef] [Green Version]
  13. Karim, M.A.; Islam, M.A.; Islam, M.M.; Rahman, M.S.; Sultana, S.; Biswas, S.; Hosen, M.J.; Mazumder, K.; Rahman, M.M.; Hasan, M.N. Evaluation of antioxidant, anti-hemolytic, cytotoxic effects and anti-bacterial activity of selected mangrove plants (Bruguiera gymnorrhiza and Heritiera littoralis) in Bangladesh. Clin. Phytosci. 2020, 6, 8. [Google Scholar] [CrossRef] [Green Version]
  14. Ge, J.P.; Cai, B.; Ping, W.; Song, G.; Ling, H.; Lin, P. Mating system and population genetic structure of Bruguiera gymnorrhiza (Rhizophoraceae), a viviparous mangrove species in China. J. Exp. Mar. Biol. Ecol. 2005, 326, 48–55. [Google Scholar] [CrossRef]
  15. Kondo, K.; Nakamura, T.; Piyakarnchana, T.; Mechvichai, W. Pollination in Bruguiera gymnorrhiza in Miyara river, Ishigaki island, Japan and Phangnga, Thailand. Plant Species Biol. 1991, 6, 105–109. [Google Scholar] [CrossRef]
  16. Sheue, C.-R.; Yong, J.W.H.; Yang, Y.-P. The Bruguiera (Rhizophoraceae) species in the mangroves of Singapore, especially on the new record and the rediscovery. Taiwania 2005, 50, 251–260. [Google Scholar]
  17. Ragavan, P.; Saxena, M.; Saxena, A.; Mohan, P.M.; Sachithanandam, V.; Coomar, T. Floral composition and taxonomy of mangroves of Andaman and Nicobar Islands. Indian J. Geo-Mar. Sci. 2014, 43, 1031–1044. [Google Scholar]
  18. Allen, J.A.; Krauss, K.W.; Duke, N.C.; Herbst, D.R.; Bjorkman, O.; Shih, C. Bruguiera species in Hawai’i: Systematic considerations and ecological implications. Pac. Sci. 2000, 54, 331–343. [Google Scholar]
  19. Shearman, J.R.; Naktang, C.; Sonthirod, C.; Kongkachana, W.; U-thoomporn, S.; Jomchai, N.; Maknual, C.; Yamprasai, S.; Promchoo, W.; Ruang-areerate, P.; et al. Assembly of a hybrid mangrove, Bruguiera hainesii, and its two ancestral contributors, Bruguiera cylindrica and Bruguiera gymnorhiza. Genomics 2022, 114, 110382. [Google Scholar] [CrossRef]
  20. Ruang-areerate, P.; Kongkachana, W.; Naktang, C.; Sonthirod, C.; Narong, N.; Jomchai, N.; Maprasop, P.; Maknual, C.; Phormsin, N.; Shearman, J.R.; et al. Complete chloroplast genome sequences of five Bruguiera species (Rhizophoraceae): Comparative analysis and phylogenetic relationships. PeerJ 2021, 9, e12268. [Google Scholar] [CrossRef]
  21. He, Z.; Feng, X.; Chen, Q.; Li, L.; Li, S.; Han, K.; Guo, Z.; Wang, J.; Liu, M.; Shi, C.; et al. Evolution of coastal forests based on a full set of mangrove genomes. Nat. Ecol. Evol. 2022, 6, 738–749. [Google Scholar] [CrossRef]
  22. Shi, W.; Song, W.; Chen, Z.; Cai, H.; Gong, Q.; Liu, J.; Shi, C.; Wang, S. Comparative chloroplast genome analyses of diverse Phoebe (Lauraceae) species endemic to China provide insight into their phylogeographical origin. PeerJ 2023, 11, e14573. [Google Scholar] [CrossRef]
  23. Ruang-areerate, P.; Yoocha, T.; Kongkachana, W.; Phetchawang, P.; Maknual, C.; Meepol, W.; Jiumjamrassil, D.; Pootakham, W.; Tangphatsornruang, S. Comparative analysis and phylogenetic relationships of Ceriops species (Rhizophoraceae) and Avicennia lanata (Acanthaceae): Insight into the chloroplast genome evolution between middle and seaward zones of mangrove forests. Biology 2022, 11, 383. [Google Scholar] [CrossRef] [PubMed]
  24. Pootakham, W.; Naktang, C.; Sonthirod, C.; Kongkachana, W.; Yoocha, T.; Jomchai, N.; Maknual, C.; Chumriang, P.; Pravinvongvuthi, T.; Tangphatsornruang, S. De Novo reference assembly of the upriver orange mangrove (Bruguiera sexangula) genome. Genome Biol. Evol. 2022, 14, evac025. [Google Scholar] [CrossRef] [PubMed]
  25. Abeysinghe, P.D.; Triest, L.; Greef, B.D.; Koedam, N.; Hettiarachi, S. Genetic and geographic variation of the mangrove tree Bruguiera in Sri Lanka. Aquat. Bot. 2000, 67, 131–141. [Google Scholar] [CrossRef] [Green Version]
  26. Mondini, L.; Noorani, A.; Pagnotta, M.A. Assessing plant genetic diversity by molecular tools. Diversity 2009, 1, 19–35. [Google Scholar] [CrossRef] [Green Version]
  27. Govindaraj, M.; Vetriventhan, M.; Srinivasan, M. Importance of genetic diversity assessment in crop plants and its recent advances: An overview of its analytical perspectives. Genet. Res. Int. 2015, 2015, 431487. [Google Scholar] [CrossRef] [Green Version]
  28. Nadeem, M.A.; Nawaz, M.A.; Shahid, M.Q.; Doğan, Y.; Comertpay, G.; Yıldız, M.; Hatipoğlu, R.; Ahmad, F.; Alsaleh, A.; Labhane, N.; et al. DNA molecular markers in plant breeding: Current status and recent advancements in genomic selection and genome editing. Biotechnol. Biotechnol. Equip. 2018, 32, 261–285. [Google Scholar] [CrossRef] [Green Version]
  29. Fischer, M.C.; Rellstab, C.; Leuzinger, M.; Roumet, M.; Gugerli, F.; Shimizu, K.K.; Holderegger, R.; Widmer, A. Estimating genomic diversity and population differentiation—An empirical comparison of microsatellite and SNP variation in Arabidopsis halleri. BMC Genom. 2017, 18, 69. [Google Scholar] [CrossRef] [Green Version]
  30. Zimmerman, S.J.; Aldridge, C.L.; Oyler-McCance, S.J. An empirical comparison of population genetic analyses using microsatellite and SNP data for a species of conservation concern. BMC Genom. 2020, 21, 382. [Google Scholar] [CrossRef]
  31. He, Z.; Li, X.; Yang, M.; Wang, X.; Zhong, C.; Duke, N.C.; Wu, C.I.; Shi, S. Speciation with gene flow via cycles of isolation and migration: Insights from multiple mangrove taxa. Natl. Sci. Rev. 2019, 6, 275–288. [Google Scholar] [CrossRef]
  32. Pootakham, W.; Sonthirod, C.; Naktang, C.; Kongkachana, W.; Sangsrakru, D.; U-thoomporn, S.; Maknual, C.; Meepol, W.; Promchoo, W.; Maprasop, P.; et al. A chromosome-scale reference genome assembly of yellow mangrove (Bruguiera parviflora) reveals a whole genome duplication event associated with the Rhizophoraceae lineage. Mol. Ecol. Resour. 2022, 22, 1939–1953. [Google Scholar] [CrossRef]
  33. Ruang-areerate, P.; Naktang, C.; Kongkachana, W.; Sangsrakru, D.; Narong, N.; Maknual, C.; Pravinvongvuthi, T.; Promchoo, W.; Yamprasai, S.; Tangphatsornruang, S.; et al. Assessment of the genetic diversity and population structure of Rhizophora apiculata Blume (Rhizophoraceae) in Thailand. Biology 2022, 11, 1449. [Google Scholar] [CrossRef] [PubMed]
  34. Khanbo, S.; Kongkachana, W.; Jomchai, N.; Charoensri, S.; Maknual, C.; Maprasop, P.; Phormsin, N.; Tangphatsornruang, S.; Pootakham, W. Genetic diversity and population structure of Bruguiera cylindrica along coastal areas in Thailand. Aquat. Bot. 2022, 183, 103575. [Google Scholar] [CrossRef]
  35. Takeuchi, T.; Sugaya, T.; Kanazashi, A.; Yoshimaru, H.; Katsuta, M. Genetic diversity of Kandelia candel and Bruguiera gymnorrhiza in the Southwest Islands, Japan. J. For. Res. 2001, 6, 157–162. [Google Scholar] [CrossRef]
  36. Minobe, S.; Fukui, S.; Saiki, R.; Kajita, T.; Changtragoon, S.; Ab Shukor, N.A.; Latiff, A.; Ramesh, B.R.; Koizumi, O.; Yamazaki, T. Highly differentiated population structure of a mangrove species, Bruguiera gymnorhiza (Rhizophoraceae) revealed by one nuclear GapCp and one chloroplast intergenic spacer trnF-trnL. Conserv. Genet. 2010, 11, 301–310. [Google Scholar] [CrossRef]
  37. Urashi, C.; Teshima, K.M.; Minobe, S.; Koizumi, O.; Inomata, N. Inferences of evolutionary history of a widely distributed mangrove species, Bruguiera gymnorrhiza, in the Indo-West Pacific region. Ecol. Evol. 2013, 3, 2251–2261. [Google Scholar] [CrossRef] [PubMed]
  38. Dasgupta, N.; Nandy, P.; Sengupta, C.; Das, S. RAPD and ISSR marker mediated genetic polymorphism of two mangroves Bruguiera gymnorrhiza and Heritiera fomes from Indian Sundarbans in relation to their sustainability. Physiol. Mol. Biol. Plants 2015, 21, 375–384. [Google Scholar] [CrossRef] [Green Version]
  39. Geng, Q.; Wang, Z.; Tao, J.; Kimura, M.K.; Liu, H.; Hogetsu, T.; Lian, C. Ocean currents drove genetic structure of seven dominant mangrove species along the coastlines of southern China. Front. Genet. 2021, 12, 615911. [Google Scholar] [CrossRef] [PubMed]
  40. Islam, M.S.; Lian, C.; Kameyama, N.; Hogetsu, T. Analyses of genetic population structure of two ecologically important mangrove tree species, Bruguiera gymnorrhiza and Kandelia obovata from different river basins of Iriomote Island of the Ryukyu Archipelago, Japan. Tree Genet. Genomes 2012, 8, 1247–1260. [Google Scholar] [CrossRef]
  41. Doyle, J.J.; Doyle, J.L. A rapid DNA isolation procedure for small quantities of fresh leaf tissue. Phytochem. Bull. 1987, 19, 11–15. [Google Scholar]
  42. Davey, J.L.; Blaxter, M.W. RADseq: Next-generation population genetics. Brief. Funct. Genom. 2010, 9, 416–423. [Google Scholar] [CrossRef]
  43. Baird, N.A.; Etter, P.D.; Atwood, T.S.; Currey, M.C.; Shiver, A.L.; Lewis, Z.A.; Selker, E.U.; Cresko, W.A.; Johnson, E.A. Rapid SNP discovery and genetic mapping using sequenced RAD markers. PLoS ONE 2008, 3, e3376. [Google Scholar] [CrossRef] [PubMed]
  44. Etter, P.D.; Bassham, S.; Hohenlohe, P.A.; Johnson, E.A.; Cresko, W.A. SNP discovery and genotyping for evolutionary genetics using RAD sequencing. Methods Mol. Biol. 2011, 772, 157–178. [Google Scholar] [CrossRef] [PubMed] [Green Version]
  45. Andrews, K.R.; Good, J.M.; Miller, M.R.; Luikart, G.; Hohenlohe, P.A. Harnessing the power of RADseq for ecological and evolutionary genomics. Nat. Rev. Genet. 2016, 17, 81–92. [Google Scholar] [CrossRef] [PubMed] [Green Version]
  46. Li, H.; Durbin, R. Fast and accurate short read alignment with Burrows-Wheeler transform. Bioinformatics 2009, 25, 1754–1760. [Google Scholar] [CrossRef] [PubMed] [Green Version]
  47. McKenna, A.; Hanna, M.; Banks, E.; Sivachenko, A.; Cibulskis, K.; Kernytsky, A.; Garimella, K.; Altshuler, D.; Gabriel, S.; Daly, M.; et al. The genome analysis Toolkit: A MapReduce framework for analyzing next-generation DNA sequencing data. Genome Res. 2009, 20, 1297–1303. [Google Scholar] [CrossRef] [Green Version]
  48. Li, H. A statistical framework for SNP calling, mutation discovery, association mapping and population genetical parameter estimation from sequencing data. Bioinformatics 2011, 27, 2987–2993. [Google Scholar] [CrossRef] [Green Version]
  49. Danecek, P.; Auton, A.; Abecasis, G.; Albers, C.A.; Banks, E.; DePristo, M.A.; Handsaker, R.E.; Lunter, G.; Marth, G.T.; Sherry, S.T.; et al. The variant call format and VCFtools. Bioinformatics 2011, 27, 2156–2158. [Google Scholar] [CrossRef]
  50. Lischer, H.E.L.; Excoffier, L. PGDSpider: An automated data conversion tool for connecting population genetics and genomics programs. Bioinformatics 2012, 28, 298–299. [Google Scholar] [CrossRef] [Green Version]
  51. Purcell, S.; Neale, B.; Todd-Brown, K.; Thomas, L.; Ferreira, M.A.R.; Bender, D.; Maller, J.; Sklar, P.; de Bakker, P.I.W.; Daly, M.J.; et al. PLINK: A tool set for whole-genome association and population-based linkage analyses. Am. J. Hum. Genet. 2007, 81, 559–575. [Google Scholar] [CrossRef] [Green Version]
  52. Kumar, S.; Stecher, G.; Li, M.; Knyaz, C.; Tamura, K. MEGA X: Molecular evolutionary genetics analysis across computing platforms. Mol. Biol. Evol. 2018, 35, 1547–1549. [Google Scholar] [CrossRef]
  53. Letunic, I.; Bork, P. Interactive tree of life (iTOL) v5: An online tool for phylogenetic tree display and annotation. Nucleic Acids Res. 2021, 49, W293–W296. [Google Scholar] [CrossRef] [PubMed]
  54. Pritchard, J.K.; Stephens, M.; Donnelly, P. Inference of population structure using multilocus genotype data. Genetics 2000, 155, 945–959. [Google Scholar] [CrossRef] [PubMed]
  55. Evanno, G.; Regnaut, S.; Goudet, J. Detecting the number of clusters of individuals using the software STRUCTURE: A simulation study. Mol. Ecol. 2005, 14, 2611–2620. [Google Scholar] [CrossRef] [Green Version]
  56. Earl, D.A.; VonHoldt, B.M. STRUCTURE HARVESTER: A website and program for visualizing STRUCTURE output and implementing the Evanno method. Conserv. Genet. Resour. 2012, 4, 359–361. [Google Scholar] [CrossRef]
  57. Jakobsson, M.; Rosenberg, N.A. CLUMPP: A cluster matching and permutation program for dealing with label switching and multimodality in analysis of population structure. Bioinformatics 2009, 23, 1801–1806. [Google Scholar] [CrossRef] [PubMed] [Green Version]
  58. Wickham, H. ggplot2 Elegant Graphics for Data Analysis, 2nd ed.; Gentleman, R., Hornik, K., Parmigiani, G., Eds.; Springer Nature: Houston, TX, USA, 2016; ISBN 978-3-319-24277-4. [Google Scholar]
  59. Liu, K.; Muse, S.V. PowerMaker: An integrated analysis environment for genetic maker analysis. Bioinformatics 2005, 21, 2128–2129. [Google Scholar] [CrossRef] [Green Version]
  60. Peakall, R.; Smouse, P.E. GenALEx 6.5: Genetic analysis in Excel. Population genetic software for teaching and research—An update. Bioinformatics 2012, 28, 2537–2539. [Google Scholar] [CrossRef] [Green Version]
  61. Excoffier, L.; Lischer, H.E.L. Arlequin suite ver 3.5: A new series of programs to perform population genetics analyses under Linux and Windows. Mol. Ecol. Resour. 2010, 10, 564–567. [Google Scholar] [CrossRef]
  62. Ge, X.J.; Sun, M. Population genetic structure of Ceriops tagal (Rhizophoraceae) in Thailand and China. Wetl. Ecol. Manag. 2001, 9, 203–209. [Google Scholar] [CrossRef]
  63. Guo, Z.; Huang, Y.; Chen, Y.; Duke, N.C.; Zhong, C.; Shi, S. Genetic discontinuities in a dominant mangrove Rhizophora apiculata (Rhizophoraceae) in the Indo-Malesian region. J. Biogeogr. 2016, 43, 1856–1868. [Google Scholar] [CrossRef]
  64. Yang, Y.; Li, J.; Yang, S.; Li, X.; Fang, L.; Zhong, C.; Duke, N.C.; Zhou, R.; Shi, S. Effects of Pleistocene sea-level fluctuations on mangrove population dynamics: A lesson from Sonneratia alba. BMC Evol. Biol. 2017, 17, 22. [Google Scholar] [CrossRef] [PubMed] [Green Version]
  65. Wee, A.K.S.; Teo, J.X.H.; Chua, J.L.; Takayama, K.; Asakawa, T.; Meenakshisundaram, S.H.; Onrizal; Adjie, B.; Ardli, E.R.; Sungkaew, S.; et al. Vicariance and oceanic barriers drive contemporary genetic structure of widespread mangrove species Sonneratia alba J. Sm in the Indo-West Pacific. Forests 2017, 8, 483. [Google Scholar] [CrossRef] [Green Version]
  66. Triest, L.; Satyanarayana, B.; Delange, O.; Sarker, K.K.; Sierens, T.; Dahdouh-Guebas, F. Barrier to gene flow of grey mangrove Avicennia marina populations in the Malay Peninsula as revealed from nuclear microsatellites and chloroplast haplotypes. Front. Conserv. Sci. 2021, 2, 727819. [Google Scholar] [CrossRef]
  67. Pootakham, W.; Naktang, C.; Sonthirod, C.; Kongkachana, W.; Narong, N.; Sangsrakru, D.; Maknual, C.; Jiumjamrassil, D.; Chumriang, P.; Tangphatsornruang, S. Chromosome-level genome assembly of Indian mangrove (Ceriops tagal) revealed a genome-wide duplication event predating the divergence of Rhizophoraceae mangrove species. Plant Genome 2022, 15, e20217. [Google Scholar] [CrossRef]
  68. Duke, N.C.; Lo, E.; Sun, M. Global distribution and genetic discontinuities of mangroves—Emerging patterns in the evolution of Rhizophora. Trees 2002, 16, 65–79. [Google Scholar] [CrossRef]
  69. Oluwajuwon, T.V.; Attafuah, R.; Offiah, C.J.; Krabel, D. Genetic variation in tropical tree species and plantations: A review. Open J. For. 2022, 12, 350–366. [Google Scholar] [CrossRef]
  70. Tripiana, V.; Bourgeois, M.; Verhaegen, D.; Vigneron, P.; Bouvet, J.M. Combining microsatellites, growth, and adaptive traits for managing in situ genetic resources of Eucalyptus urophylla. Can. J. For. Res. 2007, 37, 773–785. [Google Scholar] [CrossRef] [Green Version]
  71. Senakun, C.; Changtragoon, S.; Pramual, P.; Prathepha, P. Genetic structure and diversity of Shorea obtusa (Dipterocarpaceae) in Thailand. J. Syst. Evol. 2011, 49, 120–125. [Google Scholar] [CrossRef]
  72. Hu, L.; Le, X.G.; Zhou, S.S.; Zhang, C.Y.; Tan, Y.H.; Ren, Q.; Meng, H.H.; Cun, Y.; Li, J. Conservation significance of the rare and endangered tree species, Trigonobalanus doichangensis (Fagaceae). Diversity 2022, 14, 666. [Google Scholar] [CrossRef]
  73. Azman, A.; Ng, K.K.S.; Ng, C.H.; Lee, C.T.; Tnah, L.H.; Zakaria, N.F.; Mahruji, S.; Perdan, K.; Abdul-Kadir, M.Z.; Cheng, A.; et al. Low genetic diversity indicating the threatened status of Rhizophora apiculata (Rhizophoraceae) in Malaysia: Declined evolution meets habitat destruction. Sci. Rep. 2020, 10, 19112. [Google Scholar] [CrossRef]
  74. Kennedy, J.P.; Garavelli, L.; Truelove, N.K.; Devlin, D.J.; Box, S.J.; Chérubin, L.M.; Feller, I.C. Contrasting genetic effects of red mangrove (Rhizophora mangle L.) range expansion along west and east Florida. J. Biogeogr. 2017, 44, 335–347. [Google Scholar] [CrossRef]
  75. Binks, R.M.; Byrne, M.; McMahon, K.; Pitt, G.; Murray, K.; Evans, R.D. Habitat discontinuities form strong barriers to gene flow among mangrove populations, despite the capacity for long-distance dispersal. Divers. Distrib. 2019, 25, 298–309. [Google Scholar] [CrossRef] [Green Version]
  76. Macintosh, D.J.; Ashton, E.C. A Review of Mangrove Biodiversity Conservation and Management; Centre for Tropical Ecosystems Research; University of Aarhus: Aarhus, Denmark, 2002. [Google Scholar]
  77. Wee, A.K.S.; Low, S.Y.; Webb, E.L. Pollen limitation affects reproductive outcome in the bird-pollinated mangrove Bruguiera gymnorrhiza (Lam.) in a highly urbanized environment. Aquat. Bot. 2014, 120, 240–243. [Google Scholar] [CrossRef]
  78. Nassar, J.M.; Hamrick, J.L.; Fleming, T.H. Genetic variation and population structure of the mixed-mating cactus, Melocactus curvispinus (Cactaceae). Heredity 2001, 87, 69–79. [Google Scholar] [CrossRef] [Green Version]
  79. Nybom, H. Comparison of different nuclear DNA markers for estimating intraspecific genetic diversity in plants. Mol. Ecol. 2004, 13, 1143–1155. [Google Scholar] [CrossRef]
Figure 1. Geographical locations of 73 B. gymnorhiza (L.) Savigny accessions in Thailand. Red dots and texts represent sampling sites and abbreviations for provinces, respectively.
Forests 14 00693 g001
Figure 2. Distribution of 1519 SNP markers estimated for all 73 B. gymnorhiza accessions. (A) SNP diversity; (B) polymorphic information content (PIC); (C) minor allele frequency.
Forests 14 00693 g002
Figure 3. Unrooted phylogenetic tree inferred by maximum likelihood analysis of 73 B. gymnorhiza accessions using 1519 SNP markers. Blue and green texts in the ML tree indicate two different sampling sites in the Gulf of Thailand and the Andaman Sea sides, respectively.
Forests 14 00693 g003
Figure 4. The population structure of 73 B. gymnorhiza accessions. (A) Delta K plot representing the best cluster number assumed K from 1 to 16 in the STRUCTURE analysis. (B) Population structure analysis, K = 2 and K = 4. Each accession is represented by a single column. Colors represent different clusters. (C) The principal component analysis plot of the first two PCs.
Forests 14 00693 g004
Table 1. Genetic diversity parameters of B. gymnorhiza (L.) Savigny in each of the two subpopulations and all accessions based on 1519 SNPs.
PopulationNNaNeIHoHePPL (%)F
Gulf of Thailand462.510 ± 0.0131.517 ± 0.0080.515 ± 0.0050.383 ± 0.0070.311 ± 0.004100.00−0.135 ± 0.009
Andaman Sea272.417 ± 0.0131.557 ± 0.0090.529 ± 0.0050.410 ± 0.0080.323 ± 0.00499.01−0.157 ± 0.010
Overall732.463 ± 0.0091.537 ± 0.0060.522 ± 0.0040.397 ± 0.0050.317 ± 0.00399.51−0.146 ± 0.007
Table 2. Analysis of molecular variance (AMOVA) using 1519 SNPs of the genetic variation among and within two subpopulations of 73 B. gymnorhiza accessions.
Source of VariationdfSum of SquaresVariance
Components
Percentage of VariationF-Statistics
Among populations12772.2737.8316.05FST = 0.16 ***
Within populations14428,495.58197.8983.95
Total14531,267.85235.71
Note: df = degree of freedom; *** = statistical significance at p < 0.001.
Disclaimer/Publisher’s Note: The statements, opinions and data contained in all publications are solely those of the individual author(s) and contributor(s) and not of MDPI and/or the editor(s). MDPI and/or the editor(s) disclaim responsibility for any injury to people or property resulting from any ideas, methods, instructions or products referred to in the content.

