Article

Total Streamflow Variation for the Upper Catchment of Bosten Lake Basin in China Inferred from Tree-Ring Width Records

1
Institute of Desert Meteorology, China Meteorological Administration, Urumqi 830002, China
2
Key Laboratory of Tree-Ring Physical and Chemical Research of China Meteorological Administration, Urumqi 830002, China
3
Xinjiang Key Laboratory of Tree-Ring Ecology, Urumqi 830002, China
*
Author to whom correspondence should be addressed.
Forests 2023, 14(3), 622; https://doi.org/10.3390/f14030622
Submission received: 7 February 2023 / Revised: 4 March 2023 / Accepted: 16 March 2023 / Published: 20 March 2023
(This article belongs to the Special Issue Response of Tree Rings to Climate Change and Climate Extremes)

Abstract

:
Bosten Lake Basin not only is a major source of drinking water for the residents of the surrounding area, but also maintains the ecological balance of the region. However, with the influence of climate change and human activities, the water level of Bosten Lake fluctuates sharply and has a great impact on the surrounding ecological environment. Therefore, the study of its historical water flow changes as a reference has become a focus of research. In this study, the radial growth of Schrenk spruces (Picea schrenkiana Fisch. et Mey.) significantly correlated with the tributary streamflow coming from the mountainous region near Bosten Lake Basin. On the basis of this good coherence, the tree-ring chronologies were used to reconstruct the streamflow for Huangshuigou River from the previous August to the present July (r = 0.766, p < 0.0001, n = 50). The reconstructed streamflow series matched observations well, explaining 63.3% of the variation in the observed streamflow of 1956–2005. Then, the sum of the streamflow reconstruction of Huangshuigou River and another two tree-ring-based streamflow reconstructions (Kaidu River and Qingshui River) was used to represent the hydrological variation of the upper catchment of Bosten Lake Basin, and the reconstruction sequence was 306 years. The 10.7, 5.5, and 2.1 year cycles of the power spectrum and wavelet analysis revealed that the runoff series reconstructed from tree-ring hydrometeorology was related to solar activity. Some dry and wet years in the reconstructed streamflow series of the upper catchment of Bosten Lake Basin corresponded to the historical record. During the wet years, the Indian Ocean was probably the main source of precipitation.

1. Introduction

Inland lakes, evaporating dishes in arid and semi-arid areas, are not only the sensitive factors for climate change but also indicators of ecosystems [1,2]. The temporal and spatial variation of water storage of lakes objectively reflects the process of regional water cycle and water balance [3]. These lakes provide valuable water resources for industrial production, agricultural irrigation, and animal husbandry development, and they play a crucial part in regional residents’ drinking and wildlife breeding water supply [4,5]. Thus, the timely and accurate analyses of the distribution, area, storage, and water level of inland lakes are beneficial to comprehend the characteristics and mechanism of lake variation and to develop policies of regional water resource management.
China’s largest inland freshwater lake, Bosten Lake, is located on the southern slope of the middle Tianshan Mountains and provides the basis of agricultural irrigation, fishery production, and municipal water for the around area. Zhu et al. [6] analyzed remote sensing data to indicate that there are two water level decreasing periods (1972–1990 and 2002–2010) and one increasing period (1990–2002) for Bosten Lake. While exceptionally high lake levels will result in the sinking of farmland, soil salinization, and an increase in the risk of flooding, continuous lake level decreases can cause the loss of lake wetlands, deterioration of flora, and harm to biodiversity and fishing resources [7]. These possible secondary disasters caused by the fluctuation of water storage in lakes have been research hotspots attracting much attention in recent years. Most of the previous studies on Bosten Lake Basin investigated the lake level and water storage, and analyzed the relationship between the climatic factors and the surface runoff of the watershed [6,7,8,9]. It is a pity that short-term observed data and fragmentary historical records make it difficult to satisfactorily describe and understand the variation characteristics of the environmental factors and their driving mechanism for Bosten Lake Basin and its surrounding area.
Tree rings, as important proxy data, are frequently used to reconstruct the hydrological variation in history. Gou et al. [10,11] reconstructed the streamflow of Yellow River in the past millennium and revealed the long-timescale variation pattern of Yellow River streamflow. Woodhouse et al. [12,13] conducted streamflow reconstruction of the upper Colorado River on a different timescale, which provided reliable data to support water resource management in the basin. Panyushkina et al. [14] reconstructed the past 235 years of streamflow variation in Lake Balkhash Basin using Schrenk spruce’s tree-ring width. Liu et al. [15] used a moisture-sensitive tree-ring width chronology to reconstruct streamflow in the middle reaches of Yellow River and found that reduced streamflow resulted in a 58% reduction in sediment load in the upper Yellow River and a 29% reduction in the middle reaches. Ferrero et al. [16] reconstructed the streamflow variability of Río Bermejo in subtropical South America. Pederson et al. [17] reconstructed the streamflow of Kherlen River in northeastern Mongolia for the last 345 years using tree-ring width to explore possible links between regional streamflow variability and solar activity, among others. The coniferous forest widely distributed in the surrounding mountains of Bosten Lake Basin provides an excellent opportunity for dendrohydrological studies [18]. However, these studies mainly focused on the streamflow reconstruction for a given river, whereas less attention has been paid to the elaborate description of the total runoff from tributaries for the watershed. These dendrohydrological reconstructions for the main tributaries may provide a good background for researching and analyzing the hydrological variations of the whole watershed over the long-term period.
Therefore, this study established the following goals in order to fill these knowledge gaps and expand on the current knowledge base: (1) reconstruct Huangshuigou River’s streamflow on the basis of connections among hydroclimatic factors, as well as tree-ring width, (2) develop the total streamflow variation for the upper catchment of Bosten Lake Basin from the reconstructed streamflow series of these tributaries, and (3) analyze the variation characteristics of the total streamflow of Bosten Lake Basin and investigate how it relates to other environmental factors.

2. Materials and Methods
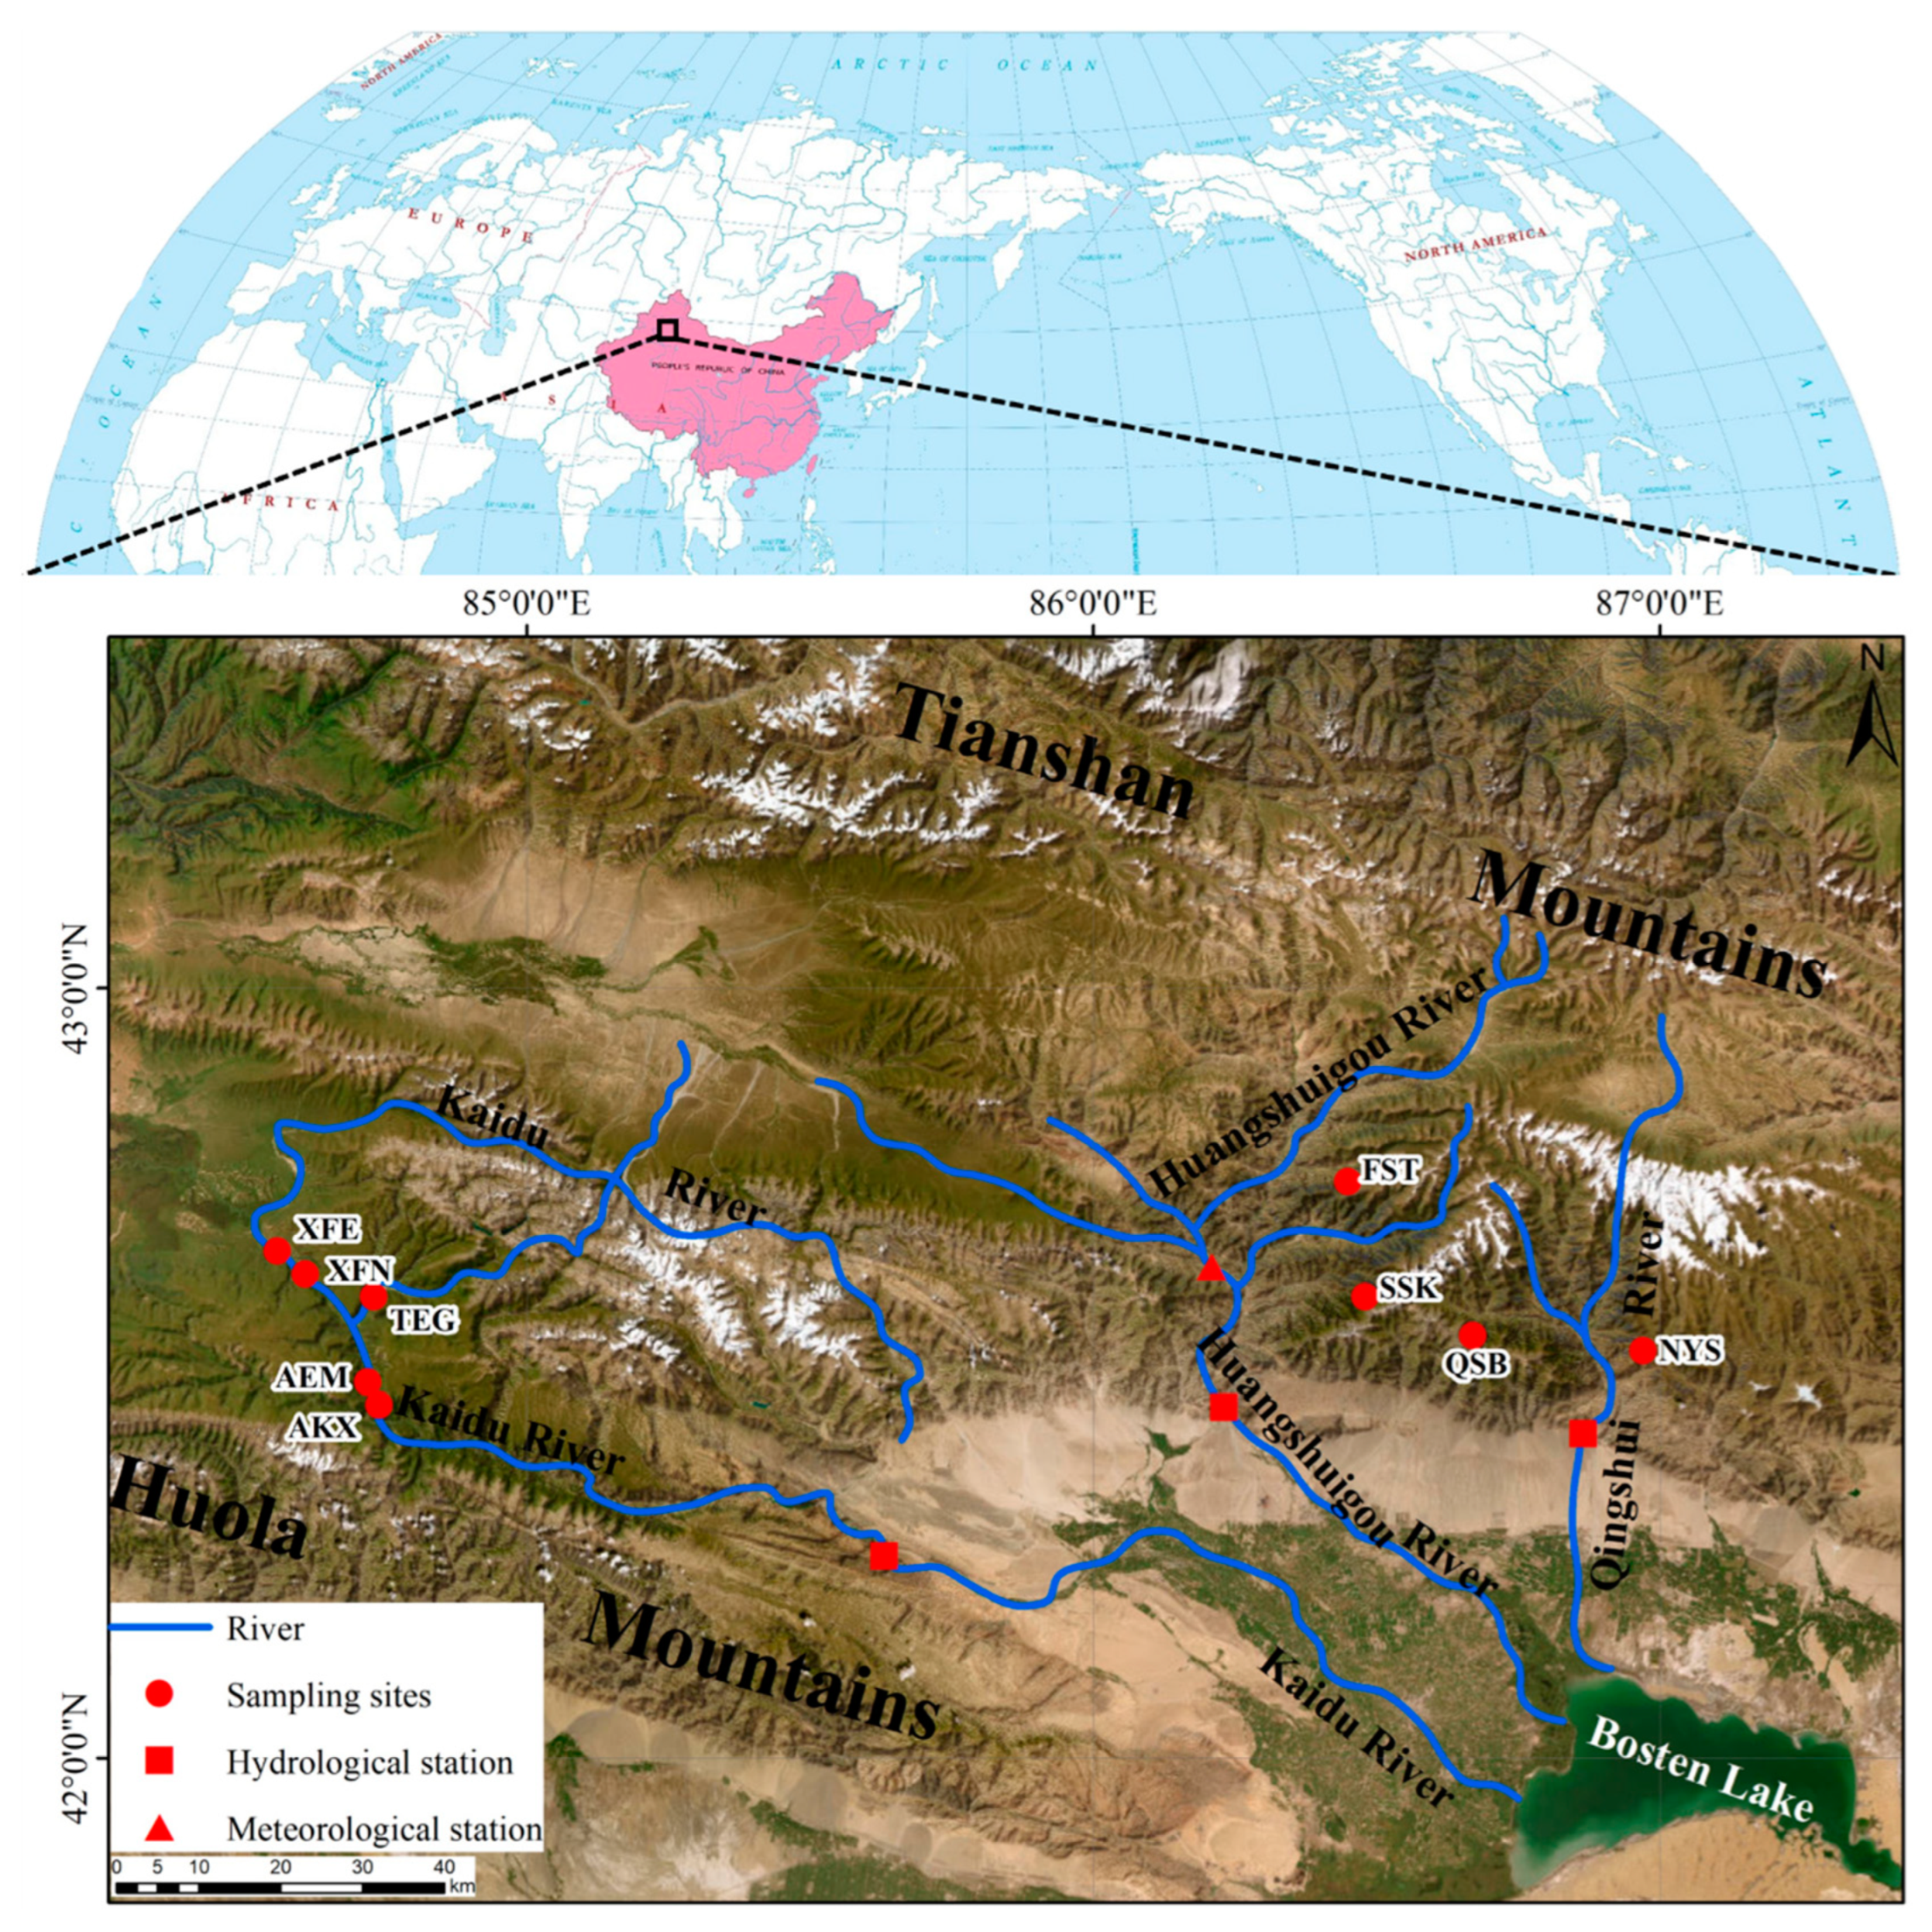
2.1. Study Area

Bosten Lake is situated in the southeastern Yanqi Basin, bounded by 41°56′–42°14′ N and 86°40′–87°26′ E. The mean depth of this lake is 8 m, and the maximum depth is 16.2 m. The area of the lake is approximately 1000 km2, and its storage is 8.8 km3. This lake is between the Tianshan Mountains and the Kuluketage Mountains. The lake’s surface is 1048 m a.s.l. and the watershed of the lake is close to 55,600 km2 [19]. Bosten Lake, as a typical alternately filled lake, is the home of more than 10 rivers originating from the mountainous area of Yanqi Basin and the source of Kongque River [20]. The runoff of Kaidu River, Huangshuigou River, and Qingshui River accounts for above 90% of the Bosten Lake inflow [21].

2.2. Sampling and Tree-Ring Width Measurement

In the mountainous region around Bosten Lake Basin, there are a total of nine tree-ring sample locations. These tree-ring cores were obtained in August 2005 (two sites in the basin of Huangshuigou River), September 2010 (five sites in the basin of Kaidu River), and June 2015 (two sites in the basin of Qingshui River) (Figure 1). In these locations, forest stands are comparatively open. From west to east, the soil beneath the forest gradually becomes thinner and contains more sand and gravel. Schrenk spruces (Picea schrenkiana Fisch. et Mey.), a type of dominating and enduring tree species found in the Tianshan Mountains, which range in elevation from 1200 to 2800 m a.s.l., were collected from every tree-ring sampling site. In order to prevent non-climatic factors from influencing the radial growth of the tree trunk, we only chose healthy spruces that showed minimal signs of being harmed by human activity, pests and insects, landslides, earthquakes, or animal invasion. For the majority of the studied trees, we simultaneously obtained two cores from one tree, at breast height. Each tree’s two cores were taken from opposing sides. In total, we collected 516 cores from 262 trees at nine sites using increment borers with a 10 mm diameter. The information of these sampling sites is listed in Table 1.
Utilizing standard dendrochronological technologies, the sampled trees’ tree-ring cores were dried naturally and placed on a grooved wooden plank [22]. Next, each core was sanded with abrasive paper of varying grades, and then marked with needles while viewed through a microscope. The LINTAB measuring system with 0.001 mm resolution was used to measure the width of each ring.

2.3. Development of Tree-Ring Chronologies

The curves of tree-ring width series for every core were displayed and contrasted using the LINTAB measuring system. The output of the COFECHA program enabled checking for missing tree-ring width series and false rings, as well as cross-dating quality control [23]. To obliterate the indications of tree ages influenced by variables other than climate, the ARSTAN program was chosen with the modified negative exponential curve option [24]. Because the common variations across various ring-width series are included in the standard tree-ring chronologies created by the program and since they maintain a low-throughput high-frequency common variance, they were utilized in the subsequent analysis and reconstruction [25]. The reliable length of tree-ring chronologies was assessed by the expressed population signal (EPS). These recently created tree-ring chronologies were given a reliable length by using an EPS ≥ 0.85 [26]. If a single sampling site’s chronologies were found to be coherent, all of the tree-ring width series in the same watershed of a given tributary were incorporated to establish a regional chronology.

2.4. Hydrometeorological Data and Developed Streamflow Reconstructions

We choose the Baluntai meteorological station’s monthly mean temperature, mean maximum temperature, mean minimum temperature, and precipitation data (42.67° N, 86.33° E, and 1752.5 m a.s.l.) and the monthly streamflow data of the Huangshuigou hydrological station (42.45° N, 86.23° E, and 1320.0 m a.s.l.) for correlation analyses and hydrological reconstruction. Climatic data from 1958 to 2013 and hydrologic data from 1955 to 2013 were from the China Meteorological Data Service Center (CMDC, https://data.cma.cn/, accessed on 6 September 2019) and Xinjiang Uygur Autonomous Region Water Authority, respectively. The meteorological station is located in the mountainous area, which can adequately describe the climatic conditions for the Huangshuigou River watershed. The hydrological station is located in the watershed of the Huangshuigou River’s mountain pass. In the higher and intermediate basins above this hydrological gauging station, there is little herding activity and no dam; however, in the lower watershed, there is significant agricultural irrigation and human activity. Taking into account the impact of hydroclimatic conditions prior to the growing season, the association between tree growth and hydroclimatic conditions was revealed using various combinations of monthly hydrometeorological data from the previous year to the current year [27,28,29]. Furthermore, two tree-ring-based streamflow reconstructions for Kaidu River and Qingshui River were used in the process of total streamflow variation for the upper catchment of Bosten Lake Basin [18,30].

2.5. Statistical Analysis

The monthly and annual hydrological and meteorological data were analyzed as the hydroclimatic background for the study area. For the single sampling site, the consistency of these tree-ring chronologies was tested using the Gleichläufigkeit index (GLK), correlation coefficients in the different domains, and extreme value years [31,32,33]. The regional chronology was developed in accordance with a good coherence of growth of tree rings in the research area. The strength of the hydroclimatic signals present in these chronologies from spruces was measured using correlation analysis. Hydrometeorological data and tree-ring chronology were shown to have the strongest seasonal association; then, the linear and exponential regression models were employed for reconstruction. Leave-one-out cross-validation and split-sample calibration–verification tests were used to evaluate the statistical reliability of the reconstruction model [34,35]. The hydrological data period was divided into two continuous sections for calibration and verification, with the same length over the split-sample calibration–verification experiments. Several statistical parameters, including reduction in error (RE), coefficient of efficiency (CE), correlation coefficient (r1), sign test (S), and product mean test (t), were computed to assess the data, both observed and estimated [36]. The total streamflow for the upper catchment of a given lake was calculated as the sum of the streamflow reconstructions of these tributaries originating from the mountainous area. The aforementioned analyses were carried out utilizing the Statistical Product and Service Solutions and Data Processing System. Reasonable periodicities in the rebuilt series were examined using power spectrum and wavelet analysis (http://climexp.knmi.nl, accessed on 27 September 2019) [31].

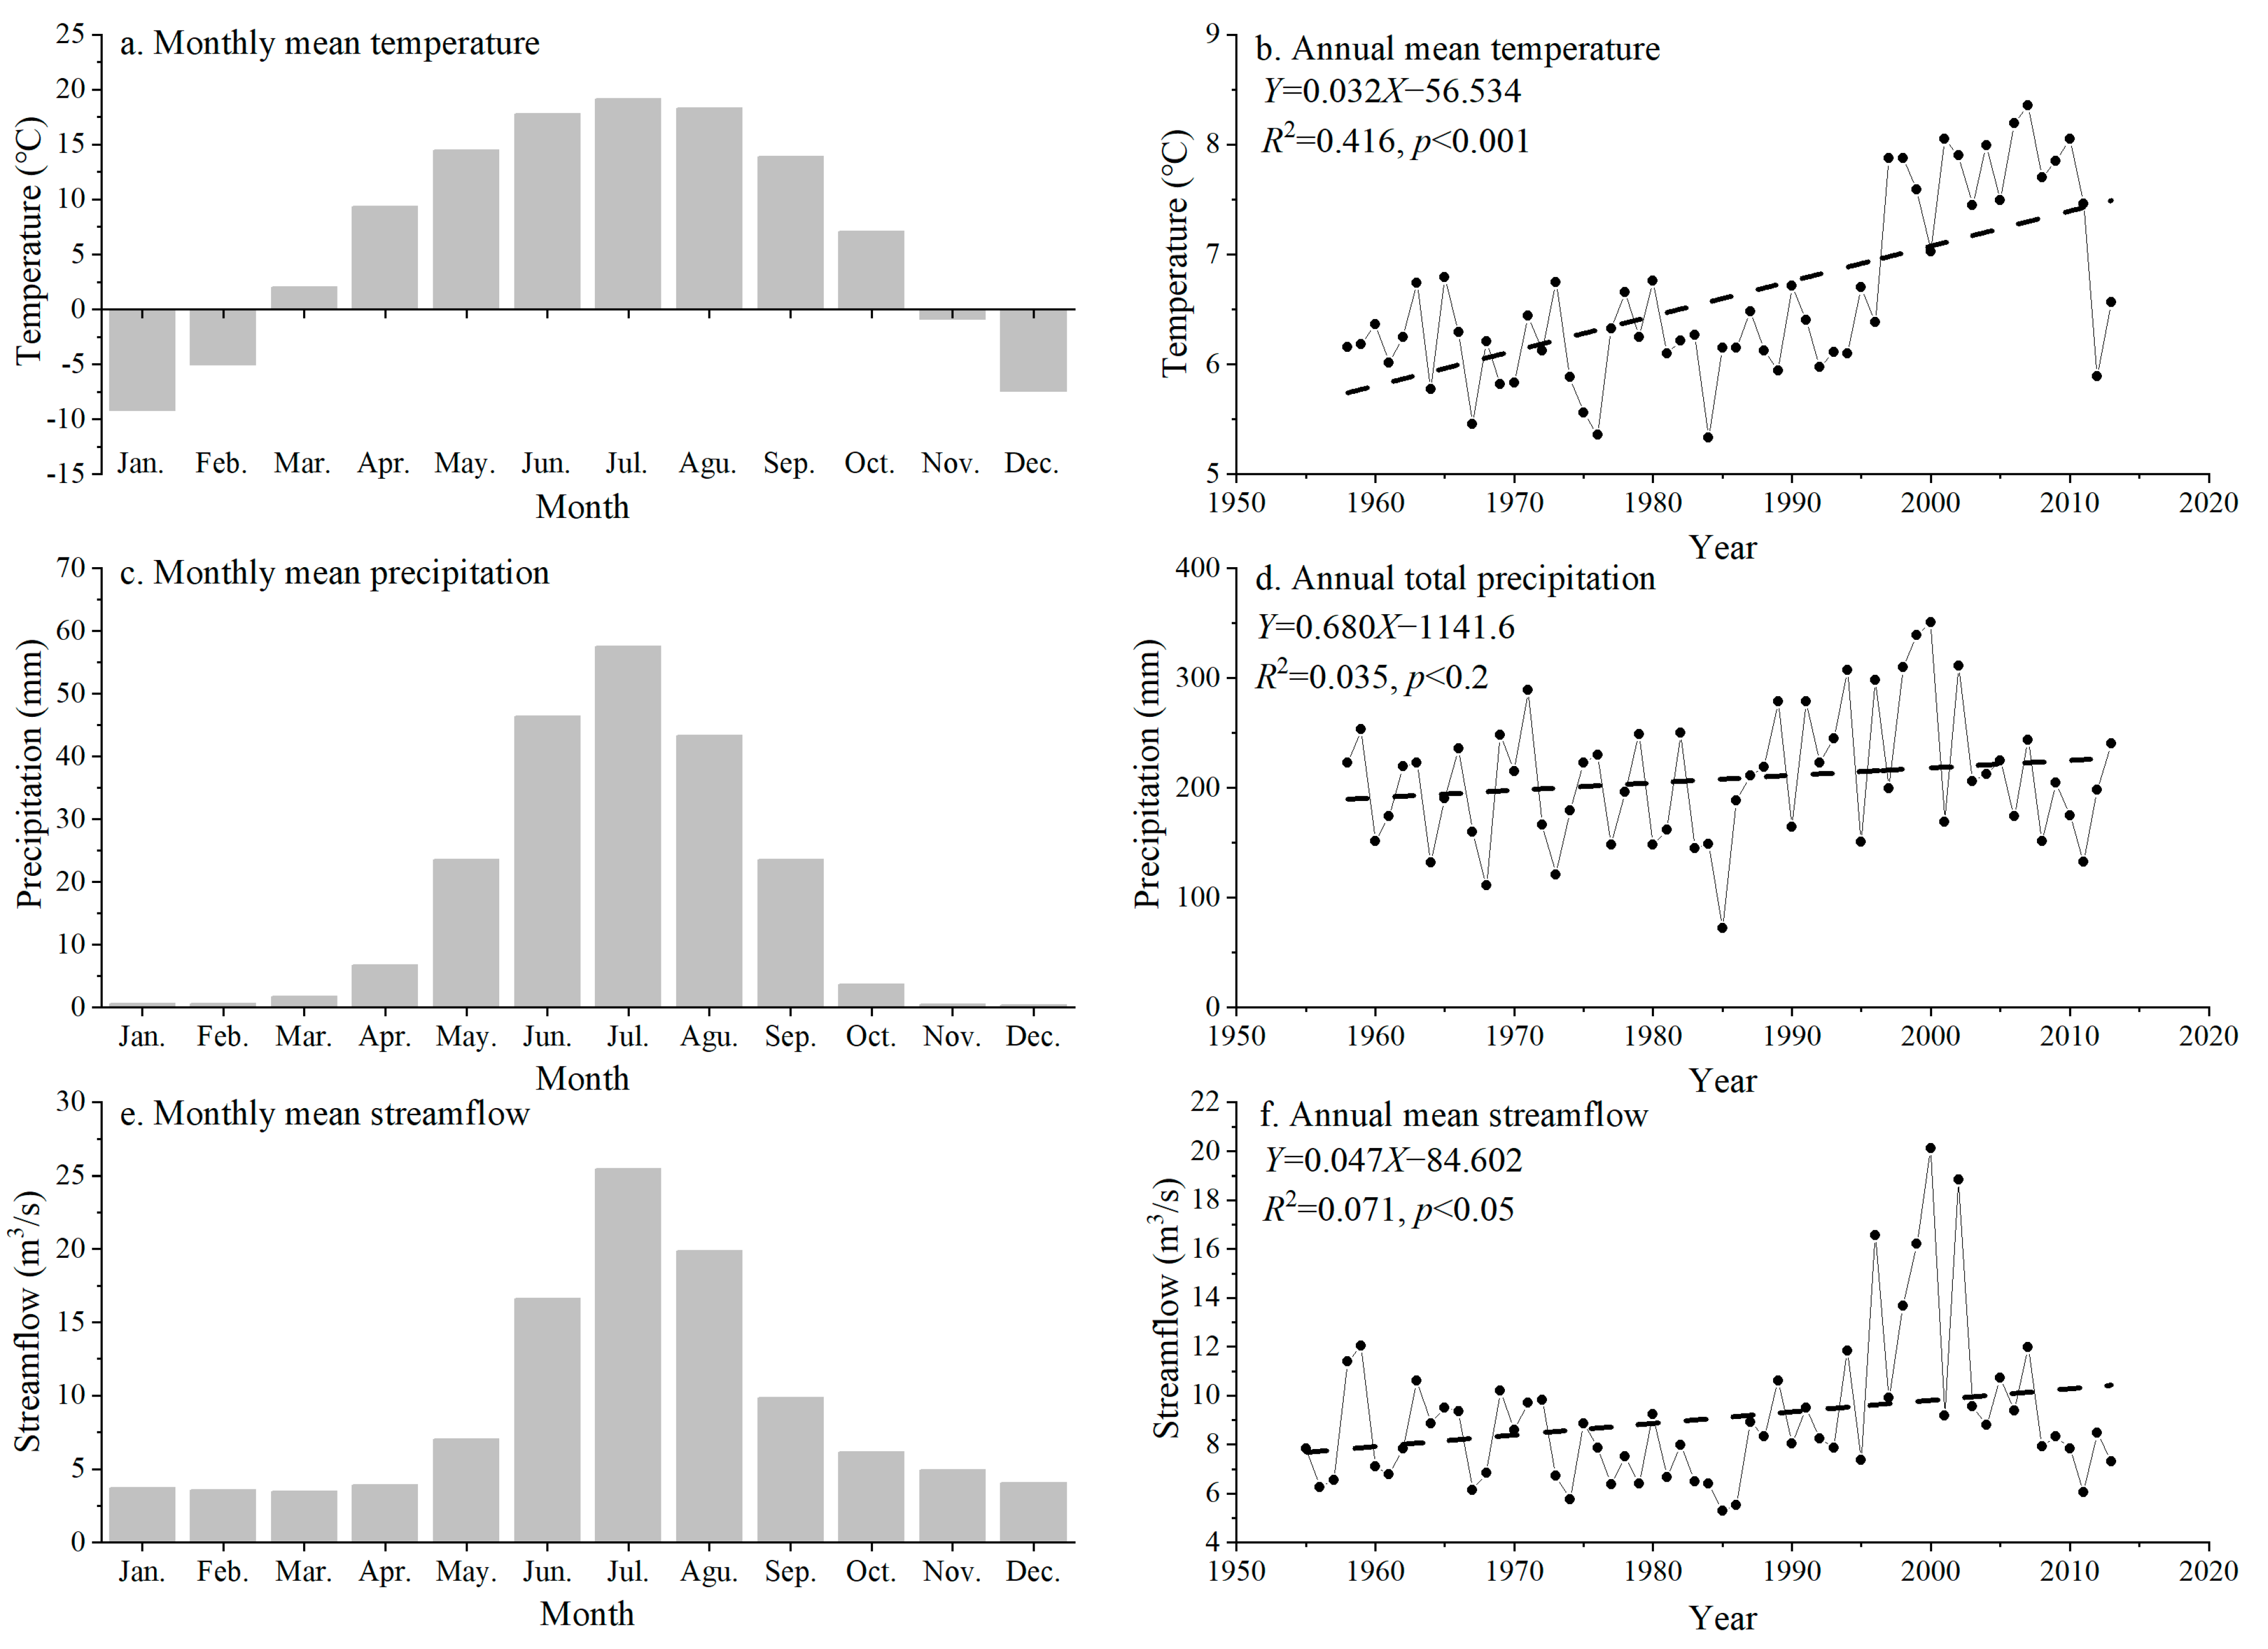
2.6. Characteristics of Hydrometeorological Data Variation

Figure 2a shows that the monthly mean temperature was higher than 0 °C from March to October in the watershed of Huangshuigou River, and that summer (June–August) had the greatest mean temperature, with July (19.1 °C) being the hottest. Most of the precipitation (147.2 mm), 70.6% of the yearly total, fell during the summer (Figure 2c). Figure 2e demonstrates that the yearly total runoff, which peaked in July, primarily constituted the monthly mean streamflow during the summer (25.438 m3/s). The highest value of annual mean streamflow (from January to December) occurred in 2000 (20.126 m3/s), while the lowest value occurred in 1985 (5.279 m3/s) (Figure 2f). The partial correlation coefficient for annual mean streamflow and annual total precipitation (Figure 2d) with the controlled annual mean temperature series was 0.779 (p < 0.001, n = 53) in 1958–2013, while the partial correlation between annual mean streamflow and annual mean temperature (Figure 2b) with the controlled annual total precipitation series was clearly lower (r = 0.406, p < 0.01, n = 53). The aforementioned findings show that precipitation had a significant influence on the Huangshuigou River’s streamflow.

3. Results

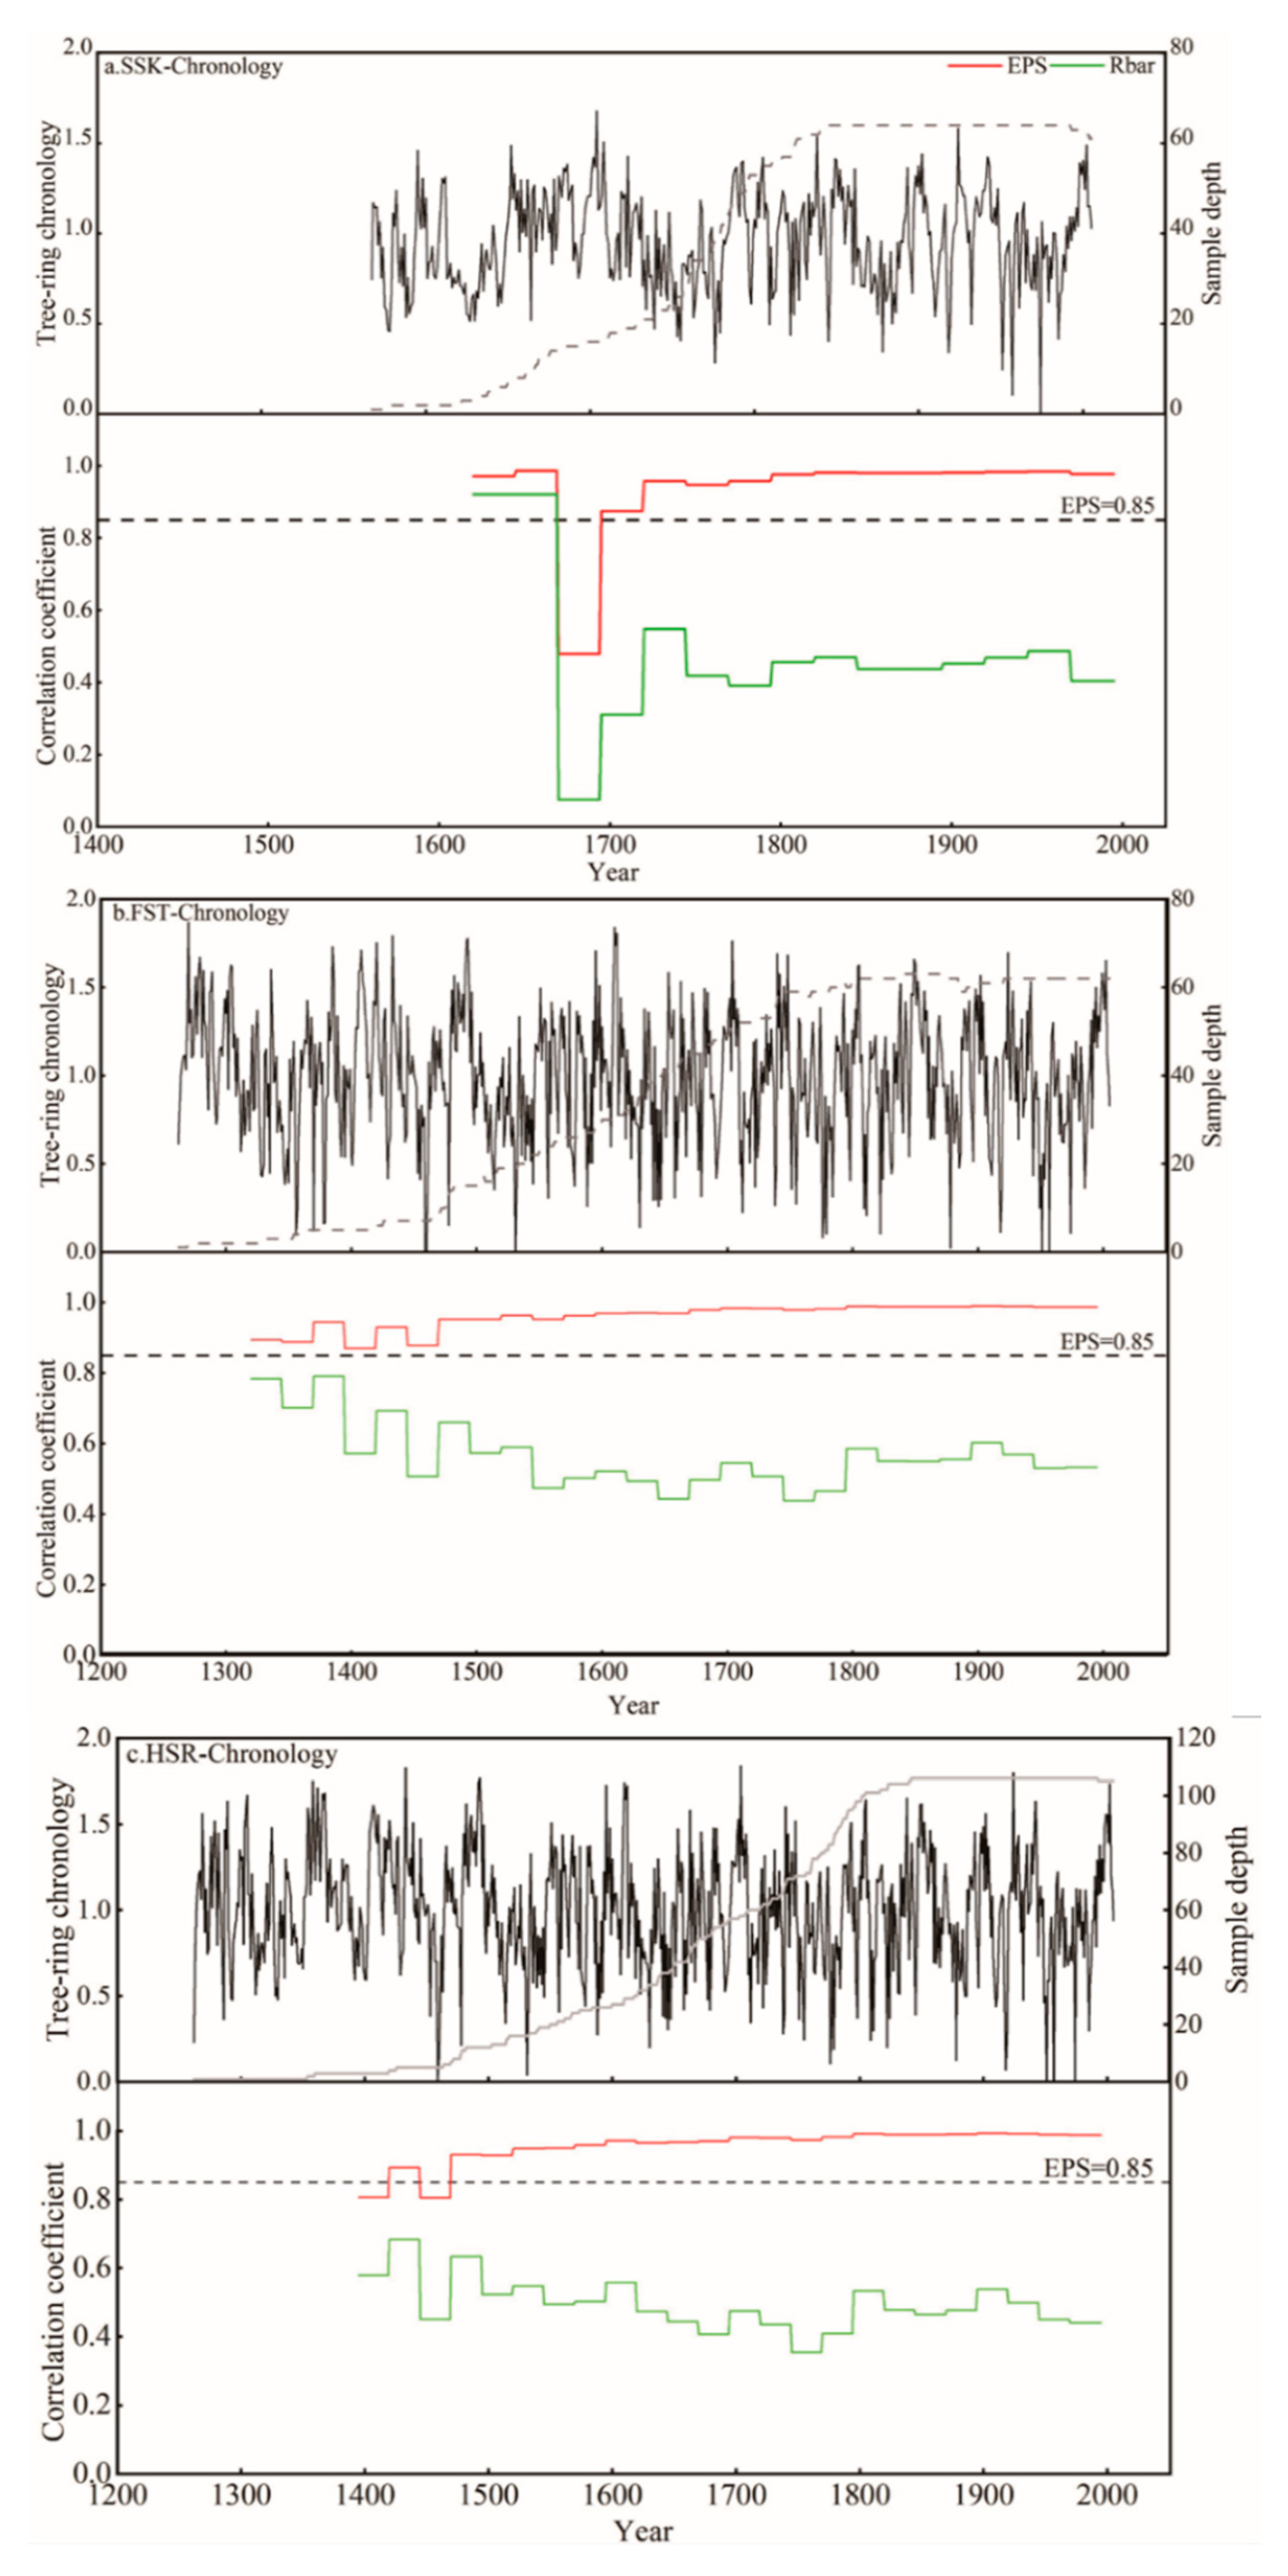
3.1. Regional Chronologies Development and Analyses

The regional tree-ring chronologies for the watershed of Kaidu River and Qingshui River were developed on the basis of the good coherence between each tree-ring chronology for a single sampling site and used for streamflow reconstruction [18,30]. Thus, the regional tree-ring chronology for the watershed of Huangshuigou River was determined following the above principle. In the common period 1567–2005, the GLK value between the FST and SSK chronologies (79.7%) reached the 0.001 significance threshold. We examined two chronologies in the various domains using Pearson correlation coefficients in addition to the reciprocal filters. During the common period, the original domain correlation coefficient for the two chronologies was 0.700 (p < 0.0001, n = 439). In the high-frequency domain (r = 0.713, n = 427), the correlation coefficient between the two chronologies was greater than in the low-frequency domain (r = 0.667, n = 427). Furthermore, a comparison of the years with the 10 highest values and 10 lowest values of the FST and SSK chronologies in the common period revealed that there were four high-value years (1595, 1704, 1924, and 2002) and six low-value years (1776, 1878, 1918, 1951, 1957, and 1974) in total.
The above results and similar natural environments for the two sampling sites (Table 1) indicated that the spruce radial growth in the Huangshuigou River watershed was well synchronized. Consequently, the series of tree-ring widths in this watershed were combined to create the regional chronology HSR (Figure 3c). The information on tree-ring chronologies is listed in Table 2. The values of first-order autocorrelation (AC1) ranged from 0.485 to 0.555, indicating that the tree-ring width had low-frequency variation, which might have been influenced by the lag effects of climate and tree physiology. The high correlation coefficients among these ring-width series revealed a similar variation of tree growth in the study area. The values of signal-to-noise ratio (SNR) and EPS for the HSR chronology were obviously higher than the two chronologies for the single site due to the greater sample depth, indicating that the regional chronology might have contained more climatic signals. The reliable length of the HSR chronology was 536 years (1470–2005).

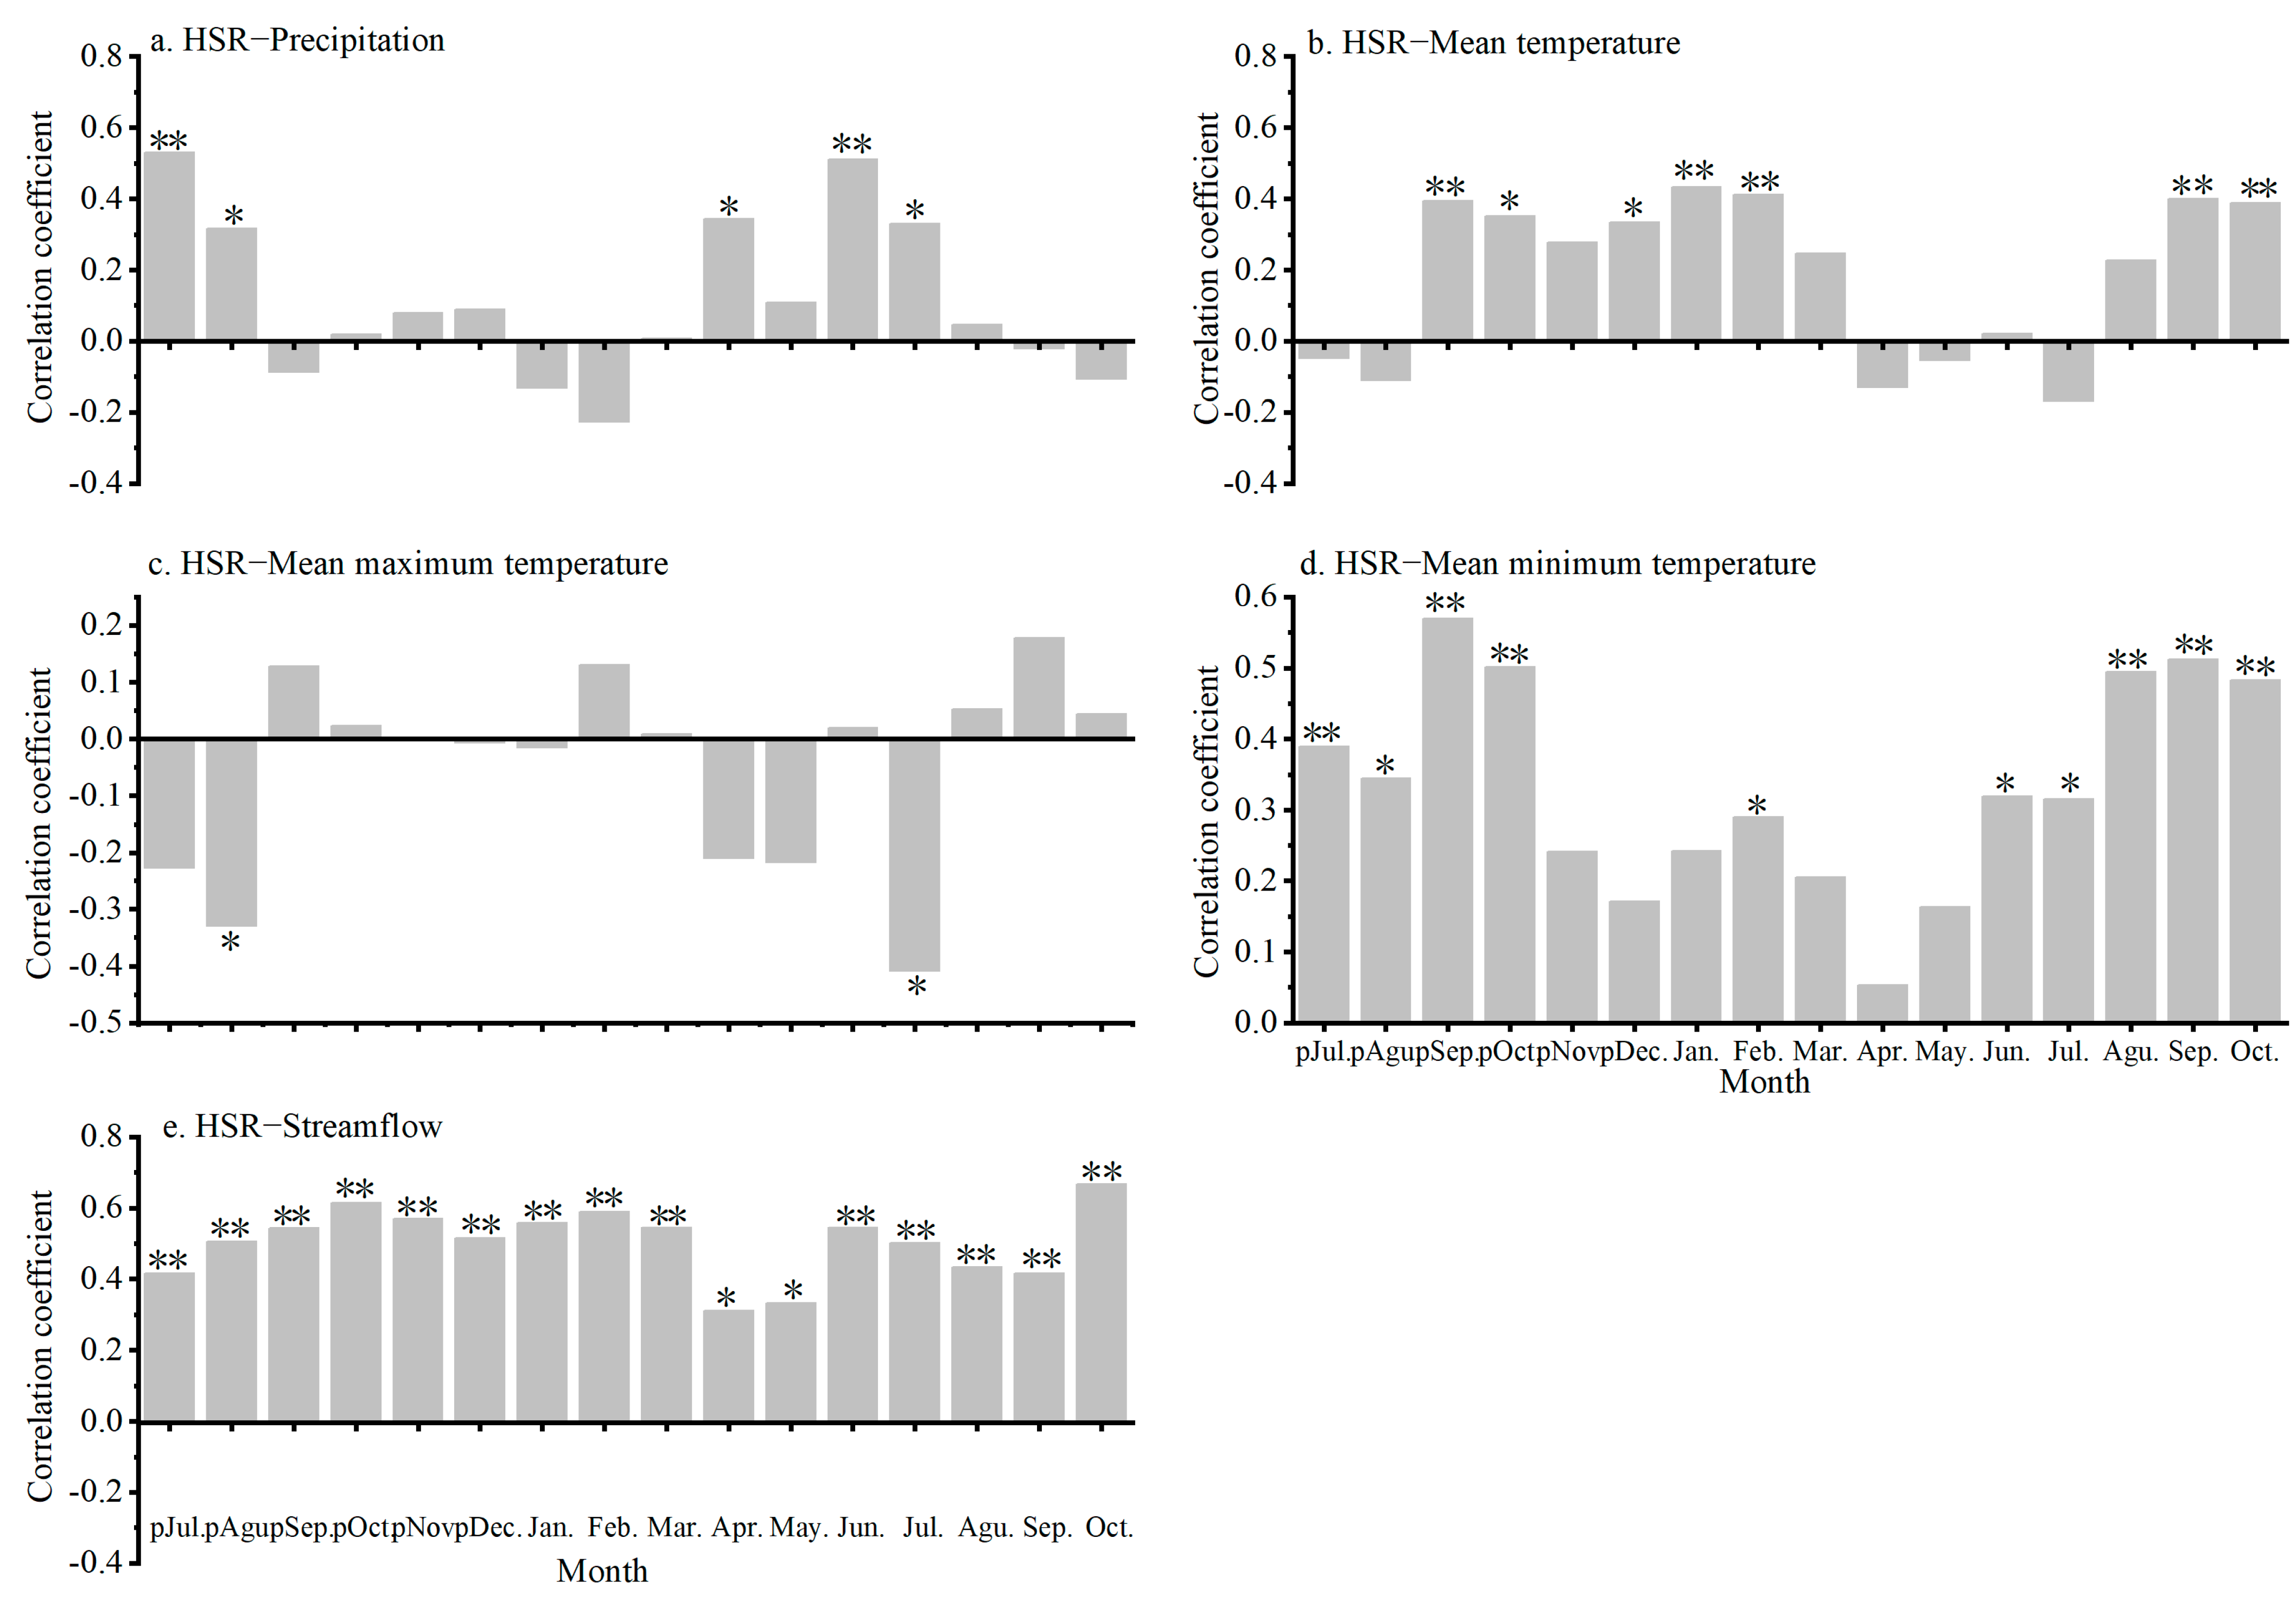
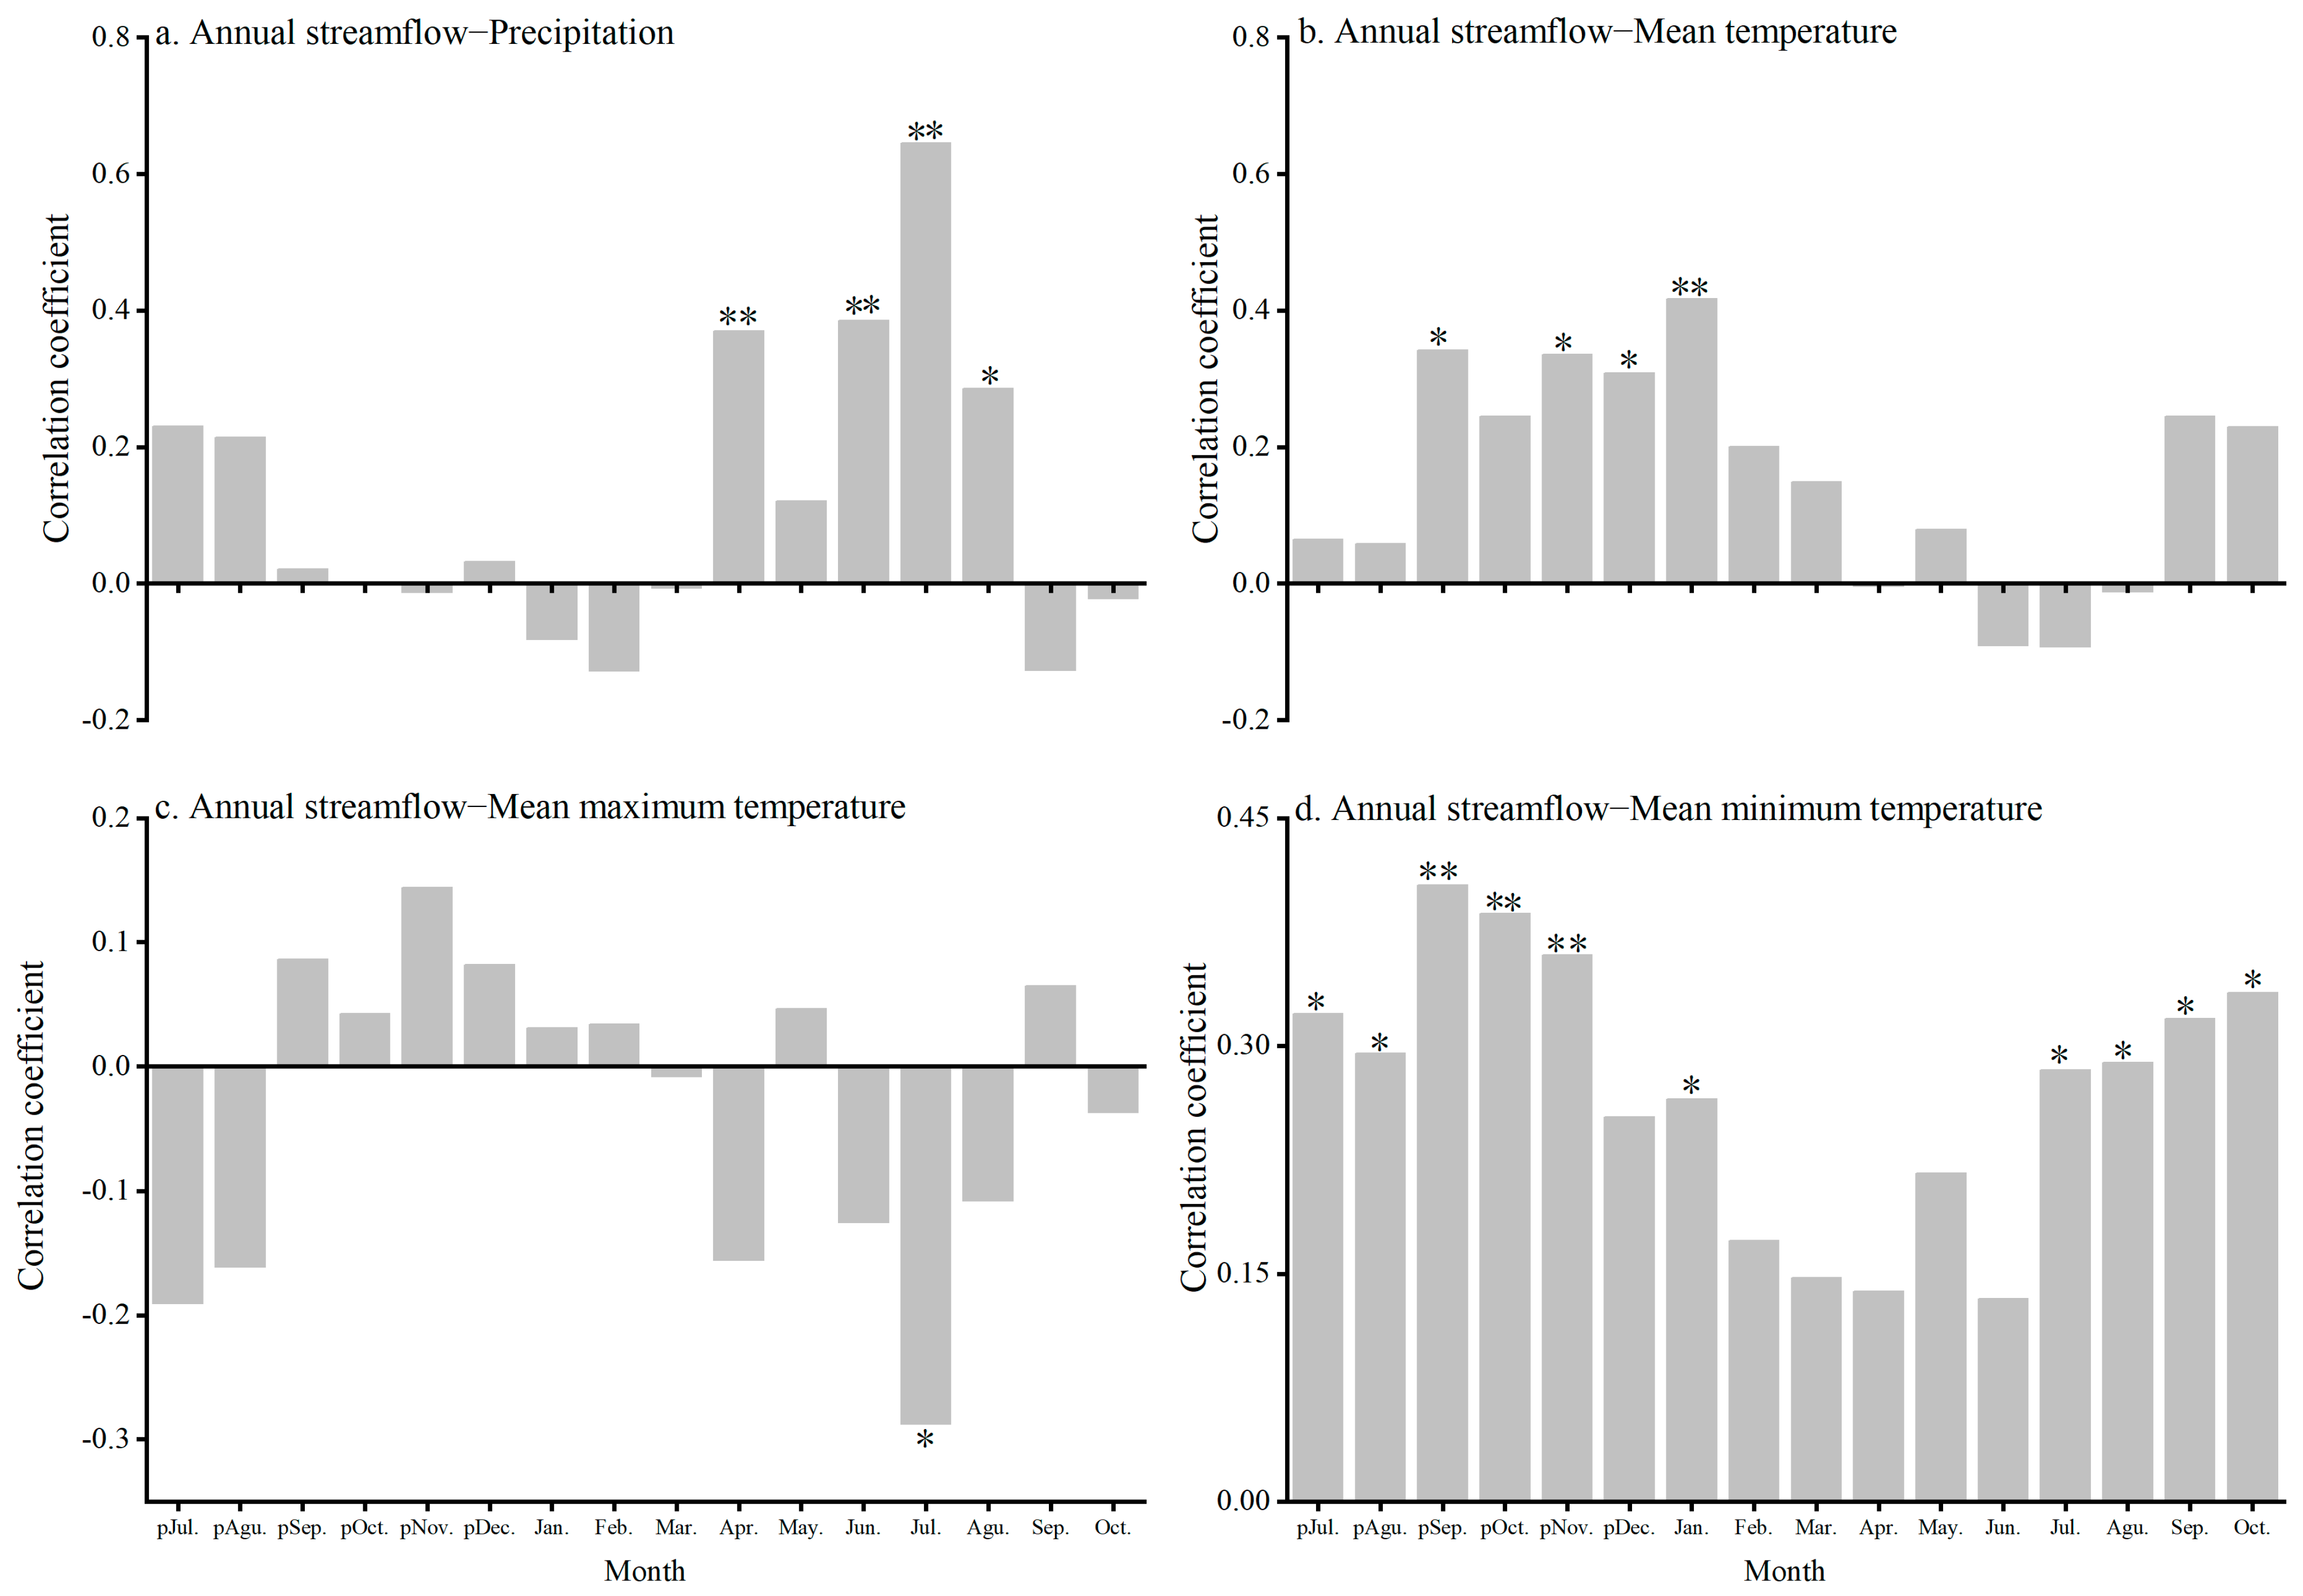
3.2. Climate Response Analysis

A strong biological lag effect was indicated by the high AC1 of two tree-ring chronologies for the single sampling site and the regional chronology (Table 2). Therefore, in order to evaluate the impact of hydrometeorological factors on the radial growth of spruces, monthly climate and hydrological data were applied from July in the previous year to October in the current year (covering a 16 month period) (Figure 4). The HSR chronology showed a substantial positive association with the 5 month average temperature with a 0.01 significance (Figure 4b), while significantly positive correlations between this chronology and precipitation were found in 2 months (Figure 4a). Additionally, the findings of the correlation analysis showed that streamflow and the HSR chronology had a better link than precipitation and temperature. The monthly streamflow data and the chronology had 14 clearly positive relationships. After examining several combinations of months, the HSR chronology and the streamflow from the previous August to the current July showed the greatest association coefficient (r = 0.766, p < 0.0001, n = 50).
The results for the correlation of streamflow to various meteorological factors in the period of 1958–2013 show that the yearly streamflow for Huangshuigou River positively correlated with mean temperature in January of the current year, as well as precipitation in April, June, and July of the current year, at the 0.01 significance level (Figure 5). After experimenting with various month combinations, the yearly streamflow and pSeptember–August precipitation (where p represents a month from the previous year) had the strongest connection (r = 0.805, n = 55).

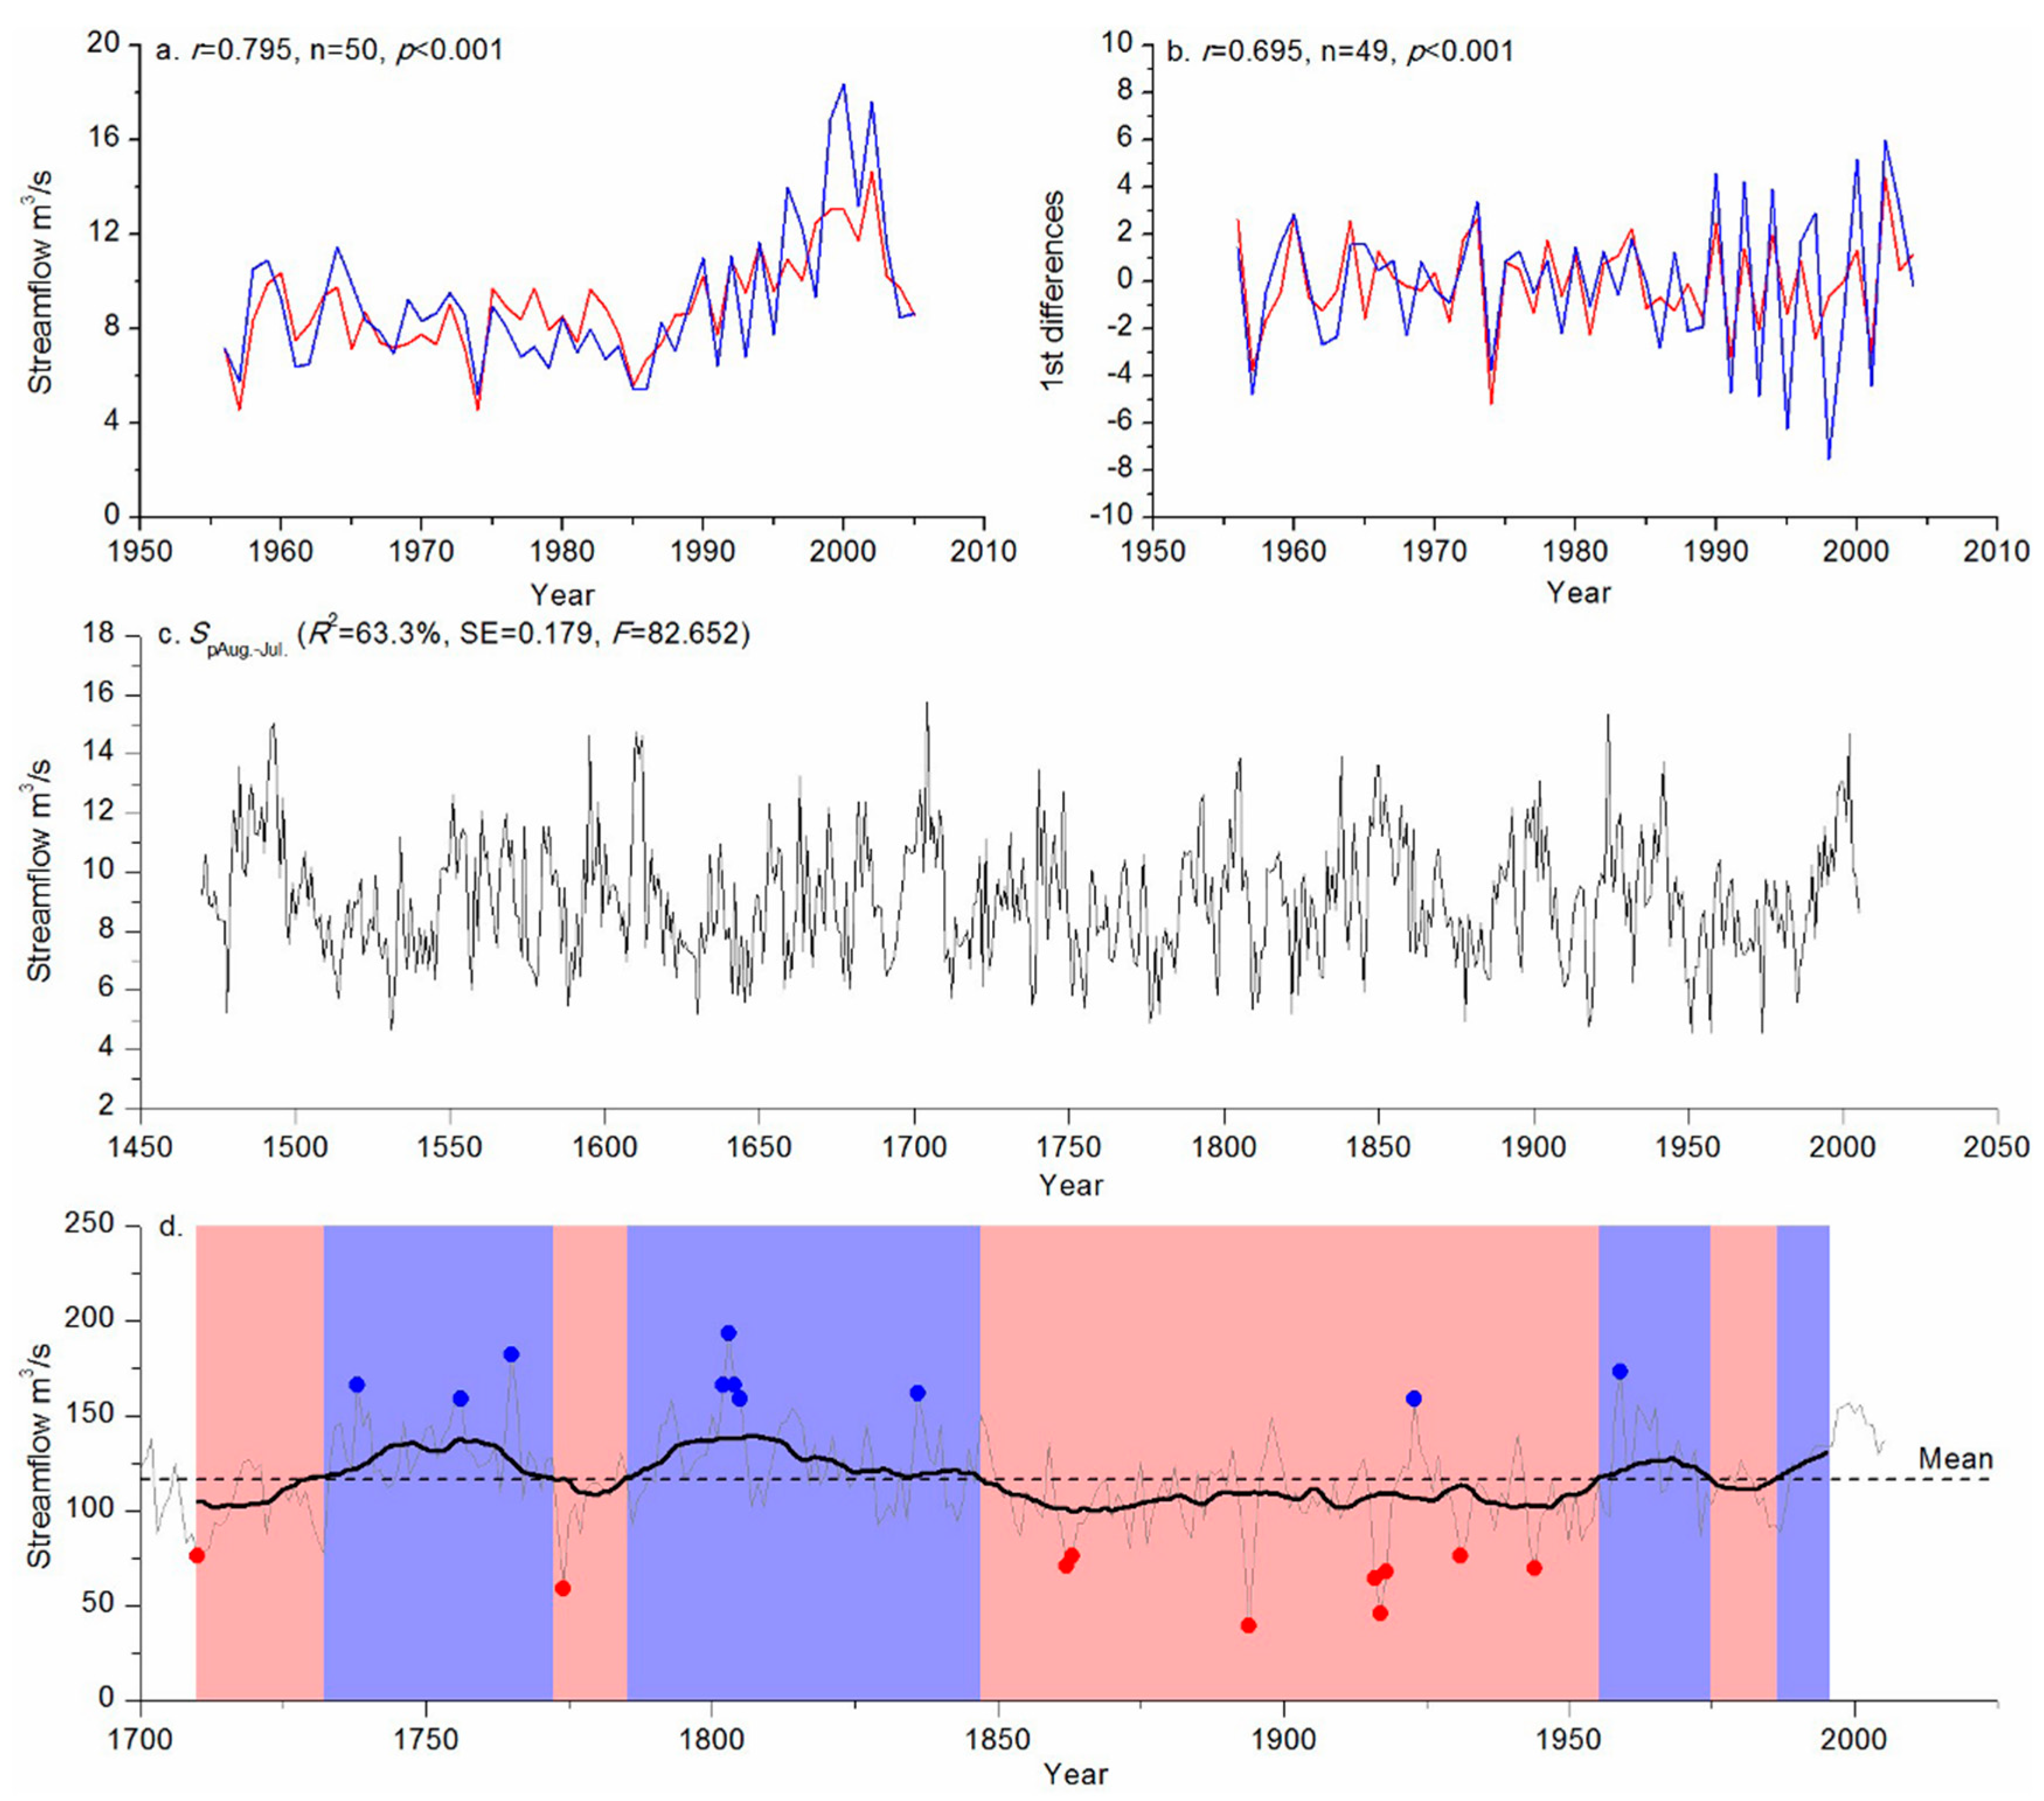
3.3. Streamflow Reconstruction and Its Reliability Tests

Due to the strong correlation between streamflow and spruce radial growth, we firstly reconstructed the pAugust–July streamflow of the targeted river using the regional chronology. These relationships were represented using the linear and exponential regression models:
SpAug.–Jul. = 2.803 + 6.583 × HSR,
(n = 50, r1 = 0.766, r2 = 0.639, R2 = 58.6%, R2adj = 57.8%, SE = 1.930, and F = 67.986),
SpAug.–Jul. = 4.565 × e0.675 × HSR,
(n = 50, r1 = 0.795, r2 = 0.695, R2 = 63.3%, R2adj = 62.5%, SE = 0.179, and F = 82.652),
where SpAug.–Jul. is the streamflow of Huangshuigou River from August of last year through July of the current year, and the regional tree-ring chronology is referred to as HSR. In the HSR chronology during the 1956–2005 calibration era, two models explained 58.6% and 63.3% of the streamflow variance. The results of the leave-one-out test revealed that, although these test values were almost identical to the initial values in the two models (Table 3), the correlation coefficients of Equation (2) were obviously higher than those of Equation (1). The results of split-sample calibration–verification tests (Table 4) revealed that the values of RE and t in the four verification periods all passed the test, while the values of Equation (2) were obviously higher. The value of CE of Equation (1) in 1956–1980 was negative, but the values of Equation (2) all exceeded 0. The streamflow series reconstructed by Equation (2) revealed a higher R2 and improved test results after comparison. Therefore, we used Equation (2) to reconstruct Huangshuigou River’s streamflow from August of last year through July of the current year in the years 1470–2005 (Figure 6c). Figure 6a,b reveal that the original and high-frequency domains of the reconstructed streamflow data closely match the measurement (r2 = 0.695, p < 0.001, n = 49) domains. Furthermore, the streamflow reconstruction for Kaidu River significantly correlated with the streamflow observation from August of last year through July of the current year (r = 0.797, p < 0.001, n = 38). Thus, the streamflow reconstructions of Kaidu River, Qingshui River, and Huangshuigou River in the common period were added together to reconstruct the total streamflow series for the upper catchment of Bosten Lake Basin, yielding the following model:
TSB = SK + SQ + SH,
where TSB is the total streamflow for the upper catchment of Bosten Lake Basin; SK, SQ, and SH respectively refer to the streamflow reconstructions of Kaidu River, Qingshui River, and Huangshuigou River. According to Equation (3), the streamflow series for the upper catchment of Bosten Lake Basin in the period of 1700–2005 is shown in Figure 6d.

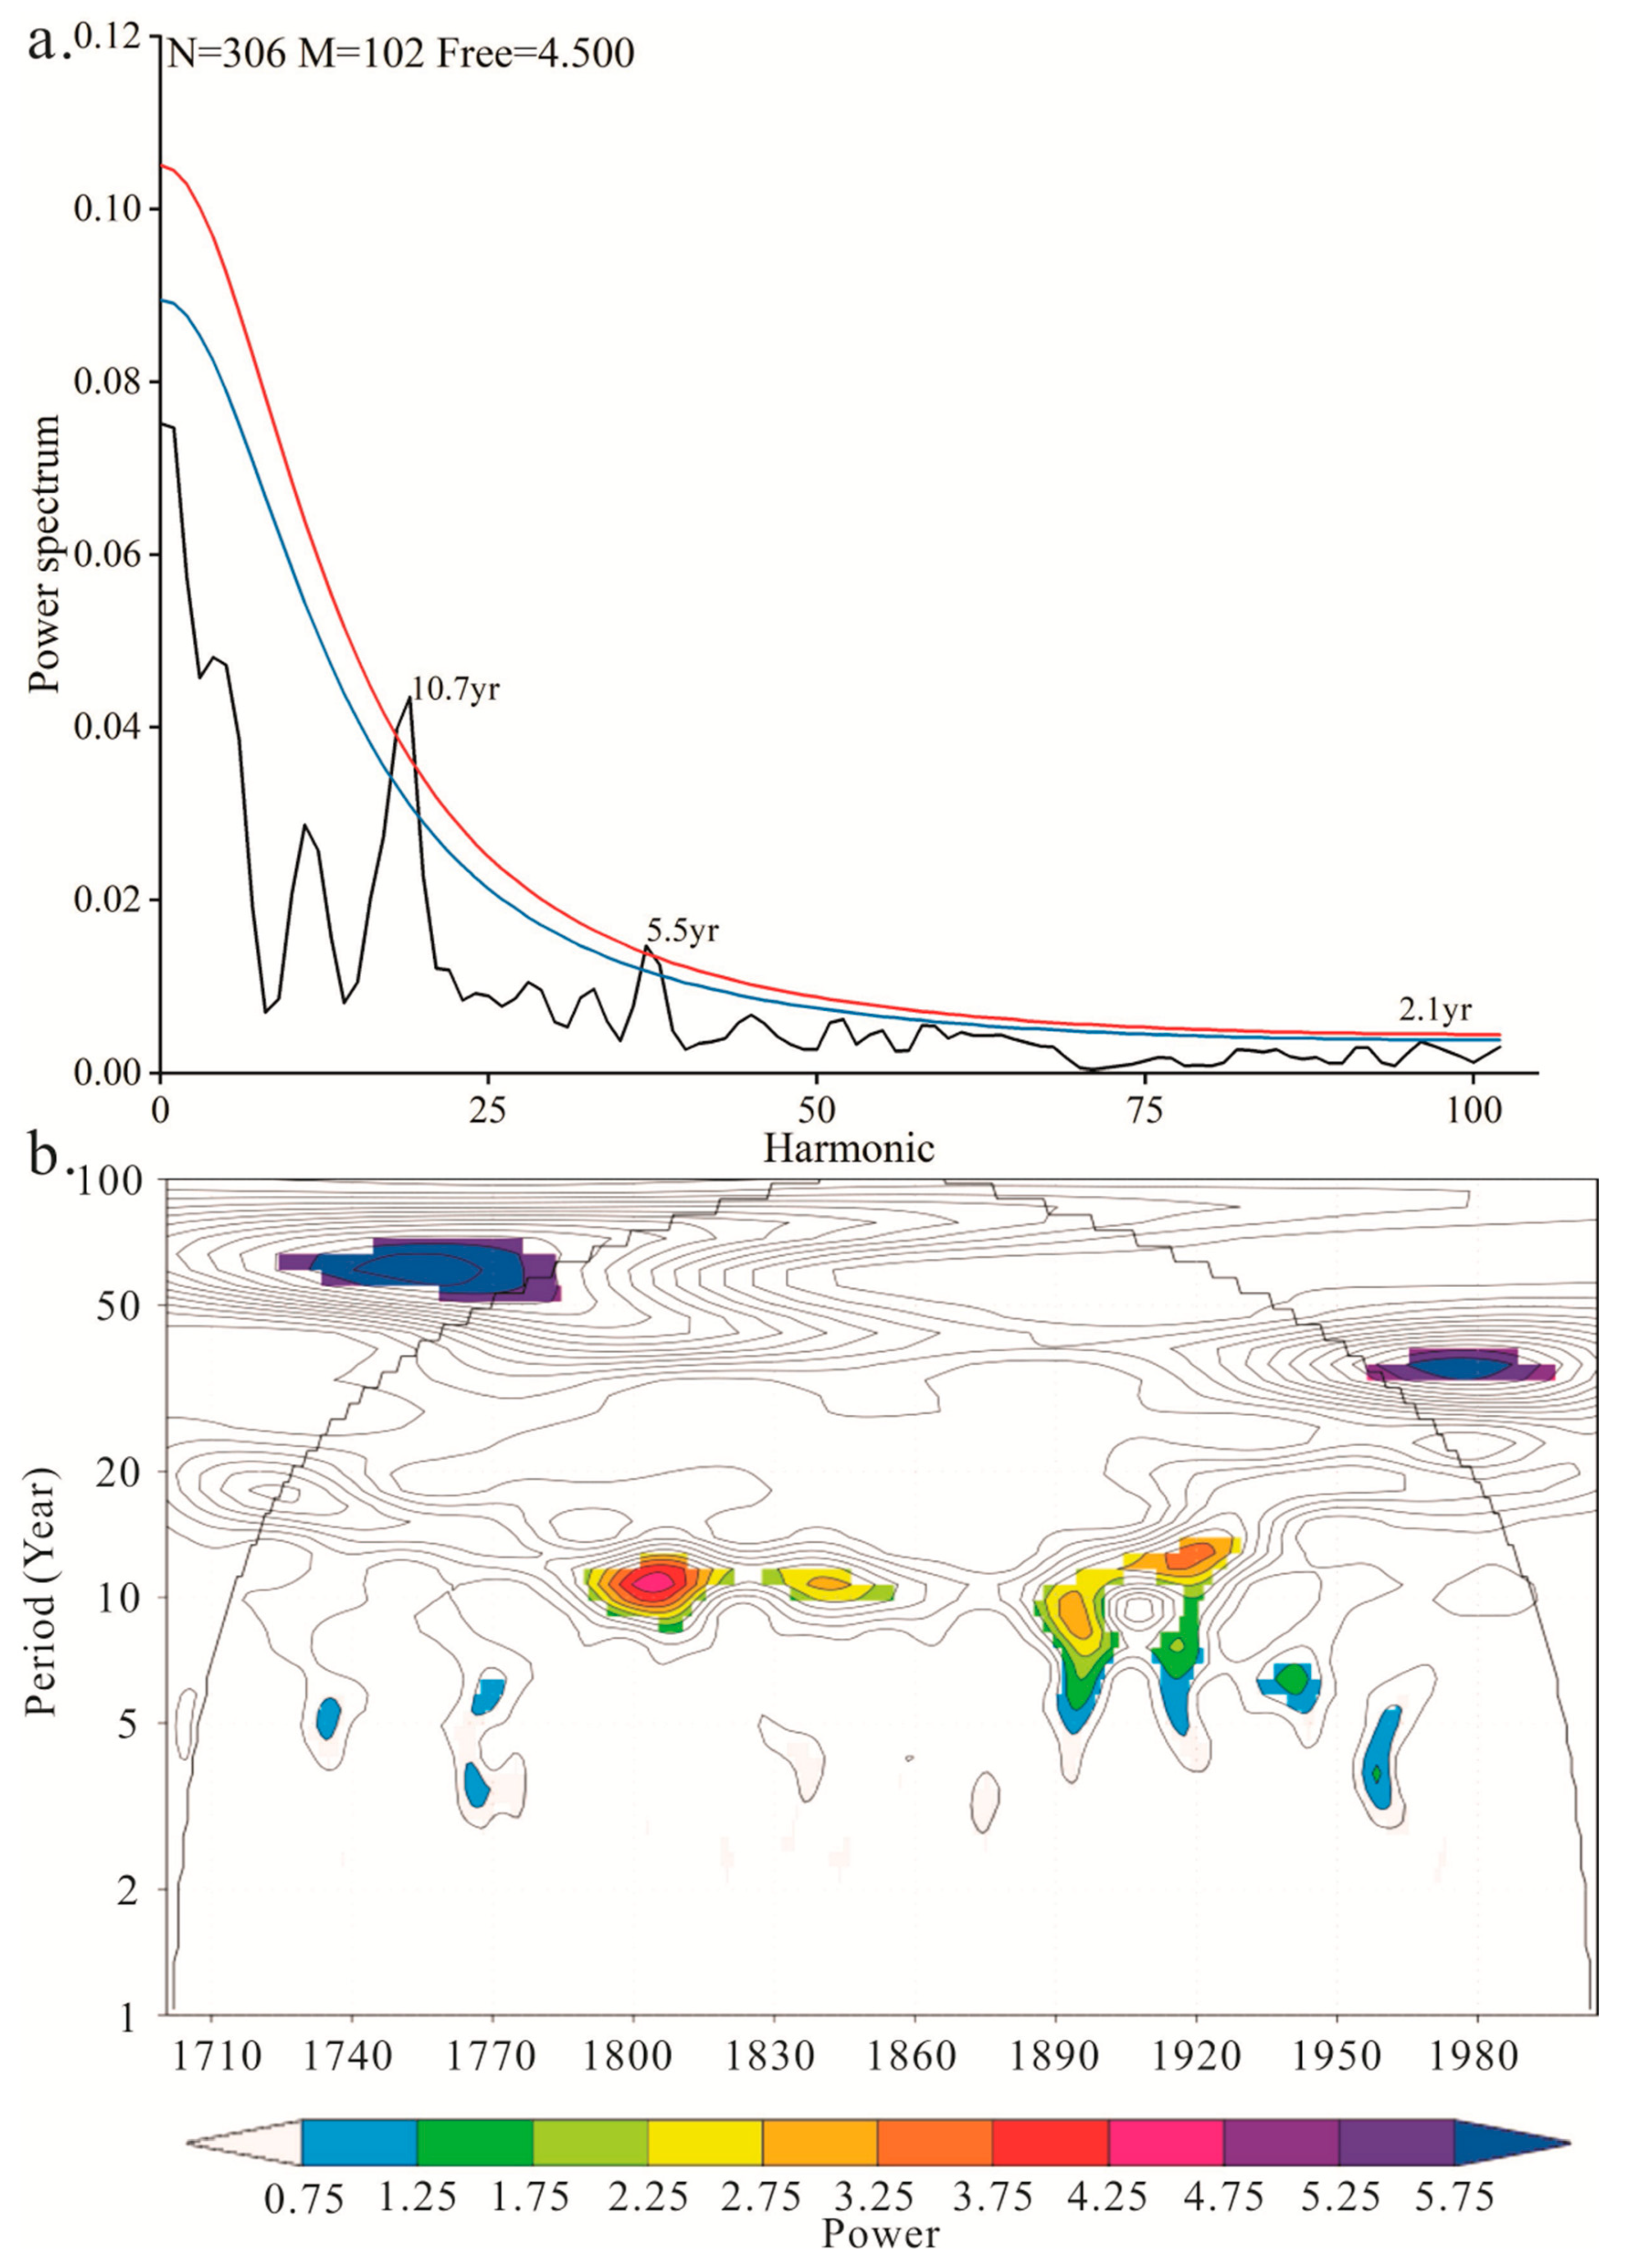
3.4. Characteristics of the Total Streamflow Series

The mean value of the total streamflow series for the upper catchment of Bosten Lake Basin was 117.083 m3/s with a standard deviation (σ) of 22.791 m3/s. For this series, according to the division approach proposed by Liu et al., we designated a wet year, defined as having values higher than the mean (139.873 m3/s), and a dry year, defined as having values lower than the mean (94.292 m3/s) [37]. The data showed that 45 years were dry, and 50 years could be classified as wet. The 211 years that remained were classified as normal. Table 5 contains the mean centenary values, as well as the extreme values of years/decades. As can be observed, there was a difference of 154.651 m3/s between the wettest (1803) and driest (1894) years and a difference of 47.141 m3/s between the wettest and driest decades (the 1800s and 1910s, respectively). For this total streamflow series, Table 5 also includes the long-term means and coefficients of variation.
In the total streamflow series of the upper catchment of Bosten Lake Basin, an analysis of decadal variability using a 21 year moving average was conducted (Figure 6d), which could be divided into four wet and four dry phases. The wet periods were 1730–1772, 1785–1846, 1955–1974, and 1987–1995 (above the series mean value). The dry periods were 1710–1729, 1773–1784, 1847–1954, and 1975–1986 (below the mean value). Power spectral examination of the whole duration of this series revealed significant periodicity at frequencies of 10.7 (p < 0.05), 5.5 (p < 0.05), and 2.1 (p < 0.1) years (Figure 7a). Figure 7b shows the results of wavelet analysis of the distinct cycle’s temporal properties. The wavelet analysis showed a strong, approximately 11 year cycle from 1790 to 1850 and from 1880 to 1930.

4. Discussion

Positive responses for precipitation were found in the previous and current fast growth season, while the positive correlations between tree-ring chronology and mean temperature occurred in the end growth season and non-growth season in the previous and current year. Substantial rain during the fast growth season may, in the context of arid and semi-arid regions, encourage photosynthesis, lead to larger needles, buds, and roots, and store more nutrients for the following growth season [38]. Thus, more precipitation in the above two periods would benefit the formation of a wider tree ring in the current and next year. In addition, the mean minimum temperature has a facilitating effect on tree growth (Figure 4d), and the mean minimum temperature reflects the nighttime temperature to some extent. When the nighttime temperature increases, it can promote the division of forming layer cells to a certain extent. In contrast, the mean maximum temperature usually occurs during the day, and the high temperature limits the accumulation of plant organic matter and affects tree growth. Schrenk spruce is a kind of evergreen conifer species, and its roots are distributed 40–60 cm underground [9]. Furthermore, the sampling trees in this study are located in the high-elevation area because the sampling locations are above 2600 m in height (Table 1). Thus, the forceful low temperature in winter might easily damage the needles exposed to the air and the roots distributed in the relatively shallow soil layer, especially in the high-elevation area. Contrarily, higher temperature at the end of the growing season and during the dormant season may shield needles, roots, and cambial cells from harm caused by the cold [39]. Additionally, a warmer winter might lessen the depth of frozen soil and advance the start of the growth season the following year [40]. These results due to abundant rainfall and high temperature would benefit the formation of a wider tree ring. Numerous dendroclimatological studies were conducted from west to east along the Tianshan Mountains, as well as in the surrounding mountain system, revealing similar climatic responses for Schrenk spruce to those mentioned above [41,42,43,44,45].
Although several significant correlations occurred in different months, the results of correlation analysis of the yearly streamflow of Huangshuigou River and monthly climatic data as a whole were quite similar to the climatic reactions of spruce radial growth (Figure 5). More precipitation in the wet season may bring more water for the watershed and directly increase the runoff of Huangshuigou River [46]. The minimum streamflow period of Huangshuigou River occurs in winter, when this river is primarily supplied by subsurface water [47]. Higher temperature in this period can retreat the depth of frozen soil and increase underground water. Thus, the streamflow may increase under this climate condition. An indirect connection has been established between the radial growth of spruces and the fluctuations in streamflow of Huangshuigou River caused by climatic factors based on the correlation results mentioned above. Coherent variations between tree-ring chronology and runoff have been widely found in the Central Asia. Yuan et al. (2007) reconstructed the Manasi River runoff variation in the Tianshan Mountains using the chronology of Schrenk spruce tree-ring width [48]. Zhang et al. (2019) developed a regional tree-ring width chronology of Schrenk spruce and reconstructed annual runoff for Issly Lake over 345 years [49]. Jiang et al. (2016) recorded the precipitation variation in the upper Irtysh River region for the past 291 years according to Siberian spruce tree-ring width [50]. Zhao et al. (2022) reconstructed the Ishim–Tobol River Basin’s hydrological changes over the past 299 years [51].
Solar radiation denotes the electromagnetic waves and the flow of particles emitted by the sun into the cosmic space. It is the energy source of Earth and the fundamental driving force of climatic formation and environmental evolution. It has been suggested that solar activity may have an impact on Earth’s climate by way of direct radiation, ultraviolet rays, cosmic ray, and geomagnetic field [52]. In accordance with the Schwabe cycle, solar activity alternates between active and quite phases, with each phase lasting approximately 11 years [53]. The 10.7 year cycles appearing in the total streamflow series for the upper catchment of Bosten Lake Basin suggest a possible connection with the above cycle of solar activity. According to Fu et al. [54], El Niño is the first to be impacted by solar activity, before transferring this influence to streamflow. The approximate 5 year cycle in the streamflow series falls within the range of the El Niño Southern Oscillation (ENSO) [55]. The reconstruction streamflow series, which was detected by cycle analyses and the interannual period (2.1 years), includes the Quasi-Biennial Oscillation [56]. For the various regions of the Tianshan Mountains, the aforementioned interdecadal and interannual cycles have been widely extrapolated from other tree-ring-based hydrometeorological reconstructions [14,41,49,57].
Unlike the exhaustive historical records from southern China, the records of hydrometeorological disasters in northwestern China are sporadic and isolated due to the historically low levels of human habitation and the nomadic lifestyle. The limited historical records do not sufficiently describe the past hydrometeorological fluctuations, but they can verify the accuracy of this recently developed streamflow series. The streamflow reconstruction’s wettest and driest year for the total streamflow series for the upper catchment of Bosten Lake Basin (Table 5) were compared to histories of hydrometeorological catastrophes in China’s Xinjiang Province. Table 6 reveals that the six wettest (1803–1805, 1836, 1923, and 1959) and six driest (1894, 1916–1918, 1931, and 1944) years have been documented in historical records [58]. The aforementioned coherence demonstrates that the streamflow series reconstruction can capture some signs of drought and flood occurrences for the surrounding area. Whenever a drought lasts for a significant amount of time, famines are always worsened, and social unrest is always exacerbated. The historical records from the 1710s and the 1860s to 1870s contain several accounts of ferocious clashes between local secession regimes and the central ruler (Xinjiang Academy of Social Sciences 1980). The driest of the reconstructed series coincide with the above two periods (Table 5). The Junggar Tribe and the Qing Dynasty engaged in battle in the 1690s, which lasted about 70 years. During the years 1864–1877, the Qing Dynasty fought with Aguber, and Zuo Zongtang put an end to Aguber’s rebellion, establishing Xinjiang Province.

5. Conclusions

Water in the upper catchment of Bosten Lake Basin is mainly supplied by Kaidu River, Qingshui River, and Huangshuigou River. To construct streamflow sequences for the historical period in the region, we first established a region tree-ring chronological series for the Huangshuigou River watershed using a total of 130 tree-ring width sequences of 67 living healthy Schrenk spruces from two sampling sites. On the basis of the high correlation between the tree-ring chronological series and streamflow data, streamflow sequences were constructed for the Huangshuigou River watershed from August of the previous year to July of the current year, from 1470 to 2005. By combining the already constructed historical streamflow series of the Qingshui River and Kaidu River watersheds, the historical streamflow series of the upper catchment of Bosten Lake Basin from August of the previous year to July of the current year were also reconstructed for a total of 306 years. The streamflow variation for the study area may have been influenced by solar activity and the oscillations of land–atmospheric–ocean circulation systems according to the result of spectral analysis. The streamflow reconstruction precisely captured the wettest (1803–1805, 1836, 1923, and 1959) and driest (1894, 1916–1918, 1931, and 1944) years noted in historical documents for the surrounding areas. Furthermore, two turbulent periods in Xinjiang corresponded to the reconstruction in the 1710s and 1860s–1870s. The frequent drought after 1700 might have been one of the main reasons for the conflicts increasing.

Author Contributions

Conceptualization, K.L., T.Z. and H.S.; methodology, K.L. and S.Y.; software, K.L., Y.F. and S.J.; writing—original draft preparation, K.L.; supervision, W.M. and X.L. All authors have read and agreed to the published version of the manuscript.

Funding

This research was supported by the National Natural Science Foundation of China (41975095 and U1803245) and the China Desert Meteorological Science Research Foundation (Sqj2020003).

Data Availability Statement

Data can be provided upon reasonable request.

Conflicts of Interest

The authors declare no conflict of interest.

References

  1. Stanev, E.V. Temporal and Spatial Patterns of Sea Level in Inland Basins: Recent Events in the Aral Sea. Geophys. Res. Lett. 2004, 31, L15505. [Google Scholar] [CrossRef]
  2. Bai, J.; Chen, X.; Li, J.; Yang, L.; Fang, H. Changes in the Area of Inland Lakes in Arid Regions of Central Asia during the Past 30 Years. Environ. Monit. Assess 2011, 178, 247–256. [Google Scholar] [CrossRef] [PubMed]
  3. Harris, A. Time Series Remote Sensing of a Climatically Sensitive Lake. Remote Sens. Environ. 1994, 50, 83–94. [Google Scholar] [CrossRef]
  4. Zuo, Q.; Dou, M.; Chen, X.; Zhou, K. Physically-Based Model for Studying the Salinization of Bosten Lake in China. Water Energy Abstr. 2007, 16, 5. [Google Scholar] [CrossRef] [Green Version]
  5. Huang, X.Z.; Chen, F.H.; Fan, Y.X.; Yang, M.L. Dry Late-Glacial and Early Holocene Climate in Arid Central Asia Indicated by Lithological and Palynological Evidence from Bosten Lake, China. Quat. Int. 2009, 194, 19–27. [Google Scholar] [CrossRef]
  6. Zhu, C.M.; Li, J.L.; Zhang, X.; Luo, J.C. Bosten water resource dynamic detection and feature analysis in recent 40 years by remote sensing. J. Nat. Resour. 2015, 30, 106–114. (In Chinese) [Google Scholar]
  7. Guo, M.; Wu, W.; Zhou, X.; Chen, Y.; Li, J. Investigation of the Dramatic Changes in Lake Level of the Bosten Lake in Northwestern China. Theor. Appl. Climatol. 2015, 119, 341–351. [Google Scholar] [CrossRef]
  8. Sun, Z.D.; Opp, C.; Wang, R.; Gao, Q.Z. Response of land surface flow to climate change in the mountain regions of Bosten Lake valley, Xinjiang, China. J. Mt. Sci. 2010, 28, 206–211. (In Chinese) [Google Scholar] [CrossRef]
  9. Luo, C.; Wu, S.L. Analysis on the changes of temperature and precipitation in the Bosten Lake basin, Xinjiang. J. Beihua Univ. (Nat. Sci.) 2013, 14, 472–475. (In Chinese) [Google Scholar]
  10. Gou, X.; Chen, F.; Cook, E.; Jacoby, G.; Yang, M.; Li, J. Streamflow Variations of the Yellow River over the Past 593 Years in Western China Reconstructed from Tree Rings: Streamflow variations of the Yellow River. Water Resour. Res. 2007, 43. [Google Scholar] [CrossRef]
  11. Gou, X.; Deng, Y.; Chen, F.; Yang, M.; Fang, K.; Gao, L.; Yang, T.; Zhang, F. Analysis of tree-ring reconstruction and change characteristics of the flow of the upper Yellow River in the past 1234 years. Chin. Sci. Bull. 2010, 55, 3236–3243. (In Chinese) [Google Scholar] [CrossRef]
  12. Woodhouse, C.A.; Lukas, J.J. Multi-Century Tree-Ring Reconstructions of Colorado Streamflow for Water Resource Planning. Clim. Change 2006, 78, 293–315. [Google Scholar] [CrossRef]
  13. Woodhouse, C.A.; Gray, S.T.; Meko, D.M. Updated Streamflow Reconstructions for the Upper Colorado River Basin. Water Resour. Res. 2006, 42. [Google Scholar] [CrossRef]
  14. Panyushkina, I.P.; Meko, D.M.; Macklin, M.G.; Toonen, W.H.J.; Mukhamadiev, N.S.; Konovalov, V.G.; Ashikbaev, N.Z.; Sagitov, A.O. Runoff Variations in Lake Balkhash Basin, Central Asia, 1779–2015, Inferred from Tree Rings. Clim. Dyn. 2018, 51, 3161–3177. [Google Scholar] [CrossRef]
  15. Liu, Y.; Song, H.; An, Z.; Sun, C.; Trouet, V.; Cai, Q.; Liu, R.; Leavitt, S.W.; Song, Y.; Li, Q.; et al. Recent Anthropogenic Curtailing of Yellow River Runoff and Sediment Load Is Unprecedented over the Past 500 y. Proc. Natl. Acad. Sci. USA 2020, 117, 18251–18257. [Google Scholar] [CrossRef]
  16. Ferrero, M.E.; Villalba, R.; De Membiela, M.; Hidalgo, L.F.; Luckman, B.H. Tree-Ring Based Reconstruction of Río Bermejo Streamflow in Subtropical South America. J. Hydrol. 2015, 525, 572–584. [Google Scholar] [CrossRef]
  17. Pederson, N.; Jacoby, G.C.; D’Arrigo, R.D.; Cook, E.R.; Buckley, B.M.; Dugarjav, C.; Mijiddorj, R. Hydrometeorological Reconstructions for Northeastern Mongolia Derived from Tree Rings: 1651–1995. J. Climate 2001, 14, 872–881. [Google Scholar] [CrossRef]
  18. Zhang, T.; Liu, Y.; Zhang, R.; Yu, S.; Fan, Y.; Shang, H.; Jiang, S.; Qin, L.; Zhang, H. Tree-Ring Width Based Streamflow Reconstruction for the Kaidu River Originating from the Central Tianshan Mountains since AD 1700. Dendrochronologia 2020, 61, 125700. [Google Scholar] [CrossRef]
  19. Chen, F.; Huang, X.; Yang, M.; Yang, X.; Fan, Y.; Zhao, H. Westerly dominated Holocene climate model in arid central Asia-Case study on Bosten Lake Basin, Xinjiang, China. Quat. Sci. 2006, 26, 881–887. (In Chinese) [Google Scholar]
  20. Wang, H.; Pan, Y.; Chen, Y. Impacts of Regional Climate and Teleconnection on Hydrological Change in the Bosten Lake Basin, Arid Region of Northwestern China. J. Water Clim. Change 2018, 9, 74–88. [Google Scholar] [CrossRef]
  21. Li, Y.; Chen, Y.; Zhang, Q.; Fang, G. Analysis of the change in water level and its influencing factors on Bosten Lake Basin from 1960 to 2018. Arid. Zone Res. 2021, 38, 48–58. (In Chinese) [Google Scholar] [CrossRef]
  22. Speer, J.H. Fundamentals of Tree-Ring Research; University of Arizona Press: Tucson, AZ, USA, 2010. [Google Scholar]
  23. Holmes, R.L. Computer-Assisted Quality Control in Tree-Ring Dating and Measurement; Tree-Ring Society: Tucson, AZ, USA, 1983. [Google Scholar]
  24. Cook, E.R.; Krusic, P.J. Program ARSTAN: A Tree-Ring Standardization Program Based on Detrending and Autoregressive Time Series Modeling, with Interactive Graphics; Lamont-Doherty Earth Observatory, Columbia University: Palisades, NY, USA, 2005. [Google Scholar]
  25. Cook, E.R. A Time Series Analysis Approach to Tree Ring Standardization. Ph.D. Thesis, University of Arizona Tucson, Tucson, AZ, USA, 1985. [Google Scholar]
  26. Wigley, T.M.; Briffa, K.R.; Jones, P.D. On the Average Value of Correlated Time Series, with Applications in Dendroclimatology and Hydrometeorology. J. Appl. Meteorol. Climatol. 1984, 23, 201–213. [Google Scholar] [CrossRef]
  27. D’Arrigo, R.; Mashig, E.; Frank, D.; Wilson, R.; Jacoby, G. Temperature Variability over the Past Millennium Inferred from Northwestern Alaska Tree Rings. Clim. Dyn. 2005, 24, 227–236. [Google Scholar] [CrossRef]
  28. Liu, Y.; Wang, C.; Hao, W.; Song, H.; Cai, Q.; Tian, H.; Sun, B.; Linderholm, H.W. Tree-Ring-Based Annual Precipitation Reconstruction in Kalaqin, Inner Mongolia for the Last 238 Years. Chin. Sci. Bull. 2011, 56, 2995–3002. [Google Scholar] [CrossRef] [Green Version]
  29. Opala, M.; Mendecki, M.J. An Attempt to Dendroclimatic Reconstruction of Winter Temperature Based on Multispecies Tree-Ring Widths and Extreme Years Chronologies (Example of Upper Silesia, Southern Poland). Theor. Appl. Climatol. 2014, 115, 73–89. [Google Scholar] [CrossRef] [Green Version]
  30. Zhang, T.; Shang, H.; Fan, Y.; Yu, S.; Zhang, R.; Qin, L.; Jiang, S. A 475-Year Tree-Ring-Width Record of Streamflow for the Qingshui River Originating in the Southern Slope of the Central Tianshan Mountains, China. Geogr. Ann. Ser. A Phys. Geogr. 2020, 102, 247–266. [Google Scholar] [CrossRef]
  31. Fritts, H. Tree Rings and Climate; Academic Press, Inc. Ltd.: London, UK; New York, NY, USA, 1976. [Google Scholar]
  32. Schweingruber, F.H.; Briffa, K.R.; Nogler, P. A Tree-Ring Densitometric Transect from Alaska to Labrador. Int. J. Biometeorol. 1993, 37, 151–169. [Google Scholar] [CrossRef]
  33. Yuan, Y.; Zhang, T.; Wei, W.; Nievergelt, D.; Verstege, A.; Yu, S.; Zhang, R.; Esper, J. Development of Tree-Ring Maximum Latewood Density Chronologies for the Western Tien Shan Mountains, China: Influence of Detrending Method and Climate Response. Dendrochronologia 2013, 31, 192–197. [Google Scholar] [CrossRef]
  34. Michaelsen, J. Cross-Validation in Statistical Climate Forecast Models. J. Appl. Meteorol. Climatol. 1987, 26, 1589–1600. [Google Scholar] [CrossRef]
  35. Meko, D.; Graybill, D.A. Tree-Ring Reconstruction of Upper Gila Rwer Discharge 1. JAWRA J. Am. Water Resour. Assoc. 1995, 31, 605–616. [Google Scholar] [CrossRef]
  36. Cook, E.R.; Meko, D.M.; Stahle, D.W.; Cleaveland, M.K. Drought Reconstructions for the Continental United States. J. Clim. 1999, 12, 1145–1162. [Google Scholar] [CrossRef]
  37. Liu, Y.; Zhang, X.; Song, H.; Cai, Q.; Li, Q.; Zhao, B.; Liu, H.; Mei, R. Tree-Ring-Width-Based PDSI Reconstruction for Central Inner Mongolia, China over the Past 333 Years. Clim. Dyn. 2017, 48, 867–879. [Google Scholar] [CrossRef]
  38. Liang, E.; Shao, X.; Hu, Y.; Lin, J. Dendroclimatic Evaluation of Climate-Growth Relationships of Meyer Spruce (Picea Meyeri) on a Sandy Substrate in Semi-Arid Grassland, North China. Trees 2001, 15, 230–235. [Google Scholar] [CrossRef]
  39. Pederson, N.; Cook, E.R.; Jacoby, G.C.; Peteet, D.M.; Griffin, K.L. The Influence of Winter Temperatures on the Annual Radial Growth of Six Northern Range Margin Tree Species. Dendrochronologia 2004, 22, 7–29. [Google Scholar] [CrossRef]
  40. Zhang, T.; Yuan, Y.; Liu, Y.; Wei, W.; Zhang, R.; Chen, F.; Yu, S.; Shang, H.; Qin, L. A Tree-Ring Based Temperature Reconstruction for the Kaiduhe River Watershed, Northwestern China, since AD 1680: Linkages to the North Atlantic Oscillation. Quat. Int. 2013, 311, 71–80. [Google Scholar] [CrossRef]
  41. Li, J.; Gou, X.; Cook, E.R.; Chen, F. Tree-Ring Based Drought Reconstruction for the Central Tien Shan Area in Northwest China. Geophys. Res. Lett. 2006, 33. [Google Scholar] [CrossRef] [Green Version]
  42. Zhang, T.; Zhang, R.; Yuan, Y.; Gao, Y.; Wei, W.; Diushen, M.; He, Q.; Shang, H.; Wang, J. Reconstructed Precipitation on a Centennial Timescale from Tree Rings in the Western Tien Shan Mountains, Central Asia. Quat. Int. 2015, 358, 58–67. [Google Scholar] [CrossRef]
  43. Jiao, L.; Jiang, Y.; Wang, M.; Kang, X.; Zhang, W.; Zhang, L.; Zhao, S. Responses to Climate Change in Radial Growth of Picea schrenkiana along Elevations of the Eastern Tianshan Mountains, Northwest China. Dendrochronologia 2016, 40, 117–127. [Google Scholar] [CrossRef]
  44. Chen, F.; He, Q.; Bakytbek, E.; Yu, S.; Zhang, R. Reconstruction of a Long Streamflow Record Using Tree Rings in the Upper Kurshab River (Pamir-Alai Mountains) and Its Application to Water Resources Management. Int. J. Water Resour. Dev. 2017, 33, 976–986. [Google Scholar] [CrossRef]
  45. Shang, H.M.; Mamattuersun, K.; Li, H.; Yu, S.; Zhang, R.; Zhang, T.; Chen, F.; Lu, H.; Wei, W.; Yuan, Y. Evaluation on the climatic information of tree-ring width of Picea schrenkiana from Yarkand River Basin. Desert Oasis Meteorol. 2017, 11, 17–24. (In Chinese) [Google Scholar]
  46. Zhou, J.; Abulimiti, A.; Mao, W.; Jiao, M.; An, M.; Shen, Y. The responses of the runoff processes to climate in the Qingshuihe River watershed on the southern slope of Tianshan Mountains. J. Glaciol. Geocryol. 2014, 36, 685–690. (In Chinese) [Google Scholar]
  47. Zhou, J.; Gao, Y.; Shen, Y.; Han, T.; Mao, W. Response of extreme hydrological events to climate change in cold watersheds of Huangshuigou River and Qingshuihe River on the southern slope of Tianshan. J. Glaciol. Geocryol. 2014, 36, 1042–1048. (In Chinese) [Google Scholar]
  48. Yuan, Y.; Shao, X.; Wei, W.; Yu, S.; Gong, Y.; Trouet, V. The Potential to Reconstruct Manasi River Streamflow in the Northern Tien Shan Mountains (NW China). Tree Ring Res. 2007, 63, 81–93. [Google Scholar] [CrossRef] [Green Version]
  49. Zhang, T.; Diushen, M.; Bakytbek, E.; Shang, H.; Gao, Y.; Huang, L.; Zhang, R.; Chen, F.; Yu, S.; Yin, Z. Tree Ring Record of Annual Runoff for Issyk Lake, Central Asia. J. Water Clim. Change 2019, 10, 610–623. [Google Scholar] [CrossRef] [Green Version]
  50. Jiang, S.; Yuan, Y.; Chen, F.; Shang, H.; Zhang, T.; Yu, S.; Qin, L.; Zhang, R. A 291 year precipitation reconstruction in the upper Irtyshn river basin based on tree-ring width. Acta Ecol. Sin. 2016, 36, 2866–2875. (In Chinese) [Google Scholar]
  51. Zhao, X.; Zhang, R.; Chen, F.; Bagila, M.; Vitaliy, K.; Bulkair, M.; Yu, S.; He, Q.; Daniyar, D.; Nurzhan, K. Reconstructed summertime (June–July) streamflow dating back to 1788 CE in the Kazakh Uplands as inferred from tree rings. J. Hydrol. Reg. Stud. 2022, 40, 101007. [Google Scholar] [CrossRef]
  52. Xiao, Z. Impact of solar activity on Earth’s climate. Chin. J. Nat. 2021, 43, 408–419. (In Chinese) [Google Scholar]
  53. Nagovitsyn, Y.A. A Nonlinear Mathematical Model for the Solar Cyclicity and Prospects for Reconstructing the Solar Activity in the Past. Astron. Lett. 1997, 23, 742–748. [Google Scholar]
  54. Fu, C.; James, A.L.; Wachowiak, M.P. Analyzing the Combined Influence of Solar Activity and El Niño on Streamflow across Southern Canada. Water Resour. Res. 2012, 48. [Google Scholar] [CrossRef]
  55. Allan, R.; Lindesay, J.; Parker, D. El Niño Southern Oscillation and Climatic Variability; CSIRO Publishing: Collingwood, Australia, 1996. [Google Scholar]
  56. Baldwin, M.P.; Gray, L.J.; Dunkerton, T.J.; Hamilton, K.; Haynes, P.H.; Randel, W.J.; Holton, J.R.; Alexander, M.J.; Hirota, I.; Horinouchi, T. The Quasi-Biennial Oscillation. Rev. Geophys. 2001, 39, 179–229. [Google Scholar] [CrossRef]
  57. Chen, F.; Yuan, Y. Streamflow Reconstruction for the Guxiang River, Eastern Tien Shan (China): Linkages to the Surrounding Rivers of Central Asia. Environ. Earth Sci. 2016, 75, 1–9. [Google Scholar]
  58. Wen, K.G.; Shi, Y.G.; Ren, Y.Y. Documents of Chinese Meteorological Disaster: Volume of Xinjiang; Meteorological Publishers: Bejing, China, 2006. (In Chinese) [Google Scholar]
Figure 1. Location map of the study area, mainly showing the distribution of rivers, hydrological stations, meteorological stations, and sampling sites.
Forests 14 00622 g001
Figure 2. (a) Monthly mean temperature, (b) annual mean temperature, (c) monthly mean precipitation, (d) annual total precipitation at the Baluntai meteorological station. (e) Monthly mean streamflow and (f) annual mean streamflow at Huangshuigou hydrological station.
Forests 14 00622 g002
Figure 3. The upper part of each figure represents the chronology and sample depth, and the lower part is expressed population signal (EPS) and mean inter-series correlation (Rbar) of tree-ring width chronology.
Forests 14 00622 g003
Figure 4. Pearson correlations between hydroclimatic data and the HSR chronology; * p < 0.05, ** p < 0.01.
Forests 14 00622 g004
Figure 5. Pearson correlations between Huangshuigou River’s yearly streamflow and climate information; * p < 0.05, ** p < 0.01.
Forests 14 00622 g005
Figure 6. Information on streamflow reconstruction: (a) comparison between Huangshuigou River’s reconstructed (red line) and observed (blue line) streamflow for pAugust–July; (b) comparison of the first differences (year-to-year changes) between the recorded (blue line) and reconstructed (red line) streamflow series; (c) reconstructed streamflow for Huangshuigou River from August of last year through July of the current year during the period of 1470–2005; (d) streamflow series for the upper catchment of Bosten Lake Basin in the period of 1700–2005, including Qingshui River, Kaidu River, and Huangshuigou River.
Forests 14 00622 g006
Figure 7. (a) Power spectrum and (b) wavelet analysis of the reconstruction of streamflow from August of last year through July of the current year. The red line indicates a 95% confidence level, whereas the blue line indicates a 90% confidence level.
Forests 14 00622 g007
Table 1. The information of sampling sites in the upper catchment of Bosten Lake Basin.
WatershedSite NameSite CodeLatitude (N)Longitude (E)Trees/CoresElevation (m)AspectSlopeMaximum
Tree Age
The Rate of Absent Rings (%)
Kaidu
River
AermuxiAEM42.49°84.72°25/50~2540W20°395
(1616–2010)
0.552
AkenxiaerAKX42.46°84.74°27/53~2740W15°378
(1633–2010)
0.289
TaoergaotingxiliTEG42.60°84.73°28/56~2560NW20°414
(1597–2010)
0.409
XingfumuchangdongXFE42.66°84.56°28/56~2490N25°316
(1694–2009)
0.329
XingfumuchangnanXFN42.63°84.61°29/58~2650N35°355
(1656–2010)
0.250
Qingshui
River
NayitigouNYS42.53°86.97°31/60~2870NNW20°405
(1611–2015)
0.994
QingshuiheQSB42.55°86.67°27/53~2710N40°580
(1436–2015)
0.787
Huangshuigou
River
FusitanFST42.75°86.45°34/66~2600N40°744
(1262–2005)
3.019
SasekeSSK42.60°86.48°33/64~2800N40°439
(1567–2005)
0.666
Table 2. The statistical characteristics of SSK, FST, and synthetic regional chronology HSR.
StatisticFSTSSKHSR
Mean index (MI)0.9830.9520.998
Standard deviation (SD)0.3570.2640.340
Mean sensitivity (MS)0.3490.2220.314
First-order autocorrelation (AC1)0.4850.5550.508
Inter-series correlation between trees0.4260.3560.384
Inter-series correlation among all series0.4320.3640.388
Mean within-tree correlation0.7780.7530.769
Signal-to-noise ratio (SNR)43.32730.29462.029
Expressed population signal (EPS)0.9770.9680.984
First year EPS ≥ 0.85132016951470
Table 3. Results of the leave-one-out tests for the reconstruction of streamflow from August of last year through July of the current year using exponential and linear regression models.
StatisticLinear Regression Model
Mean (Range)
Exponential Regression Model
Mean (Range)
Correlation coefficient (r1)0.766 (0.733–0.783)0.795 (0.770–0.811)
Squared multiple correlation (R2)0.586 (0.538–0.613)0.633 (0.593–0.657)
Adjusted squared multiple correlation (R2adj)0.577 (0.528–0.604)0.625 (0.584–0.650)
Standard error (SE)1.929 (1.771–1.950)0.179 (0.174–0.181)
F-value (F)66.671 (54.7230–74.299)81.032 (68.388–90.222)
Table 4. Statistics of streamflow reconstruction from August of last year through July of the current year using linear and exponential regression models and split-sample calibration–verification tests; correlation coefficient (r1, r2), coefficient of determination (R2), reduction in error (RE), coefficient of efficiency (CE), product mean test (t), and sign test (S).
StatisticLinear Regression ModelExponential Regression Model
Calibration (1956–1980)Verification (1981–2005)Calibration (1981–2005)Verification (1956–1980)Full Calibration
(1956–2005)
Calibration (1956–1980)Verification (1981–2005)Calibration (1981–2005)Verification (1956–1980)Full Calibration
(1956–2005)
r10.621
(p < 0.001)
0.807
(p < 0.001)
0.841
(p < 0.001)
0.608
(p < 0.001)
0.766
(p < 0.001)
0.620
(p < 0.001)
0.847
(p < 0.001)
0.871
(p < 0.001)
0.604
(p < 0.001)
0.795
(p < 0.001)
r20.792
(p < 0.001)
0.579
(p < 0.01)
0.653
(p < 0.001)
0.786
(p < 0.001)
0.639
(p < 0.001)
0.781
(p < 0.001)
0.636
(p < 0.001)
0.696
(p < 0.001)
0.774
(p < 0.001)
0.695
(p < 0.001)
R20.3860.6520.7060.3700.5860.3850.7170.7590.3650.633
RE/0.674/0.485//0.703/0.661/
CE/0.599/–0.149//0.635/0.248/
t/4.307/3.170//4.642/3.653/
S/20 + /5–/15 + /10–//24 + /1–/16 + /9–/
Table 5. Summary of streamflow reconstruction characteristics from August of last year through July of the current year.
10 Wettest Years10 Driest Years10 Wettest Decades10 Driest DecadesLONG-TERM
YearValue
(m3/s)
YearValue
(m3/s)
DecadeMean Value
(m3/s)
DecadeMean Value
(m3/s)
YearsMean Value
(m3/s)
Variation
Coefficient
1803193.803 189439.1521800s142.794 1910s95.653 1700–1799119.1820.183
1765182.419 191745.688 1750s140.166 1860s97.068 1800–1899116.8560.204
1959173.156 177459.154 1990s137.890 1710s99.099 1900–1999113.5670.192
1804166.177 191664.630 1810s135.953 1930s100.268 1700–2005117.0830.194
1802166.169 191868.222 1760s134.339 1870s102.969
1738166.159 194469.927 1960s133.622 1770s103.196
1836161.934 186271.085 1790s133.339 1940s105.448
1756159.365 193176.214 1740s126.968 1850s106.451
1805159.044 171076.468 1920s123.448 1900s106.805
1923158.874 186376.551 1730s123.260 1980s107.755
Table 6. Comparison of streamflow reconstruction’s wettest and driest years from August of last year through July of the current year with the records of hydrometeorological disasters.
Short Description of Flood, Snowfall, Drought, or Locust Disasters for the Study Area and Surrounding Areas
Wettest Year
1803–18051. Frequently intense rainfall in Ili Prefecture, which is in the northwest of the study area, led to grain reduction in 1803.
2. Flood occurred in Yarkant River, a river source of Tarim River, in July 1804.
3. Thousands of people suffered from snowfall disaster in Huocheng County of Ili Prefecture, in spring 1804.
18361. Flood occurred in Dihua City (Urumqi now), which is in the north of the study area, in May 1836.
19231. Snowfall and freezing disasters occurred in Aletai Prefecture, which is in the north of the study area, leading to a large number of people and livestock death in winter 1922.
2. Intense rainfall led to a flood in Baiyang River, which is in the north of the study area, in July 1923.
19591. Frequently intense rainfall occurred in Akesu Prefecture, Boertala Prefecture, Changji Prefecture, Hami Prefecture, Kashi Prefecture, and Shihezi Prefecture, which are around the study area, in spring and summer 1959.
2. Great snowfalls occurred in Ili Prefecture, Tacheng Prefecture, and Boertala Prefecture, which are in the northwest of the study area, leading to a large amount of livestock death in spring 1959.
Driest Year
18941. Drought occurred in Dihua City and Changji Prefecture in 1893.
2. Plagues of locusts occurred in Wusu County of Tacheng Prefecture in June 1916.
1916–19181. Frequently great droughts occurred in Ili Prefecture and Kashi Prefecture in 1916–1918. People fled their homes, and 90% of rooms were empty.
2. Plagues of locusts occurred in Jinghe County of Boertala Prefecture, which is in the northwest of the study area, in June 1916.
19311. Great drought occurred in Shule County of Kashi Prefecture, which is in the southwest of the study area, in 1930.
19441. Less snowfall in the previous year and lack of rainfall in the current year, resulting in great drought, occurred in northern Xinjiang Province in 1943.
2. Drought occurred in Hutubi County, which is in the northwest of the study area, in 1944.
3. Frequent plagues of locusts occurred in Wusu County in 1943–1945.
Disclaimer/Publisher’s Note: The statements, opinions and data contained in all publications are solely those of the individual author(s) and contributor(s) and not of MDPI and/or the editor(s). MDPI and/or the editor(s) disclaim responsibility for any injury to people or property resulting from any ideas, methods, instructions or products referred to in the content.

