Article

Long-Term Climate Sensitivity of Resin-Tapped and Non-Resin-Tapped Scots Pine Trees Based on Tree Ring Width and Blue Intensity

by
Marcin Jakubowski
* and
Marek Dobroczyński
Department of Forest Utilisation, Faculty of Forestry and Wood Technology, Poznań University of Life Sciences, Wojska Polskiego 71 A, 60-625 Poznań, Poland
*
Author to whom correspondence should be addressed.
Forests 2023, 14(3), 593; https://doi.org/10.3390/f14030593
Submission received: 15 February 2023 / Revised: 10 March 2023 / Accepted: 15 March 2023 / Published: 16 March 2023

Abstract

:
The resin tapping of pine trees in Poland ended in the early 1990s. However, we can still find individual trees, and sometimes larger groups of trees, that were tapped. This study focused on the effect of the mechanical wounding of trees during resin tapping on the growth and climatic sensitivity of pine trees. The study concerned a 160-year-old pine stand in northwestern Poland in which resin tapping was last performed in the 1970s. All the trees had remained standing because of their high quality, which had destined them for seed collection. The stand included both resin-tapped (RT) and non-RT (NRT) trees. Our study was based on a dendrochronological analysis of two signals—annual tree ring widths (TRWs) and their delta blue intensity (DBI). We observed a significant increase in annual TRW after resin tapping had ceased, alongside a decrease in the DBI. The temporal stability in growth response was examined using daily climatic correlations from 1921 to 2021. It was found that the climatic sensitivity of RT and NRT pines was similar. There were differences in only some of the years, most while resin tapping was occurring, and then approximately 20 years after the resin tapping had ceased. However, these were small differences that mainly related to the strength of the correlation. It was also discovered that we can obtain different types of information from the study of TRWs and DBI.

1. Introduction

Pine resin tapping in Poland was conducted intensively after World War II, reaching a peak in the 1960s–1970s. About 15,000–20,000 tons of resin were tapped per year in Poland, mostly from Scots pine (Pinus sylvestris L.), which was also commonly tapped for resin in other European countries [1,2,3,4]. Over time, the mass cultivation of more productive pines in other regions of the world caused resin-tapping activities to cease in the Central European area, although in Western Europe, Pinus pinaster Aiton is still being resin-tapped (RT) [5]. In Poland, resin has not been harvested since 1994 [3]. When regular resin tapping was practiced in Poland, the main goal of forest management was to first produce raw wood material, with resin production being an additional activity. Consequently, trees approximately 90 years old, after accumulating raw wood material, were subject to resin tapping, after which the stands were planned to be harvested. However, it is still possible today to find individual trees or even groups of trees that were not felled. When the wounds were made for resin tapping, the trees were subjected to a severe stress situation, which continued throughout the resin-tapping period. In Poland, the wound exploitation would have lasted for 2 to 6 years. After this, the wounds would rapidly overgrow; these overgrowths are easily visible. According to current guidelines, 70% of the circumference of the trunk would be injured, making the wounds large and unable to completely heal. The uninjured part of the circumference—called the life band—was designed to keep the tree alive during the resin-tapping period. This 30% was left in one, two, or three zones around the circumference, depending on the diameter of the trunk. The regenerative abilities of Scots pine are so strong that the trees remained for many years with no apparent further damage [1,3,4].
Several researchers have addressed the climate sensitivity of Scots pine [6,7,8]. However, little work has been performed on the effects of resin tapping on pine growth, especially in an ecological context. A study by Zaluma et al. [4] suggested that RT pine trees in Latvia had retained their health and vitality several decades after the resin tapping had ceased. This is highly significant because those trees were so old (140–160 years). Van der Mateen et al. [1] determined that there were no differences between the climatic responses of RT versus non-RT (NRT) pines, the implication being that resin tapping is not associated with a significant climatic response in pine trees, as measured by annual increment width. A study by Magnuszewski et al. [3], conducted nearly 40 years after resin tapping had ceased, found a similarity in the growth patterns of RT and NRT pines (despite differences in their increment widths). By contrast, differences in the growth response of the two groups after resin tapping were found to occur at a height of 3.30 m. The aforementioned studies covered remote areas, and only in stands in Germany could the climatic sensitivity of RT pines be determined.
Most studies on trees are based on a chronology built on the tree ring width (TRW). This parameter is also historically the oldest and most widely used tool for studying climate sensitivity. However, we can use different sources of signals, such as the TRW and basal area increment (BAI), to determine different climatic information [9]. An important technique used by dendrochronologists is X-ray-determined wood density, otherwise referred to as maximum latewood density (MXD). Chronologies built on MXD can be used in temperature reconstructions [10] because these MXD data show a strong correlation with temperature, especially during summer [11,12]. Recent studies have also revealed that wood density can be used to study drought [13,14], using not only maximum density but also minimum density, which is more useful for obtaining a spring drought signal [15]. However, the X-ray technique is expensive and difficult to access, so researchers have been pursuing faster, cheaper, and more readily available methodologies [16].
One of these methods is blue intensity (BI), which is based on the reflection of blue light from certain anatomical elements of wood, scanned at high resolution [17]. Studies suggesting the utility of blue light reflectance in pine wood were first conducted quite a long time ago [18]. More recent studies have pointed to BI having a strong correlation with the X-ray-based wood density [19,20,21,22], and finding that it can be used on the wood of coniferous species to determine similar data. With the help of this technique, it has been possible to determine a proxy for latewood and earlywood density, or the difference between the two values—that is, delta BI (DBI) [23]. Previous applications of the BI technique have included dendro-climatic responses [24,25,26], especially those related to summer temperature [20,21,27], climate reconstructions [27,28,29], drought-related relationships [30,31,32], historic timber dating [27,33], and dendro-provenancing [34].
The climatic sensitivity of RT Scots pine has been under-researched. This is probably because resin tapping has not been conducted in this species for several decades. Such studies have more often been conducted on other species that are being actively tapped [6,35,36,37,38]. However, in Central Europe, there are sporadic long-term climatic records that allow comparison of the responses of RT and NRT pines to change [1]. Similar studies with slightly narrower scopes, involving comparing annual TRWs, have also been presented [2,3,4]. The annual TRWs of RT and NRT pines differ, but their sensitivity to climate has not been adequately examined. Earlier analyses have involved the testing of correlations based on monthly climate data [1]. In the present study, correlations with daily climatic data were used, with the scope of the study being expanded to include tree responses measured by BI. This allowed more accurate analyses to be conducted for specific time periods. The aim of this study was to determine the effect of the mechanical wounding of pine trees on the incremental response and sensitivity of those trees to climate over a 40-year period since resin tapping had ceased.

2. Materials and Methods
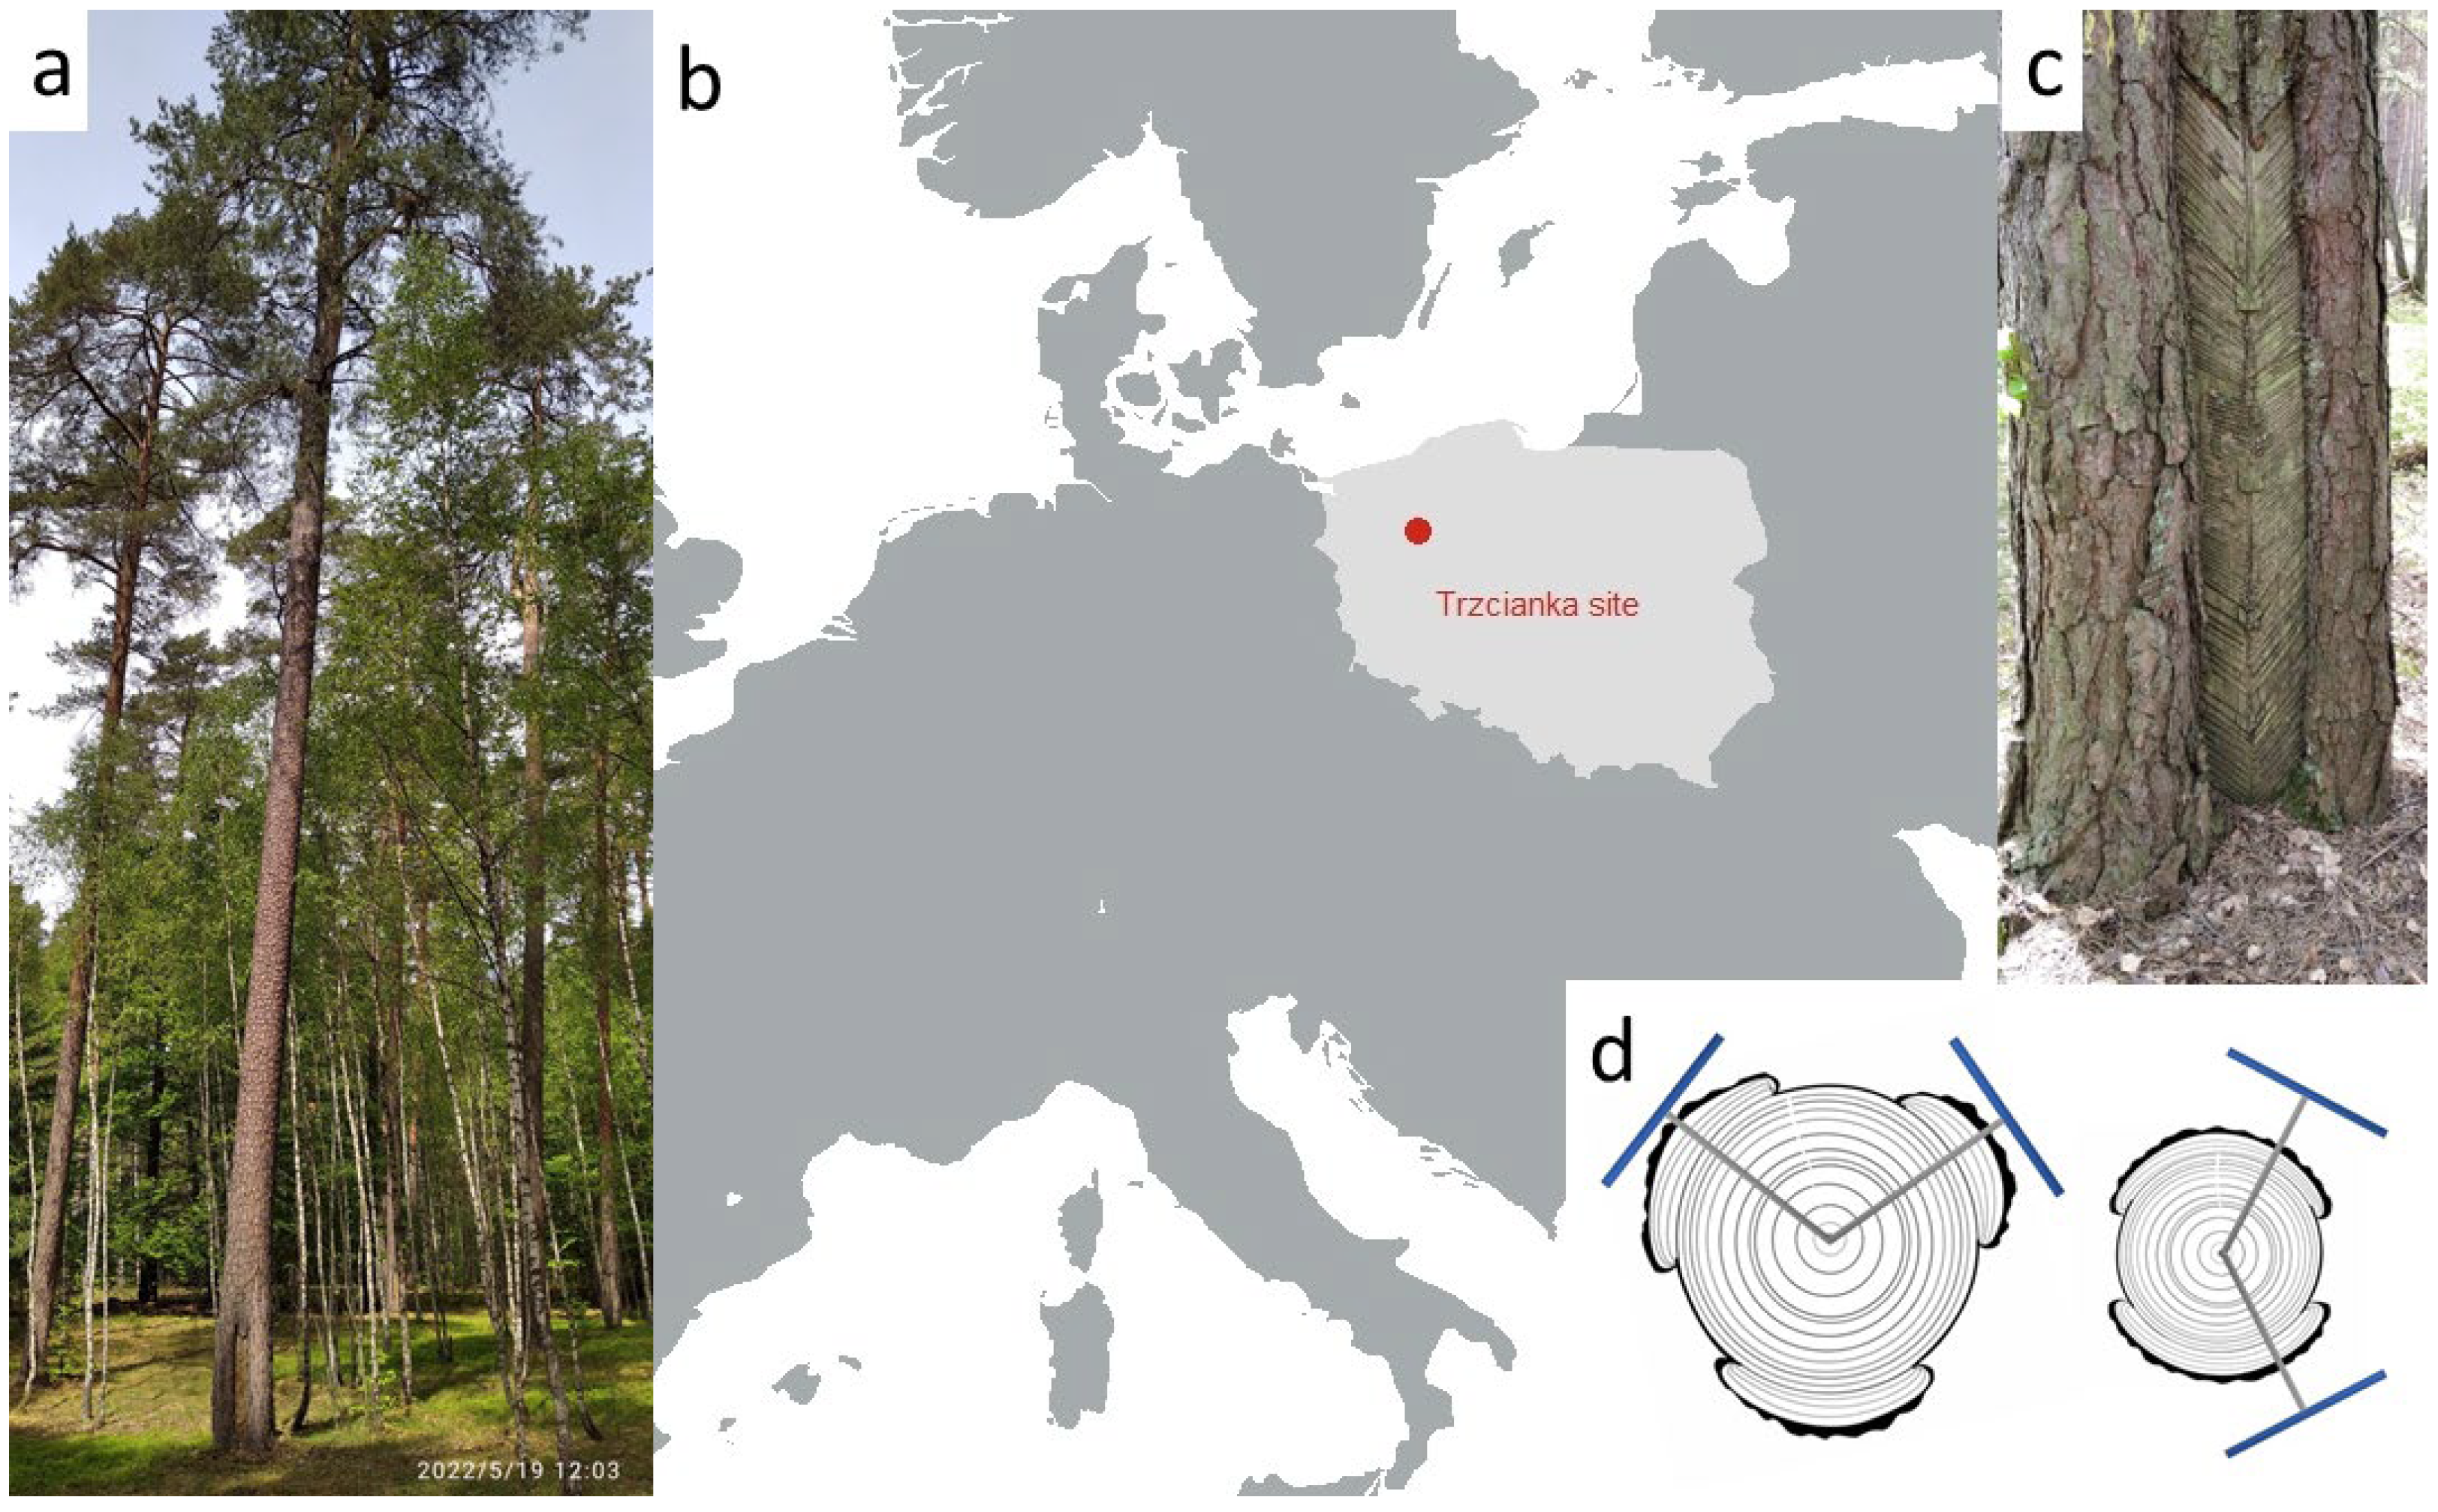
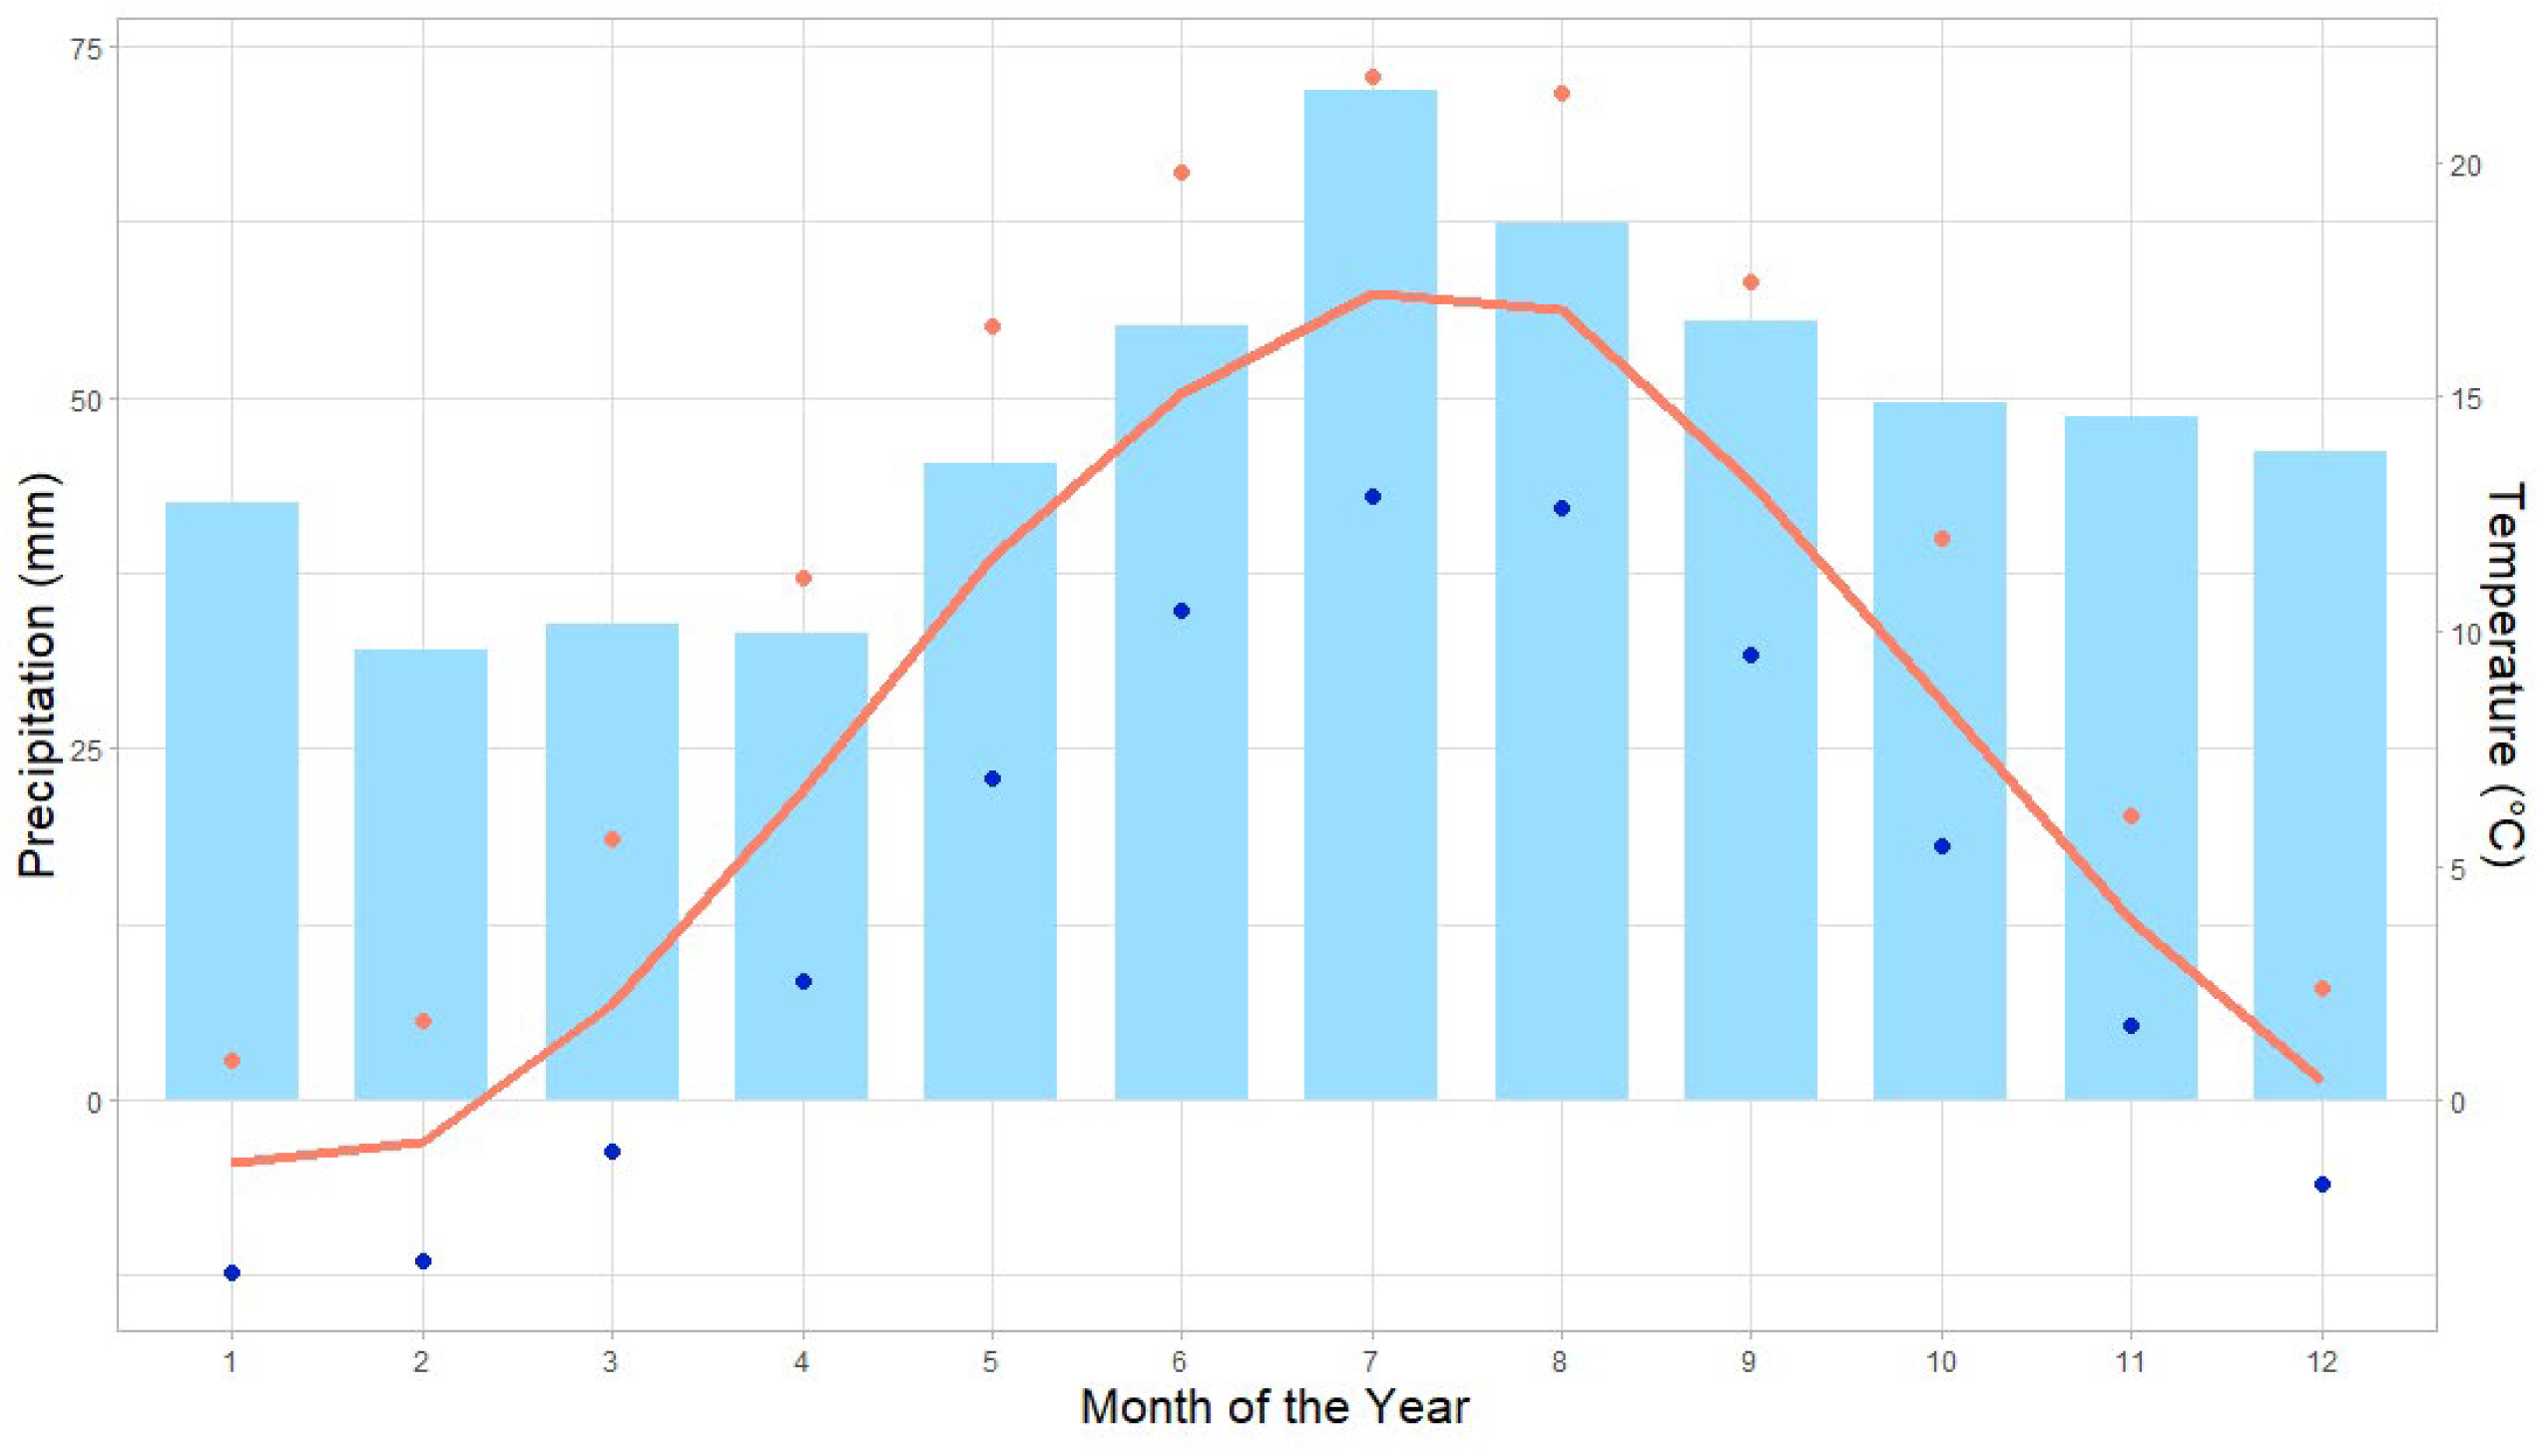
2.1. Research Area

A pine stand in the Trzcianka Forest District in the northern part of Poland (53°04120 N, 16°23564 E) was used in this study (Figure 1). The total area of the stand was 8.5 ha. Pine (90%) and beech (10%) were the dominant species, both aged 160 years. After resin tapping, the stand was earmarked for seed collection, so no felling was performed. The average diameter at breast height (DBH) was 49 cm, the average height of the trees was 29 m, and the stand was located at 95 m above sea level. The average annual temperature between 1921 and 2021 was 7.8 °C, and the annual precipitation was 575 mm, with the distribution of monthly values being shown in Figure 2. Resin tapping was performed for several years, beginning in 1976, with the last wound made in 1980. The average height of the wounds was 150 cm. All the trees were healthy, showing no signs of disease either on the outside or inside of the trunk when drilled.

2.2. Tree Coring and Sample Preparation

We selected 23 healthy RT trees and 20 NRT trees as a reference. Two increment cores were collected at a height of 1.3 m in two directions at an angle of 90° from the NRT trees and, in the RT trees, from the live area between wounds (Figure 1d). Resin extraction with acetone was performed to enable the recording of the blue signal without the disruption caused by resin. As suggested by Rydval et al. [11], 72 h is sufficient for the extraction; however we processed it for slightly longer because of the resinous nature of the trees. The process was conducted at room temperature for over 96 h. The samples were then subjected to natural drying before being glued onto wooden sticks. The sample surfaces were sanded using a belt sander with a successive grade of sandpaper (150, 240, 400, and 800).
After sanding, the samples were scanned on an EPSON V 600 scanner at a resolution of 2400 dpi. Color calibration of the scanner was performed using a Fuji IT8.7/2 card (http://www.silverfast.com, accessed on 10 March 2023). Measurements of annual TRW and BI values were made using CoRecorder and Cdendro v.9.6 [39]. The reflectance of blue light differs between sapwood and heartwood because of the darker color of the heartwood, so we used the DBI index instead of the commonly used latewood BI [23]. Two series were averaged and detrended using a cubic spline smoothing with a 50% frequency cut-off at 30 years. To remove the autocorrelation, chronologies were developed by calculating a bi-weighted robust mean. This resulted in four chronologies, two of which we used for the annual TRW and two for the DBI values. The chronologies were built based on the following numbers of trees: 17 TRW, NRT; 14 DBI, NRT; 22 TRW RT; and 16 DBI, RT (Table 1). Standard statistics were used for quality assessment: Gleichläufigkeit (GLK), first-order autocorrelation (AR1), mean series intercorrelation (RBAR), the signal-to-noise ratio (SNR) and the expressed population signal (EPS). All statistics were calculated using the dplR R package (R Core Team) (Table 1) [40].

2.3. Climate–Signal Correlations

In order to illustrate the influence of climatic factors, non-stationary correlations were used, which were determined for the years 1921–2021 in 20-year time windows. As opposed to stationary correlations, changes in correlations over time can be observed with this technique, which provide much more information than averaging stationary values for the entire period. For this purpose, the dendroTools package [41,42] was used to correlate the daily data. Monthly and daily climate data were obtained from the E-OBS [43] database (v.25.0) at 0.1° resolution (https://www.ecad.eu, accessed on 10 March 2023). Daily data were obtained for air temperature (maximum, minimum, and average) and precipitation. These values were correlated with both the TRW (indexed) and DBI data. To match the optimal correlation pattern over time, different time windows (from 15 to 180 days) were tested. Ultimately, a 45-day running window was used for precipitation and average temperature, and a 30-day running window for minimum and maximum temperature. Correlations were performed using the bootstrap method, with all calculations performed to a significance level of α ≤ 0.05 and also without a significance level being specified in order to record weaker correlations throughout the study period.

3. Results

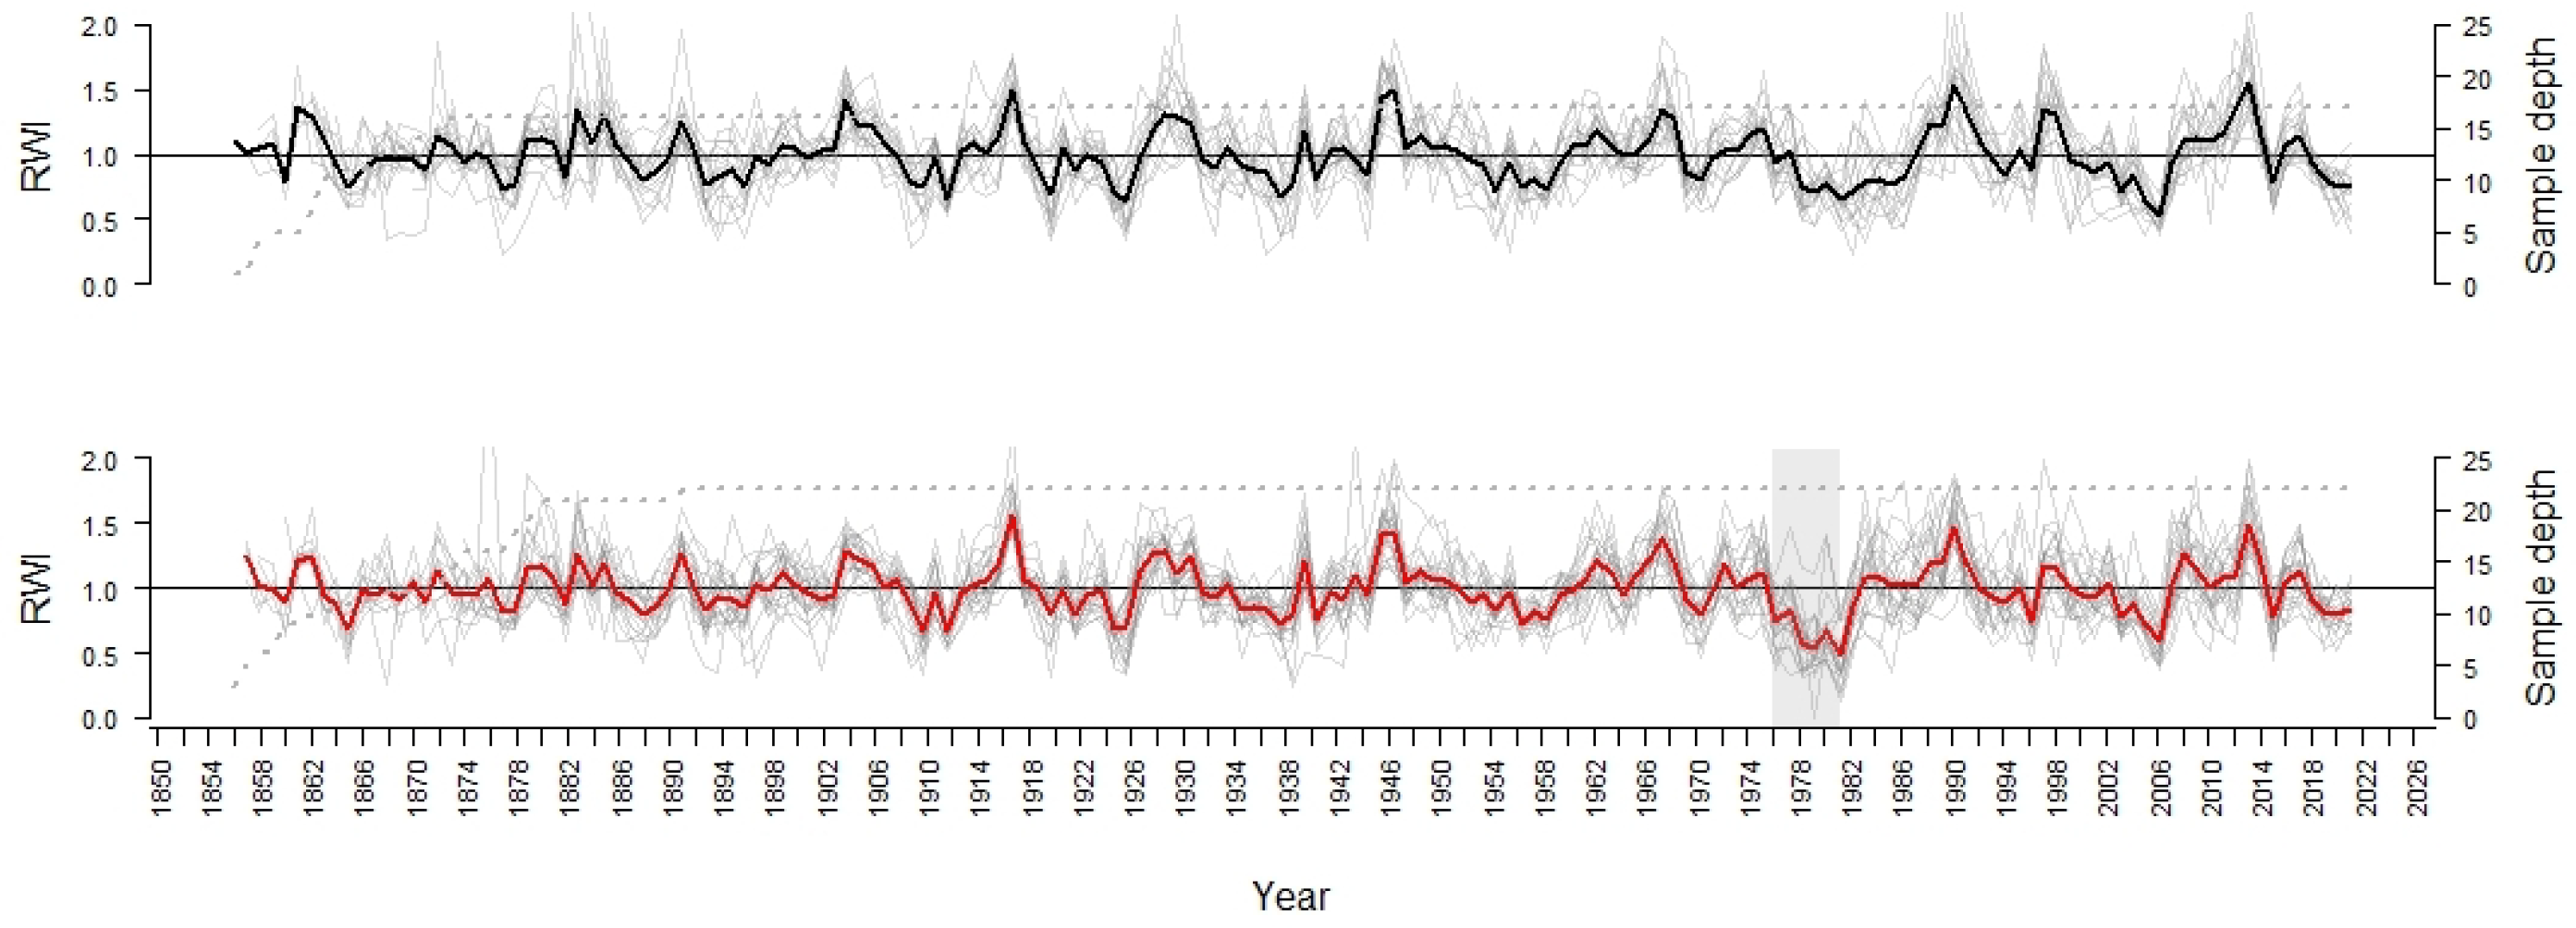
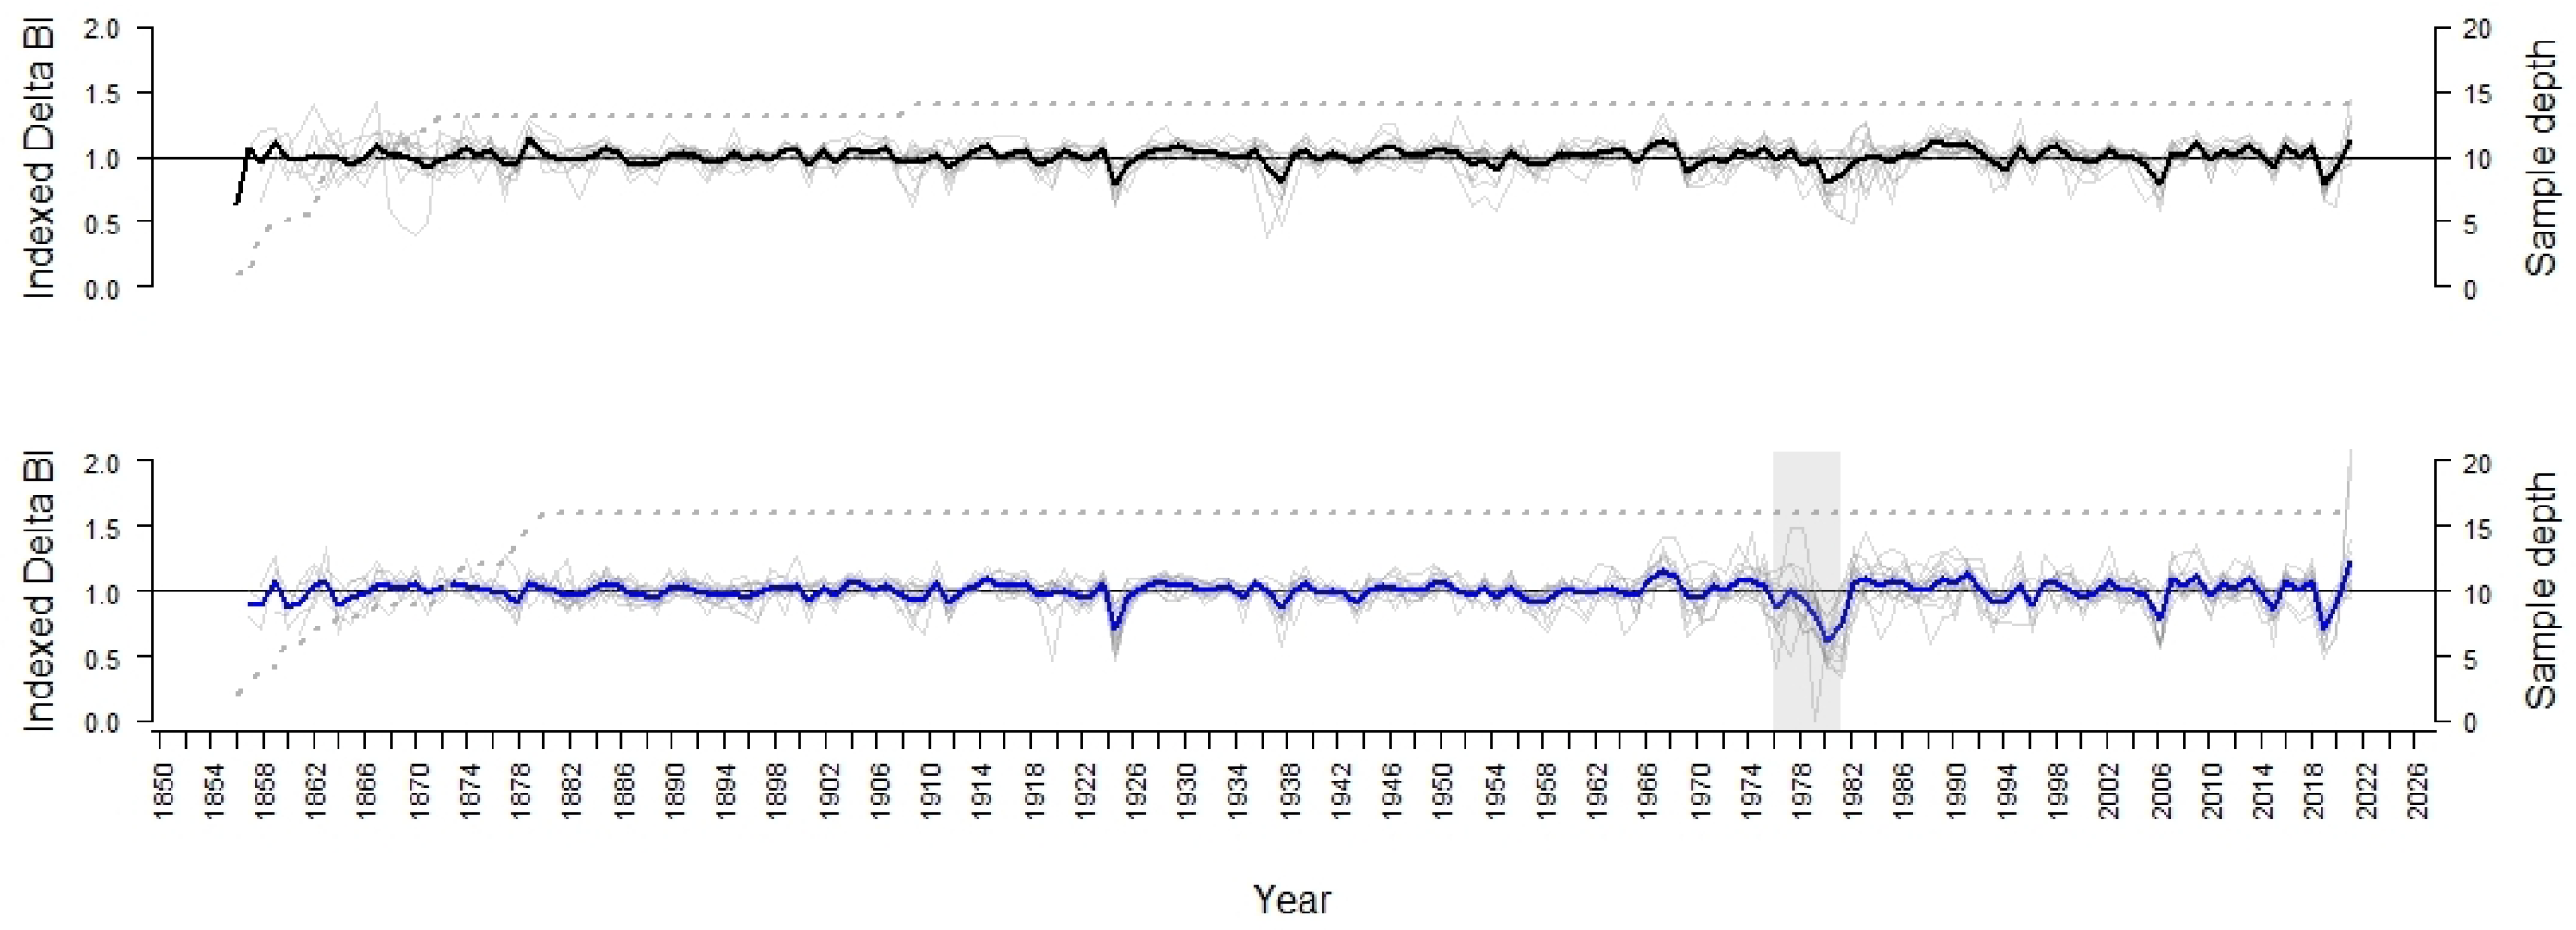
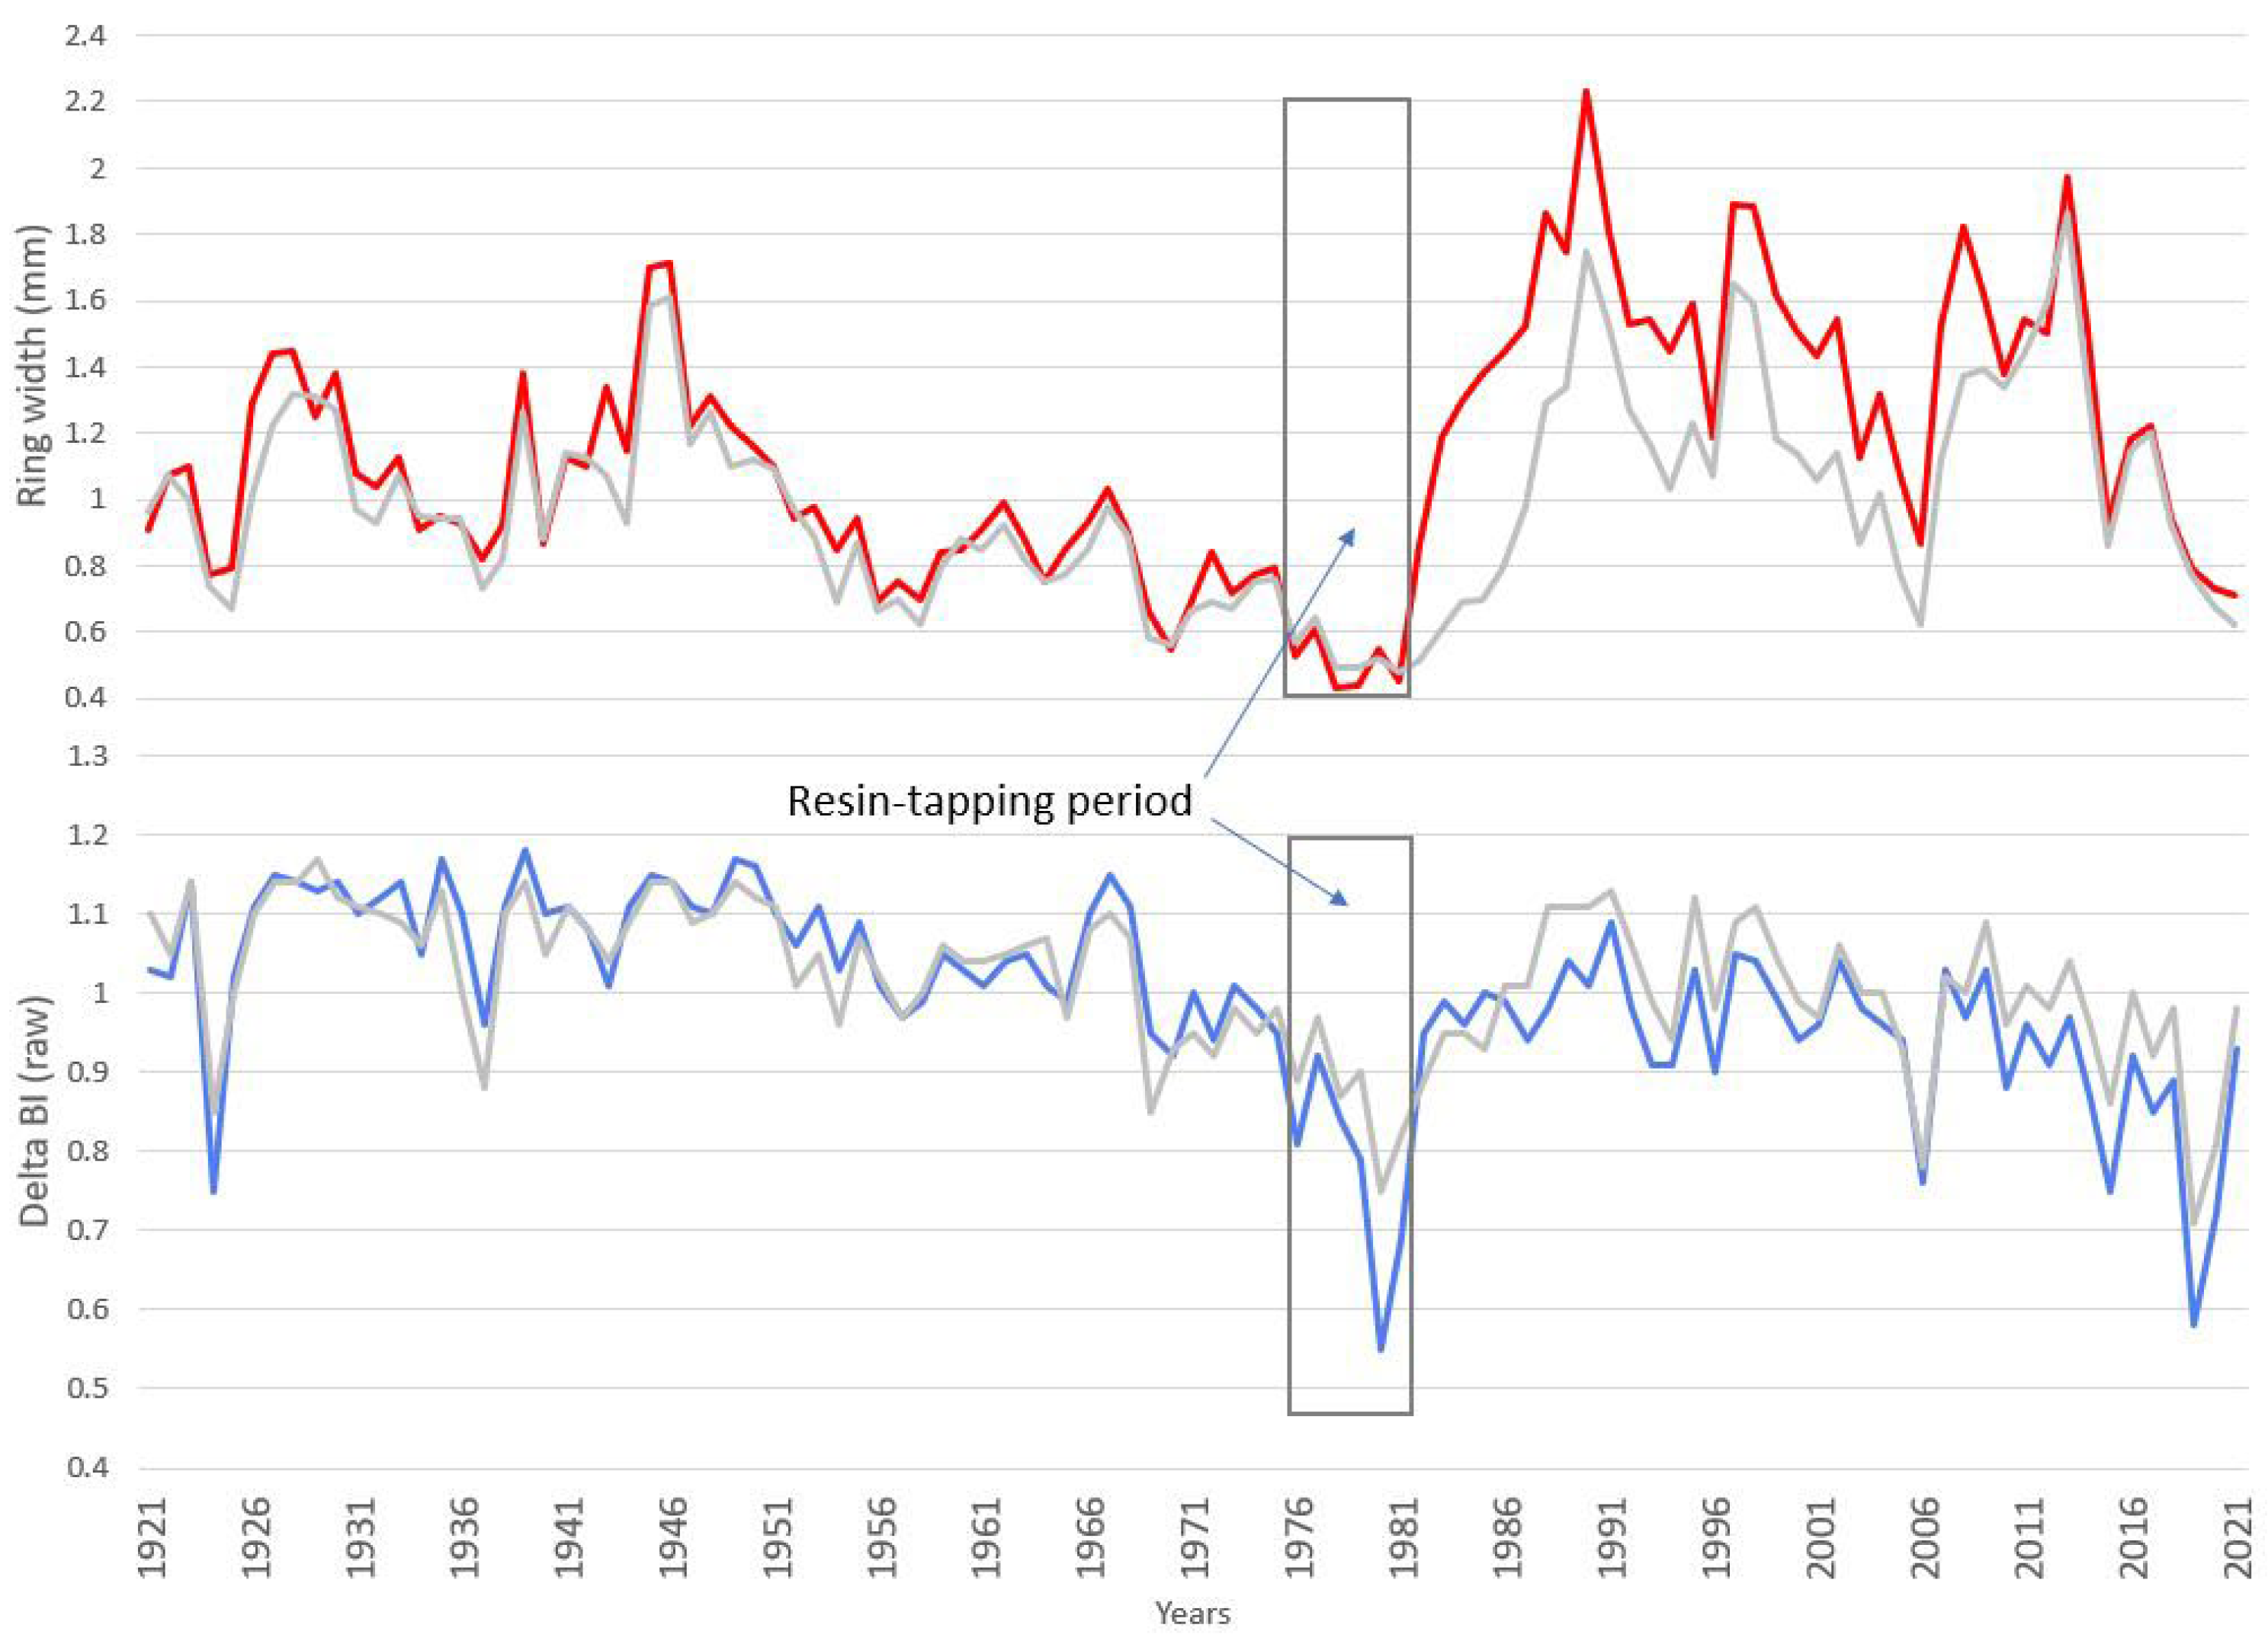
3.1. Comparison of the Chronologies

The indexed chronologies showed a similar pattern for the RT and NRT trees, which is important for the pre-resin-tapping period, which did not indicate strong events from the past for either group. Only a small difference was apparent in the wound-making period, as indicated in Figure 3, where the red line (RT) dips deeper than the black line (NRT), as highlighted by the grey field on the red line. The indexed DBI curves also appeared similar for the RT and NRT trees prior to the resin-tapping period. In this case, we also observed a large depression during the resin-tapping period (Figure 4, grey field on blue line).
We found a strong signal in all the detrended series and high values for the GLK (over the 0.60 threshold) and EPS (over 0.87) (Table 1). The AR1 value was also high (over 0.72), although it was slightly lower for DBI (over 0.62). There was a difference in the SNR and RBAR between the TRW and DBI series; the SNR was much higher for TRW (16.4 and 18.3) and lower for DBI (6.9 and 7.4), whereas, correspondingly, the RBAR was higher for TRW (0.51, 0.47) and lower for DBI (0.34, 0.33) (Table 1).

3.2. Statistical Analysis of Signals between the Periods

In the TRW analysis, there were significant differences before and after the resin-tapping period. The average TRW before resin tapping (1935–1974) was 0.97 mm in the RT and 0.91 mm in the NRT trees. After resin tapping (1981–2021), the averages were 1.38 and 1.10 mm, respectively (Table 2). Significant differences were observed in the variability of the TRWs, with the standard deviation during resin tapping being 0.25 (RT) and 0.24 (NRT), and after resin tapping, 0.40 (RT) and 0.35 (NRT). The coefficient of variability showed the highest value for TRW over DBI.
A strong incremental response occurred in the years after resin tapping. There was an abrupt increase in the TRWs (Figure 5), which continued for over 30 years, and then the annual TRWs became aligned with the control trees (the red and grey lines overlap in Figure 4). A completely different response was observed for the DBI values. The DBI curves, despite a similar response direction, separated after resin tapping began. This separation was maintained throughout, up to the year the samples were collected (Figure 5). We observed a common point in the DBI values for both groups of trees only in 2006. Another important observation was that reduced DBI values occurred when the resin tapping began and also during the wound-making period (1975–1980), whereas the TRW response occurred only after the wound-making had been completed.

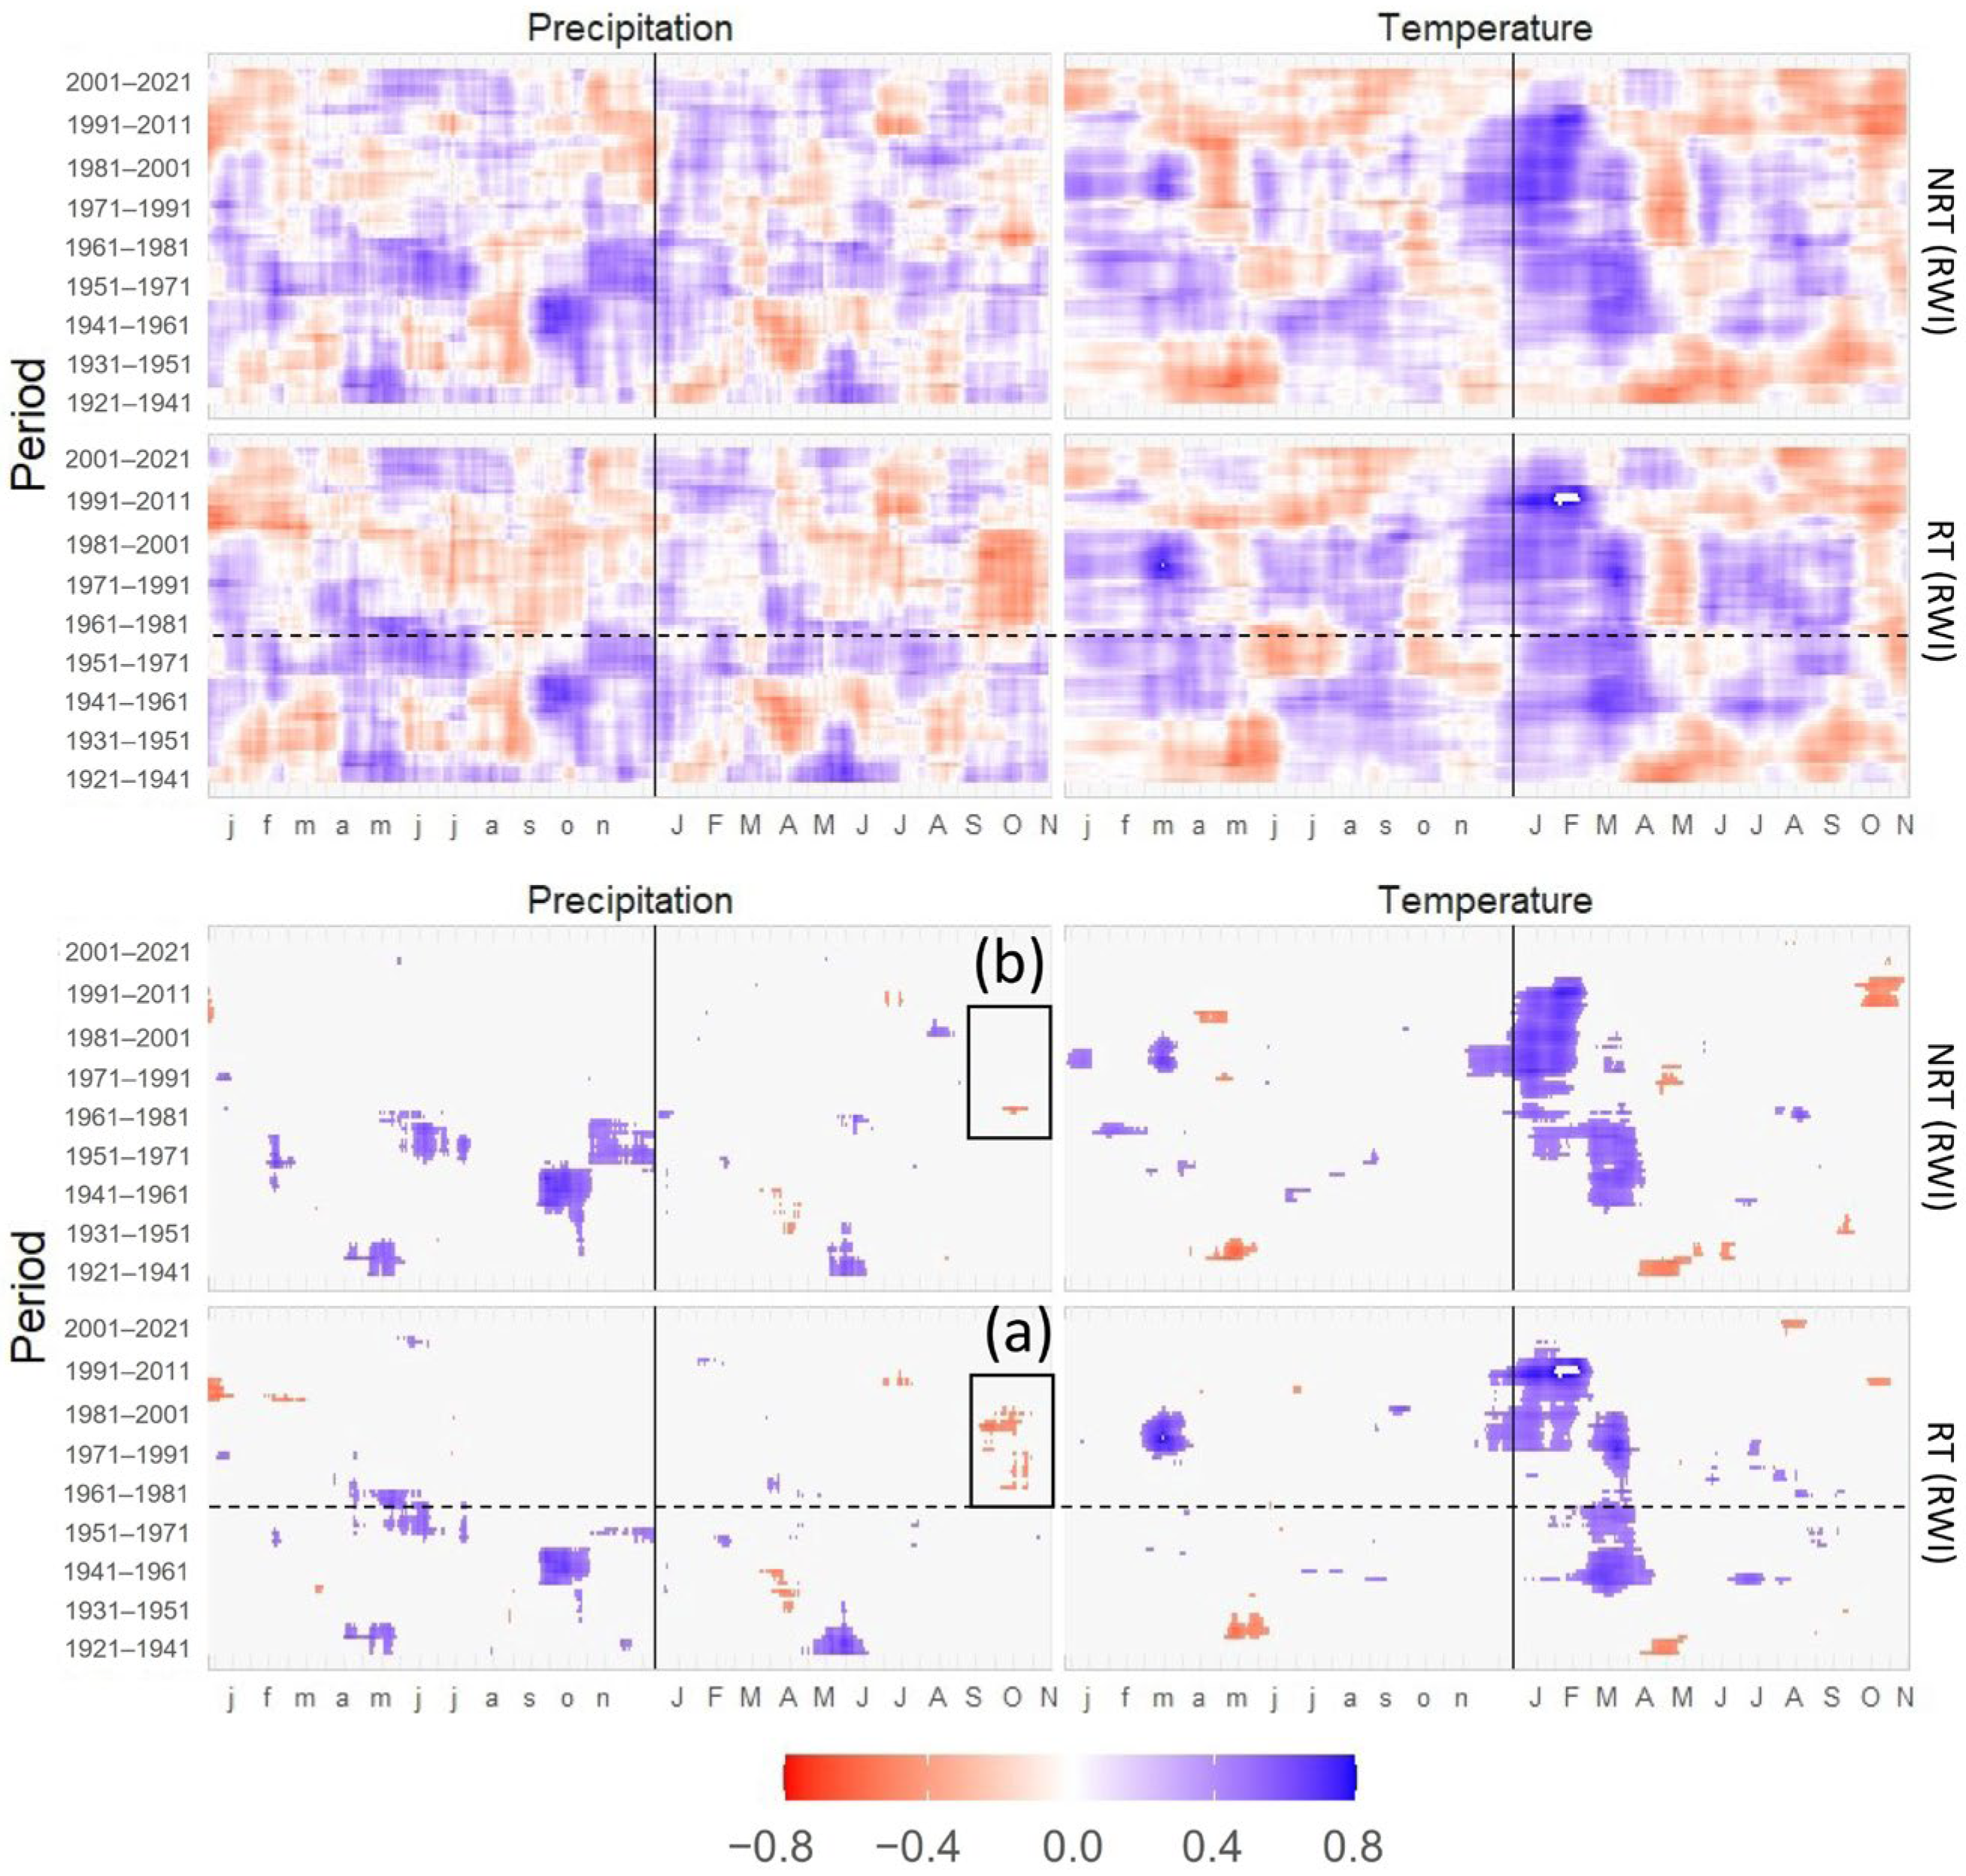
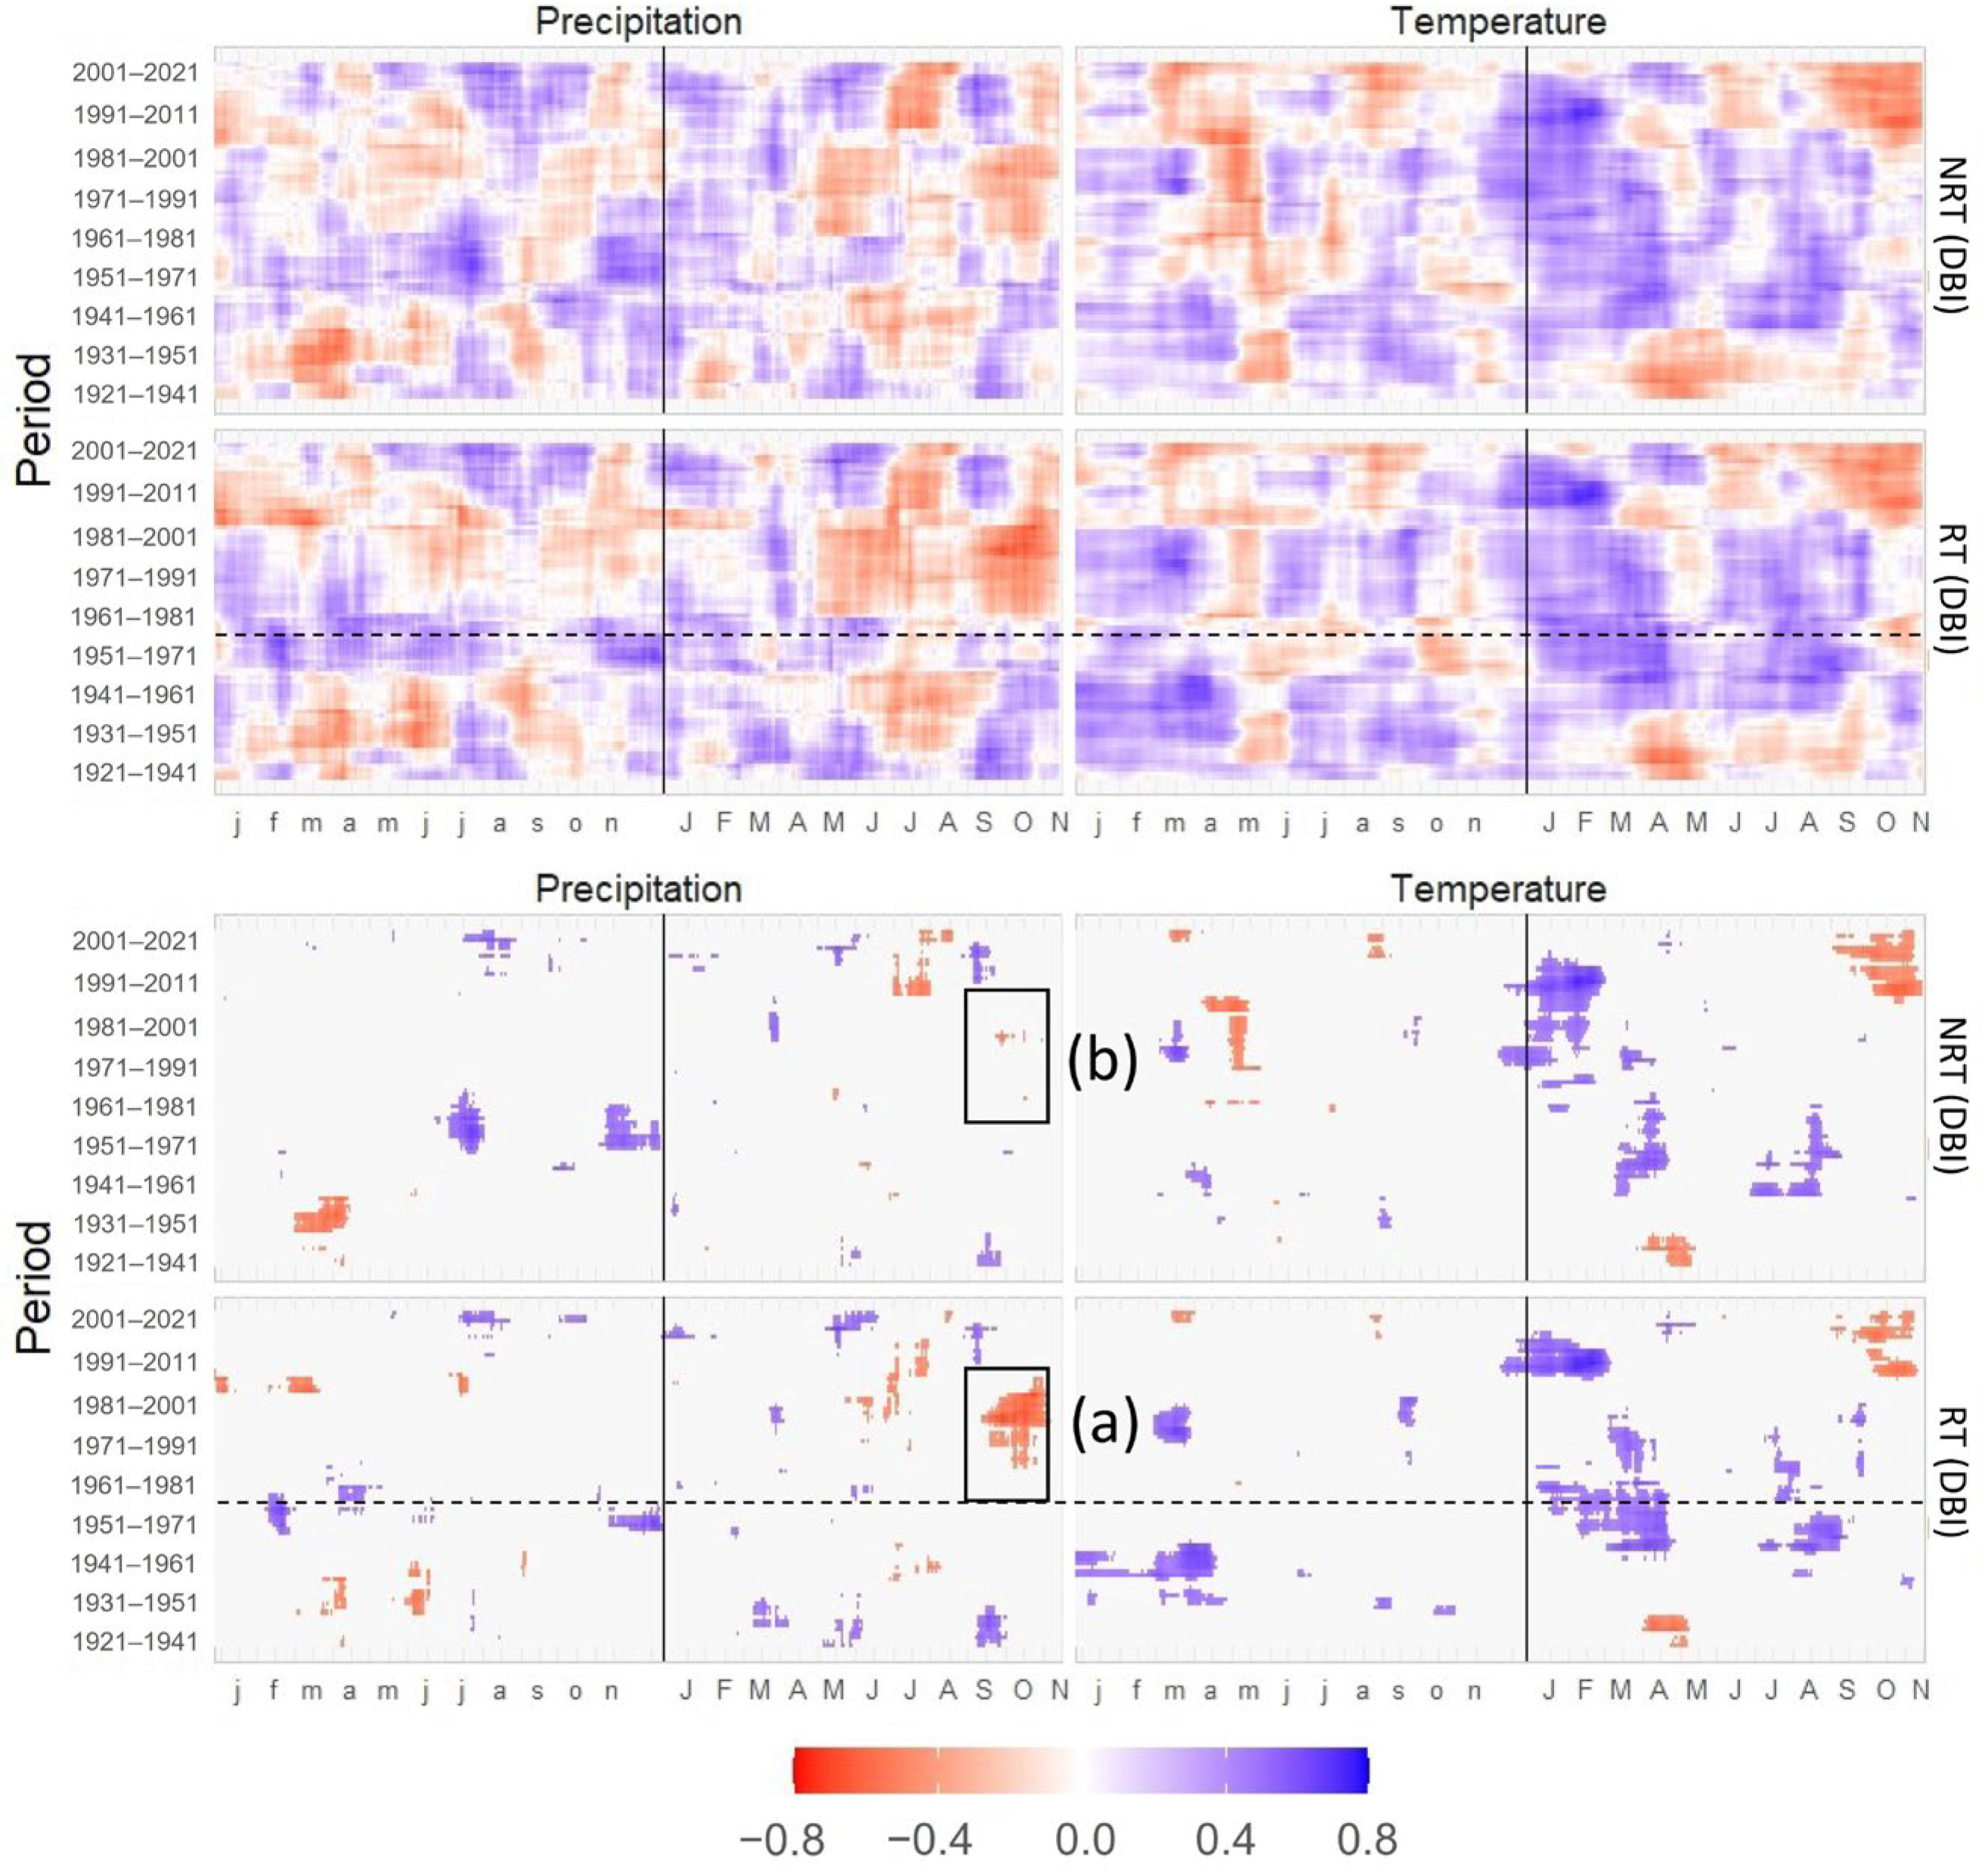
3.3. Correlations of TRW and DBI with Mean Temperature and Precipitation

Correlations of the daily data, performed using the bootstrap method, showed that they were unstable over long periods of time, with both positive (blue) and negative (red) correlations for the same months in different years (Figure A1). The most stable correlation was for the average temperature in winter and early spring of the current year, with the blue area in Figure A1 being visible for almost all years. A horizontal dashed line separates the period before resin tapping (below the line) from the other years. There were no significant differences on the heatmaps between the RT and control (NRT) trees (Figure A1 and Figure A2). The main difference was seen only in the summer precipitation of the current year. The DBI (Figure A2a) showed more negative correlations with precipitation than TRW (Figure A1a). However, the differences between the RT and NRT trees were only slight. Summer showed a slightly stronger negative correlation for the RT trees, more noticeable for DBI than for TRW.

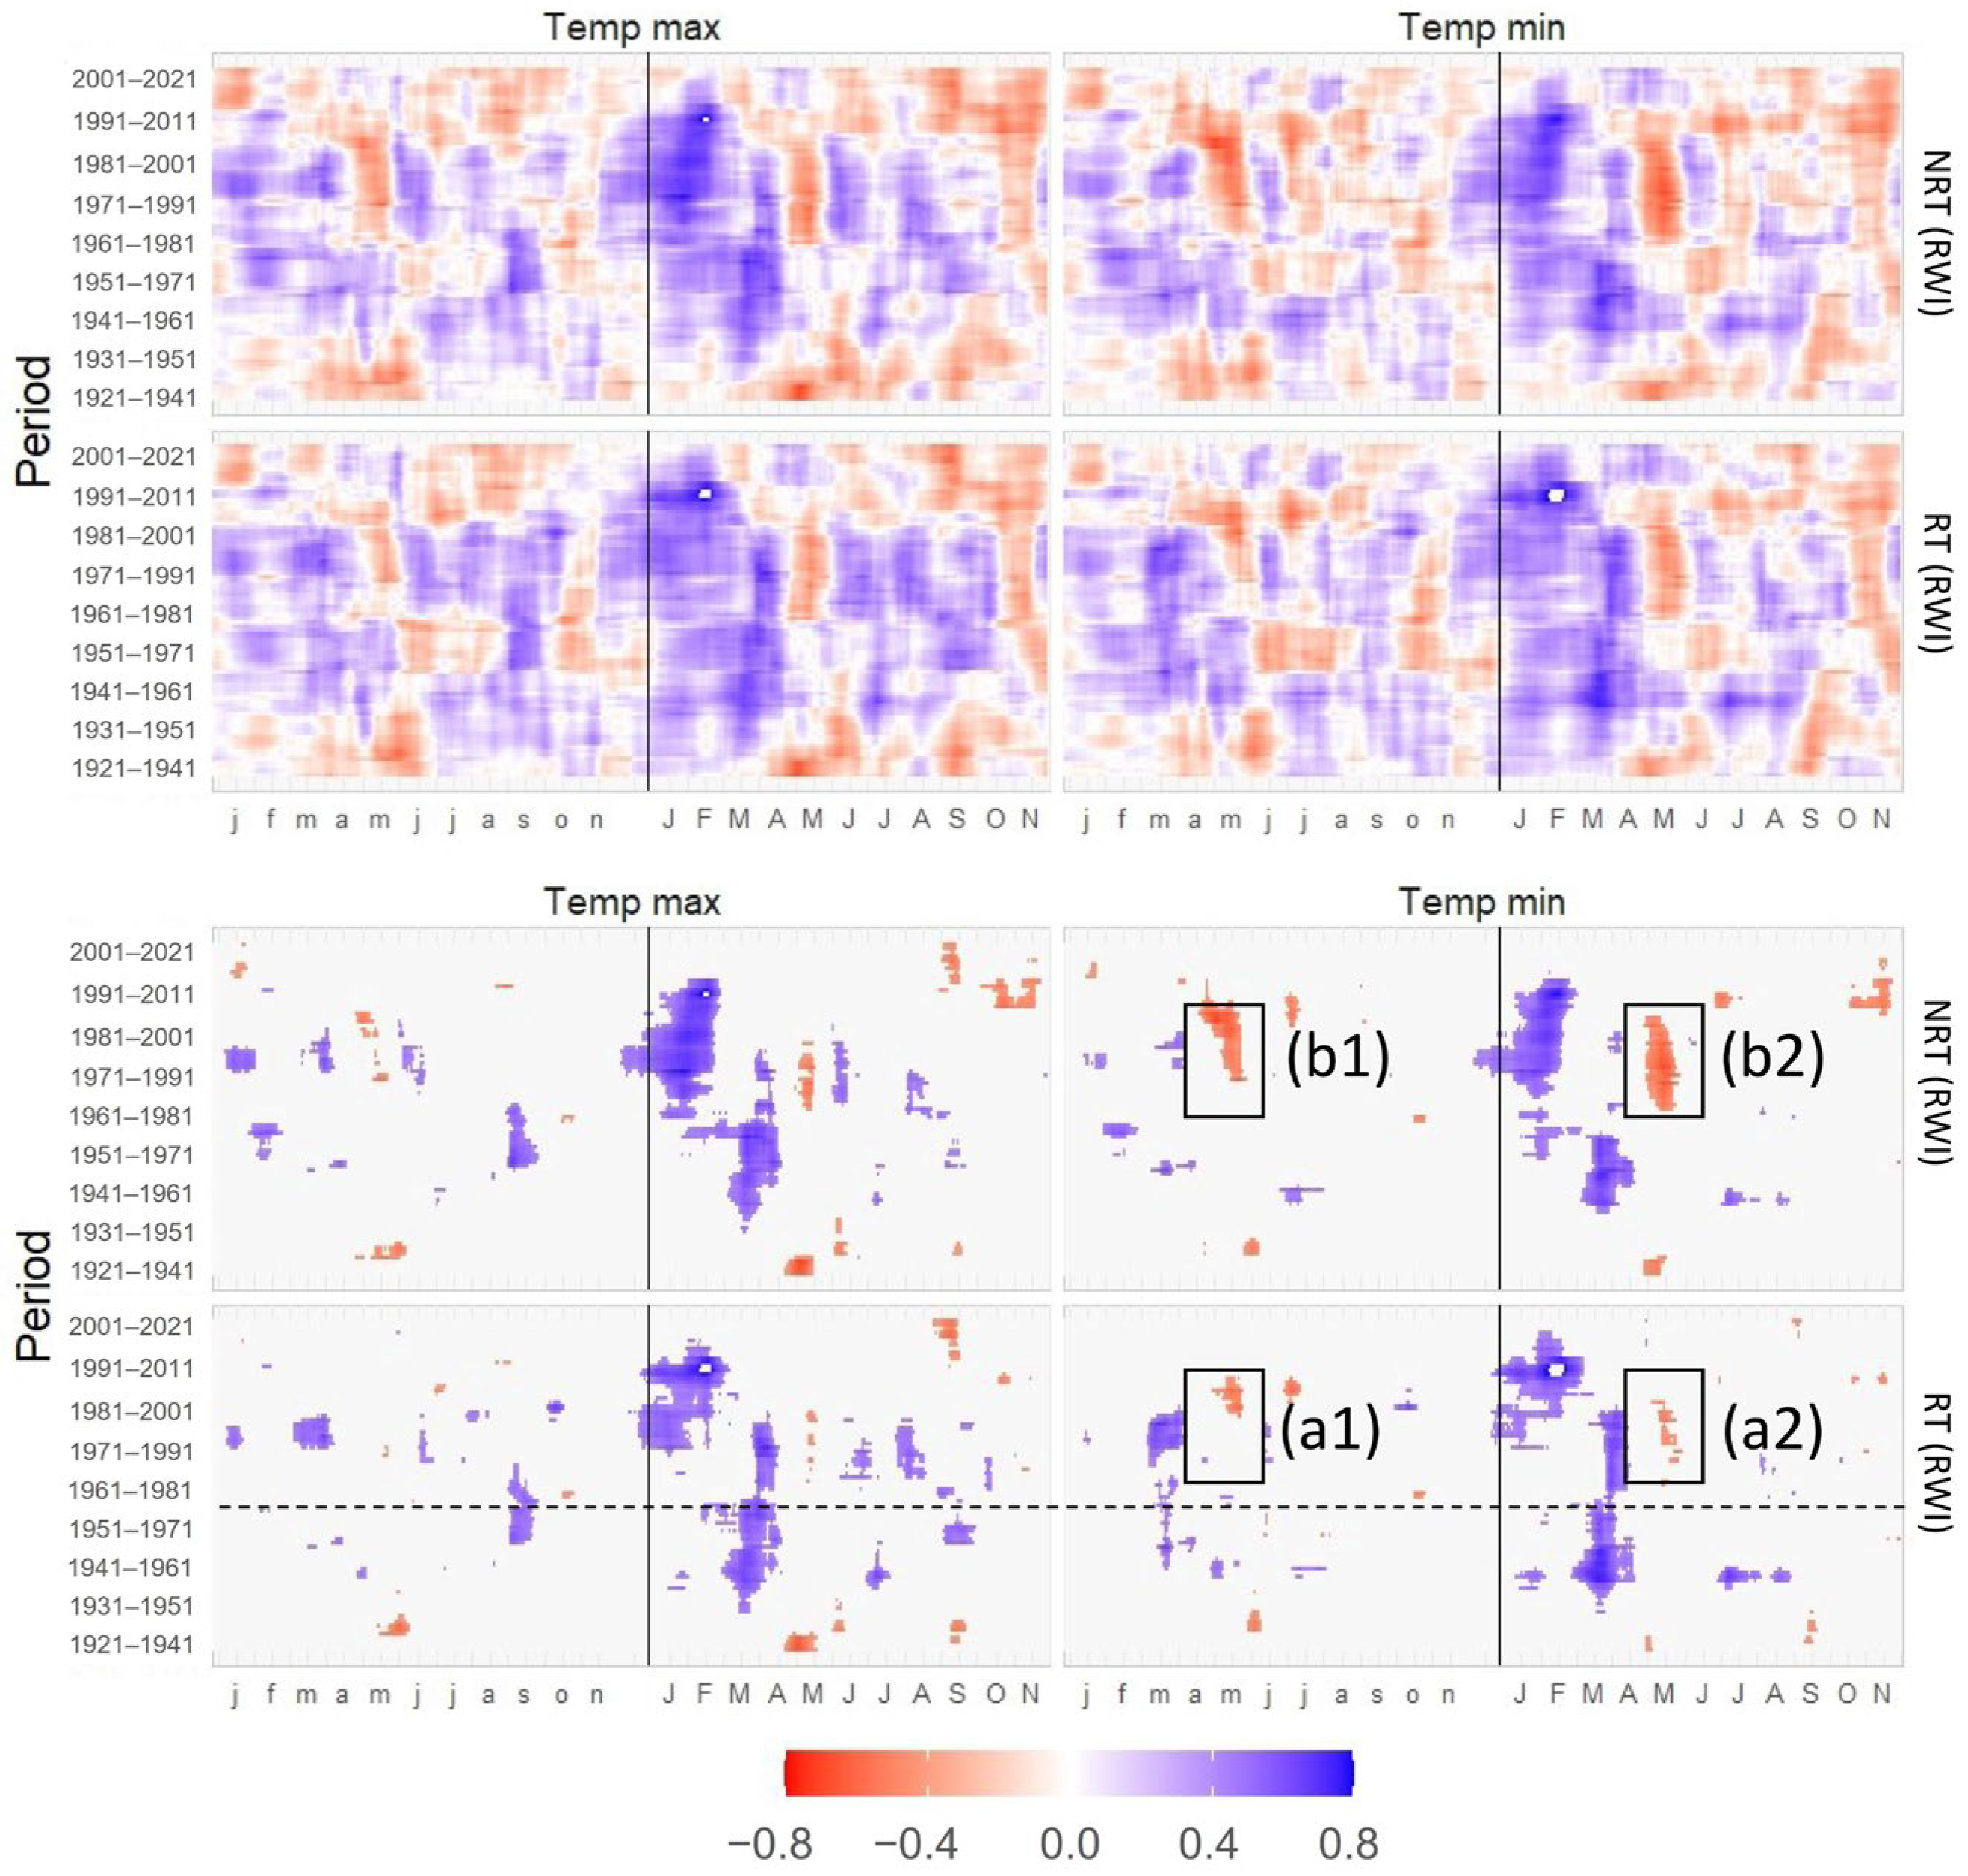
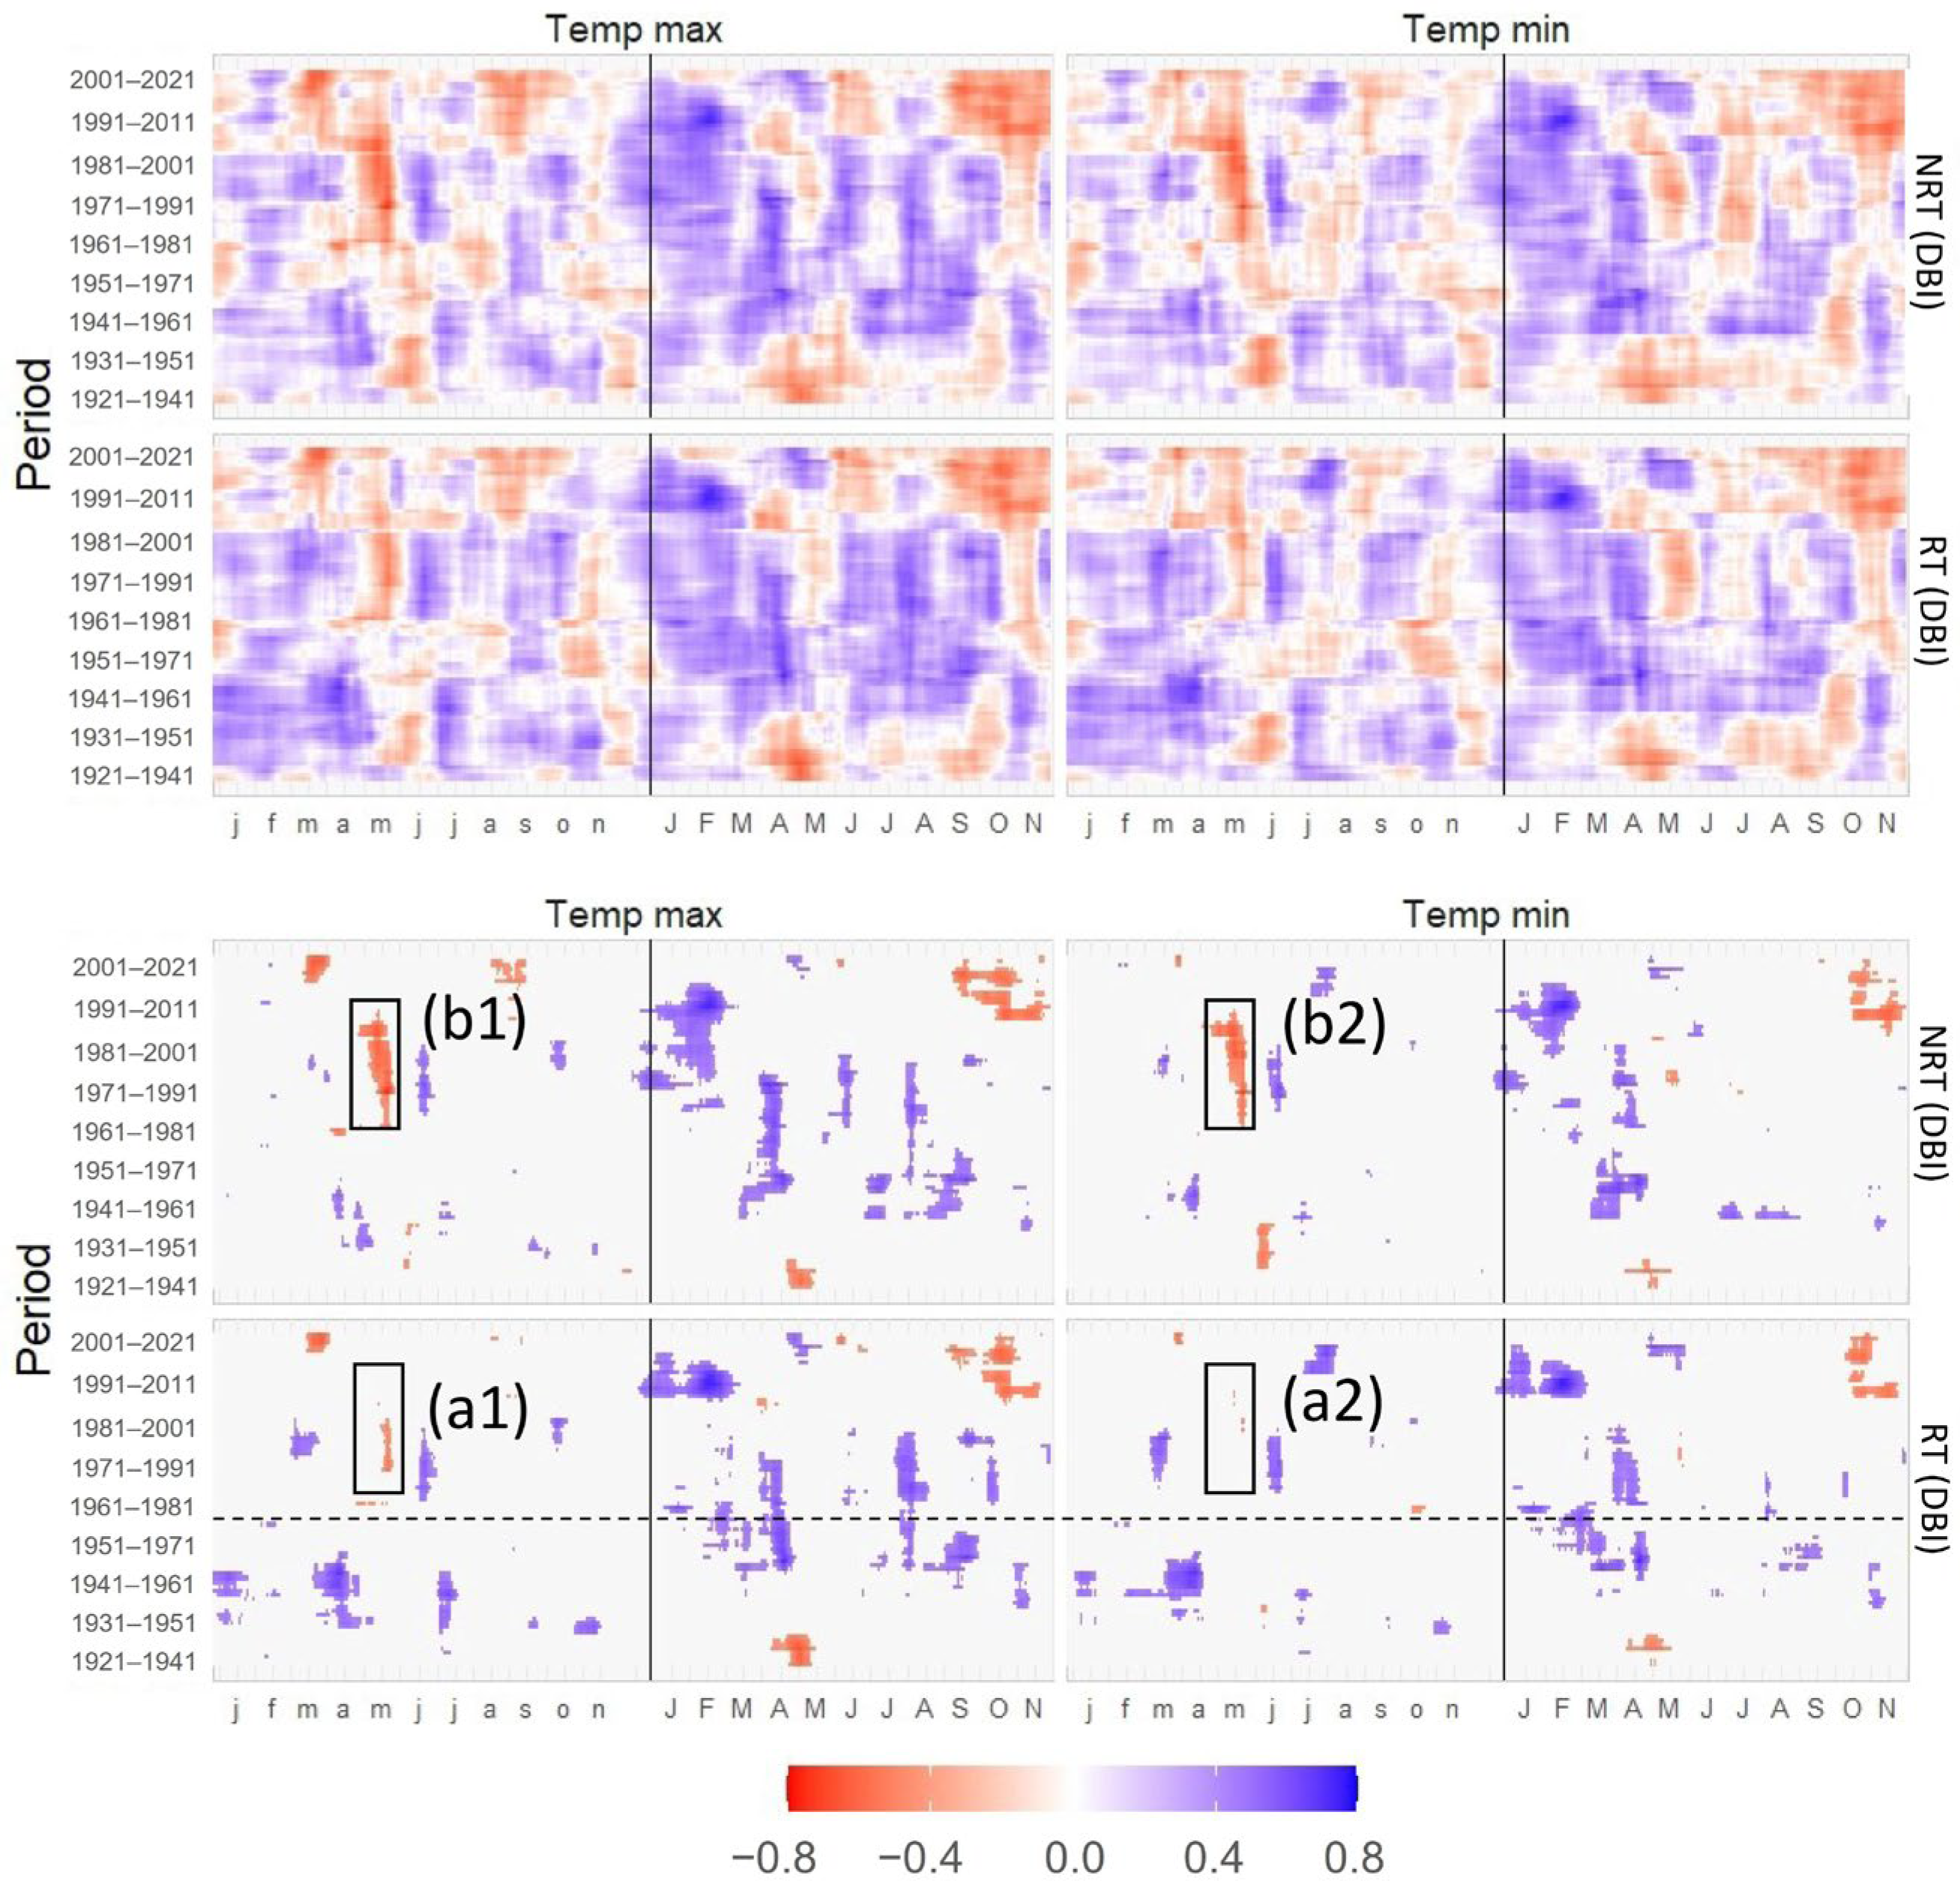
3.4. Correlations of TRW and DBI with Maximum and Minimum Temperatures

For the maximum and minimum temperatures, a stable correlation with TRW can clearly be seen for winter and early spring (blue area on the heat maps in Figure A3). The correlations were not stable or were not statistically significant in the other (parts of the) seasons, however. Considering some observed trends, there is an apparent dominance of negative correlations in recent decades, especially in April and the summer months. The DBI was more sensitive to maximum temperature. We also observed more positive correlations in summer in both the current year and the previous year, as well as negative correlations in May of the previous year (Figure A4). These correlations only occurred in some periods, and not across the entire range of years studied. There was also a tendency for correlations to change from positive to negative in recent decades, especially after late summer. These changes are visible for the maximum, minimum, and average temperatures. We observed a slight difference between the RT and NRT trees in the years associated with wounding and just after wounding. The reference trees showed a larger negative correlation in the spring months (Figure A3b1,b2). A similar reaction was observed between the minimum and maximum temperatures and DBI. The negative correlation (red color in Figure A4b1,b2) manifested only in the reference (NRT) trees. In all the cases described above, differences between the RT and NRT trees were only visible for about 20 years after resin tapping. After this period, there was no significant difference between the RT and NRT trees.

4. Discussion

Where the GLK values were above 60% and the EPS values were high (above 0.85), the chronologies were consistent and suitable for climate–growth analysis [44,45]. The GLK and EPS coefficients were similar for all chronologies, confirming the homogeneity of the sample. The high AR1 value illustrated a significant influence of the previous year on the current year’s growth [46]. For the SNR, a much lower value was obtained for the DBI, and similarly for the RBAR, which is related to the SNR [47]. Other authors have reported similar SNR values for BI [47,48].
Wounding pine trees at around 70% of their circumference must force an incremental response in the life bands that occupy the remaining 30%. This is logical and has also been confirmed by other studies, such as that of Zaluma et al. [4] in Latvia, where RT pines showed wider growths after resin tapping than the control trees. Other authors have also reported a similar phenomenon [3,37]. In all cases, wider rings were related to the life bands at a height of 1.3 m. However, the increased TRW response was not present in higher parts of the trunk (at 3.3 m) [3].
After several years, as a result of regeneration of the cross-section of the trunk, the TRW again equaled that of the control trees. For the stand in Trzcianka, this occurred after approximately 30 years. A similar situation has been reported from a stand in Golin, Germany [1], where the TRW equaled the control TRW after approximately 30 years. At a second site, in Kratzeburg, Germany [1], where resin tapping occurred in a later period, the TRWs were still wider in the RT trees at the time of that study. The annual TRWs for a site in the Lidzbark Forest District (Poland) continued to differ between the RT and NRT trees for 35 years after wounding [3]. However, in both cases (Kratzeburg and Lidzbark) the number of years was limited by the age of the trees.
Correlations with precipitation should be considered with caution. Here, these correlations showed the greatest instability and were weak. The nature of precipitation is local and only partially verifiable. We used gridded data, which did not reflect the precipitation accurately at the study site. This is typical of studies in large forest complexes, including the site we analyzed. In addition, precipitation is generally linked to several environmental influences and hydrological conditions, the histories of which were unknown as they related to our study. In our analysis, the comparison of two groups of trees grown under the same conditions is appropriate, as other researchers have made similar comparisons [1]. We are aware that references to other sites were to be made with caution. Sensitivity to temperature and precipitation revealed similar correlations for the RT and NRT pines. Only in some years were slight differences observable, during resin tapping and for a short time afterward. This was visible for early autumn precipitation in the current season (TRW, Figure A1) and summer precipitation (DBI, Figure A2). The correlations with temperature and precipitation were similar for both groups. In relation to the climatic sensitivity of pine, van der Mateen et al. [1] illustrated a high similarity in the responses of RT and NRT trees. The differences between the periods before resin tapping and at 40 years after were similar for both groups of trees. However, these were stationary correlations, and the responses of the trees in specific years remain unknown. The similarity between the responses of RT and NRT trees to temperature and precipitation has also been reported by Genova [35] for P. pinaster in Spain. The authors even suggested the possibility of using the chronology of RT pines in dendrochronological studies because the chronologies of the two groups were so similar.
Because of the lack of extensive research on the climatic responses of RT trees, we can only refer to the reactions of NRT pines, which have been tested in Poland and Central Europe. The climate sensitivity of pines in Poland and Hungary has been studied by Misi et al. [6], who found a strong positive relationship between the temperatures in February and March and the annual TRW. A similar effect has been reported by other researchers [26,49,50]. The moving correlations presented by Kalbarczyk et al. [51] showed similar stability in late winter and early spring temperatures for different time intervals. The results observed in Trzcianka are in agreement with all the results cited above for temperature. However, slightly different responses were observed regarding precipitation. In this study, the correlations with precipitation were mostly statistically insignificant and differed in individual 20-year periods, indicating a lack of stability. Other studies have also presented mixed results, suggesting a strong influence by local conditions.
Misi et al. [6] discovered a major role of summer precipitation on annual ring formation. Waszak et al. [49] also found a correlation between TRW and precipitation, but mainly in late spring. By examining the impact of precipitation on periods of years, different tree responses have been reported for individual subperiods [8]. As the authors pointed out, even short-term weather events can strongly affect annual TRW growth. Similarly, the results presented by Kalbarczyk et al. [51] indicate the instability of the correlations in the different periods they tested. Water-related impacts can also depend on human activity. For example, the artificial improvement in water conditions through the construction of retention facilities has a positive effect on annual TRW growth, regardless of the variability in climatic conditions [7].
Both DBI and TRW commonly show sensitivity to temperatures in winter and early spring. Janecka et al. [52] found that the TRW and latewood BI in Scots pine were similarly susceptible to cold winters, and the differences between them were minor. The response of annual TRW and latewood BI to temperature was presented somewhat differently by Cao et al. [48] for Pinus massoniana Lamb. in China, however, with the BI of the earlywood showing a similar correlation to TRW and being positively correlated with temperature. By contrast, the DBI was negatively correlated [48]. Differences in the results of studies conducted on managed stands may have been influenced by the management treatments. As Candel-Pérez et al. [53] reported, thinning operations significantly affected TRW, latewood, earlywood, BAI, and X-rayed wood density compared to control stands. Only extreme climatic conditions, such as drought, might have a greater impact than forest management. The difference between DBI and TRW is primarily related to maximum temperatures, with the BI showing greater sensitivity. The sensitivity of BI to summer temperatures is a frequently highlighted feature [23,54], and it may be considered to be a good indicator for use in climate reconstructions. At Trzcianka, the DBI was found to be slightly more sensitive to current summer precipitation than TRW. Studies on pine trees on the Iberian Peninsula have also suggested a more pronounced response in BI than TRW for use in the Standardised Precipitation–Evapotranspiration Index [32]. This seems to be caused by seasonal fluctuations in the xylem. Other authors have suggested an association between BI and precipitation (e.g., [30]). The DBI studies focused on RT trees are pioneering and should be kept in mind for potential verification in the future, especially since they show a different response to climate than TRW.

5. Conclusions

The climatic sensitivities of RT and NRT pines are similar. There were differences only in some years, mostly in the wounding years and approximately 20 years after resin tapping had ended. However, these are small differences, mainly related to the strength of the correlations, but with the same trends being apparent for the RT and NRT trees. The response, in terms of TRW and DBI, of the pine trees to climatic factors was found to differ, with DBI displaying stronger correlations with maximum temperatures than TRW in the current year. Negative correlations with summer precipitation in the current year were correlated more strongly with DBI than TRW. This was true for both the RT and NRT pines. In addition, the annual TRWs at breast height differed significantly for at least 30 years after resin tapping ended, whereas the DBI in the RT and NRT pines maintained different values until the wood was collected—that is, for 41 years.

Author Contributions

For conceptualization and methodology, M.J. and M.D.; formal analysis, M.J.; writing—original draft preparation, M.J.; writing—review and editing, M.J. and M.D.; visualization, M.J.; revising the manuscript M.D. and M.J. All authors have read and agreed to the published version of the manuscript.

Funding

This research received no external funding.

Data Availability Statement

The data presented in this study are available on request from the corresponding author.

Acknowledgments

The authors would like to thank the authorities of Trzcianka Forest Inspectorate for their help with the experiment.

Conflicts of Interest

The authors declare no conflict of interest.

Appendix A

Figure A1. Correlations ((top)—all correlations, (bottom)—significant correlations at p < 0.05) between TRW and climatic data (sum of precipitation and mean temperature). Separate period before resin tapping shown below horizontal dotted line. (a) Possible negative correlations for RT trees; and (b) lack of correlations for NRT trees. Lowercase letters—months in the previous year, uppercase letters—months in the current year.
Forests 14 00593 g0a1
Figure A2. Correlations ((top)—all correlations, (bottom)—significant correlations at p < 0.05) between DBI and climatic data (sum of precipitation and mean temperature). Separate period before resin tapping shown below horizontal dotted line. (a) Possible negative correlations for RT trees; and (b) lack of correlations for NRT trees. Lowercase letters—months in the previous year, uppercase letters—months in the current year.
Forests 14 00593 g0a2
Figure A3. Correlations ((top)—all correlations, (bottom)—significant correlations at p < 0.05) between TRW and extreme temperatures. Separate period before resin tapping shown below horizontal dotted line. (a1,a2) Lack of correlations for RT trees; and (b1,b2) negative correlations for NRT trees. Lowercase letters—months in the previous year, uppercase letters—months in the current year.
Forests 14 00593 g0a3
Figure A4. Correlations ((top)—all correlations, (bottom)—significant correlations at p < 0.05) between DBI and extreme temperatures. Separate period before resin tapping shown below horizontal dotted line. (a1,a2) Lack of correlations for RT trees; and (b1,b2) negative correlations for NRT trees. Lowercase letters—months in the previous year, uppercase letters—months in the current year.
Forests 14 00593 g0a4

References

  1. van der Maaten, E.; Mehl, A.; Wilmking, M.; van der Maaten-Theunissen, M. Tapping the Tree-Ring Archive for Studying Effects of Resin Extraction on the Growth and Climate Sensitivity of Scots Pine. For. Ecosyst. 2017, 4, 7. [Google Scholar] [CrossRef] [Green Version]
  2. Michalec, K.; Wąsik, R.; Barszcz, A. Shaping of the Width of Tree rings in Scots pine as a Result of Resin Tapping. Acta Silvestria 2020, LVI, 49–60. [Google Scholar] [CrossRef]
  3. Magnuszewski, M.; Tomusiak, R. Effect of Resin-Tapping on the Radial Increment of Scots pine (Pinus sylvestris L.)—Case Study of a Stand from Lidzbark Forest District. For. Res. Pap. 2013, 74, 273–280. [Google Scholar] [CrossRef] [Green Version]
  4. Zaluma, A.; Strike, Z.; Rieksts-Riekstiņš, R.; Gaitnieks, T.; Vasaitis, R. Long-Term Pathological Consequences of Resin Tapping Wounds on Stems of Scots Pine (Pinus sylvestris L.). Trees 2022, 36, 1507–1514. [Google Scholar] [CrossRef]
  5. Garcia-Forner, N.; Campelo, F.; Carvalho, A.; Vieira, J.; Rodríguez-Pereiras, A.; Ribeiro, M.; Salgueiro, A.; Silva, M.E.; Louzada, J.L. Growth-Defence Trade-Offs in Tapped Pines on Anatomical and Resin Production. For. Ecol. Manag. 2021, 496, 119406. [Google Scholar] [CrossRef]
  6. Misi, D.; Puchałka, R.; Pearson, C.; Robertson, I.; Koprowski, M. Differences in the Climate-Growth Relationship of Scots Pine: A Case Study from Poland and Hungary. Forests 2019, 10, 243. [Google Scholar] [CrossRef] [Green Version]
  7. Czyżyk, K. Radial Growth Response of Scots Pine (Pinus sylvestris L.) after Increasing the Availability of Water Resources. Forests 2021, 12, 1053. [Google Scholar] [CrossRef]
  8. Debel, A.; Meier, W.J.-H.; Bräuning, A. Climate Signals for Growth Variations of F. sylvatica, P. abies, and P. sylvestris in Southeast Germany over the Past 50 Years. Forests 2021, 12, 1433. [Google Scholar] [CrossRef]
  9. Popa, A.; Popa, I.; Roibu, C.-C.; Badea, O.N. Do Different Tree-Ring Proxies Contain Different Temperature Signals? A Case Study of Norway Spruce (Picea abies (L.) Karst) in the Eastern Carpathians. Plants 2022, 11, 2428. [Google Scholar] [CrossRef]
  10. Gunnarson, B.E.; Linderholm, H.W.; Moberg, A. Improving a Tree-Ring Reconstruction from West-Central Scandinavia: 900 Years of Warm-Season Temperatures. Clim. Dyn. 2011, 36, 97–108. [Google Scholar] [CrossRef]
  11. Rydval, M.; Larsson, L.-Å.; McGlynn, L.; Gunnarson, B.E.; Loader, N.J.; Young, G.H.F.; Wilson, R. Blue Intensity for Dendroclimatology: Should We Have the Blues? Experiments from Scotland. Dendrochronologia 2014, 32, 191–204. [Google Scholar] [CrossRef]
  12. Wilson, R.; Wilson, D.; Rydval, M.; Crone, A.; Büntgen, U.; Clark, S.; Ehmer, J.; Forbes, E.; Fuentes, M.; Gunnarson, B.E.; et al. Facilitating Tree-Ring Dating of Historic Conifer Timbers Using Blue Intensity. J. Archaeol. Sci. 2017, 78, 99–111. [Google Scholar] [CrossRef] [Green Version]
  13. López, R.; Cano, F.J.; Rodríguez-Calcerrada, J.; Sangüesa-Barreda, G.; Gazol, A.; Camarero, J.J.; Rozenberg, P.; Gil, L. Tree-Ring Density and Carbon Isotope Composition Are Early-Warning Signals of Drought-Induced Mortality in the Drought Tolerant Canary Island Pine. Agric. For. Meteorol. 2021, 310, 108634. [Google Scholar] [CrossRef]
  14. Pompa-García, M.; Hevia, A.; Camarero, J.J. Minimum and Maximum Wood Density as Proxies of Water Availability in Two Mexican Pine Species Coexisting in a Seasonally Dry Area. Trees 2021, 35, 597–607. [Google Scholar] [CrossRef]
  15. Camarero, J.J.; Hevia, A. Links between Climate, Drought and Minimum Wood Density in Conifers. IAWA J. 2020, 41, 236–255. [Google Scholar] [CrossRef]
  16. Björklund, J.; von Arx, G.; Nievergelt, D.; Wilson, R.; Van den Bulcke, J.; Günther, B.; Loader, N.J.; Rydval, M.; Fonti, P.; Scharnweber, T.; et al. Scientific Merits and Analytical Challenges of Tree-Ring Densitometry. Rev. Geophys. 2019, 57, 1224–1264. [Google Scholar] [CrossRef] [Green Version]
  17. Babst, F.; Frank, D.; Büntgen, U.; Nievergelt, D.; Esper, J. Effect of Sample Preparation and Scanning Resolution on the Blue Reflectance of Picea abies. TRACE Proc. 2009, 7, 188–195. [Google Scholar]
  18. McCarroll, D.; Pettigrew, E.; Luckman, A.; Guibal, F.; Edouard, J.-L. Blue Reflectance Provides a Surrogate for Latewood Density of High-Latitude Pine Tree Rings. Arct. Antarct. Alp. Res. 2002, 34, 450–453. [Google Scholar] [CrossRef]
  19. Campbell, R.; McCarroll, D.; Loader, N.J.; Grudd, H.; Robertson, I.; Jalkanen, R. Blue Intensity in Pinus sylvestris Tree-Rings: Developing a New Palaeoclimate Proxy. Holocene 2007, 17, 821–828. [Google Scholar] [CrossRef] [Green Version]
  20. Björklund, J.A.; Gunnarson, B.E.; Seftigen, K.; Esper, J.; Linderholm, H.W. Blue Intensity and Density from Northern Fennoscandian Tree Rings, Exploring the Potential to Improve Summer Temperature Reconstructions with Earlywood Information. Clim. Past 2014, 10, 877–885. [Google Scholar] [CrossRef] [Green Version]
  21. Wilson, R.; Rao, R.; Rydval, M.; Wood, C.; Larsson, L.-Å.; Luckman, B.H. Blue Intensity for Dendroclimatology: The BC Blues: A Case Study from British Columbia, Canada. Holocene 2014, 24, 1428–1438. [Google Scholar] [CrossRef]
  22. Kaczka, R.J.; Spyt, B.; Janecka, K.; Beil, I.; Büntgen, U.; Scharnweber, T.; Nievergelt, D.; Wilmking, M. Different Maximum Latewood Density and Blue Intensity Measurements Techniques Reveal Similar Results. Dendrochronologia 2018, 49, 94–101. [Google Scholar] [CrossRef]
  23. Reid, E.; Wilson, R. Delta Blue Intensity vs. Maximum Density: A Case Study Using Pinus uncinata in the Pyrenees. Dendrochronologia 2020, 61, 125706. [Google Scholar] [CrossRef]
  24. Heeter, K.J.; Harley, G.L.; Van De Gevel, S.L.; White, P.B. Blue Intensity as a Temperature Proxy in the Eastern United States: A Pilot Study from a Southern Disjunct Population of Picea rubens (Sarg.). Dendrochronologia 2019, 55, 105–109. [Google Scholar] [CrossRef]
  25. Blake, S.A.P.; Palmer, J.G.; Björklund, J.; Harper, J.B.; Turney, C.S.M. Palaeoclimate Potential of New Zealand Manoao colensoi (Silver Pine) Tree Rings Using Blue-Intensity (BI). Dendrochronologia 2020, 60, 125664. [Google Scholar] [CrossRef]
  26. Janecka, K.; Harvey, J.E.; Trouillier, M.; Kaczka, R.J.; Metslaid, S.; Metslaid, M.; Buras, A.; Wilmking, M. Higher Winter-Spring Temperature and Winter-Spring/Summer Moisture Availability Increase Scots Pine Growth on Coastal Dune Microsites Around the South Baltic Sea. Front. For. Glob. Chang. 2020, 3, 578912. [Google Scholar] [CrossRef]
  27. Wilson, R.; D’Arrigo, R.; Andreu-Hayles, L.; Oelkers, R.; Wiles, G.; Anchukaitis, K.; Davi, N. Experiments Based on Blue Intensity for Reconstructing North Pacific Temperatures along the Gulf of Alaska. Clim. Past 2017, 13, 1007–1022. [Google Scholar] [CrossRef] [Green Version]
  28. Buckley, B.M.; Hansen, K.G.; Griffin, K.L.; Schmiege, S.; Oelkers, R.; D’Arrigo, R.D.; Stahle, D.K.; Davi, N.; Nguyen, T.Q.T.; Le, C.N.; et al. Blue Intensity from a Tropical Conifer’s Annual Rings for Climate Reconstruction: An Ecophysiological Perspective. Dendrochronologia 2018, 50, 10–22. [Google Scholar] [CrossRef]
  29. Fuentes, M.; Salo, R.; Björklund, J.; Seftigen, K.; Zhang, P.; Gunnarson, B.; Aravena, J.-C.; Linderholm, H.W. A 970-Year-Long Summer Temperature Reconstruction from Rogen, West-Central Sweden, Based on Blue Intensity from Tree Rings. Holocene 2018, 28, 254–266. [Google Scholar] [CrossRef] [Green Version]
  30. Babst, F.; Wright, W.E.; Szejner, P.; Wells, L.; Belmecheri, S.; Monson, R.K. Blue Intensity Parameters Derived from Ponderosa Pine Tree Rings Characterize Intra-Annual Density Fluctuations and Reveal Seasonally Divergent Water Limitations. Trees 2016, 30, 1403–1415. [Google Scholar] [CrossRef]
  31. Seftigen, K.; Fuentes, M.; Ljungqvist, F.C.; Björklund, J. Using Blue Intensity from Drought-Sensitive Pinus sylvestris in Fennoscandia to Improve Reconstruction of Past Hydroclimate Variability. Clim. Dyn. 2020, 55, 579–594. [Google Scholar] [CrossRef]
  32. Akhmetzyanov, L.; Sánchez-Salguero, R.; García-González, I.; Domínguez-Delmás, M.; Sass-Klaassen, U. Blue Is the Fashion in Mediterranean Pines: New Drought Signals from Tree-Ring Density in Southern Europe. Sci. Total Environ. 2023, 856, 159291. [Google Scholar] [CrossRef]
  33. Mills, C.M.; Crone, A.; Wood, C.; Wilson, R. Dendrochronologically Dated Pine Buildings from Scotland: The SCOT2K Native Pine Dendrochronology Project. Vernac. Archit. 2017, 48, 23–43. [Google Scholar] [CrossRef]
  34. Akhmetzyanov, L.; Sánchez-Salguero, R.; García-González, I.; Buras, A.; Dominguez-Delmás, M.; Mohren, F.; den Ouden, J.; Sass-Klaassen, U. Towards a New Approach for Dendroprovenancing Pines in the Mediterranean Iberian Peninsula. Dendrochronologia 2020, 60, 125688. [Google Scholar] [CrossRef]
  35. Génova, M.; Caminero, L.; Dochao, J. Resin Tapping in Pinus pinaster: Effects on Growth and Response Function to Climate. Eur. J. For. Res. 2014, 133, 323–333. [Google Scholar] [CrossRef]
  36. Soliño, M.; Yu, T.; Alía, R.; Auñón, F.; Bravo-Oviedo, A.; Chambel, M.R.; de Miguel, J.; del Río, M.; Justes, A.; Martínez-Jauregui, M.; et al. Resin-Tapped Pine Forests in Spain: Ecological Diversity and Economic Valuation. Sci. Total Environ. 2018, 625, 1146–1155. [Google Scholar] [CrossRef] [Green Version]
  37. Zeng, X.; Sun, S.; Wang, Y.; Chang, Y.; Tao, X.; Hou, M.; Wang, W.; Liu, X.; Zhang, L. Does Resin Tapping Affect the Tree-Ring Growth and Climate Sensitivity of the Chinese Pine (Pinus tabuliformis) in the Loess Plateau, China? Dendrochronologia 2021, 65, 125800. [Google Scholar] [CrossRef]
  38. Hao-ran, W.U.; Yan-ru, F.a.N.; Xiao-yun, N.I.U.; Qi-fu, L.; Yan-jie, L.I.; Jing-min, J.; Jian-er, J.I.N. Effects of Resin-Tapping Year on Wood Properties of Living Pinus elliottii. For. Res. 2022, 35, 31–39. [Google Scholar] [CrossRef]
  39. Maxwell, R.S.; Larsson, L.-A. Measuring Tree-Ring Widths Using the CooRecorder Software Application. Dendrochronologia 2021, 67, 125841. [Google Scholar] [CrossRef]
  40. R Core Team. R: A Language and Environment for Statistical Computing; R Foundation for Statistical Computing: Vienna, Austria, 2021; Available online: https://www.R-project.org/ (accessed on 10 March 2023).
  41. Jevšenak, J.; Levanič, T. DendroTools: R Package for Studying Linear and Nonlinear Responses between Tree-Rings and Daily Environmental Data. Dendrochronologia 2018, 48, 32–39. [Google Scholar] [CrossRef] [Green Version]
  42. Jevšenak, J. New Features in the DendroTools R Package: Bootstrapped and Partial Correlation Coefficients for Monthly and Daily Climate Data. Dendrochronologia 2020, 63, 125753. [Google Scholar] [CrossRef]
  43. Cornes, R.C.; van der Schrier, G.; van den Besselaar, E.J.M.; Jones, P.D. An Ensemble Version of the E-OBS Temperature and Precipitation Data Sets. J. Geophys. Res. Atmos. 2018, 123, 9391–9409. [Google Scholar] [CrossRef] [Green Version]
  44. Wigley, T.M.L.; Briffa, K.R.; Jones, P.D. On the Average Value of Correlated Time Series, with Applications in Dendroclimatology and Hydrometeorology. J. Appl. Meteorol. Climatol. 1984, 23, 201–213. [Google Scholar] [CrossRef]
  45. Speer, J.H. Fundamentals of Tree-Ring Research; The University of Arizona Press: Tucson, AZ, USA, 2010. [Google Scholar]
  46. Barbaroux, C.; Bréda, N. Contrasting Distribution and Seasonal Dynamics of Carbohydrate Reserves in Stem Wood of Adult Ring-Porous Sessile Oak and Diffuse-Porous Beech Trees. Tree Physiol. 2002, 22, 1201–1210. [Google Scholar] [CrossRef]
  47. Kilbride, J. New Dendrochronological Approaches to Identifying Climate Drivers in Northern Conifers. UVM Honors College Senior Thesis, The University of Vermont, Burlington, VT, USA, 2016. [Google Scholar]
  48. Cao, X.; Hu, H.; Kao, P.; Buckley, B.M.; Dong, Z.; Chen, X.; Zhou, F.; Fang, K. Improved Spring Temperature Reconstruction Using Earlywood Blue Intensity in Southeastern China. Int. J. Climatol. 2022, 42, 6204–6220. [Google Scholar] [CrossRef]
  49. Waszak, N.; Robertson, I.; Puchałka, R.; Przybylak, R.; Pospieszyńska, A.; Koprowski, M. Investigating the Climate-Growth Response of Scots Pine (Pinus sylvestris L.) in Northern Poland. Atmosphere 2021, 12, 1690. [Google Scholar] [CrossRef]
  50. Matisons, R.; Jansone, D.; Elferts, D.; Adamovičs, A.; Schneck, V.; Jansons, Ā. Plasticity of Response of Tree-Ring Width of Scots Pine Provenances to Weather Extremes in Latvia. Dendrochronologia 2019, 54, 1–10. [Google Scholar] [CrossRef]
  51. Kalbarczyk, R.; Ziemiańska, M.; Nieróbca, A.; Dobrzańska, J. The Impact of Climate Change and Strong Anthropopressure on the Annual Growth of Scots Pine (Pinus sylvestris L.) Wood Growing in Eastern Poland. Forests 2018, 9, 661. [Google Scholar] [CrossRef] [Green Version]
  52. Janecka, K.; Metslaid, S.; Metslaid, M.; Harvey, J.E.; Wilmking, M. Short-Term Effects of Droughts and Cold Winters on the Growth of Scots Pine at Coastal Sand Dunes around the South Baltic Sea. Forests 2022, 13, 477. [Google Scholar] [CrossRef]
  53. Candel-Pérez, D.; Lo, Y.-H.; Blanco, J.A.; Chiu, C.-M.; Camarero, J.J.; González de Andrés, E.; Imbert, J.B.; Castillo, F.J. Drought-Induced Changes in Wood Density Are Not Prevented by Thinning in Scots Pine Stands. Forests 2018, 9, 4. [Google Scholar] [CrossRef] [Green Version]
  54. Björklund, J.; Gunnarson, B.E.; Seftigen, K.; Zhang, P.; Linderholm, H.W. Using Adjusted Blue Intensity Data to Attain High-Quality Summer Temperature Information: A Case Study from Central Scandinavia. Holocene 2015, 25, 547–556. [Google Scholar] [CrossRef]
Figure 1. Site location and sample collection: (a) RT Scots pine; (b) location of research area; (c) wounded trunk; and (d) method of coring two-wound and three-wound trees.
Forests 14 00593 g001
Figure 2. Climatic data for Trzcianka. Orange line—mean temperature, circles—range of monthly mean temperatures from 1921 to 2021. Data imported from the E-OBS database.
Forests 14 00593 g002
Figure 3. Indexed ring width (RWI) chronologies. Black line—NRT, red—RT; grey rectangles indicate the resin-tapping period.
Forests 14 00593 g003
Figure 4. Indexed delta blue intensity chronologies. Black line—NRT, blue line—RT; grey rectangles indicate the resin-tapping period.
Forests 14 00593 g004
Figure 5. Raw chronologies of TRW (top) and DBI (bottom) for the studied period. Colored lines—RT trees, grey lines—NRT trees.
Forests 14 00593 g005
Table 1. Characteristics of the tested trees.
CharacteristicNRTRT
TRWDBITRWDBI
No. of trees17142216
DBH (cm)47.449.7
Height (m)30.7
GLK0.6590.6450.6640.626
AR10.7470.6280.7620.691
RBAR0.5060.3440.4720.332
EPS0.9420.8730.9480.881
SNR16.366.9018.297.42
Table 2. Descriptive statistics of the raw chronologies.
StatisticPeriodNRTRT
TRW
(mm)
DBITRW
(mm)
DBI
MeanBefore tapping0.911.040.971.06
SD1935–19740.2390.070.2540.069
CV 26.1%7.05%26.1%6.6%
MeanTapping period0.570.890.550.81
SD1976–19800.0960.0750.1200.129
CV 16.7%8.5%21.6%16%
MeanAfter tapping1.10.981.380.93
SD1981–20210.3540.0990.3980.118
CV 32.1%10.1%28.8%12.7%
Note. SD—standard deviation, CV—coefficient of variability.
Disclaimer/Publisher’s Note: The statements, opinions and data contained in all publications are solely those of the individual author(s) and contributor(s) and not of MDPI and/or the editor(s). MDPI and/or the editor(s) disclaim responsibility for any injury to people or property resulting from any ideas, methods, instructions or products referred to in the content.

