Article

Relationship between the Floristic Composition and Soil Characteristics of a Tropical Rainforest (TRF)

1
Institute of Biological Sciences, Faculty of Science, Universiti Malaya, Kuala Lumpur 50603, Malaysia
2
Department of Botany, Islamia College Peshawar, Peshawar 25120, Pakistan
3
University Public School, University of Peshawar, Peshawar 25120, Pakistan
4
School of Biological Sciences, Universiti Sains Malaysia, Minden, Penang 11800, Malaysia
5
Department of Crop and Animal Production, Sason Vocational School, Batman University, Batman 72060, Turkey
6
Laboratory of Applied Ecology, Faculty of Agronomic Sciences, University of Abomey-Calavi Benin, Godomey P.O. Box 1974, Benin
7
Department of Plant Sciences, Quaid-i-Azam University, Islamabad 45320, Pakistan
8
Centre of Plant Biodiversity, University of Peshawar, Peshawar 25120, Pakistan
9
School of Biomedical Sciences, Queensland University of Technology, Brisbane City 4000, Australia
10
Department of Botany and Microbiology, College of Science, King Saud University, Riyadh 11451, Saudi Arabia
11
Food Engineering Department, Faculty of Food Science and Technology, University of Agricultural Sciences and Veterinary Medicine Cluj-Napoca, 3-5 Calea Mănă ̧stur Street, 400372 Cluj-Napoca, Romania
12
Technological Transfer Center “CTT-BioTech”, University of Agricultural Sciences and Veterinary Medicine Cluj-Napoca, 400509 Cluj-Napoca, Romania
*
Authors to whom correspondence should be addressed.
Forests 2023, 14(2), 306; https://doi.org/10.3390/f14020306
Submission received: 27 November 2022 / Revised: 24 January 2023 / Accepted: 31 January 2023 / Published: 3 February 2023
(This article belongs to the Special Issue Forest Soil Carbon Cycle in Response to Global Change)

Abstract

:
Hutan Rimba Alam (HRA), Putrajaya is an urban forest which is the habitat for various tropical rainforest species. A field survey was undertaken to state the floristic composition, investigate the soil characteristics and identify the relationship between the recorded plant communities and soil characteristics. Six plots sized 10 × 10 m square were established in a lowland area of which 93 individual trees were identified. Moreover, the floristic composition revealed vascular tree communities consisting of 10 botanical families, 15 genera, and 27 species with Dipterocarpaceae as being predominant. Based on the important value index (IVI), Mangifera odorata (Anacardiaceae) was the highest (IVI = 68.80%). Furthermore, large trees such as Koompassia excelsa (Becc.) Taub. (Fabaceae) and Sandoricum koetjape (Burm.f.) Merr. (Meliaceae), with heights ranging from 17 m to 24 m, indicated that HRA is on the way to becoming a mature forest. The soil pH in all plots showed acidic properties, with a mean pH of 4.69 that is considered normal for tropical rainforests. The pH of the soils in HRA, Putrajaya had a positive correlation with the CEC and with nitrogen, but the value was low; however, the correlation was negative with C and P. The CEC had a relatively low correlation with C, N and P. Carbon had a very high correlation with N but low with P. Meanwhile, nitrogen had a very negatively low correlation with P. Extractable phosphorus exhibited a mean of 2.22 mg/kg which is normally used in plants for fruits, roots, and flower development. The present study revealed that plant communities in the urban forest in Putrajaya, meaning the diversity of the plant species belonging to a wide range of families, were established on acid soil, matching with the overall characteristics of tropical forest soils. With regard to the climate change context, which is leading to many altered ecosystems, the authors expect that the outputs of this research will be valued by decision makers for a better management of the forest.

1. Introduction

The word floristic is derived from flora, which means to list all types of a plant species or plant taxa within a specific geographical area [1]. Flora documentation is commonly acknowledged as essential over the world since it plays an important part in preserving a region’s national assets [2]. Usually a floristic listing helps in the identification and nomenclature of species [3,4]. Tropical rainforests are remarkably known to host a noticeable diversity and richness of woody and herbaceous species, as has been reported in many studies [5,6,7]. Because of anthropic and other environmental drivers, this biodiversity is threatened worldwide. For instance, a recent study stated the overexploitation of the organs of Kigelia africana (Lam.) Benth. as threats to its conservation in Benin [5]. Moreover, it has been reported that the medicinal exploitation of entire plants of herbaceous species potentially endangers the sustainability of the concerned species [6]. Logging for construction and increasing agricultural lands in some countries has led to the loss of forest areas which have been reported to be vanishing rapidly, largely contributed to by the clearing of forest areas for plantation or agriculture and shifting cultivation [7]. However, according to the Malaysian Ministry of Energy and Natural Resources that has stated in its official portal, the country’s total forest area increased by 0.082 million hectares from 2000 to 2014, which includes 0.96 million hectares of total protected forests [8]. Malaysia is still fortunate to have a high percentage of forest cover associated with a high number of tree flora; however, there is growing concern over forest logging for construction, and their overexploitation by humans for many other purposes as well as habitat degradation threatening many animal and plant species’ survival. In fact, many species are today known to be threatened and others are at the verge of extinction [9]. Rehabilitation that concerns all those processes that help to reverse the state or processes of degradation and that help return the land to a stable and more productive condition dominated by trees, is required [10]. Forest plantations, meaning forests that were established by planting and/or seeding in the process of afforestation or reforestation, also seem useful. Little is known, however, of the floristic variation, or the processes and vegetation drivers that are responsible for the great phytodiversity in Malaysia. Concerning the tree density in a forest, it is important to highlight that it can be different based on the terrain, gradient and slope direction causing differences in the soil, water and microclimate which may induce variations in species’ adaptability [11]. The forests throughout Malaysia consist of a rich biodiversity and also a habitat of diverse flora and fauna [12]. Regarding the habitat quality, its complete evaluation requires the monitoring of multiple biological taxa [13]. Hence, this study, one of the rare studies on Hutan Rimba Alam (HRA), is useful to understand the phytodiversity of the study area. Most of the previous works carried out in this topic in the country have focused on selected species occurring in a degraded forest at the urban level [14,15,16]. Environmental changes significantly affect the species composition, but did not affect the forest structure in a whole [17]. The environmental gradients such as the major soil features and abiotic conditions which influence the floristic composition is an important criteria to conserve forests habitats [18]. The anthropogenic disturbance gradients such as the shrub coverage, visitor flow rate, the aspect and the adjacent land types significantly affect the species diversity of a herb and shrub layers in an urban forests [19]. The environmental factors, mostly soil features significantly influenced the floristic composition of a certain forest ecosystem [20]. There is an evident lack, however, of scientific information on both the floristic composition and soil characteristics of many planted forests in Malaysia that are aged more than 16 years. Investigating them in relation to such land-use will no doubt give an insight for the future management regime, such as for enrichment, planting and ecological monitoring. Further investigations should contribute to a more detailed understanding of the diversity and distribution patterns of tropical species in HRA as a whole; therefore, the present research aims to determine its floristic composition, investigate the soil characteristics and identify the relationship between the soil characteristics and the phytodiversity. The outputs of this study are expected to serve as a relevant baseline of information for future research works in the study area. Moreover, the authors expect that the forestry stakeholders in Malaysia will use the findings as a sustainable decision-making tool.

2. Materials and Methods

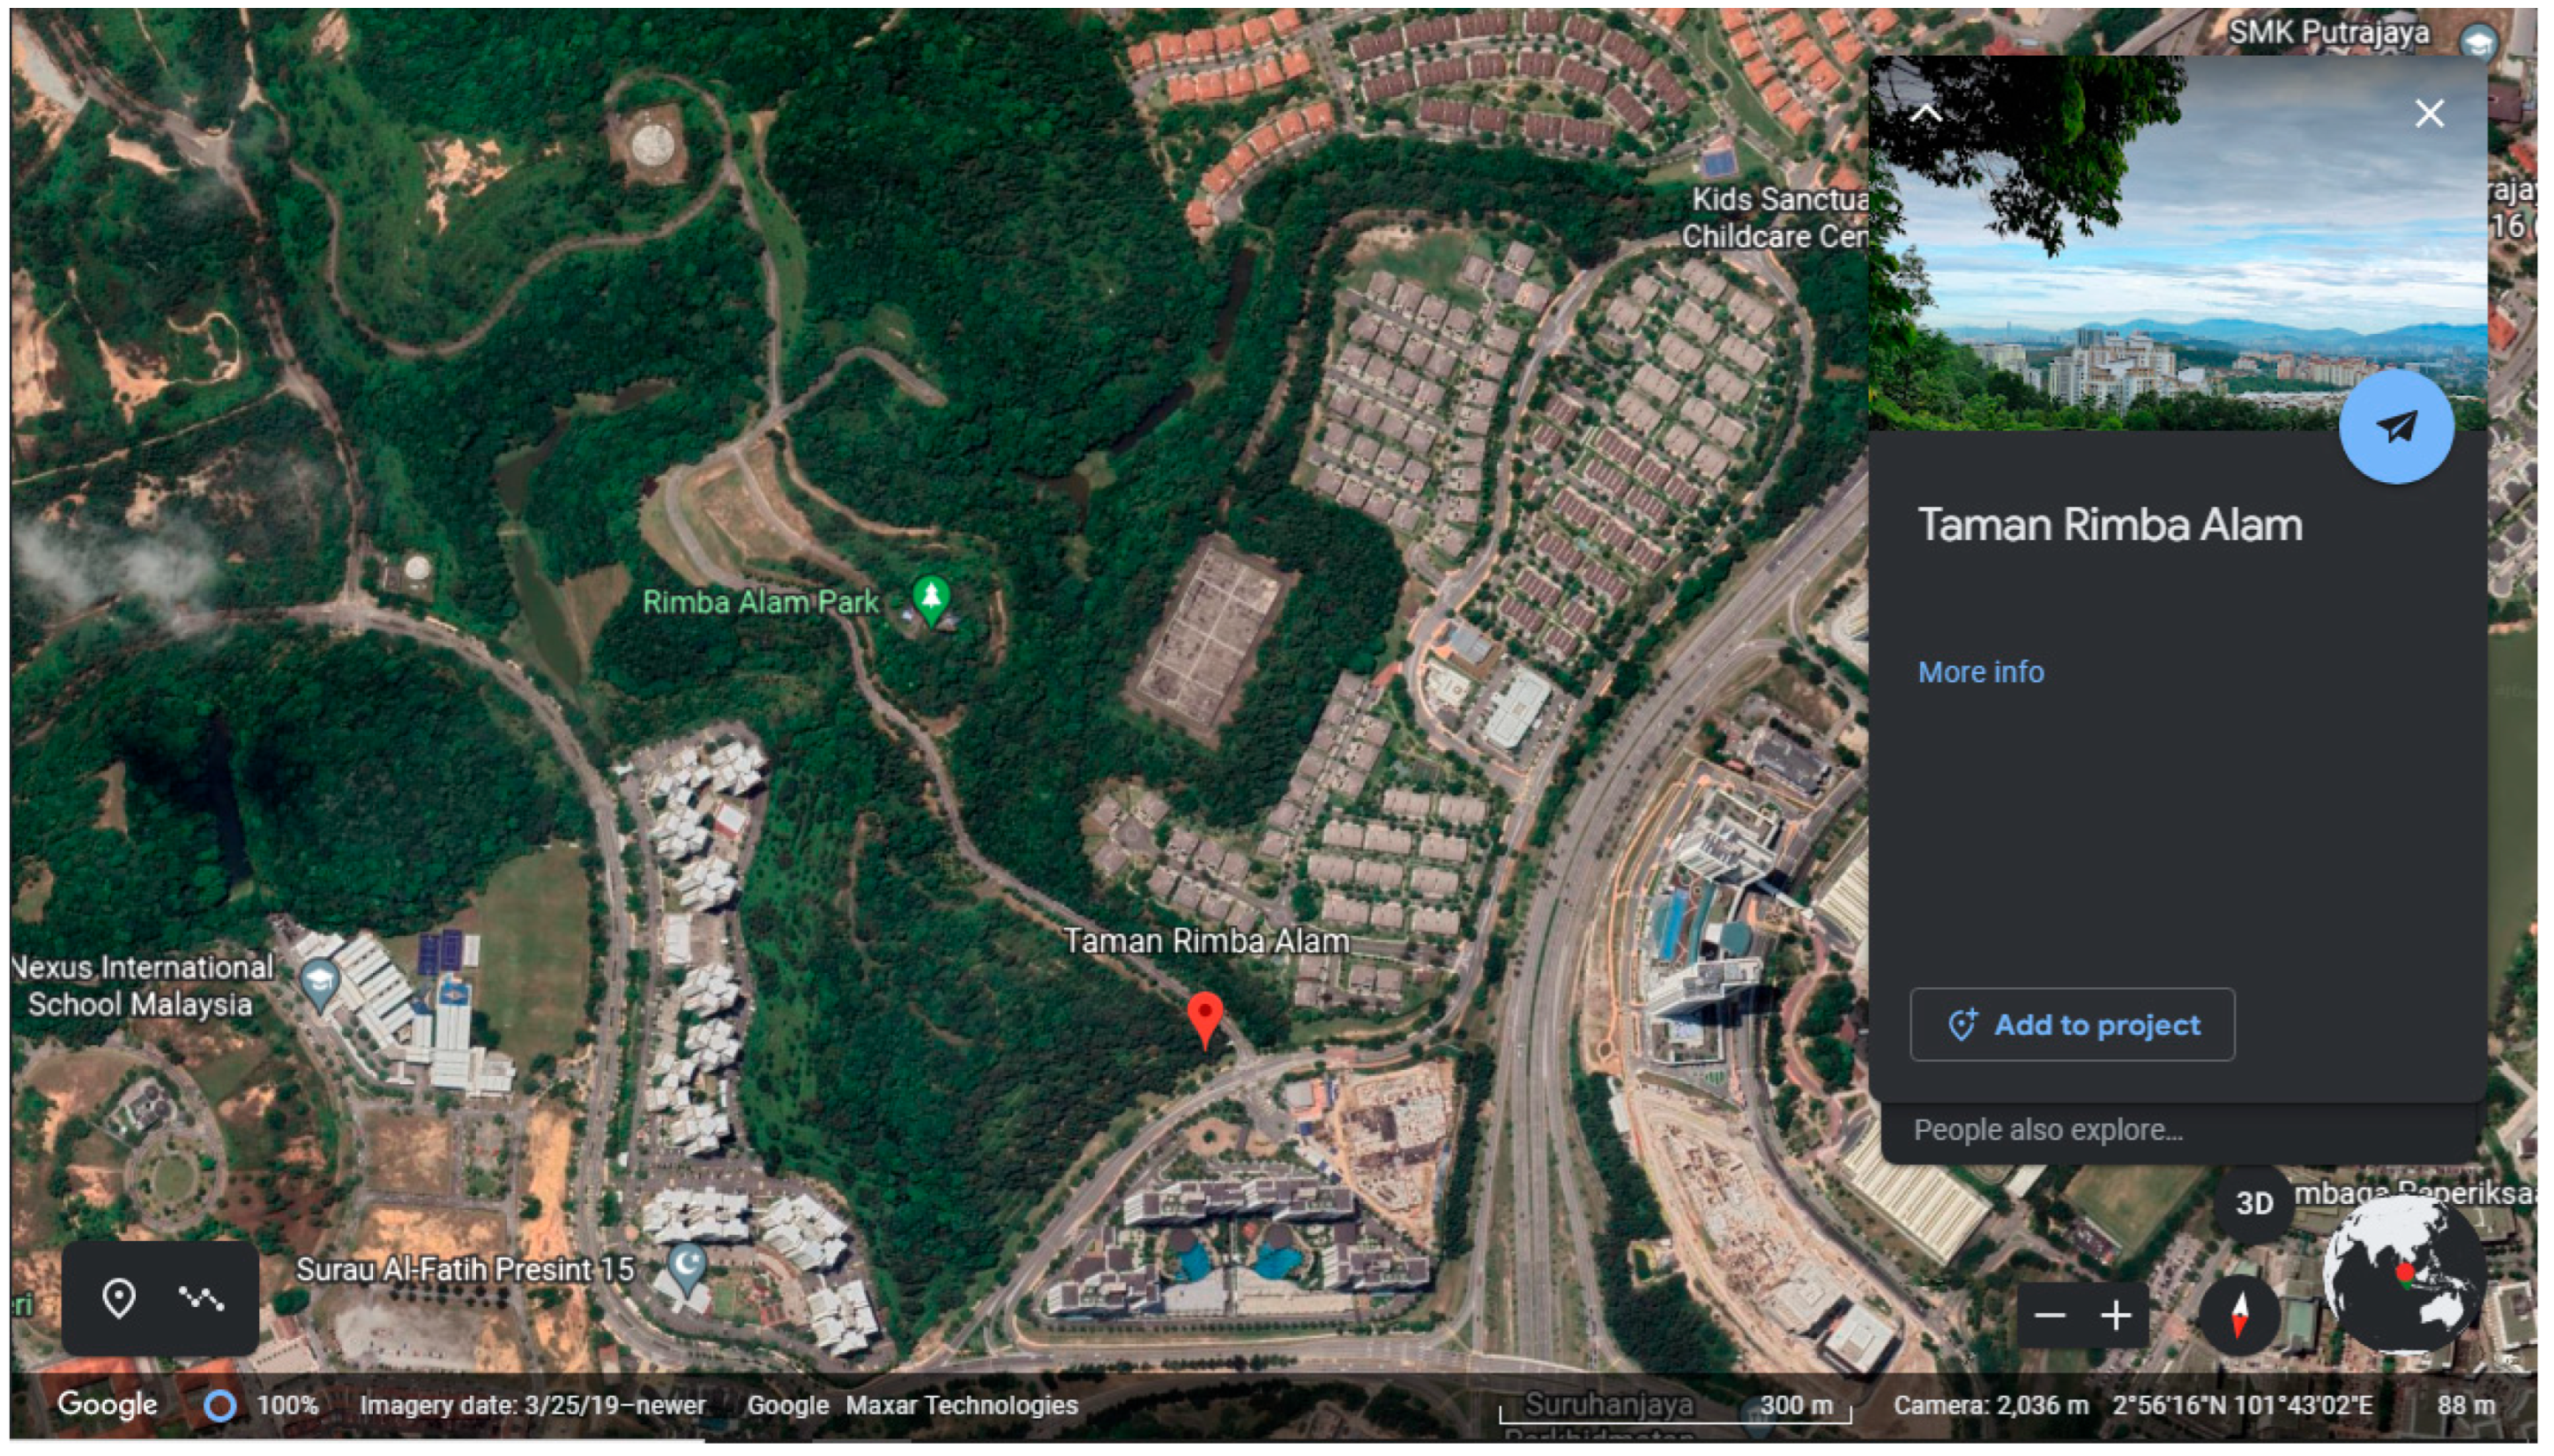
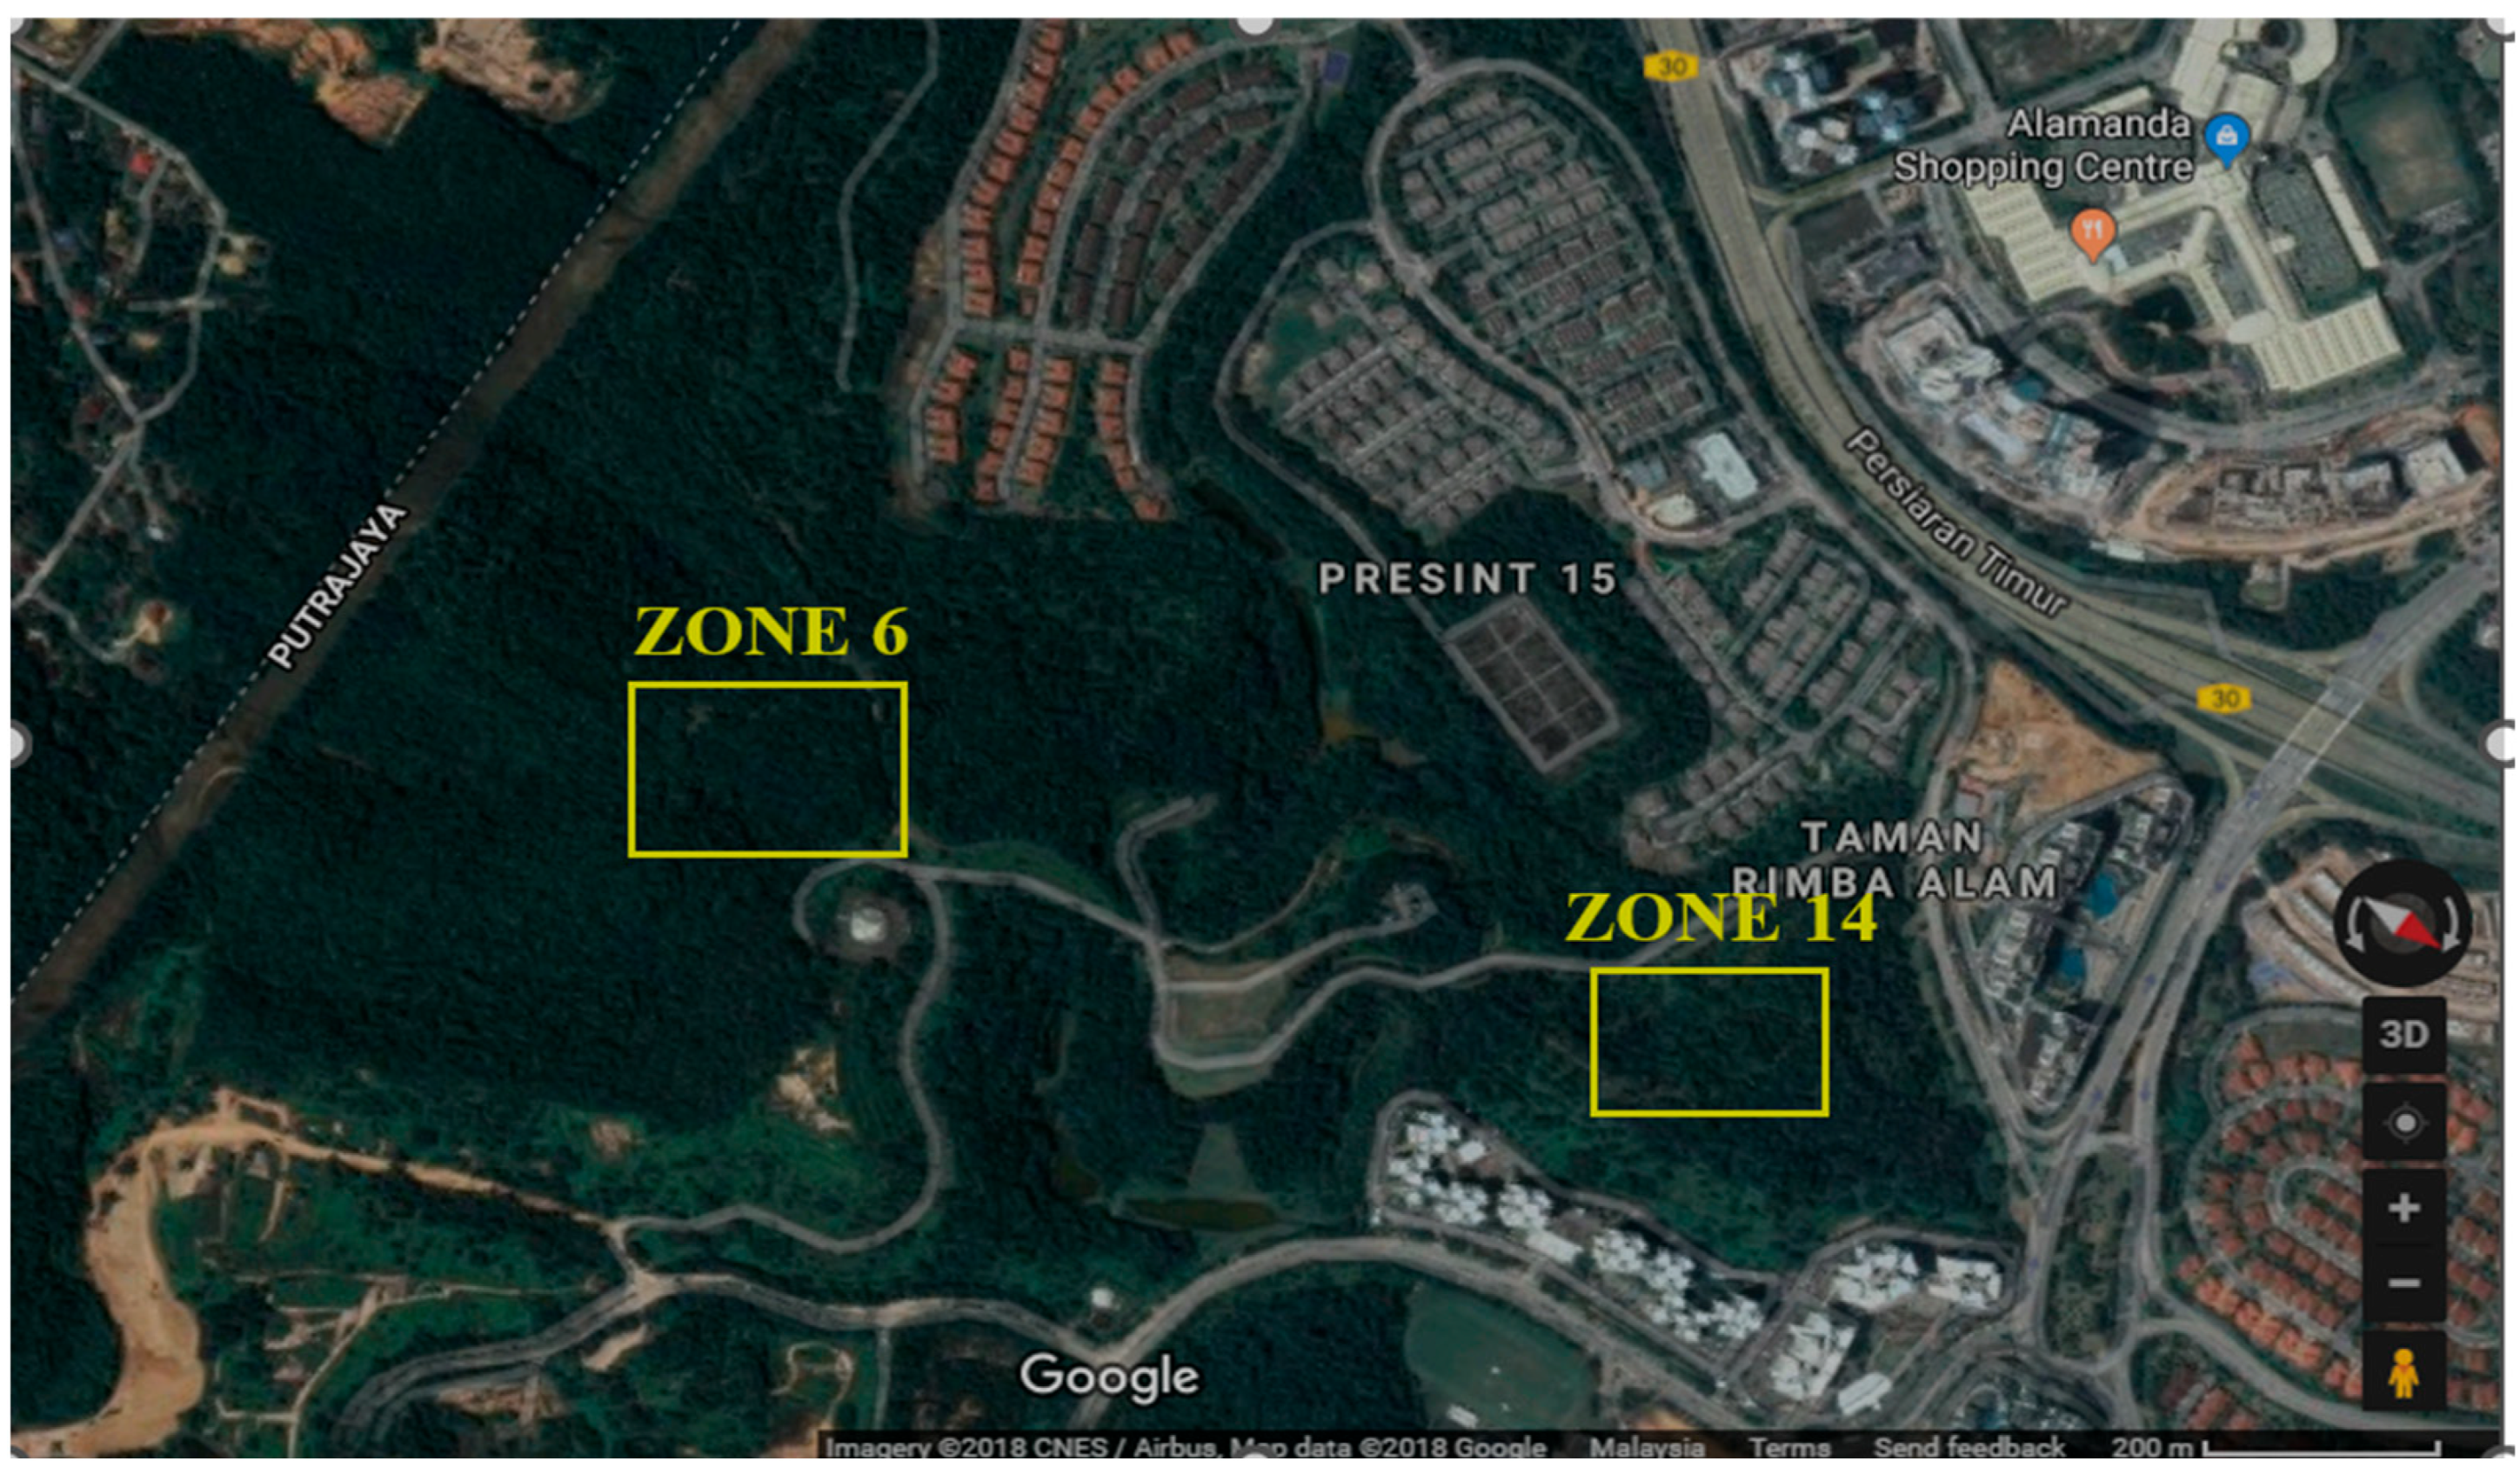
2.1. Study Site Description

Putrajaya is a modern garden city with an area of 4931 ha and located about 25 km from Kuala Lumpur. Thirty-five percent of its landscape consists of gardens, lakes and parks [21]. There are 13 different parks ranging from botanical gardens to the main landscaped wetlands, making it a special region. HRA, Putrajaya, of Peninsular Malaysia is one of the gardens that covers about 160 ha and is located at E: 101°43′0.5″ N: 2°56′25.7″ between Precincts 14 and 15 on the eastern section of Putrajaya. HRA could be considered as an old forest plantation because all the trees were planted at the same period in 2005. The floristic composition data of the tropical rainforest trees were collected from 2 selected zones in HRA, specifically Zone 14 and Zone 6 (Figure 1). Both Zone 14 and Zone 6 extend in the Community Forest Park (CFP) allowing people to freely access their areas (Figure 2). Contrasted from the other 20 zones, Zones 14 and 6 were initially the zones of a rubber estate and an oil palm plantation that underwent forest replantation. Based on a study by the Putrajaya Corporation upon HRA, Putrajaya on 16 August 2016, HRA is a 160 hectare area established in Precinct 14 and 15, Putrajaya, that demonstrates collections of diverse tropical forest species. Putrajaya Corporation records the topography of HRA as being elevated in the range of 20–70% initiated at 60 m–135 m from the sea level. There are 22 zones in HRA partitioned into 3 sub regions, namely, the Core Forest (MCF) (114.10 ha), followed by the North Eastern Forest Corridor and the Community Forest Park with 35.02 ha and 11.89 ha, respectively. The purposes of the HRA establishment were, firstly, to structure a human-made forest from the area of a rubber estate and an oil palm plantation with a Lowland Dipterocarp Forest concept. Secondly, it was to exhibit and conserve miscellaneous tropical forest species and to reinstate HRA towards an everlasting area that is prosperous with flora and fauna. Lastly, it was to be erected as one of the genuine and coordinated recreation areas in Putrajaya by sustaining the progenitor topography structure. The key site condition of the HRA area before its establishment was intrinsically non-ecofriendly. The reasons for the formation of HRA were that the base vegetation consisted of a rubber plantation and an oil palm plantation with a difference in elevation between 20% and 70%, which made the process of secondary thinning a challenge. Next, was to congregate varied high-sensitivity forest species from their natural habitats into a new introduced area (i.e., an ex situ conservation) [21].

2.2. Plant and Soil Sampling

Sample plots sized 10 m × 10 m were laid out in each zone (i.e., Zones 14 and 6) for data collection. Plots 1–4 were located in Zone 6 while the other 2 plots, which were plots 5 and 6, were located in Zone 14. Since the plots in each zone were divided by a small pavement or road constructed by the authority, those plots were selected based on their structural aspects (the topography), the ability to reach and measure each of the trees and their tree abundance. Plots 1 and 2 were laid out in the Kasai–Merawan Forest, plots 3 and 4 extended into Indigenous Forest Fruit Trees and plots 5 and 6 were installed in the International Tropical Arboretum.
All the plant species with a diameter at a breast height (DBH) of 5 cm or greater in each plot were numbered, marked, and measured. The trunk perimeter was measured with a metric tape, and the values were estimated using the stick method. Each tree species was identified at the Universiti Malaya herbarium at Rimba Ilmu through the collection of leaf specimens as the voucher species. The full list of plant vouchers is available from the authors.
The forest litter at the top of the forest ground was removed, and the soil was shoved out (0–30 cm). Sample of soil (500 g) from each plot was put in a polyethylene bag and stir together thoroughly. The temperature was set at 20–25 °C to prevent soil water repellency upon drying [22]. The soil samples were crushed and sieved through a 2 mm mesh [12]. The composite soil samples were then used in the soil laboratory for a detailed analysis of various chemical characteristics.

2.3. Plant Analysis

The basal area (BA) of trees [23] and the importance value (IVI) [14] were calculated. The relative frequency (RF), meaning the degree of dispersion of individual species in a given area in relation to the total number of species observed, was calculated as follows:
Relative   frequency   R F = Number   of   occurence   of   species   Number   of   occurence   of   all   species   ×   100
The relative density explains the numerical strength of a species in relation to the total number of individuals of all species. It is determined by using the formula below:
Relative   Density = Number   of   individual   of   the   species   Number   of   individual   of   all   species   ×   100
The value of the stand basal area determines a species’ relative dominance. The coverage value of a species in relation to the sum of the coverage of the remaining species in the area is calculated as follows:
Relative   Dominance = Total   basal   area   of   the   species   Total   basal   area   of   all   the   species   ×   100
The sum of the total diameter of the emerging stems was used to calculate the overall stand basal area. Using the formula πr2, the basal area of trees was calculated at breast height, meaning at a height of 1.37 m above the ground surface. Individuals with a trunk diameter equal or higher than 5 cm were considered for this calculation. The importance value index determines the overall importance of each species in the community structure of the research area. This value is designated as the importance value index (IVI) of the species [14] as follows:
Importance Value Index (IVI) = RDi + RFi + RBi
where IVI = importance value of speciesi, RDi = relative density of speciesi, RFi = relative frequency of speciesi, and RBi = relative dominance (basal area) of speciesi.

2.4. Soil Analysis

The evaluation of the soil chemical characteristics included the soil samples that were analyzed at the soil laboratory in Universiti Putra Malaysia. The potentiometric method was used by measuring the pH for every sample using magnetic stirrer [24,25]. The Kjeldahl method, known since 1983, was used to calculate the nitrogen content as it is easy to run multiple analyses and it was applicable to samples low in N [26,27]. The ammonium acetate method (i.e., the leaching method) was used to assess the cation exchange capacity (CEC), as well as the distillation method [28,29]. The available phosphorus in the soils was determined by the Bray 1 method which extracts acid-soluble P coming from Ca-phosphates, Al-phosphates and Fe-phosphates from soil [15,30].

2.4.1. Statistical Analysis

The correlation among the soil chemical properties was determined using the R Studio software version 3.6.0. A Pearson correlation analysis was performed to identify possible relationships (correlations) between the chemical characteristics.

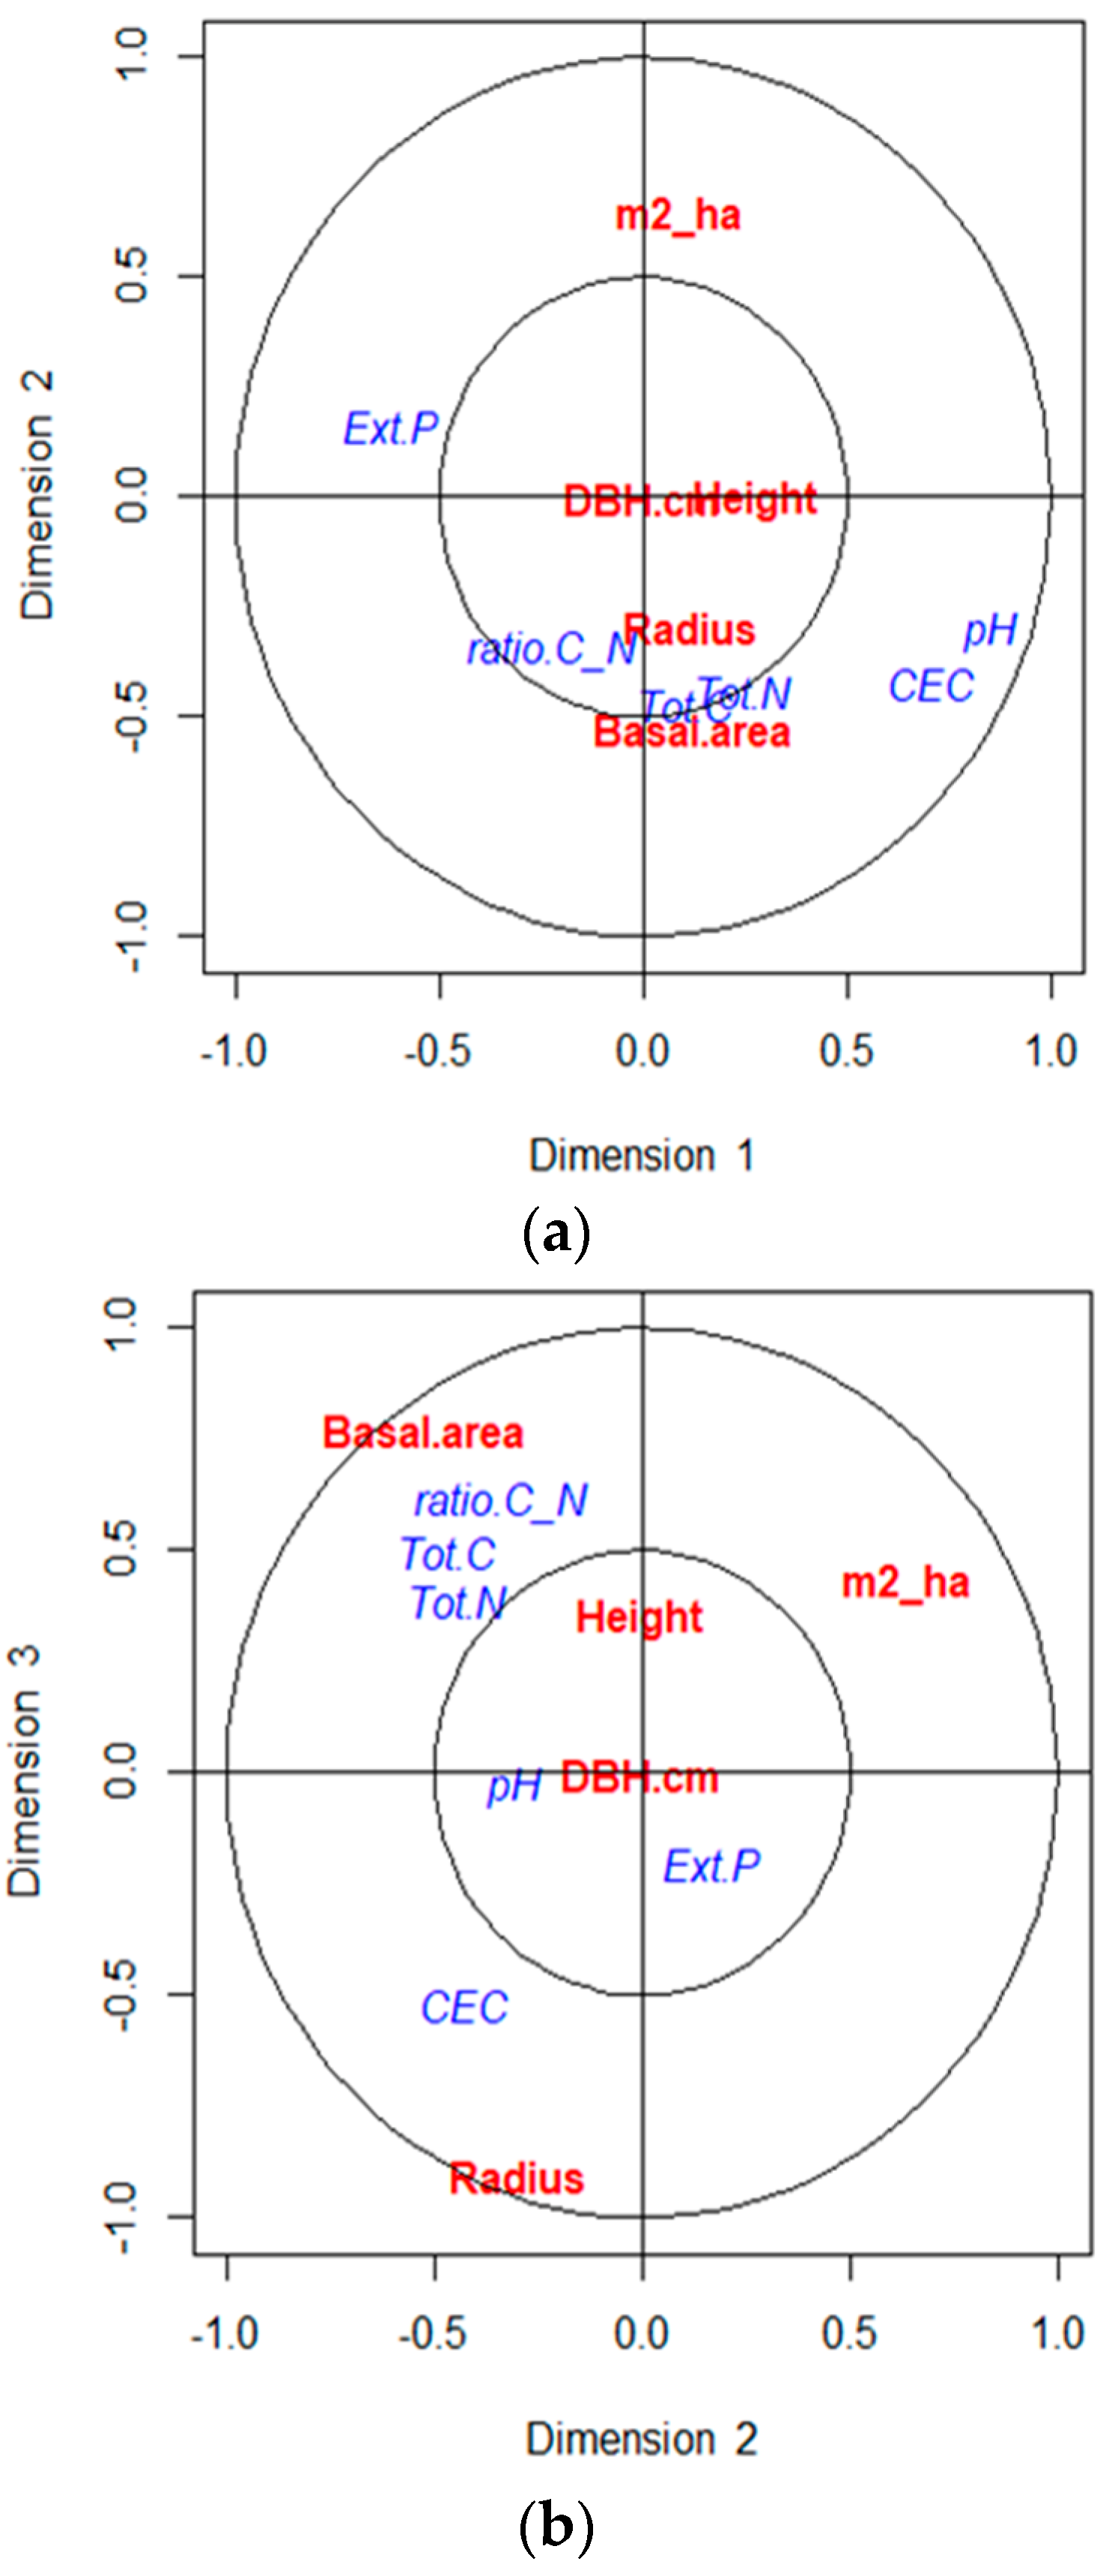
2.4.2. Data Processing and Analysis to Assess the Correlation between Dendrometric Parameters and Soil Chemical Properties of Plots

The data were processed and analyzed entirely in the Integreted Development Environment of RStudio [31] under the software R [32]. In order to assess the correlation between the dendrometric parameters and soil chemical properties, we performed a canonical correlation analysis under the package CCA [33] by considering the dendrometric variables as dependent variables and the chemical properties as independent variables. A CCA biplot was plotted to show the variables’ representations on the two first canonical variates on one hand, and the second and third canonical variates on the other hand.

3. Results

3.1. Floristic Composition

In the study region, 93 distinct trees with a minimum DBH of 5 cm were located. Overall, there were 27 plant taxa in the floristic composition, which were divided among 15 genera and 10 families as given in Table 1. The most diverse family was Dipterocarpaceae with 26 individual trees and represented by 10 species and three genera, followed by Anacardiaceae which shared one genus and two taxa (15 individual trees). It was followed by Salicaceae with one genus and three species (10 individual trees). In addition, there were two families that were represented with only one species and four individuals in the study plots, namely, Arecaceae and Lauraceae. With the least number of species and individuals, those families were considered as the most uncommon families within the study plots. The DBH distribution of trees in this study (Table 2) showed that most of the trees (20 individuals) fell into Class Three (i.e., a group of trees with a DBH between 25 cm to 34.9 cm). Class One (i.e., trees with a DBH between 5 cm to 14.9 cm) showed only six individuals. The existence of several large trees ranging from 11.8 m to 17.15 m in height proved that the study area could form an emergence canopy. Sandroricum koetjape (Burm.f.) Merr. was the largest tree species in the study area with a diameter at a breast height of 140 cm and being 17.15 m in height, followed by Mangifera indica L. with 117 cm in diameter at breast height and being 10.7 m in height. It was followed by Sandoricum koetjape with a diameter at breast height of 113 cm and being 17 m in height. The most abundant species was Mangifera odorata Griff. (Anacardiaceae) with 14 individuals followed by Baccaurea motleyana (Müll.Arg.) Müll.Arg. (Phyllanthaceae) with nine individuals and Pometia pinnata J.R.Forst. and G.Forst. (Sapindaceae) with eight individuals, respectively (Table 3).

3.2. Species Importance

3.2.1. Relative Density

In this investigation, the relative density value ranged from 1.1% to 15.1% (showing that the density of each species had a wide gap). M. odorata (Anacardiaceae) was the species with the highest density, which had 14 trees, accounting for 15.1% of all the trees in this study (Table 3).

3.2.2. Relative Frequency

M. odorata (Anacardiaceae), Ptychosperma macarthurii (H.Wendl. ex H.J.Veitch) H.Wendl. ex Hook.f. (Arecaceae), Alstonia scholaris (L.) R. Br. (Dipterocarpaceae) and P. pinnata (Sapindaceae) appeared most often in this study with a frequency of 33%, while the remaining trees species had the second highest frequencies which were 17% (Table 3).

3.2.3. Basal Area

The total stand basal area of this study was 2156.69 m2 ha−1. M. odorata (Anacardiaceae) had the highest total stand basal area in the study area with a value of 447.44 m2 ha−1. The species with the second highest total stand basal area was S. koetjape (Meliaceae) with a value of 318.84 m2 ha−1 followed by K. excelsa (Fabaceae) and Pongamia pinnata (L.) Pierre (Fabaceaae) with a value of 169.04 m2 ha−1 and 159.29 m2 ha−1, respectively.

3.2.4. Importance Value Index

Based on the calculated importance value index (IVI) of the ten leading species in the study area (Table 4), M. odorata (Anacardiaceae) was the most important species with an IVI of 68.80%. P. pinnata (Sapindaceae) ranked second with an IVI of 46.84%, followed by A. scholaris (Dipterocarpaceae) and P. macarthurii (Arecaceae) with an IVI of 37.79% and 37.57%, respectively.

3.3. Soil Characteristics

Table 5 shows the chemical properties of the soil at all six plots. Soils in all plots had acidic properties (with a maximum of 4.89 and a minimum of 4.41). Plot 1 had the highest pH value among all six followed by Plot 5, Plot 3, Plot 2 and Plot 6 which were 4.89, 4.67, 4.55, 4.54 and 4.46, respectively. The lowest PH value was at Plot 4 which was 4.41.
The total cation exchange capacity (CEC) varied from 2.87 to 5.35 (with a mean of 4.0) which was considered low. The maximum CEC value was in Plot 5 which was 5.35 cmol/kg, followed by Plot 1, Plot 2, Plot 6 and Plot 3 which were 4.80, 3.67, 3.66, and 3.62, respectively. The lowest value was at Plot 4 which was 2.87 cmol/kg.
The nutrient percentages, which were the carbon, nitrogen and phosphorus in all six plots were also described. The content of the total C ranged from 0.81% to 1.29% (with a mean of = 0.97%), while the total N contents varied from 0.07% to 0.09% (with a mean of = 0.07%). The extractable P in the soil ranged from 1.92 mg/kg to 2.32 mg/kg (with a mean of 2.22 mg/kg). The highest value for the extractable phosphorus was 2.32 µg/g in Plot 2, followed by 2.30 µg/g in Plot 3, 2.29 µg/g in Plot 5, 2.26 µg/g in Plot 6, and 2.24 µg/g in Plot 4, while the lowest value was in Plot 1 which was 1.92 µg/g. The total percentage of nitrogen was at the maximum in Plot 6 and the minimum value was found in Plot 4, which were 0.09% and 0.05%, respectively. The second highest percentage was 0.08% (Plot 2), followed by 0.07% (Plot 1), 0.06% (Plot 3) and 0.05% (Plot 4). The percentage of carbon was at the maximum in Plot 2 with the value of 1.29%. The minimum value was in Plot 4 which was 0.67%. The percentage increases in Plot 5, Plot 3, Plot 1 and Plot 6 were from 0.81%, 0.85%, 0.94% and 1.28%, respectively.
Table 6 shows the carbon: nitrogen ratio in all six plots in HRA. Plot 2 had the highest C:N ratio which was 16.13 or 129:8. The lowest C:N ratio was in Plot 4 which was 13.4 or 67:5. The second highest was Plot 6, followed by Plot 3, Plot 5 and Plot 1 at 14.22, 14.17, 13.5 and 13.43, respectively.
Table 7 shows the Pearson correlation analysis in all the variables that were collected in the soils in HRA, Putrajaya. The CEC showed a positive correlation with nitrogen (r = 0.041) but showed a negative correlation with C and P, with r = −0.057 and r = −0.359, respectively. C showed a positive correlation with both N and P with a value of r = 0.956 and r = 0.138, respectively. N showed a negative correlation with the available P (r = −0.008). The pH of the soil showed a positive correlation with both the CEC and N with r = 0.8 and r = 0.005, respectively; however, the pH showed a negative correlation with C (r = −0.087) and extractable P (r = −0.778).
Regarding the soil characteristics in relation with the plant communities in the different plots, we can state that the soil characteristics reported above showed that all the plant communities recorded in each of the six plots were established on acid soils in this tropical forest. In fact, the diversity of the plants belonging to a wide range of botanical families found their ecological preferendum on acid soil conditions.

3.4. Correlation between Dendrometric Parameters and Soil Chemical Properties of Plots

According to Figure 3 the projection of variables indicates that the first canonical variable was not correlated with any of the dendrometric variables; therefore, this dimension failed to show a correlation between the dendrometric parameters and soil chemical properties. Many of those variables, however, were correlated with dimensions 2 and 3 and this made it possible to easily interpret the correlation between the dendrometric parameters and soil chemical properties. Indeed, considering the variables’ projections on dimensions 2 and 3, dendrometric parameters such as the plant height, basal area, m2/ha and height positively correlated with the carbon and nitrogen ratio (C/N), and the total percentage of carbon and total percentage of nitrogen. Taken together, however, these variables were negatively correlated with the radius and CEC which were positively correlated.

4. Discussion

4.1. Floristic Composition

The most represented botanical family was Dipterocarpaceae with 26 individual trees belonging to 10 species and three genera. Dipterocarpaceae was the dominant family of this study, of which Dipterocarpaceae was also discovered to be the dominant family of other tropical forests in Malaysia [15,16]. Several studies have also concluded comparable observations, of which Dipterocarpaceae was the most abundant species family in their study areas [22], while the floristic composition also can been as similar in different forest structures [23]. A study in the Bangi Permanent Forest Reserve, for example, stated Euphorbiaceae as the largest family [34]. Equally importantly, a study in Ulu Muda forest reserve, also revealed the same result [18]. Moreover, it was reported that lowland dipterocarp forests are mostly dominated by the family Dipterocarpaceae [34]. A study at a forest park in Pahang, Peninsular Malaysia stated that Dipterocarpaceae dominated the areas with four genera and nine species, respectively [18]. The Anacardiacecae was the second highly dominant family in this study with 15 individual trees. Anacardiaceae was discovered to be the third most represented family with 197 individual trees that belonged to six species and four genera, in a study area at Sungai Udang forest reserve [15]. Additionally, it was stated in a study in Pasir Tengkorak Forest Reserve, Langkawi, Malaysia, that Anacardiaceae species were the most common and frequently found in that lowland forest [24]. The Salicaceae with 10 individual trees, was the third extremely important family in this study. According to the study of phylogeny and evolution of the angiosperms, the expanded Salicaceae nomenclatural, Salicaceae, includes the type Flacourtia; thus, Flacourtiaceae is now technically a synonym of Salicaceae [25]. Most of the tree studies fit into DBH Class three with 20 individuals and Class 7 with 19 individuals, proved that this study comprised of mostly medium-sized to large-diameter trees; thus, defining the characteristics of an intermediate-secondary succession forest in HRA. A seed bank of suitable plants in the soil made it possible for the secondary succession to occur much quicker than the primary succession. Previous organisms had substantially modified the fertility and structure of the soil making it more suitable for colonization and growth. This fact has been proved with the trees in HRA only taking 14 years to reach a majority of medium-sized to large-diameter trees. According to a research study in Bangi Permanent Forest Reserve, the presence of large trees such as K. excelsa (Fabaceae) and S. koetjape (Meliaceae) with a height ranging from 17 m to 24 m, which is tall enough to form an emergent canopy, indicates that HRA is on its way to reaching the status of a matured or climax forest [21]. Additionally, the number of individuals per species obtained has helped to show a significant difference from the initial species planted at the early establishment of HRA. This will also serve decision makers when seeking a better understanding on the sustainable management of the forest.

4.2. Soil Characteristics

The soil pH is determined by the concentration of hydrogen ions (H+). Here, the pH of all the soils sampled had acidic properties (max = 4.89; min = 4.46) with a mean of 4.69. Most Malaysian tropical rainforest showed an acidic soil in pH values between 3.5 and 5.5 [35,36]. The soil pH is influenced by both acid and base forming cations (i.e., positively-charged dissolved ions) in the soil. Precipitation exceeds evapotranspiration due to the long-term weathering in climates which has resulted in soil acidification [27,37]. Common acid-forming cations are hydrogen (H+), aluminium (Al3+), and iron (Fe2+ or Fe3+), whereas common base-forming cations include calcium (Ca2+), magnesium (Mg2+), potassium (K+) and sodium (Na+) [38]. There are several factors that can be taken into account in acidic soils, such as the parent materials with high elements such as silica, high levels of sand with buffering capacities which represents the ability to resist pH changes and precipitation. The undisturbed soils and the high organic matter content caused the low pH of the soil in this study [39]. H+ ions take up space on negative charges along the soil’s surface which later displaces nutrients, thus, the soil pH affects the nutrient availability [40]. The ability to acquire nutrients through solubilization, decomposition, and uptake is usually limited by a low pH. In addition, a low pH increases the recalcitrance of soil organic P to microbial mineralization and decreases P solubility [37]. The cation exchange capacity (CEC) is the total sum of exchangeable cations that can be adsorbed by the soil. The CEC is used as a measurement of fertility, the nutrient retention capacity and the capacity to protect the groundwater from cation contamination. The negative charge per unit mass of soil is indicated by the CEC and is measured as the total number of moles of charge (as Ca2+, Mg2+, Na+ and K+) [41,42]. Based on the CEC in all the plots, the highest value here was 5.35 cmol/kg and the minimum value of the CEC was 2.87 cmol/kg. This indicated that the soil had a medium nutrient status as it was less than 10 cmol/kg. The value may be determined by the percentage of organic matter present and the clay content in the soil. A higher amount of CEC increases the fertility of the soil as the cation can then move freely in the soil [39]. Based on a study, the cation and anion exchange capacities are influenced by the soil pH and soils that have a higher CEC are usually found in high amounts of clay and organic matter [38]. Based on Table 5, the total percentage of carbon had a mean of 0.97% with a maximum of 1.29% in Plot 2, and a minimum of 0.67% in Plot 4. There was less significant difference between the two plots as they were taken from a lowland rain forest. Plot 4 had the lowest value due to low organic matter and other contributing factors that may have decreased the percentage of C in the soil.
Most authors have concluded that an increase in elevation, increasing precipitation and decreasing temperature contribute to an increase in both nitrogen and carbon [43,44,45]. As there are many factors that might increase the C percentage in soil, we really did not know which one contributed the most in this study. These characteristics may have been from the type of vegetation available in the area, the climate and precipitation all year round and the soil clay content. Nitrogen (N), potassium, calcium, magnesium and sulphur are more available within a soil pH from 6.5 to 8 [38]. The highest percentage of nitrogen was 0.09% in Plot 6 and the lowest percentage was 0.05%, which was in Plot 4. There was not much difference between the highest and the lowest value, indicating the soil in HRA had almost the same percentage of nitrogen. Plot 6 had a high percentage of nitrogen due to the presence of humus content and heavy litter, and also because of a higher water holding capacity. Elsewhere, a study found a weak relationship between the total N and rainfall in the soils of Costa Rica [46]. These differences in the association between the average annual precipitation (AAP) and the total N were probably due to the influence of other environmental factors. The Pearson correlation for the nitrogen percentage had a negative value with extractable phosphorus (r = −0.009). The negative value showed that the extractable P decreased as the percentage of nitrogen increased. A regression showed as very low or almost 0 and this revealed that the model had 0 variability of the response data around its mean. The carbon-to-nitrogen ratio was determined to know whether the nitrogen was mineralized or immobilized. The immobilization and mineralization are the primary microbial processes involved in humus cycling and for fresh residue in soils. These reactions, combined with other physical, chemical and environmental factors, are important in organic matter stability and in plant nutrient availability. Organically complexed ions in the residue may be converted from organic to inorganic forms of the particular nutrient (i.e., N, S, and P) or mineralized in degraded humus. The immobilization of inorganic ions in microbial tissue will occur if the residue has insufficient nutrients to meet the microbial demand [47]. The optimum C:N ratio in tropical rainforest is 25–31:1. All the C:N ratio in the plots were below 30:1 and this indicates that the soil had a low carbon content compared to nitrogen. As a result, the microbial population may take N in mineral form and later will be immobilized, resulting in low nitrogen for the plants [48]. Woodchips, sawdust and other high-nitrogen matter may be used to increase the overall ratio. A synthesis of datasets on the litter fall and nutrients in leaves concluded that phosphorus is most available within a soil pH from 5.5 to 7.5. In the results in Table 5, the lowest extractable phosphorus was in Plot 1 which was 1.92 mg/kg. Soil biological processes may be limited by low phosphorus levels [49], while soil acidification induces deficiencies of nutrients, phosphorus (P), and bases, as well as aluminium (Al) toxicity. Previous studies have proved that a soil’s available P is determined by several environmental factors, including the meteorization rate of rocks, the type of clay mineral, the retention of oxides of Fe and Al, the pH, texture, OM content, microorganism activity and lixiviation [50]. A pH of lower than 7.2 has H2PO4− > HPO4−2 [51]. The plant uptake in HPO4−2 is much slower than in H2PO4−. Elsewhere, inconsistent relationships between a low soil fertility and a high biomass productivity have been found for several tropical forest ecosystems [52,53], because soil acidification and nutrient loss are increasing due to large amounts of precipitation through weathering and leaching [37,54]. A specific enzyme secreted by white-rot fungi can exhibit low pH optima compared to other enzymes. This also accounts for the success and adaptation of Dipterocarpaceae in Southeast Asia [37]. The results of the soil nutrients found in HRA shows that Dipterocarpaceae was the most dominant family with the most abundant individuals in all the plots, which was 23 individuals (23.6%). It was represented by 10 species from two genera which were Hopea sp. (Hopea helferi Brandis, Hopea nervosa King and Hopea nutans Ridl.), and Shorea sp. (Shorea assamica subsp. globifera (Ridl.) Y.K. Yang and J.K. Wu, Shorea foxworthyi Symington, Shorea laevis Ridl., Shorea macrophylla (de Vriese) P.S.Ashton, Shorea parvifolia Dyer and Shorea rubra P.S.Ashton. Since the study area was a secondary forest, some of the trees were planted, and there is currently high interest, throughout Southeast Asia, in establishing plantations of indigenous species especially Dipterocarps, the well-known commercial timber species in Malaysia. The dominance of the Dipterocarpaceae family may be due to their life cycle which includes a fast-growing lifestyle [52,55], mast fruiting [56,57], wind-dispersed winged fruits [58,59] and symbiotic ectomycorrhizal associations [60]. The second largest family found in the study area was the family Anacardiaceae which consisted of M. odorata (16.1%). A study undertaken showed that Anacardiaceae are commonly found in lowland tropical forests [15]. This family thrives in a well-drained soil with a pH that ranges from 5.5 to 7.5. The pH of the soil in HRA was below 5.5 but the trees still managed to grow there.
In the present context of climate change and regarding the habitat alteration risk coupled with the evidence that humanity is losing forests at a rate of 10 millions hectares per year (www.panda.org accessed on 26 November 2022), this study should serve as a decision-making tool for the sustainable management of the forest in favor of indigenous people for folk uses, scientists for various investigations, students for environmental education and tourists for recreation.
The present study revealed that dendrometric parameters such as the plant height, basal area, m2/ha and height are positively correlated with the carbon and nitrogen ratio (C/N), and the total percentage of carbon and total percentage of nitrogen. Similar to our results, Berrill and O’Hara [61] reported that redwood height growth was related to some biophysical variables of the soil. This finding allows the authors to assert that as far as these chemical parameters will be improved in the study area soil in a moderate proportion, this will boost the dendrometric characteristics of the individuals of plant species. Consequently, the conservation of this forest is highly required and will no doubt lead to its soil conservation; thus, such chemical properties will be naturally improved. In fact, Livesley et al. [62] reported that the soil properties in tree canopy areas have increased over time, and they argued that the soil carbon/nitrogen have increased with increasing vegetation. Further studies on the soil properties in relation with the floristic characteristics of the study area are suggested in the present paper to provide more scientific knowledge that will better serve the decision-making process.

5. Conclusions

This study revealed that the botanical family, Dipterocarpaceae, exhibited the highest abundance in the study area, followed by Anacardiaceae and Salicaceae. Dipterocarpaceae is dominant among other families in the study area with a high number of species recorded, and it is also the most common family found in the lowland tropical rainforests. Thus, the primary objective of HRA, Putrajaya, have been achieved, which was to establish a forest with a lowland dipterocarp concept. In terms of the species importance, M. odorata showed the highest species richness followed by P. pinnata and A. scholaris. A high abundance and the environmental conditions allowed them to grow and survive in a healthy condition. It was found that HRA, Purajaya had an overall acidic soil. The cation exchange capacity in the plots had a medium nutrient status. Moreover, the total percentage for both carbon and nitrogen was more or less the same in all plots. The carbon-to-nitrogen ratio mean value was 14.14, while the extractable phosphorus in HRA, Putrajaya showed normal values in regard to tropical rainforests, which have a low phosphorus content. The pH of the soils in HRA Putrajaya had a positive correlation with CEC and with nitrogen but the value was low. However, the correlation that was negative with C and P. The CEC had a relatively low correlation with C, N and P. Carbon had a very high correlation with N but was low with P. Meanwhile, nitrogen had a very negatively-low correlation with P. The tree composition and distribution might also be affected by other environmental factors, for instance, the altitude, abiotic factors, topography and elevations, and the soil’s physical and chemical properties which can be investigated in further studies. Further studies should be undertaken with more nutrients covered in HRA as these will contribute to an increase in the vegetation in the park. A study concerning the vegetation and the physical properties of the soil should also be correlated with chemical properties as they are interrelated with each other.

Author Contributions

Conceptualization, N.I.; Data curation, S.A.R., S.N.H. and S.W.; Formal analysis, S.A.R., R.A., S.N.H., B.A. and S.W.; Investigation, N.I.; Methodology, S.A.R. and H.O.D.-Y.; Project administration, H.O.D.-Y.; Resources, A.K. and A.R.; Software, I.U., M.N.K., S.N.H., B.A. and A.R.; Supervision, S.A.R.; Validation, M.N.K. and A.K.; Visualization, R.A., I.U., R.A.M. and M.A.E.-S.; Writing—original draft, N.I.; Writing—review and editing, S.A.R., R.A., M.N.K., A.K., H.O.D.-Y., B.A., S.W., A.R., I.U., R.A.M. and M.A.E.-S.; Funding Acquisition: R.A.M. and M.A.E.-S. All authors have read and agreed to the published version of the manuscript.

Funding

This research received financial assistance from Researchers Supporting Project (The Universiti Malaya-RP004B/13SUS).

Data Availability Statement

Not applicable.

Acknowledgments

The authors would like to extend their sincere appreciation to the Researchers Supporting Project Number (RSP2023R182) at King Saud University, Riyadh, Saudi Arabia.

Conflicts of Interest

All authors declare no conflict of interest.

References

  1. Khan, M.N.; Badshah, L. Floristic diversity and utility of flora of district Charsadda, Khyber Pakhtunkhwa. Acta Ecol. Sin. 2019, 39, 306–320. [Google Scholar]
  2. Khan, M.N.; Ali, S.; Razak, S.A.; Zaman, A.; Iqbal, M.; Shah, S.N. Assessment of floristic diversity in the mountain ecosystem of Marghazar Valley, Hindukush Range, Swat, Pakistan. Biodivers. J. Biol. Divers. 2022, 23, 1000–1013. [Google Scholar]
  3. Ibrahim, M.; Khan, M.; Ali, S.; Razzaq, A.; Zaman, A.; Iqbal, M.; Jan, F. Floristic composition and species diversity of plant resources of rural area “Takht Bhai” district Mardan, Khyber Pakhtunkhwa, Pakistan. Med. Aromat. Plants 2019, 8, 2167-0412. [Google Scholar]
  4. Khan, M.N.; Ali, S.; Yaseen, T.; Ullah, S.; Zaman, A.; Iqbal, M.; Shah, S. Eco-Taxonomic Study of Family Poaceae (Gramineae). RADS J. Biol. Res. Appl. Sci. 2019, 10, 63–75. [Google Scholar]
  5. Dossou-Yovo, E.R.; Devkota, K.P.; Akpoti, K.; Danvi, A.; Duku, C.; Zwart, S.J. Thirty years of water management research for rice in sub-Saharan Africa: Achievement and perspectives. Field Crops Res. 2022, 283, 108548. [Google Scholar]
  6. Dossou-Yovo, H.O.; Vodouhè, F.G.; Kaplan, A.; Sinsin, B. Application of ethnobotanical indices in the utilization of five medicinal herbaceous plant species in Benin, West Africa. Diversity 2022, 14, 612. [Google Scholar]
  7. Karam, D.S.; Arifin, A.; Radziah, O.; Shamshuddin, J.; Hazandy, A.-H.; Majid, N.M.; Mohanaselvi, P.; Nor, H. Assessing soil biological properties of natural and planted forests in the Malaysian tropical lowland dipterocarp forest. Am. J. Appl. Sci. 2011, 8, 854–859. [Google Scholar]
  8. Nesha, M.K.; Herold, M.; De Sy, V.; Duchelle, A.E.; Martius, C.; Branthomme, A.; Garzuglia, M.; Jonsson, O.; Pekkarinen, A. An assessment of data sources, data quality and changes in national forest monitoring capacities in the Global Forest Resources Assessment 2005–2020. Environ. Res. Lett. 2021, 16, 054029. [Google Scholar]
  9. Saiful, I.; Latiff, A. Effects of selective logging on tree species composition, richness and diversity in a hill dipterocarp forest in Malaysia. J. Trop. For. Sci. 2014, 26, 188–202. [Google Scholar]
  10. Krishnapillay, D.B.; Razak, M.A.; Appanah, S. Forest rehabilitation–the malaysian experience. Keep Asia Green 2007, 1, 85–123. [Google Scholar]
  11. Suratman, M.N. Tree species diversity and forest stand structure of Pahang National Park, Malaysia. Biodivers. Enrich. Divers. World 2012, 19, 45–56. [Google Scholar]
  12. Tan, K.H. Soil Sampling, Preparation, and Analysis; CRC press: Boca Raton, FL, USA, 1995. [Google Scholar]
  13. Mexia, T.; Vieira, J.; Príncipe, A.; Anjos, A.; Silva, P.; Lopes, N.; Freitas, C.; Santos-Reis, M.; Correia, O.; Branquinho, C. Ecosystem services: Urban parks under a magnifying glass. Environ. Res. 2018, 160, 469–478. [Google Scholar]
  14. Curtis, J.T. The Vegetation of Wisconsin: An Ordination of Plant Communities; University of Wisconsin Press: Madison, WI, USA, 1959. [Google Scholar]
  15. Sarah, A. A Phytosociological Study of Aquilaria Malaccensis Lamk. and Its Communities at Sungai Udang Forest Reserve. Ph.D. Thesis, University of Malaya, Kuala Lumpur, Malaysia, 2016. [Google Scholar]
  16. Millet, J.; Pascal, J.; Kiet, L. Effects of disturbance over 60 years on a lowland forest in southern Vietnam. J. Trop. For. Sci. 2010, 22, 237–246. [Google Scholar]
  17. Sato, H. Simulation of the vegetation structure and function in a Malaysian tropical rain forest using the individual-based dynamic vegetation model SEIB-DGVM. For. Ecol. Manag. 2009, 257, 2277–2286. [Google Scholar]
  18. di Pahang, R. Floristic variation of tree communities in two distinct habitats within a forest park in Pahang, Peninsular Malaysia. Sains Malays. 2012, 41, 1–10. [Google Scholar]
  19. Wang, P.-C.; Xu, Y.-R.; Zhou, Z.-X. Influence of anthropogenic disturbances on understory plant diversity of urban forests in Wuhan, Central China. Sains Malays. 2012, 41, 1495–1501. [Google Scholar]
  20. di Negeri Sembilan, R. Association of liana communities with their soil properties in a lowland forest of Negeri Sembilan, Peninsular Malaysia. Sains Malays. 2012, 41, 679–690. [Google Scholar]
  21. Norbaiah, M.; Nazre, M.; Kamziah, A.K.; Nur, N.M.I. Tree health status of mixed species in urban forest of Taman Rimba Alam, Putrajaya, Malaysia. Malays. Appl. Biol. J. 2017, 46, 91–101. [Google Scholar]
  22. Tans, S.J.; Verschueren, A.R.; Dekker, C. Room-temperature transistor based on a single carbon nanotube. Nature 1998, 393, 49–52. [Google Scholar]
  23. Husch, B.; Beers, T.W.; Kershaw, J.A., Jr. Forest Mensuration; John Wiley & Sons: Hoboken, NJ, USA, 2002. [Google Scholar]
  24. Hayat, M.A.; Abd Kudus, K. Assessment of plant species diversity at pasir tengkorak forest reserve, Langkawi Island, Malaysia. J. Agric. Sci. 2010, 2, 31. [Google Scholar]
  25. Soltis, D.; Soltis, P.; Endress, P.; Chase, M.W.; Manchester, S.; Judd, W.; Majure, L.; Mavrodiev, E. Phylogeny and Evolution of the Angiosperms: Revised and Updated Edition; University of Chicago Press: Chicago, IL, USA, 2018. [Google Scholar]
  26. Othman, Y.; Shamshuddin, J. Sains Tanah; Dewan Bahasa dan Pustaka, Kuala Lumpur: Kuala Lumpur, Malaysia, 1982. [Google Scholar]
  27. Hallbäcken, L.; Tamm, C.O. Changes in soil acidity from 1927 to 1982–1984 in a forest area of south-west Sweden. Scand. J. For. Res. 1986, 1, 219–232. [Google Scholar]
  28. McLean, E. Soil pH and lime requirement. In Methods of Soil Analysis: Part 2 Chemical and Microbiological Properties; American Society of Agronomy, Inc.: Madison, WI, USA, 1983; Volume 9, pp. 199–224. Available online: https://acsess.onlinelibrary.wiley.com/doi/book/10.2134/agronmonogr9.2.2ed (accessed on 26 November 2022).
  29. Thomas, G.W. Soil pH and soil acidity. In Methods of Soil Analysis: Part 3 Chemical Methods; ASA-SSSA: Madison, WI, USA, 1996; Volume 5, pp. 475–490. [Google Scholar]
  30. Bremner, J. Organic nitrogen in soils. Soil Nitrogen 1965, 10, 93–149. [Google Scholar]
  31. Team, R. RStudio: Integrated Development for R; RStudio, Inc.: Boston, MA, USA, 2015; Volume 42, p. 84. Available online: http://www.rstudio.com (accessed on 26 November 2022).
  32. Team, R.C. R: A Language and Environment for Statistical Computing; R Foundation for Statistical Computing: Vienna, Austria, 2013; Available online: http://www.R-project.org/ (accessed on 26 November 2022).
  33. González, I.; Déjean, S. Package CCA: Canonical Correlation Analysis. Available online: https://cran.r-project.org/web/packages/CCA/index.html (accessed on 26 November 2022).
  34. Lajuni, J.; Latiff, A. Biomass and floristic composition of Bangi Permanent Forest Reserve, a twice-logged lowland dipterocarp forest in Peninsular Malaysia. Sains Malays. 2013, 42, 1517–1521. [Google Scholar]
  35. Khairil, M.; Juliana, W.W.; Nizam, M. Edaphic influences on tree species composition and community structure in a tropical watershed forest in Peninsular Malaysia. J. Trop. For. Sci. 2014, 26, 284–294. [Google Scholar]
  36. Nizam, M.; Norziana, J.; Sahibin, A.; Latiff, A. Edaphic relationships among tree species in the National Park at Merapoh, Pahang, Malaysia. J. Biosci. 2006, 17, 37–53. [Google Scholar]
  37. Fujii, K. Soil acidification and adaptations of plants and microorganisms in Bornean tropical forests. Ecol. Res. 2014, 29, 371–381. [Google Scholar]
  38. McCauley, A.; Jones, C.; Jacobsen, J. Soil pH and organic matter. Nutr. Manag. Modul. 2009, 8, 1–12. [Google Scholar]
  39. Aprile, F.; Lorandi, R. Evaluation of cation exchange capacity (CEC) in tropical soils using four different analytical methods. J. Agric. Sci. 2012, 4, 278. [Google Scholar]
  40. Barber, S.A. Soil Nutrient Bioavailability: A Mechanistic Approach; John Wiley & Sons: Hoboken, NJ, USA, 1995. [Google Scholar]
  41. Heil, D.; Sposito, G. Chemical attributes and processes affecting soil quality. In Developments in Soil Science; Elsevier: Amsterdam, The Netherlands, 1997; Volume 25, pp. 59–79. [Google Scholar]
  42. Hartemink, A.E. Soil Analysis-An Interpretation Manual-KI Peverill, LA Sparrow & DJ Reuter (Eds.). CSIRO Publishing, Collingwood, Vic, 369 pp., 1999. Hardback. ISBN 0 643 06376 5 (A $94.95). Catena 2000, 39, 301–303. [Google Scholar]
  43. Kong, J.; He, Z.; Chen, L.; Yang, R.; Du, J.; Lin, P.; Zhu, X.; Tian, Q. Elevational gradients and distributions of aggregate associated organic carbon and nitrogen and stability in alpine forest ecosystems. Soil Sci. Soc. Am. J. 2020, 84, 1971–1982. [Google Scholar]
  44. Marrs, R.; Proctor, J.; Heaney, A.; Mountford, M. Changes in soil nitrogen-mineralization and nitrification along an altitudinal transect in tropical rain forest in Costa Rica. J. Ecol. 1988, 76, 466–482. [Google Scholar]
  45. Spain, A.V. Influence of environmental conditions and some soil chemical properties on the carbon and nitrogen contents of some tropical Australian rainforest soils. Soil Res. 1990, 28, 825–839. [Google Scholar]
  46. Alvarez-Clare, S.; Mack, M.C. Influence of precipitation on soil and foliar nutrients across nine Costa Rican forests. Biotropica 2011, 43, 433–441. [Google Scholar]
  47. Adnan, M.; Fahad, S.; Saleem, M.H.; Ali, B.; Mussart, M.; Ullah, R.; Arif, M.; Ahmad, M.; Shah, W.A.; Romman, M. Comparative efficacy of phosphorous supplements with phosphate solubilizing bacteria for optimizing wheat yield in calcareous soils. Sci. Rep. 2022, 12, 11997. [Google Scholar]
  48. Ali, B.; Hafeez, A.; Javed, M.A.; Afridi, M.S.; Abbasi, H.A.; Qayyum, A.; Batool, T.; Ullah, A.; Marc, R.A.; Al Jaouni, S.K. Role of endophytic bacteria in salinity stress amelioration by physiological and molecular mechanisms of defense: A comprehensive review. S. Afr. J. Bot. 2022, 151, 33–46. [Google Scholar]
  49. Ahmad, M.; Ishaq, M.; Shah, W.A.; Adnan, M.; Fahad, S.; Saleem, M.H.; Khan, F.U.; Mussarat, M.; Khan, S.; Ali, B. Managing phosphorus availability from organic and inorganic sources for optimum wheat production in calcareous soils. Sustainability 2022, 14, 7669. [Google Scholar]
  50. Schlesinger, W.H.; Bernhardt, E.S. Biogeochemistry: An Analysis of Global Change; Academic Press: Cambridge, MA, USA, 2013. [Google Scholar]
  51. Havlin, J.L.; Tisdale, S.L.; Nelson, W.L.; Beaton, J.D. Soil Fertility and Fertilizers; Pearson Education India: Chennai, India, 2016. [Google Scholar]
  52. Fahad, S.; Chavan, S.B.; Chichaghare, A.R.; Uthappa, A.R.; Kumar, M.; Kakade, V.; Pradhan, A.; Jinger, D.; Rawale, G.; Yadav, D.K. Agroforestry Systems for Soil Health Improvement and Maintenance. Sustainability 2022, 14, 14877. [Google Scholar]
  53. Terborgh, J. Diversity and the Tropical Rain Forest; Scientific American Library: Newyork, NY, USA, 1992. [Google Scholar]
  54. Afridi, M.; Javed, M.; Ali, S.; De Medeiros, F.; Ali, B.; Salam, A.; Sumaira; Marc, R.A.; Alkhalifah, D.H.M.; Selim, S.; et al. New opportunities in plant microbiome engineering for increasing agricultural sustainability under stressful conditions. Front. Plant Sci. 2022, 13, 899464. [Google Scholar]
  55. Banin, L.; Lewis, S.L.; Lopez-Gonzalez, G.; Baker, T.R.; Quesada, C.A.; Chao, K.J.; Burslem, D.F.; Nilus, R.; Abu Salim, K.; Keeling, H.C. Tropical forest wood production: A cross-continental comparison. J. Ecol. 2014, 102, 1025–1037. [Google Scholar]
  56. Ashton, P.S. Dipterocarp biology as a window to the understanding of tropical forest structure. Annu. Rev. Ecol. Syst. 1988, 19, 347–370. [Google Scholar]
  57. Numata, S.; Yasuda, M.; Suzuki, R.O.; Hosaka, T.; Noor, N.S.M.; Fletcher, C.D.; Hashim, M. Geographical pattern and environmental correlates of regional-scale general flowering in Peninsular Malaysia. PLoS ONE 2013, 8, e79095. [Google Scholar]
  58. Suzuki, E.; Ashton, P.S. Sepal and nut size ratio of fruits of Asian Dipterocarpaceae and its implications for dispersal. J. Trop. Ecol. 1996, 12, 853–870. [Google Scholar]
  59. Smith, J.R.; Bagchi, R.; Ellens, J.; Kettle, C.J.; Burslem, D.F.; Maycock, C.R.; Khoo, E.; Ghazoul, J. Predicting dispersal of auto-gyrating fruit in tropical trees: A case study from the D ipterocarpaceae. Ecol. Evol. 2015, 5, 1794–1801. [Google Scholar] [PubMed] [Green Version]
  60. Brearley, F.Q. Ectomycorrhizal associations of the Dipterocarpaceae. Biotropica 2012, 44, 637–648. [Google Scholar]
  61. Berrill, J.-P.; O’Hara, K.L. How do biophysical factors contribute to height and basal area development in a mixed multiaged coast redwood stand? Forestry 2016, 89, 170–181. [Google Scholar]
  62. Livesley, S.; Ossola, A.; Threlfall, C.; Hahs, A.; Williams, N. Soil carbon and carbon/nitrogen ratio change under tree canopy, tall grass, and turf grass areas of urban green space. J. Environ. Qual. 2016, 45, 215–223. [Google Scholar]
Figure 1. Map of HRA forest coverage in green. This image was generated from Google Earth.
Forests 14 00306 g001
Figure 2. The location of Zone 6 and Zone 14 in HRA. This image was generated from Google Earth.
Forests 14 00306 g002
Figure 3. Variables representation on the canonical correlation variates of (a) dimensions 1 and 2 and (b) dimensions 2 and 3.
Forests 14 00306 g003
Table 1. Number of genera and species for all families present in all 6 plots.
Number.FamilyNumber
of Genera
Number
of Species
Number
of Individuals
1.Achariaceae123
2.Anacardiaceae1215
3.Arecaceae114
4.Dipterocarpaceae31026
5.Fabaceae225
6.Lauraceae114
7.Meliaceae226
8.Moraceae123
9.Phyllanthaceae119
10.Salicaceae1310
11.Sapindaceae118
Total152793
Table 2. DBH distribution of this study area in Hutan Rimba Alam.
DBHNumber of Trees
C-1: 05.00–14.90 cm6
C-2: 15.00–24.90 cm13
C-3: 25.00–34.90 cm20
C-4: 35.00–44.90 cm15
C-5: 45.00–54.90 cm12
C-6: 55.00–64.90 cm8
C-7: Above 65.00 cm19
Table 3. List of indigenous species found at all 6 plots in the study area.
FamilySpeciesNumber of IndividualsRelative Density (%)Frequency
(%)
AchariaceaeHydnocarpus castanea Hook. f. and Thoms.22.217
AchariaceaeHydnocarpus scortechinii King.11.117
AnacardiaceaeMangifera indica L.11.117
AnacardiaceaeMangifera odorata Griff.1415.133
ApocynaceaeAlstonia scholaris (L.) R.Br.44.333
ArecaceaePtychosperma macarthurii H.Wendl. ex H.J.Veitch) H.Wendl. ex Hook.f.44.333
DipterocarpaceaeHopea helferi Brandis.33.217
DipterocarpaceaeHopea nervosa King.22.217
DipterocarpaceaeHopea nutans Ridl.44.317
DipterocarpaceaeHopea sp.11.117
DipterocarpaceaeShorea assamica subsp. globifera (Ridl.) Syme11.117
DipterocarpaceaeShorea foxworthyi Symington.55.417
DipterocarpaceaeShorea laevis Ridl.22.217
DipterocarpaceaeShorea macrophylla (de Vriese) P.S.Ashton11.117
DipterocarpaceaeShorea rubra P.S.Ashton33.217
FabaceaeKoompassia excelsa (Becc.) Taub.33.217
FabaceaePongamia pinnata (L.) Pierre22.217
LauraceaeActinodaphne macrophylla (Blume) Nees44.317
MeliaceaeAglaia korthalsii Miq. Pellegr.33.217
MeliaceaeSandoricum koetjape (Burm.f.) Merr.33.217
MoraceaeFicus benjamina L.22.217
MoraceaeFicus microcarpa L.f.11.117
PhyllanthaceaeBaccaurea motleyana (Müll.Arg.) Müll.Arg.99.717
SalicaceaeFlacourtia indica (Burm.f.) Merr.55.417
SalicaceaeFlacourtia inermis Roxb.11.117
SalicaceaeFlacourtia jangomas (Lour.) Raeusch.44.317
SapindaceaePometia pinnata J.R.Forst. and G.Forst.88.633
T
Table 4. The ten leading important species at the HRA, Putrajaya study area in descending order of their important value index (IVI).
SpeciesIVi (%)
Mangifera odorata Griff.68.8
Pometia pinnata J.R.Forst. and G.Forst.46.84
Alstonia scholaris (L.) R.Br.37.79
Ptychosperma macarthurii H.Wendl. ex H.J.Veitch) H.Wendl. ex Hook.f.37.57
Sandoricum koetjape (Burm.f.) Merr.35.01
Baccaurea motleyana (Müll.Arg.) Müll.Arg.33.95
Koompassia excelsa (Becc.) Taub.28.06
Pongamia pinnata (L.) Pierre26.54
Actinodaphne macrophylla (Blume) Nees25.67
Shorea foxworthyi Symington25.45
Table 5. Chemical properties of all 6 plots in HRA, Putrajaya.
PlotpHCECTotal (%)Extractable (mg/kg)
(cmol/kg)CNP
Plot 14.894.800.940.071.92
Plot 24.543.671.290.082.32
Plot 34.553.620.850.062.30
Plot 44.412.870.670.052.24
Plot 54.675.350.810.062.29
Plot 64.463.661.280.092.26
Mean4.694.00.970.072.22
Min4.412.870.810.051.92
Max4.894.801.290.092.32
Table 6. Table of carbon: nitrogen ratio in all plots.
PlotTotal Percentage (%)C/N Ratio
CN
10.940.0713.43
21.290.0816.13
30.850.0614.17
40.670.0513.40
50.810.0613.5
61.280.0914.22
Table 7. The correlation of soil chemical properties in HRA, Putrajaya.
pHCECCN
CEC0.8
C−0.087−0.057
N0.0050.0410.956 **
P−0.778−0.3590.138−0.008
** Correlation is significant at the 0.01 level (2-tailed).
Disclaimer/Publisher’s Note: The statements, opinions and data contained in all publications are solely those of the individual author(s) and contributor(s) and not of MDPI and/or the editor(s). MDPI and/or the editor(s) disclaim responsibility for any injury to people or property resulting from any ideas, methods, instructions or products referred to in the content.

