Article

Operational Analysis of Grapple Yarding in New Zealand: A Case Study of Three Mechanized Harvesting Operations

1
New Zealand School of Forestry, University of Canterbury, Christchurch 8140, New Zealand
2
Department of Forestry, Fire, and Rangeland Management, Cal Poly Humboldt, Arcata, CA 95521, USA
3
Department of Agricultural and Bioresources Engineering, University of Nigeria, Nsukka, Enugu 410001, Nigeria
4
Department of Systems Process Engineering, Leibniz Institute for Agricultural Engineering and Bioeconomy (ATB), 14469 Potsdam, Brandenburg, Germany
*
Author to whom correspondence should be addressed.
Forests 2023, 14(2), 190; https://doi.org/10.3390/f14020190
Submission received: 13 December 2022 / Revised: 12 January 2023 / Accepted: 16 January 2023 / Published: 18 January 2023
(This article belongs to the Section Forest Operations and Engineering)

Abstract

:
The New Zealand forest industry has increased its use of swing yarders when harvesting on steep slopes. Swing yarders can more readily operate with grapple carriages, both mechanical and motorized, in comparison to tower yarders. Especially when coupled with mechanized felling, grapple yarding has led to improved productivity and safety. The effective use of grapple yarding is dependent on the level of knowledge of the working capability of the machines. This productivity study analyzed the operational capability of grapple yarding at three different harvest sites in North Island, New Zealand. The swing yarders were the T-Mar 650, T-Mar 550, and Madill 124 models. Parameters including average piece size, extraction distance, turn volume and the number of pieces were recorded for each cycle, as well as the level of bunching, with a minimum of 125 cycles, were measured at each site. The average delay-free cycle time for the three sites ranged between 2.8 and 3.7 min, which is very fast compared to yarder operations using chokers. Productivity ranged from 50 to 55 tons per productive machine hour. Extraction distance, piece size and stem presentations significantly influenced productivity. Stem presentation, especially bunching, across the cutover influenced the mean payload per yarding cycle resulting in higher productivity. In addition to providing productivity capability information at three case study sites, the analyses linked stand and terrain parameters such as tree size and extraction distance with production variability. Managing variability is critical to achieving consistently higher rates of production efficiency.

1. Introduction

Cable logging (also called cable yarding) remains a widely used extraction option for timber harvesting in New Zealand. There are over 310 yarders in full-time operation [1], extracting close to 35% of all timber harvested annually [2]. Yarders can be categorized based on characteristics such as carrier type, tower height, number of drums, rigging system capability and power rating [3]. However, a common basic differentiation is between tower and swing yarders based on their degree of mobility. The swing feature of swing yarders allows them to place timber on the landing or roadside beside the yarder once extracted, as well as have some movement of the carriage to facilitate grappling stems in the cutover [4]. Swing yarders have traditionally also been fitted with features such as interlock and higher linespeed to optimize the use of running skyline systems [5]. In addition, they can be relatively moved from the roadside or landing to another as they are built on track or rubber-tired carriers. Tower yarders, on the other hand, are designed to be anchored to a fixed location during operation. Harvesting of operation is carried out by moving the tailhold from one yarding location to another [6]. This results in a fan-shaped pattern across the cutblock towers are usually taller than swing yarders and result in less soil disturbance during the course of the operation. However, they are associated with higher labor and operational cost compared to swing yarders.
Many models of swing yarders were specifically designed to be used with mechanical-type grapple carriages. Initially, all yarders working in New Zealand were tower yarders [7]. As recently as 2012 tower yarders were still the preferred cable logging option, accounting for 60% of all yarders operating [8], and the majority operated with rigging configurations requiring choker-setters [9]. In the most recent 2018 yarder survey, in just a short time period of less than a decade, older tower yarders have been retired out of service, and new (or used import) machines have been almost exclusively swing yarders. Swing yarders are now 36% of the overall yarder workforce and the majority of crews have access to either a mechanical or motorized carriage [1].
The competitiveness of the New Zealand forest industry in international log markets is dependent on improvements in terms of harvesting productivity and cost. Particularly in steep terrain that limits the use of conventional ground-based machines, the potential exists for widespread use of the more mechanized swing yarders. Cable yarding operations are more expensive than ground-based extraction systems and hence there is a strong focus on increasing productivity [10,11]. With steep terrain harvesting being a major factor in the profitability of the forest industry [12], cable yarding in New Zealand is now experiencing a change in preference from the older North-American style tower yarders to smaller, more versatile grapple-capable swing yarders. This has largely been driven by improved mechanization of swing yarders, which when coupled with mechanized felling has improved both the safety, productivity and capability of swing yarders to operate grapples more efficiently than tower yarders [12,13]. In addition, they have the ability to operate on smaller landings or on roadsides with the potential for increased cost-effectiveness [11].
There is also an increase in tower yarder operations that use modern motorized grapple carriages for both safety and productivity reasons [14]. The use of mechanized felling is advantageous not only for safety but for yarders employing grapple carriages. It can significantly increase productivity [13,15]. This transformation of cable logging crews to become fully mechanized has continued to increase. Fully mechanized cable logging operations refers to mechanized felling, grapple yarding and mechanized processing on the landing. While the present number of mechanized yarding is not known, it is estimated that fully mechanized cable logging operations in New Zealand could be about 60% of all yarding operations [16].
A swing yarder alone will typically cost about USD$1250 per day to operate [17]. To effectively plan for and deploy swing yarders, forest managers and yarder owners need sufficient knowledge of the machine cycle times, payload capacity and the type of terrain and systems they are best suited to [10]. The objective of this study is to analyze the operational capability of swing yarders in New Zealand under common operating conditions using three case studies of common makes and models. While studies on the operational productivity of yarders are limited in the literature, this study represents the first attempt at comparing the operational performance of different models of swing yarder.

2. Materials and Methods

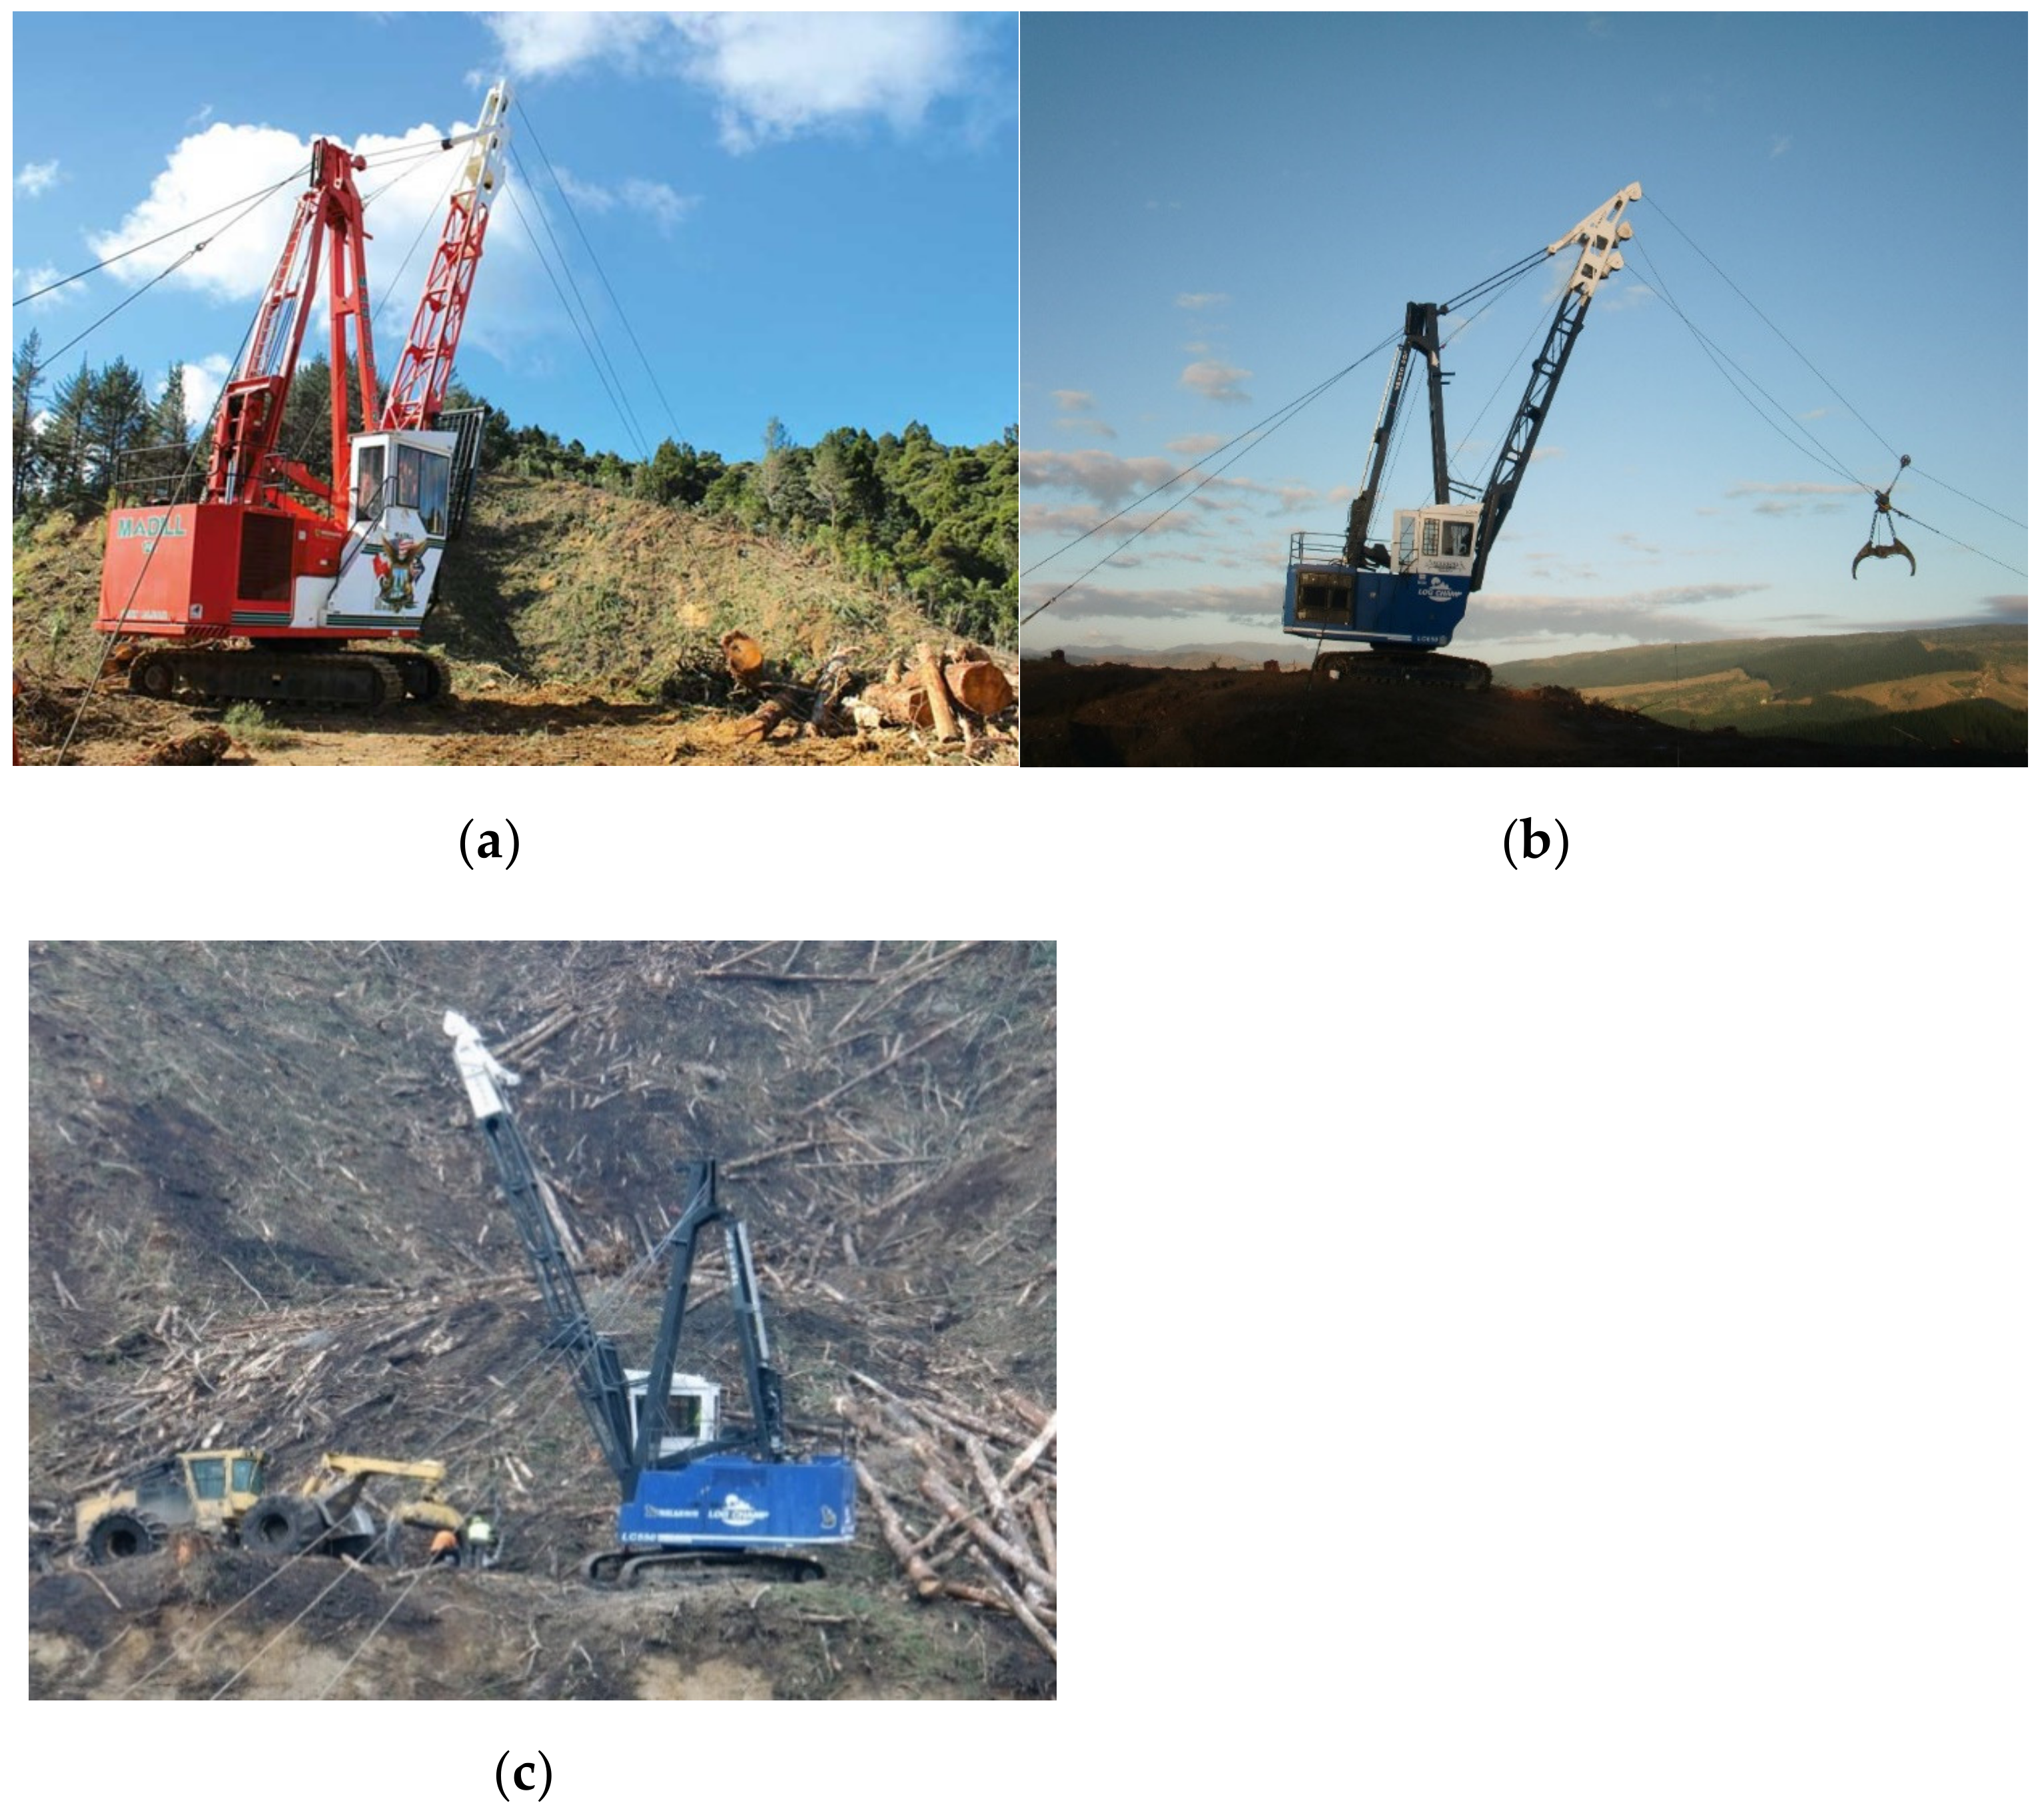
2.1. Description of Swing Yarders and Study Sites

Three case studies were carried out to provide information on the operational performance of swing yarders. The study locations were chosen with the support of industry contacts to reflect ongoing operations with an experienced crew in good operational stand and terrain conditions. Each site employed a clearcut silvicultural prescription of Pinus radiata. However, at each site, the harvest system, stand, and terrain were different; no attempt is made to provide a comparison between the make or model of the machines and the locations are simply named Case Study 1 to 3 (CS-1, CS-2 and CS-3).
CS-1: a Madill 124 (Madill Equipment, Sidney, BC, Canada) working in the Pouto Topu Forest, Northland. The harvest setting had good deflection, and the average piece size was 1.85 tons. All the trees were mechanically felled, either laid out individually or bunched and extracted uphill.
CS-2: a T-Mar “Log Champ” 650 (T-Mar Industries Ltd., Campbell River, BC, Canada) working in the Rukumoana Forest, Hawke’s Bay. The site had good deflection, the average tree size was 1.73 tons, and the trees were extracted uphill. The landing was effectively on the edge of a bluff, and hence the stems often needed to be swung 90 degrees and landed next to the yarder to avoid them sliding back down the chute. All the trees were either mechanically felled and laid out individually or bunched for ease of pick-up,
CS-3: a T-Mar “Log Champ” 550 (T-Mar Industries Ltd., Campbell River, BC, Canada) working in the Taupo District Council’s Forest, Central North Island. The average piece size was 1.8 tons, and all the trees were felled motor-manually (chainsaw). The extraction direction was downhill, and at the top of the stand, there was very poor deflection (ground clearance) for the grapple, and chokers needed to be used.
During the yarding operation, the crew adjusted their extraction practice according to the perceived need of the setting. At CS-1 and CS-2, the trees were mechanically felled, whereas at CS-3, the trees were felled by chainsaw. At CS-1 and CS-2, the trees were either presented individually (“MechFell”) or moved by the felling machine into small bunches (typically 2 or 3 stems) to create more effective payloads for the grapple (“Bunched’). In all scenarios, the felling machine operator placed the felled trees, or bunches, in a place and direction that facilitated improved grappling and extraction. Typically, this meant perpendicular to the skyline and, where possible, with the butt end(s) of the stem(s) raised. Additionally, at CS-1, in a few locations, stems were shoveled from an area that could not be reached by the grapple and placed into a larger surge pile (“SurgePile”) from where it could be reached by the grapple. The manual felling at CS-3 meant the trees were left where they fell (“ManualFell”). Because of the limited deflection hindering the grappling of the stems at the back of the setting at CS-3, chokers (attached to the grapple) were often required to pull the stems forward (“Choker”).
The two Log Champ yarders were less than three years old at the time of the study, whereas the Madill was older but had recently been refurbished prior to the study (Figure 1). The Madill 124 is the most common swing yarder model in New Zealand, with more than 30 currently operating [1]. They have been constructed since the 1980s, weigh in at about 55 tons, and operate a 350 kW motor (details specifications can be found at https://www.madillequipment.com, accessed on 13 March 2021). The T-Mar swing yarders first arrived in New Zealand in 2016, with the larger Log Champ 650 also having a 350 kW engine but weighing 68 tons. The smaller Log Champ 550 has a 280 kW power rating and weighs 45 tons (details can be found at www.tmarequipment.comyarders/ accessed on 13 March 2021).

2.2. Time and Motion Study

The time required to complete each yarding cycle was recorded by stopwatch, including the individual cycle elements being: outhaul, grapple (loading), inhaul, and unhook (unload). The outhaul represents the outward movement of the grapple carriage away from the yarder, it starts when the carriage begins to travel away from the yarder and ends when the grapple carriage is slowed and lowered in the cutover towards the stems on the ground. Grapple or loading begins at the end of the outhaul and ends when the grapple is raised with the stems intact, ready for inhaul. Inhaul begins when the raised stems and carriage begin to move towards the yarder and ends when the grapple arrives at the landing and begins to be lowered. Unhook (unload) starts at the end of inhaul and ends the stems have been placed on the landing, and once the ropes and grapple carriage are raised, they are ready for outhaul.
The following parameters were recorded for each cycle: extraction distance (m) and the number of stems picked up by the grapple per cycle. Any delay not part of the normal work cycle was also recorded and timed, as well as categorized as either personal (e.g., rest), mechanical (e.g., repairs, machine maintenance) or operational (e.g., waiting, setting chokers). Line speed was calculated by dividing the extraction distance by either the outhaul or the inhaul time (Equation (1)), while the machine utilization was calculated as shown in Equation (2).
Line   speed = Extraction   distance   meter outhaul   or   inhaul   time   sec
Machine   utilization ,   % = productive   mahine   hour   hr scheduled   machine   hour   hr × 100
Also recorded was the layout of the stems, that is, how the stems are presented for pick-up by the grapple, i.e., individually laid out or bunched. Yarder productivity was calculated as the ratio of log volume in tons per productive machine hour. Scatter plots were also used to show the relationship between the elemental cycle components and extraction distance. The relationship among the elemental component of the yarding cycle examined include outhaul time and extraction distance, grapple time and extraction distance, and inhaul time and extraction distance. To show variability in the measured unhook time of the yarding cycle, a box plot was used, and the difference in means was determined using ANOVA and Fischer’s least significant difference method (FLSD).

3. Results and Discussion

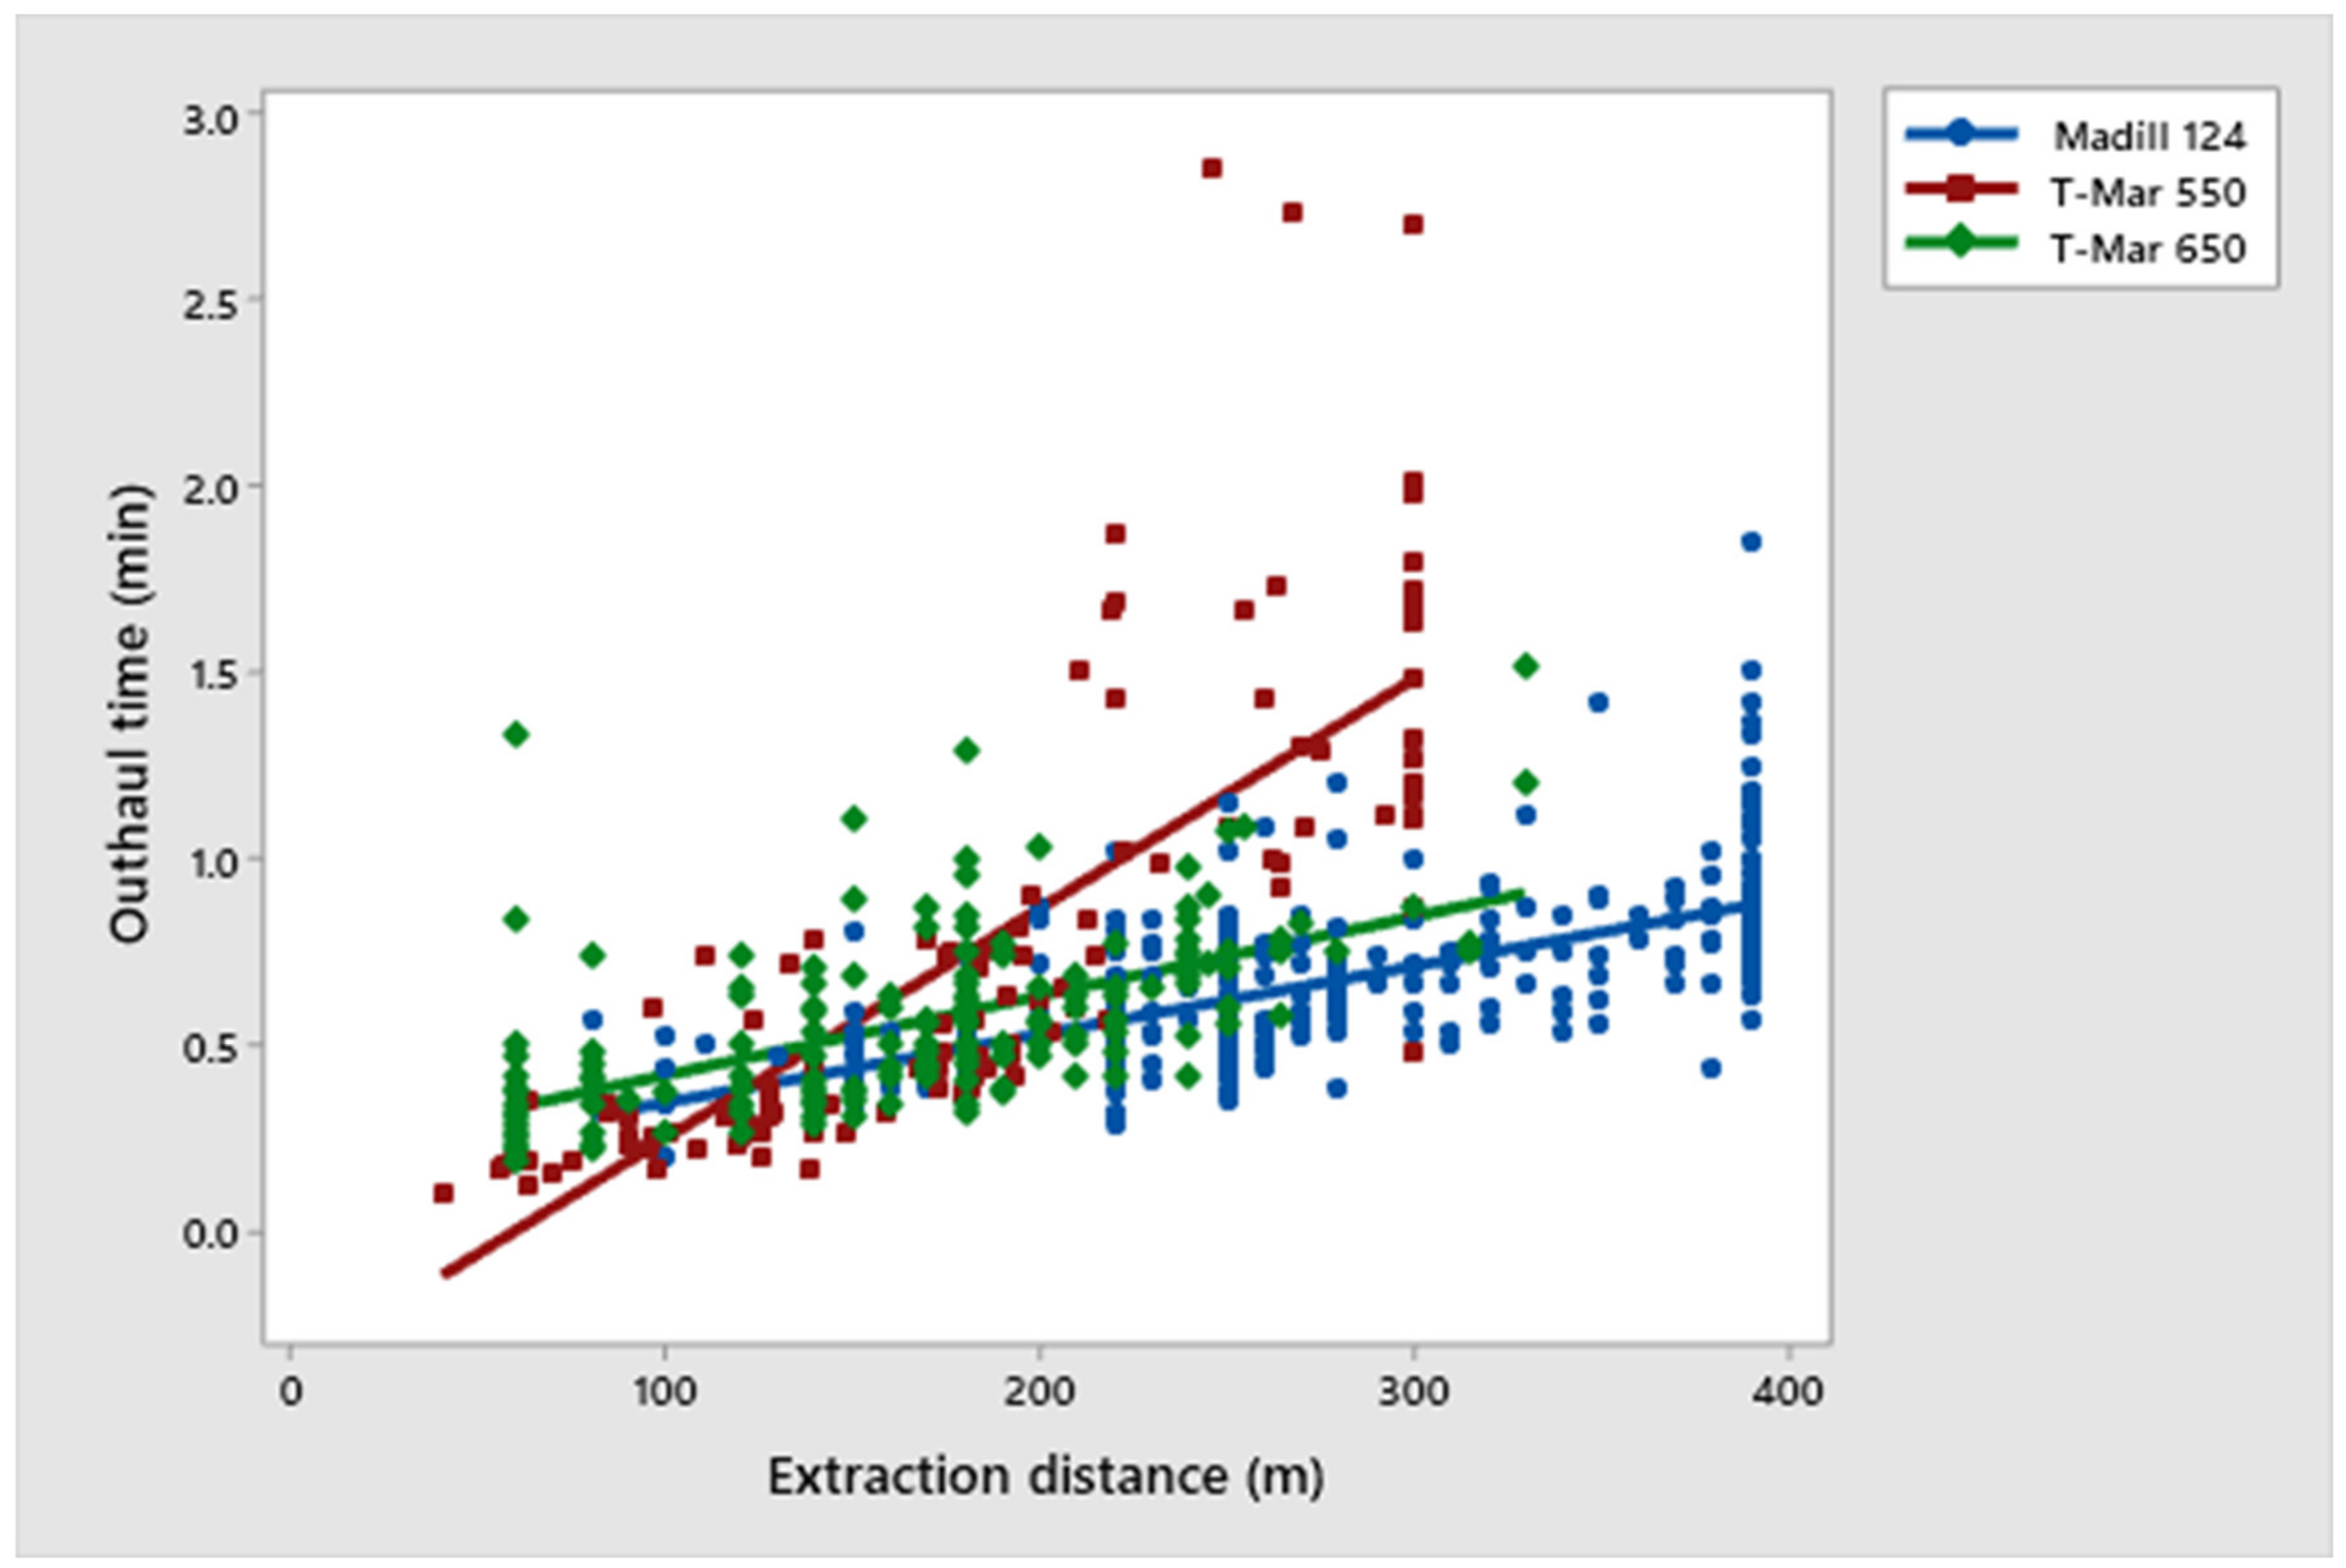
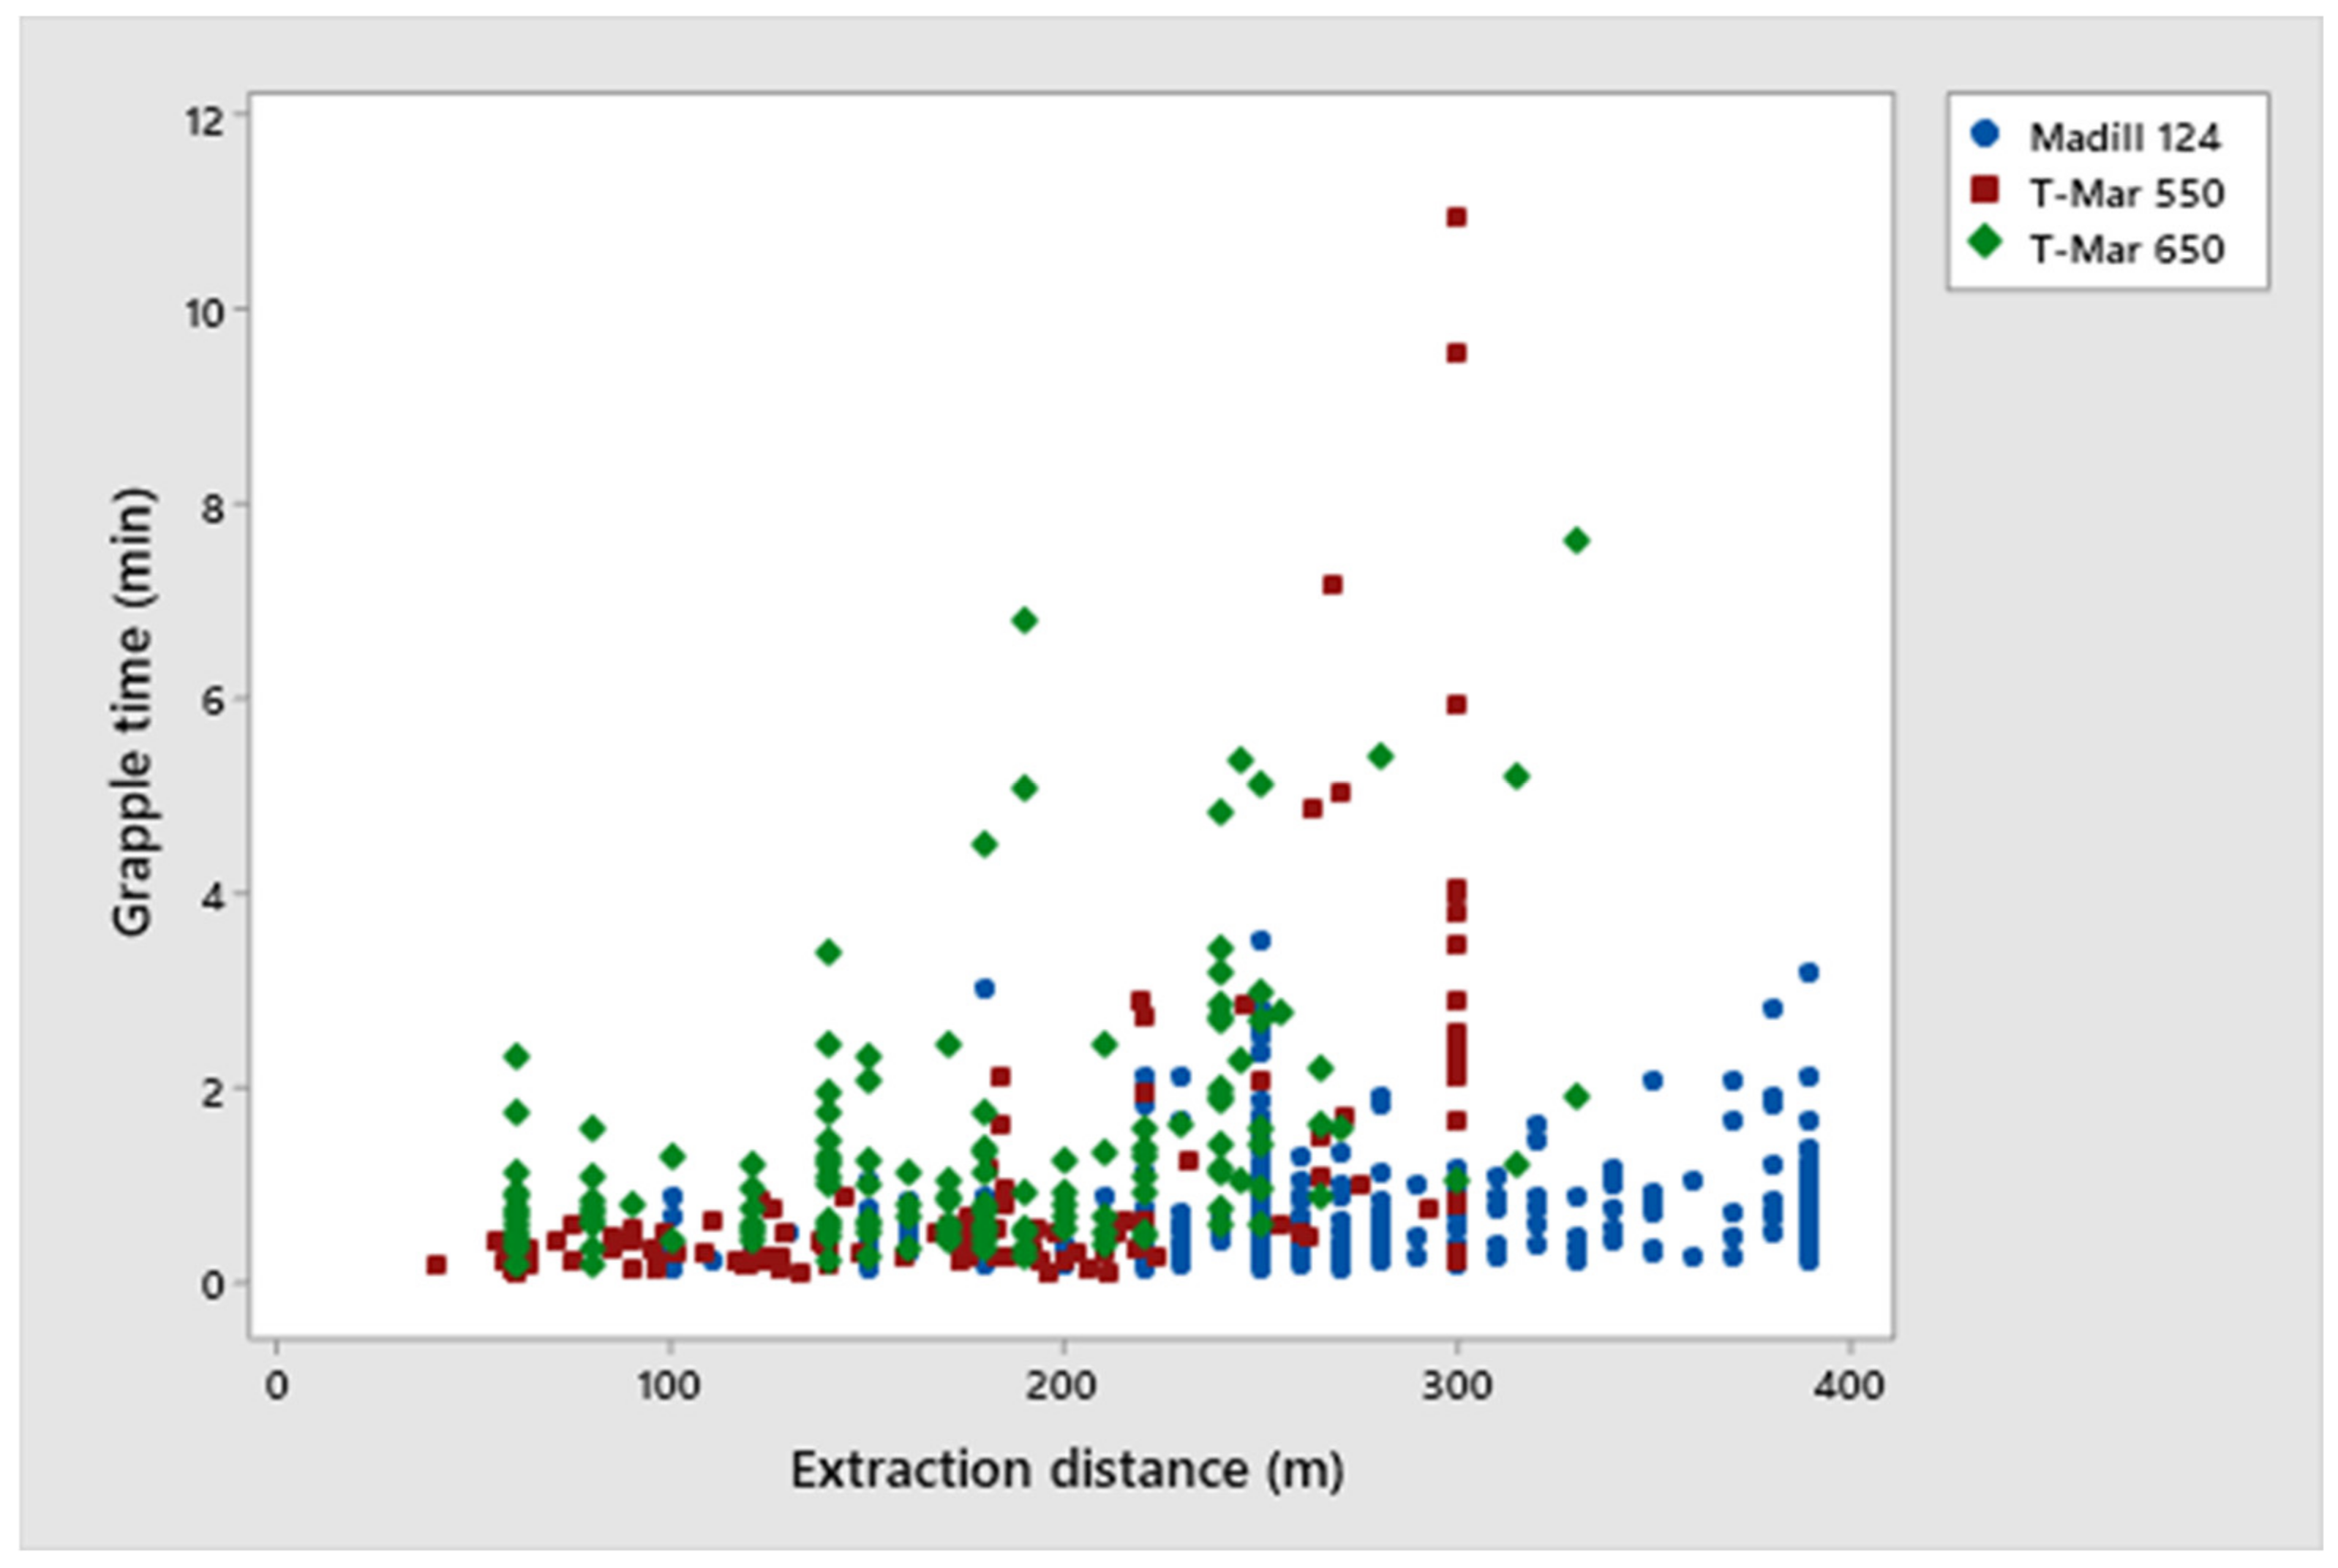
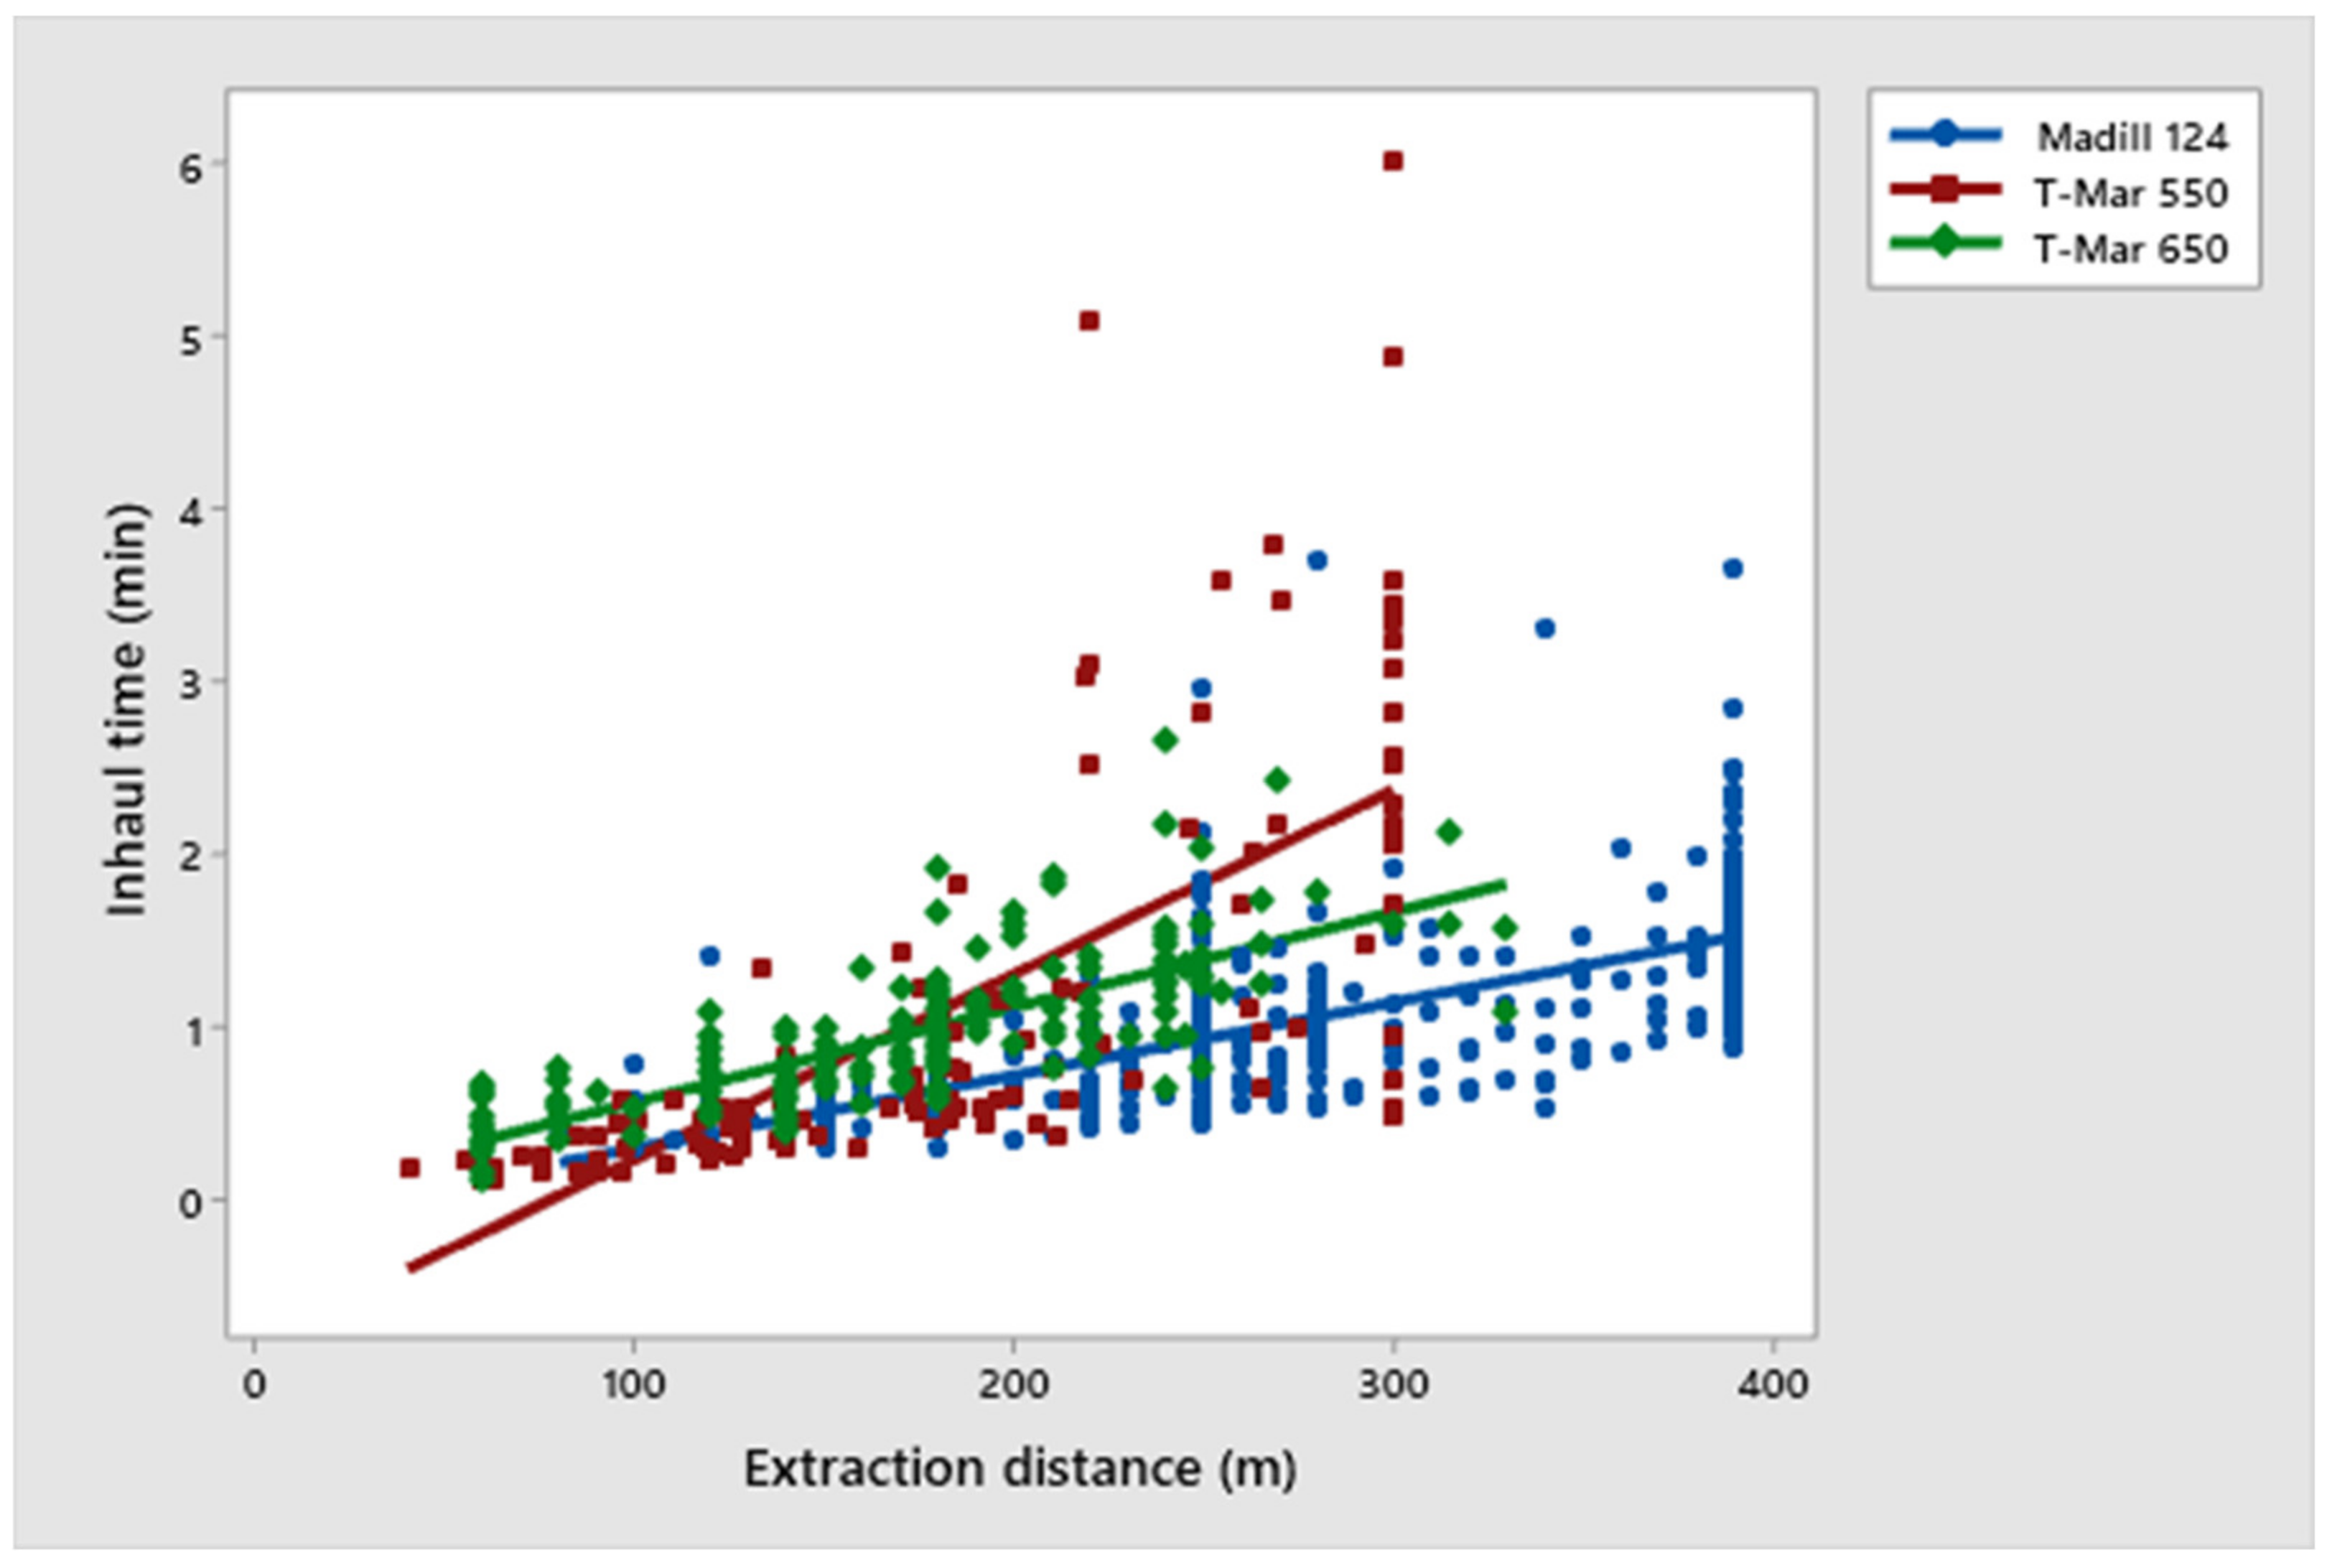
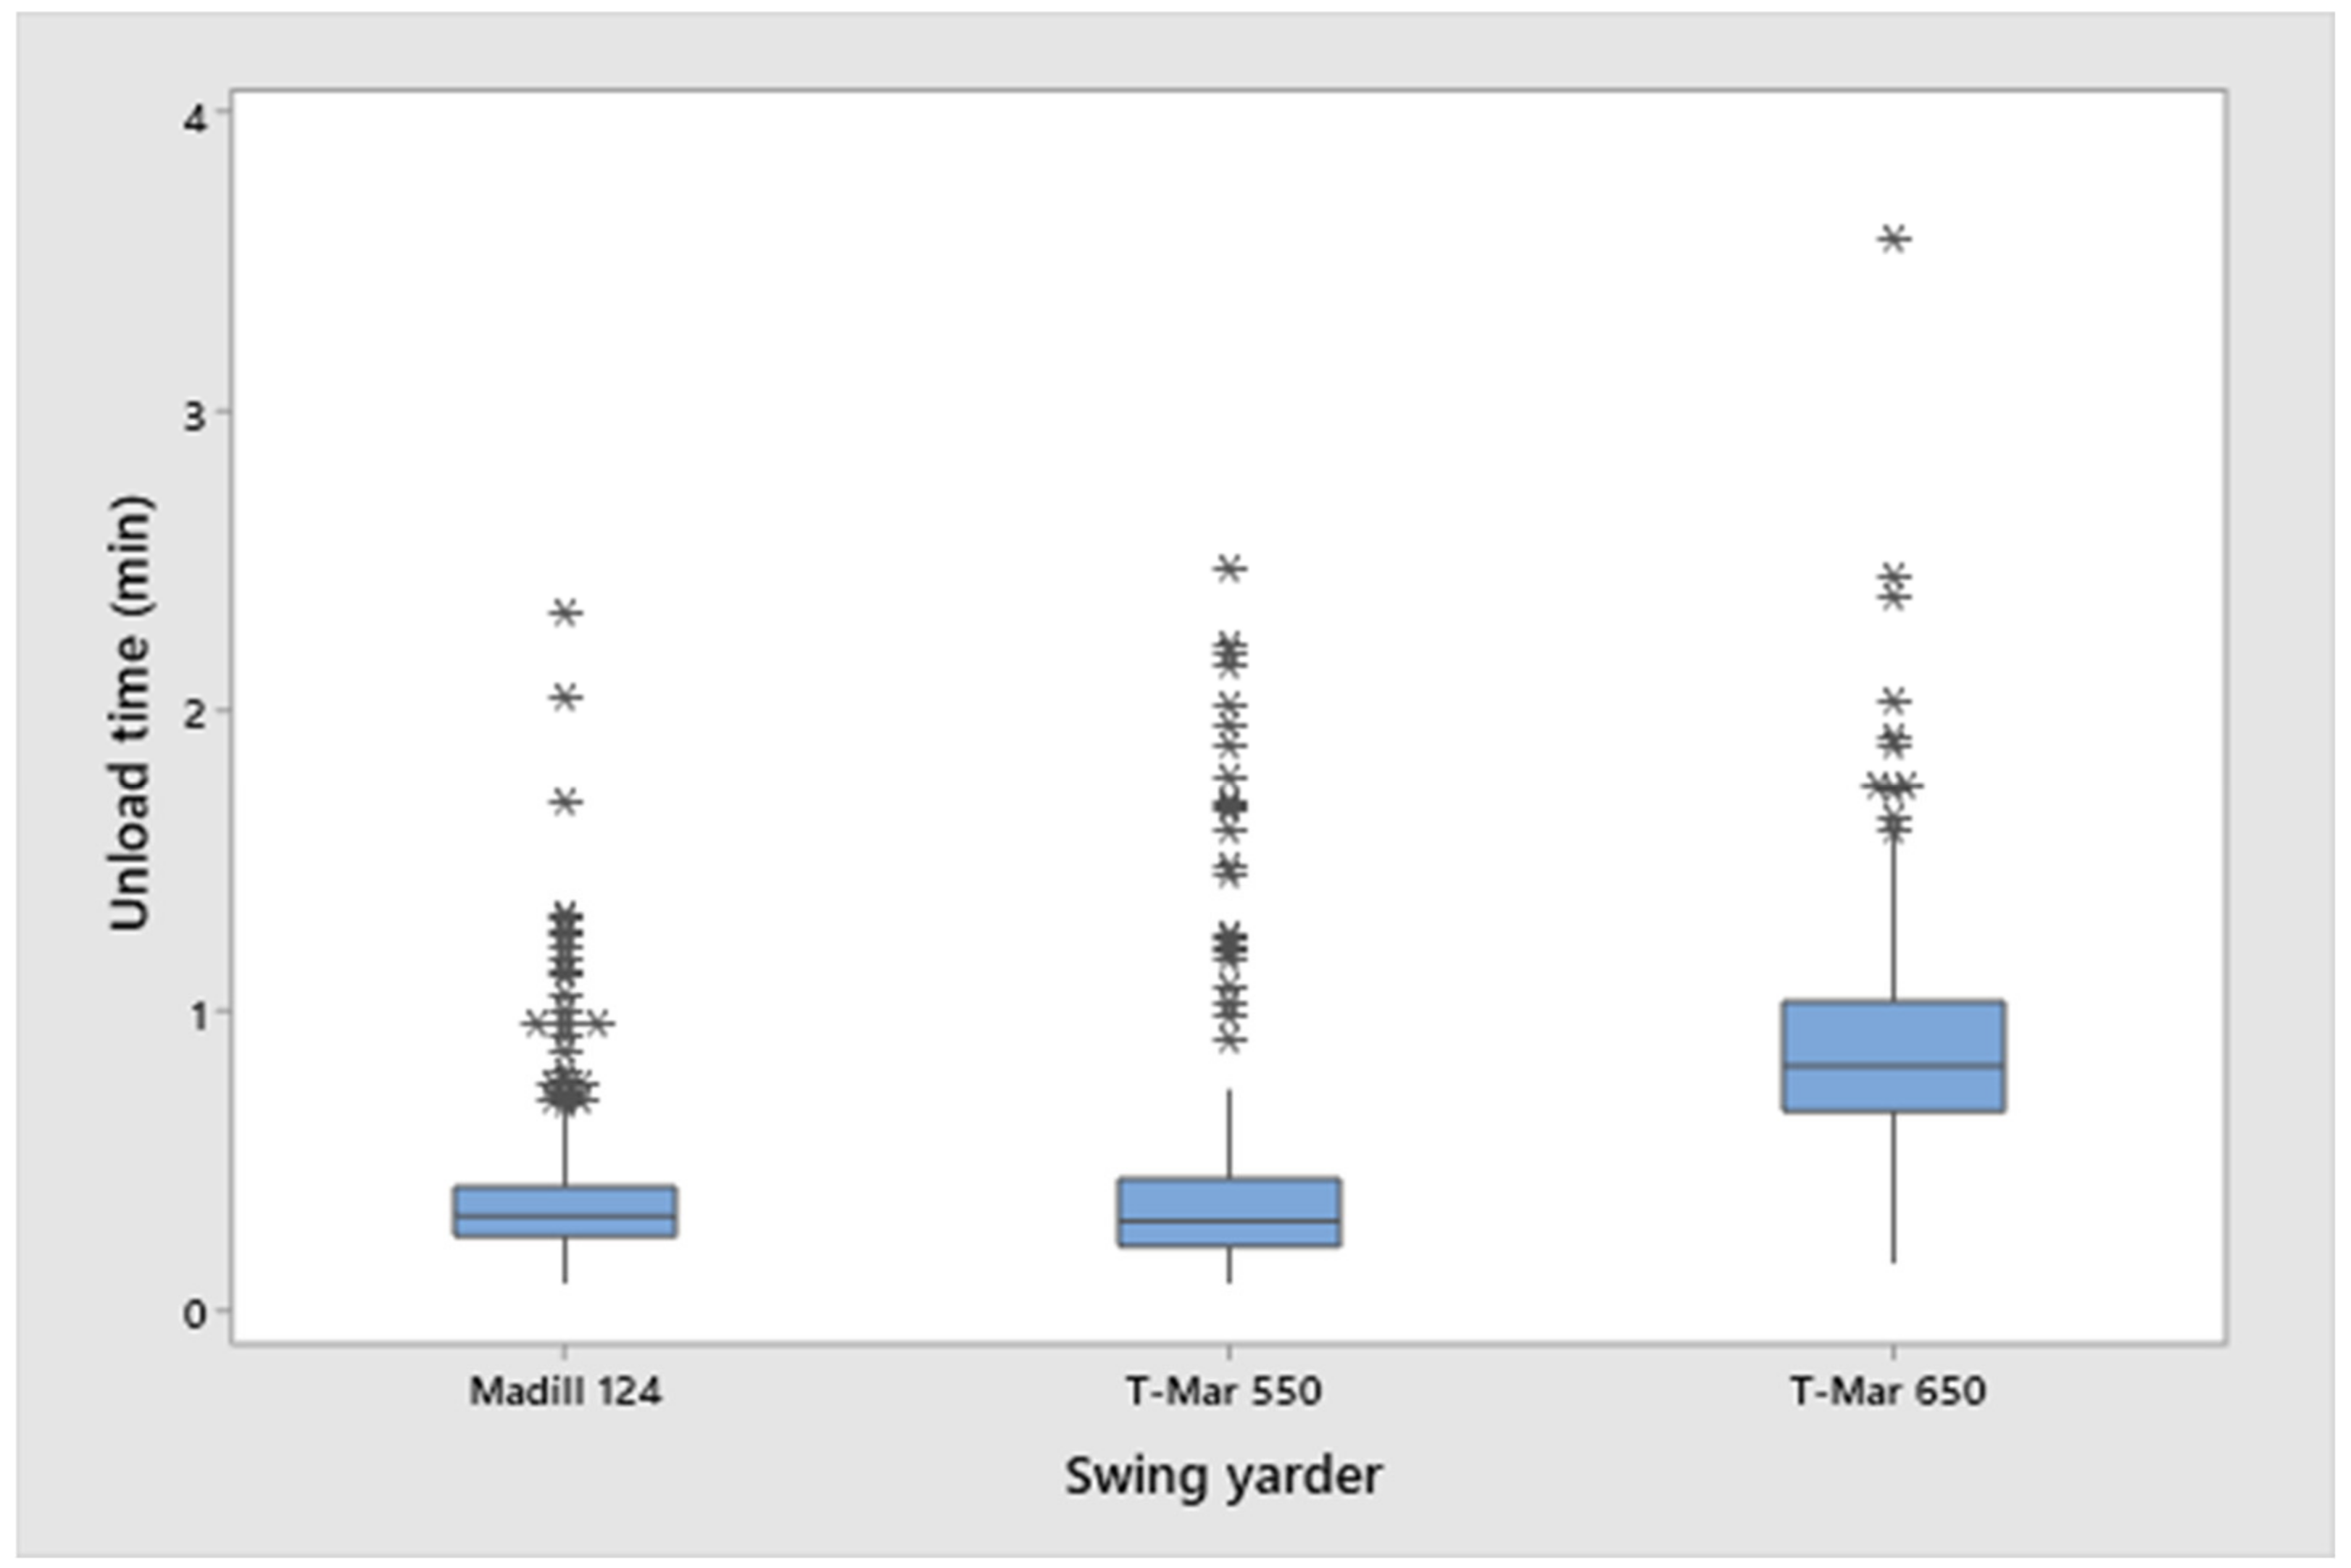
3.1. Analysis of the Yarding Cycle

A total of 711 yarding cycles were recorded in the study: 410 cycles for CS-1 (the Madill 124), 176 cycles for CS-2 (the T-Mar 650), and 125 for CS-3 (the T-Mar 550) (Table 1). In terms of yarder productivity in tons per productive machine hour (t/PMH), all three operations were very similar with a range from 50.8 to 55.5 t/PMH. Combining the data from all three sites, an average productivity of 54 t/PMH was achieved at an extraction distance of 234 m pulling 1.81 t/tree piece size. This productivity is high compared to a national average that includes all yarders (tower and swing) of 27.4 tons per scheduled machine hour [2].
The lowest mean total cycle time of 2.77 min was recorded at CS-1, despite it having the highest mean extraction distance of 277 m. CS-2 and CS-3 had a similar mean total cycle time of 3.63 and 3.66 min, respectively, at average yarding distances of less than 200 m. The mean total cycle time recorded for the swing yarders was lower than 4.70 min/cycle reported by [18] in the analysis of time and productivity of swing and tower yarders in whole-tree operations. In terms of the yarding cycle elemental components, grappling of stems took the longest time to complete at CS-2 and CS-3, while inhaul was the most time-consuming element at CS-1. This is supported by an earlier study by [19], who noted that for a mini swing yarder, stem size played a more significant role in yarding productivity compared to felling and skidding direction for a thinning operation. Cho et al. [20] added that in addition to stem size, other factors that greatly influenced yarding productivity and reduced operational delay included lateral and yarding distance, operational planning, general maintenance of the yarder and technical training of the workforce. The lower cycle time for CS-1 can be explained by a number of factors. Despite the longer average extraction distance, the outhaul and inhaul elements were similar in time. Higher average line speed during outhaul in CS-1 showed the carriage speed at 7.18 m/s compared to 5.26 m/s in CS-2 and CS-3. The higher speed recorded speed at CS-1 may have been influenced by the Madill 124 fully automatic transmission and the operator’s skill; the operator and crew were very experienced with the system. The main time saving was during the grapple and unloaded elements, with CS-1 being 0.9 min faster than the average of CS-2 and CS-3.
Scatter plots were used to show the relationship between the cycle elements and extraction distance. Figure 2 shows outhaul time against extraction distance and, overall, a relatively linear relationship for all three case studies. While the CS-1 and CS-2 showed relatively less variability in their outhaul time across the extraction distance, CS-3 outhaul time varies considerably beyond 200 m extraction distance, where the crew encountered areas of low clearance (i.e., blind lead). Variation in outhaul time occurred mostly when ropes wrapped, thus requiring the operator to outhaul slowly until the ropes were unwrapped or the camera was being used to scan for logs in blind spots.
Grappling stems is obviously still a challenging task, taking on average just over 1 min, and grapple time accounts for about 34% (CS-2), 33% (CS-3) and 24% (CS-1) of the total cycle time. The high average grapple time for CS-2 can be in part explained by the higher number of stems grappled per cycle, where two or more stems were grappled in 44% of the cycles. This compares with just 2% at CS-3 and 29% at CS-1. Operator skill could also have influenced the yarder to mean grapple time, and the operator of the T-Mar 650 (CS-2) was the least experienced, with just several months of prior experience.
The variability in time to grapple the stems increased with extraction distance (Figure 3), especially for CS-2 and CS-3. The high variability in grapple time recorded in CS-2 beyond 250 m was due to poor carriage clearance (i.e., low deflection). At the back of the corridor (300 m), setting chokers and/or re-grappling stems was required to pull the stems forward by about 25–50 m to an area with greater clearance and then re-grappled by the operator for inhaul. To illustrate the effect of a smaller segment of the operation in difficult terrain on the overall efficiency of the operation, we refer to CS-3. While the mean grapple time for the operation was 1.21 min. and the mean cycle time was 3.66 min, these figures drop to 0.77 min and 2.35 min, respectively, if choker-setting were not required during the operation cycle. The Madill 124-yarder showed less variability in grapple time, irrespective of the extraction distance. The Madill 124-yarder also had the lowest mean grapple time of 0.67 min.
Inhaul time could be influenced by a number of factors, including extraction distance, direction (i.e., uphill or downhill), intermediate ridges, payload differences, available deflection and engine power of yarders. CS-1 and CS-3 showed greater variability in inhaul time compared to the CS-2 site. Some of the variability in inhaul time occurred when stems were dropped from the grapple and needed to be re-grappled, thus contributing additional time to both the grapple and inhaul components of the cycle. Longer haul distances and hill slopes decrease vision for the yarder operator, and poor stem presentation can make it more difficult to grapple stems, both contributing to increases in yarding cycle time [21].
Mean inhaul line speeds of 5.01, 4.34 and 3.26 m/s were calculated for the case studies (1 through 3, respectively). The lowest inhaul line speed at CS-3 could be attributed to downhill yarding requiring slower inhaul speed as momentum could be difficult to stop at the landing if the stems were brought in at a faster speed. CS-2 had the lowest mean inhaul time of 0.92 min, but this would have been influenced by its lowest mean extraction distance of 166 m (Table 1). The 5.01 m/s mean inhaul line speed of the Madill 124 could benefit the operation in terms of machine productivity, particularly over long yarding distances. The variability of inhaul time for the three swing yarder operations generally increased in an upward trend as the extraction distance increased (Figure 4).
Logically, we might assume that unhooking/unloading the stems at the landing should take a small percentage of the total yarding cycle time for swing yarder operations. However, unloading stems at CS-2 took more time than the outhaul of the grapple carriage (See Table 1). Figure 5 reveals considerable variability in the unhook time for the three swing yarders; the variability is, however, more pronounced in CS-2 (T-Mar 650) and CS-3 (T-Mar 550) compared to CS-1 (Madill 124). The wide variations were a result of difficulties encountered during the unloading of the stems at the landing. For example, the CS-2 setup was very close to a steep bluff and stems often slid backward into the cutover, thus requiring the operator to slew further to the side. This added more time as ropes needed to be lowered and then raised again before the outhaul. The crew also spent additional operational delay time trying to locate appropriate space on the landing to stack the stems. This challenge of landing constraints was also encountered at CS-1 and may be a common feature of yarders with such fast cycle times. At CS-3, the long average unloading times were associated with unhooking chokers on the landing.
Analysis of variance (ANOVA) carried out on the unhook time of the three yarder operations at CS-1, CS-2, and CS-3 (Table 2) showed a significant difference among the mean unhook time of the swing yarders at 5% significant value (p < 5.00). Furthermore, using the Fisher Least Significant Difference (FLSD) method to compare the mean unhook time of the three swing yarders, the mean values were significantly different from one another, with CS-2 having the highest mean unhook time (Table 3).

3.2. Stem Layout, Yarding Cycle Time and Productivity

At each of the three different case study locations, stems were presented in different forms or layouts that could influence yarding cycle time and productivity. Table 4 presents the result of the mean grapple time, total yarding cycle time, mean payload and the resulting mean productivity. CS-1 showed the benefits of bunching the stems, resulting in a higher mean payload per cycle of 3.0 tons compared to just 2.2 tons for the trees that were just mechanically felled (but not bunched), and also better than grappling a load from the surge pile which was 2.5 tons. The lower surge pile payload was because of the difficulty of breaking the stems out of the pile. CS-2 also showed the benefit of bunching, especially at the longer extraction distance. Payload has long been identified as an important factor in cable logging productivity [22]. The productivity of the bunched extraction was marginally higher at 51.3 t/PMH, compared to 48.9 t/PMH, but this was achieved at a much greater extraction distance (188 m versus 65 m). Again, this was achieved with a higher average payload of 3.1 tons per cycle, compared to 1.7 when extracting trees that were not bunched.
For CS-2, in the 144 observed cycles where the stems were bunched, the yarder was able to grapple more than one stem 68% of the time. This result is similar to CS-1, where multiple stems were only 32% for the standard mechanically felled trees, 37% for stems extracted from the surge pile, and 63% for the bunched stems. Grappling a bunch or from a surge pile only took 0.12 min (7 s) longer on average. This result is also noted in Amishev and Evanson [23], who reported a 33% increase in the extraction of trees yarded per cycle with bunched stems. Similarly, Acuna, et al. [24] reported about a 32% difference in the volume of trees hauled per cycle between bunched and unbunched stems.
CS-3, which was the T-Mar 550 with the downhill extraction case study, showed the impact of having to set chokers when the stems cannot be directly grappled. While the manually felled trees within reach took just 0.76 min to grapple, having to set chokers increased that to 3.11 min. The combined effect of setting chokers, extracting at a distance and having to cope with poor clearance is clearly shown in the average productivity, which was only 12.2 t/PMH for this part of the operation. The chainsaw felled stems with varying layout patterns (manually felled) gave the highest mean productivity of 63.31 t/PMH. However, this was only studied at CS-3 with downhill yarding and the relatively short average extraction distance of 161 m. By combining all the data, there was a clear trend (p < 0.01) that showed a productivity decrease by 14 t/PMH for every 100m of extraction distance.

3.3. Swing Yarder Utilisation

The utilization rate of a machine gives an indication of its productive machine hours (PMH) over its scheduled machine hours (SMH). CS-1 achieved the highest level of utilization during the case study, 84% (Table 5). CS-2 and CS-3 were similar at 69 and 62%, respectively. The overall average of 76% is high compared to an expected average utilization rate for yarders operating in New Zealand, which commonly average 65–70% [25]. This confirms that the crews studied were overall good performers.
Operational delays accounted for just over half of all delay time, whereby this includes greasing, safety checks, as well as fueling, but also tail hold shifts and waiting for stems to be shoveled and bunched under ropes. At CS-2, retrieving stems that were lost over the bluff during inhaul was also an example of an operational delay. Mechanical delays averaged just 7.1% of the scheduled time of the total time. It is not uncommon for older swing yarders to have high delays, and lower utilization is expected over a longer term [9]. This low average is consistent with the study focusing on new yarders, or for the Madill 124, a recently refurbished yarder. While operational delays are expected to occur relatively frequently, for shorter periods of time, they tend to be more consistent in scale. Mechanical delays, such as in the repair of the yarder, occurs infrequently but are often associated with a major time loss. During these case studies, only CS-2 had a breakdown, being issues with the main drum clutch bolts, and hence the higher % mechanical delay.
Personal delays, which is the yarder not working because the operator is taking a break, were very low at both CS-1 and CS-3. If an operator took two 30 min breaks in a 9 or 9.5 h scheduled day, this would result in about a 10% personal delay. However, often yarder operators will take a break during operational delays such as line shifts or waiting for items to be cleared on the landing. As such, it is possible to measure a low percentage of personal delays without insinuating that there were no breaks for the operator.
Improving the utilization of machines can directly improve productivity. Operational delays can be minimized through careful planning of the yarding operation and effective communication during the operation. While mechanical delays are rarely avoidable, they can be minimized through appropriate preventive maintenance and scheduling such maintenance outside of work hours. Personal delays are often necessary as they relate to breaks and strategies for managing work fatigue.

4. Conclusions

This study investigated the operational performance of swing yarders at three different locations in North Island, New Zealand. The yarders included in the study were the Madill 124, T-Mar 650, and T-Mar 550. The following conclusions were drawn from the study:
  • Utilization of the yarders was influenced by various delays, including mechanical, operational and personal, with operational delays being the most prevailing.
  • The swing yarders performed better with lesser variability in the elemental cycle time at yarding distances less than 200 m.
  • Stem presentation across the cutover could significantly influence the mean payload per cycle and, consequently, the machine productivity.
  • Bunching of stems in piles of two or three improves the mean payload and productivity of the yarders.
  • The use of choker-setters in combination with fully mechanized yarding significantly reduced the machine productivity having the highest cycle time and lowest productivity per productive machine hour.
  • With careful harvest planning, mean yarding cycle time could be significantly reduced and payloads maximized to increase the productivity of swing yarders in the near future.
One limitation of the study is the unequal number of observations recorded for each case study. Future research should attempt to quantify delay types and frequency associated with fully mechanized grapple yarding operations. Future research could also investigate the differences in productivity and costs with different stem presentation methods.

Author Contributions

Conceptualization, R.V. and H.H.; methodology, R.V., H.H. and L.H.; formal analysis, H.H., L.H. and O.F.O.; investigation, H.H. and L.H.; resources, R.V.; writing—original draft preparation, L.H. and H.H.; writing—review and editing, O.F.O.; visualization, R.V., H.H. and O.F.O.; supervision, R.V. All authors have read and agreed to the published version of the manuscript.

Funding

This research received no external funding.

Institutional Review Board Statement

Not applicable.

Informed Consent Statement

Not applicable.

Data Availability Statement

Not applicable.

Acknowledgments

The third author wishes to acknowledge the support received from the Alexander von Humboldt Foundation (AvH), Germany, through the Georg Forster Research Fellowship.

Conflicts of Interest

The authors declare no conflict of interest.

References

  1. Harrill, H.; Visser, R. Survey of Yarders and Rigging Configurations: 2018; Forest Growers Research: Harvesting Technical Note; Forest Growers Research Ltd.: Rotorua, New Zealand, 2018; Volume 10. [Google Scholar]
  2. Visser, R. A Decade of Benchmarking Harvesting Cost and Productivity; Forest Growers Research: Harvesting Technical Note; Forest Growers Research Ltd.: Rotorua, New Zealand, 2019; Volume 12. [Google Scholar]
  3. Work Safe, B. Cable Yarding Systems Handbook; The Worker’s Compensation Board of British Columbia: Richmond, BC, Canada, 2006. [Google Scholar]
  4. Mann, C.N. Why running skylines and interlock yarders. In Proceedings of the Skyline Logging Symposium, Vancouver, BC, Canada, 17–26 December 1976. [Google Scholar]
  5. Carson, W.W.; Jorgenson, J.E. Understanding Interlock Yarders; Research Note, pnw-221; Usda Forest Service, Pacific Northwest Forest Range and Experiment Station: Portland, OR, USA, 1974; 13p.
  6. MacDonald, A.J. Harvesting Systems and Equipment in British Columbia; Ministry of Forests, Forest Practices Branch: Vancouver, BC, Canada, 1999; 197p.
  7. Liley, B. A Survey of the Logging Industry; Technical Report; Logging Industry Research Organisation: Rotorua, New Zealand, 1985; Volume 10. [Google Scholar]
  8. Visser, R. Survey of Cable Yarders Used in New Zealand; Harvesting Technical Notes; Forest Growers Research Ltd.: Rotorua, New Zealand, 2013; Volume 6. [Google Scholar]
  9. Harrill, H.; Visser, R. Rigging Configurations Used in New Zealand Cable Logging; Future Forests Research Ltd.: Rotorua, New Zealand, 2011. [Google Scholar]
  10. Prebble, R. Madill 122 Interlock Swing Yarder; New Zealand Logging Industry Research Association Inc.: Rotorua, New Zealand, 1989; Volume 14. [Google Scholar]
  11. Raymond, K. Innovation to increase profitability of steep terrain harvesting in new zealand. NZJ For. 2012, 57, 19–23. [Google Scholar]
  12. Harrill, H.; Visser, R.; Raymond, K. New zealand cable logging 2008–2018: A period of change. Curr. For. Rep. 2019, 5, 114–123. [Google Scholar] [CrossRef]
  13. Olund, D. The future of cable logging. In Proceedings of the International Mountain Logging and 11th Northwest Pacific Skyline Symposium, Seattle, WA, USA, 10–12 December 2001; pp. 10–12. [Google Scholar]
  14. Visser, R.; Raymond, K.; Harrill, H. Mechanising steep terrain harvesting operations. NZJ For. 2014, 59, 3–8. [Google Scholar] [CrossRef] [Green Version]
  15. Visser, R. Benchmarking Harvesting Cost and Productivity—2017 Update; Harvesting Technical Note HTN10-02; Forest Growers Research Ltd.: Rotorua, New Zealand, 2018; 4p. [Google Scholar]
  16. Visser, R.; Obi, O.F. Benchmarking 2019 Data and Longer-Term Productivity and Cost Analyses; Forest Growers Research: Harvesting Technical Note H045; Forest Growers Research Ltd.: Rotorua, New Zealand, 2020. [Google Scholar]
  17. FORME. Informe: Independent Harvesting Survey Equipment/Accessories/Vehicles/Labour/Overheads; Forme Consulting Group Ltd.: Wellington, New Zealand, 2019; 48p. [Google Scholar]
  18. Kim, M.K.; Park, S.J. An analysis of the operational time and productivity in whole-tree and cut-to-length logging operation system. J. Korean Soc. For. Sci. 2012, 101, 344–355. [Google Scholar]
  19. Sawaguchi, I.; Sasaki, S.; Tsuchiya, Y.; Tatsukawa, S. Labor productivity of line thinning with a mini swing-yarder. Bull. Iwate Univ. For. 2004, 35, 47–57. [Google Scholar]
  20. Cho, M.; Cho, K.; Choi, B.; Cha, D. Yarding productivity of tree-length harvesting using a small cable-yarder in steep slope, South Korea. For. Sci. Technol. 2018, 14, 132–137. [Google Scholar] [CrossRef]
  21. Nuske, S.R. A Comparative Study of Mechanized Cable Harvesting Systems in New Zealand. Bachelor Dissertation, School of Forestry, University of Canterbury, Christchurch, New Zealand, 2014; 47p. [Google Scholar]
  22. Marshall, H. Comparison of Methods for Estimating Harvesting Payloads; Report No.: HTN02-08; Future Forests Research Ltd.: Rotorua, New Zealand, 2009; 4p. [Google Scholar]
  23. Amishev, D.; Evanson, T. Innovative methods for steep terrain harvesting. Proc. FORMEC 2010, 2010, 11–14. [Google Scholar]
  24. Acuna, M.; Skinnell, J.; Evanson, T.; Mitchell, R. Bunching with a self-levelling feller-buncher on steep terrain for efficient yarder extraction. Croat. J. For. Eng. J. Theory Appl. For. Eng. 2011, 32, 521–531. [Google Scholar]
  25. Harper, C. Summary of New Zealand Cable Logging Production Studies; Logging Industry Research Organisation (LIRO): Rotorua, New Zealand, 1992; 155p. [Google Scholar]
Figure 1. (a) Madill 124 (b) T-Mar 650 and (c) T-Mar 550 swing yarders at the locations of the time studies (CS-1 to CS-3, respectively).
Forests 14 00190 g001
Figure 2. Relationship between outhaul and extraction distance for the three swing yarders studied.
Forests 14 00190 g002
Figure 3. Relationship between grapple time and extraction distance.
Forests 14 00190 g003
Figure 4. Relationship between inhaul time and extraction distance for the three yarders studied.
Forests 14 00190 g004
Figure 5. Boxplot showing variability in unhook time across the swing yarders studied. * represent the plot of unhook time (min) on the y-axis for each swing yarder.
Forests 14 00190 g005
Table 1. Mean yarding information for all three-case study sites, as well as the weighted averages for all sites.
Case Study SiteYarding Cycles (n)Mean Extract. Dist. (m)Mean Piece Size (t)Mean Payload (t)Mean Yarding Cycle Time (min)Mean Total Cycle (min)Mean Prod (t/PMH)
OuthaulGrappleInhaulUnload
CS-14102771.852.430.670.691.040.382.7755.5
CS-21761661.732.800.561.240.920.903.6350.8
CS-31251851.801.730.781.211.160.523.6653.8
All sites711233.31.812.40.660.921.030.533.1454.0
Table 2. ANOVA of unhooking time of swing yarders.
SourceDFAdj SSAdj MSF-Valuep-Value
Swing Yarder234.0617.0283132.370.000
Error70891.080.1286
Total710125.13
Table 3. Comparison of means using the Fisher LSD Method.
Swing YarderMeanGrouping
T-Mar 650 (CS-2)0.90A
T-Mar 550 (CS-3)0.52 B
Madill 124 (CS-1)0.38 C
Means that do not share a letter are significantly different.
Table 4. Stem presentation and yarding cycle time and average productivity for the yarders studied.
Swing YarderStem PresentationNumber of Yarding Cycles Mean Yarding Distance (m)Mean Grapple Time (min)Total Cycle Time (min)Mean Payload Per Cycle (tons)Mean Productivity (t/PMH)
CS-2MechFell32650.762.221.748.9
MechFell and Bunched1441881.353.943.151.3
CS-3ManualFell1011610.762.351.763.3
ManualFell and Choked242793.119.171.812.2
CS-1MechFell2202510.632.512.254.9
MechFell and Bunched 763000.763.623.050.5
MechFell and SurgePile1142540.752.702.559.8
Table 5. Productive utilization for the three swing yarders studied.
Swing YarderTotal Scheduled Machine Hour (hrs)Utilization (%)Delays (%)
MechanicalOperationalPersonalTotal Delays
CS-142.584212216
CS-220.7697141031
CS-314.0622312338
Overall77.2767.112.64.324
Disclaimer/Publisher’s Note: The statements, opinions and data contained in all publications are solely those of the individual author(s) and contributor(s) and not of MDPI and/or the editor(s). MDPI and/or the editor(s) disclaim responsibility for any injury to people or property resulting from any ideas, methods, instructions or products referred to in the content.

