Article

Diversity and Functional Potential of Prokaryotic Communities in Depth Profile of Boreo-Nemoral Minerotrophic Pine Swamp (European Russia)

by
Alla V. Golovchenko
1,
Tatiana G. Dobrovolskaya
1,
Diyana Sh. Sokolova
2,
Tatiana A. Gracheva
1,
Yuliya A. Dorchenkova
1,*,
Tamara V. Glukhova
3 and
Natalia A. Manucharova
1
1
Soil Science Department, Lomonosov Moscow State University, Leninskie Gory 1-12, Moscow 119991, Russia
2
Winogradsky Institute of Microbiology, Research Center of Biotechnology, Russian Academy of Sciences, Leninsky Prospect 33-2, Moscow 119071, Russia
3
Institute of Forest Science, Russian Academy of Sciences, Sovetskaya Street 21, Uspenskoe 143030, Moscow Oblast, Russia
*
Author to whom correspondence should be addressed.
Forests 2023, 14(12), 2313; https://doi.org/10.3390/f14122313
Submission received: 5 November 2023 / Revised: 16 November 2023 / Accepted: 21 November 2023 / Published: 24 November 2023

Abstract

:
Natural peatlands represent a wide range of habitats that contribute to the conservation of biodiversity, including microbial biodiversity. Molecular biological methods make it possible to significantly increase the accounting of microbial diversity compared to the cultivation methods. The studies on microbial diversity in minerotrophic peatlands using molecular biological methods lag significantly behind such studies for ombrotrophic peatlands. In this work, we characterized the taxonomic composition and functional potential of the prokaryotic community of the minerotrophic pine swamp (fen) in the Tver region of northwestern Russia using high-throughput sequencing of 16S rRNA gene fragments. This study is unique, since it was carried out not in individual horizons but across the entire fen profile, taking into account the differentiation of the profile into the acrotelm and catotelm. The composition and dominants of bacterial and archaeal communities were determined not only at the level of phyla but also at the level of classes, families, and cultivated genera. The prokaryotic community of the studied fen was shown to have a high taxonomic diversity (28 bacterial and 10 archaeal phyla were identified). The profile differentiation of the taxonomic composition of prokaryotic communities is most clearly manifested in the analysis of the acrotelm and catotelm. In the bacterial communities of the acrotelm, the top three phyla included Acidobacteriota, Alphaproteobacteria, and Actinomycetota, in the catotelm—Betaproteobacteria, Bacteroidota, and Chloroflexota. In archaeal communities of the acrotelm, we discovered the monodominance of Nitrososphaerota, in the catotelm—the dominance of Bathyarchaeota and subdominance of Thermoplasmatota, Halobacterota, and Aenigmarchaeota. The hot spots of microbial diversity in the studied fen profile were found to be the 0–20 cm layer of the acrotelm and the 150–200 cm layer of the catotelm. In contrast to the taxonomic composition, the functional profiles of the prokaryotic communities of the acrotelm and catotelm were generally similar, except for methane metabolism, which was primarily carried out in the catotelm.

1. Introduction

Peatlands occupy less than 3% of the world’s land area, yet they contain an estimated 40% of all terrestrial organic carbon (C) in the form of soil organic matter called peat [1,2]. Peatlands are found in all regions of the world from tropical swamp forests to the Arctic [3]. Russia comprises more than a third of the world’s peatlands and, due to the diversity of geographical conditions, a wide range of their natural variants. According to expert estimates, peatlands, regardless of the thickness of the peat horizon, occupy 21.6% of the country’s territory, and with a peat thickness of more than 50 cm—5.7% of it [4]. Forest vegetation (closed and sparse) is present in 38% of the peatland area in Russia. It occupies 54% of the area of ombrotrophic and 68% of the area of minerotrophic peatlands [5].
Due to their unique properties and the presence of peat deposits, peatlands play an important (often crucial) role in maintaining natural processes at the local, regional, and global levels, in regulating the cycle of water, carbon, and other natural components [4,5]. They also represent a wide range of habitats that contribute to the conservation of biodiversity, including microbial [6,7,8]. The study of microbial diversity is essential to identify the potential of microbial resources from the peatland ecosystems. Microbial communities are the main drivers of organic matter transformation in peatlands, so it is critical to deepen our understanding of the relative contributions of different groups of microorganisms to this process [8,9].
The study of the bacterial communities of the peatlands has been carried out for about a century. The first studies date back to the 20–30s of the XX century [10,11,12]. For more than half a century, bacteria in the peatlands have been identified by cultivation on artificial nutrient media (plate method). Owing to this method, peatlands have been recognized as a habitat for various bacteria [8,13]. However, bacteria cultivated on media represent a very small proportion (from 1 to 10%) of the soil prokaryotic community [14].
The trend of modern research in the field of studying bacterial diversity is the use of molecular methods. The first attempt to analyze libraries of 16S rRNA gene fragments from sphagnum peat was made in 1996 [15]. At that time, for most of the bacteria domain, phylogenetic affiliations were not established, since many phyla (for example, Acidobacteriota and Verrucomicrobiota) had not yet been described.
It should be noted that studies on the identification of bacterial diversity based on the analysis of 16S rRNA gene fragments were carried out mainly for ombrotrophic peatlands (bogs) [13,16,17,18,19,20,21,22,23]. In Russia, the priority of studying bogs is associated with their predominance, both in terms of occupied area and peat reserves, over all other types of peatlands. Moreover, the search for an answer to the question of the reasons for the slow peat decomposition in these ecosystems remains pertinent [24].
Long-term studies of the indicators of the microorganism abundance in the peatlands of Russia revealed that the fungal component is predominant in the structure of the microbial biomass of their ombrotrophic representatives, while the proportion of bacterial biomass does not exceed 15%. The minerotrophic peatlands (fens) were found to have a different structure of microbial biomass—the dominance of bacterial biomass in most of the profile [25,26,27], represented mainly by viable bacteria [28]. However, the bacterial communities of fens have not been sufficiently well studied by culture-independent methods, and we lack basic knowledge of their diversity and functions.
It should be noted that most studies of peatland bacterial communities using metabarcoding are limited to the study of one or several layers [18,19,29,30,31]. There are very few works that consider the entire profile [20,23,32,33].
The necessity of studying the entire organogenic thickness of peatlands is dictated by the genetic features of peat soil formation. The upper horizons of the peatlands correspond to current conditions; the lower horizons correspond to the previous stages of soil formation, i.e., the history of atmozemic soil development is recorded in a complete profile [34]. Therefore, when studying the structural and functional organization of microbial communities, it is necessary to analyze the entire profile along a vertical depth gradient, as is customary for the study of soil as a profile body.
It should also be noted that microbial communities in the profile of peatlands function in two zones in which the ecological conditions are very different: the acrotelm with the predominance of aerobic conditions and the catotelm with the predominance of anaerobic conditions. A change in the profile of abiotic conditions leads to changes in the structural and functional organization of the peatland microbial communities [23]. This is a strong argument in favor of studying the microbial communities of complete peatland profiles.
Based on the foregoing, the aim of this study was to characterize the prokaryotic diversity and functional potential in the complete profile of a minerotrophic pine swamp, with special attention paid to the comparative analysis of its acrotelm and catotelm.
By examining a complete profile in minerotrophic peatland rather than individual horizons, we wanted to determine whether there was a profile differentiation in the taxonomic and functional characteristics of the prokaryotic community. We also hypothesized that the contrast between regimes occurring in the acrotelm and catotelm of a minerotrophic peatland would reveal the contrast in the taxonomy and functional potential of the prokaryotic communities inhabiting them. Our analysis showed that the prokaryotic communities of the minerotrophic peatland are differentiated along a vertical depth gradient. Their differentiation was more pronounced at the taxonomic rather than at the functional level. The acrotelm prokaryotic communities were found to be markedly different from those in the catotelm. Differences have been confirmed at different taxonomic levels. In contrast to the taxonomic composition, the functional profiles of the prokaryotic communities of the acrotelm and catotelm were generally similar. A comparative analysis of the data for minerotrophic and oligotrophic peatlands made it possible to identify the features of the taxonomic composition and profile distribution of prokaryotic communities among the less studied peatlands—minerotrophic ones.

2. Materials and Methods
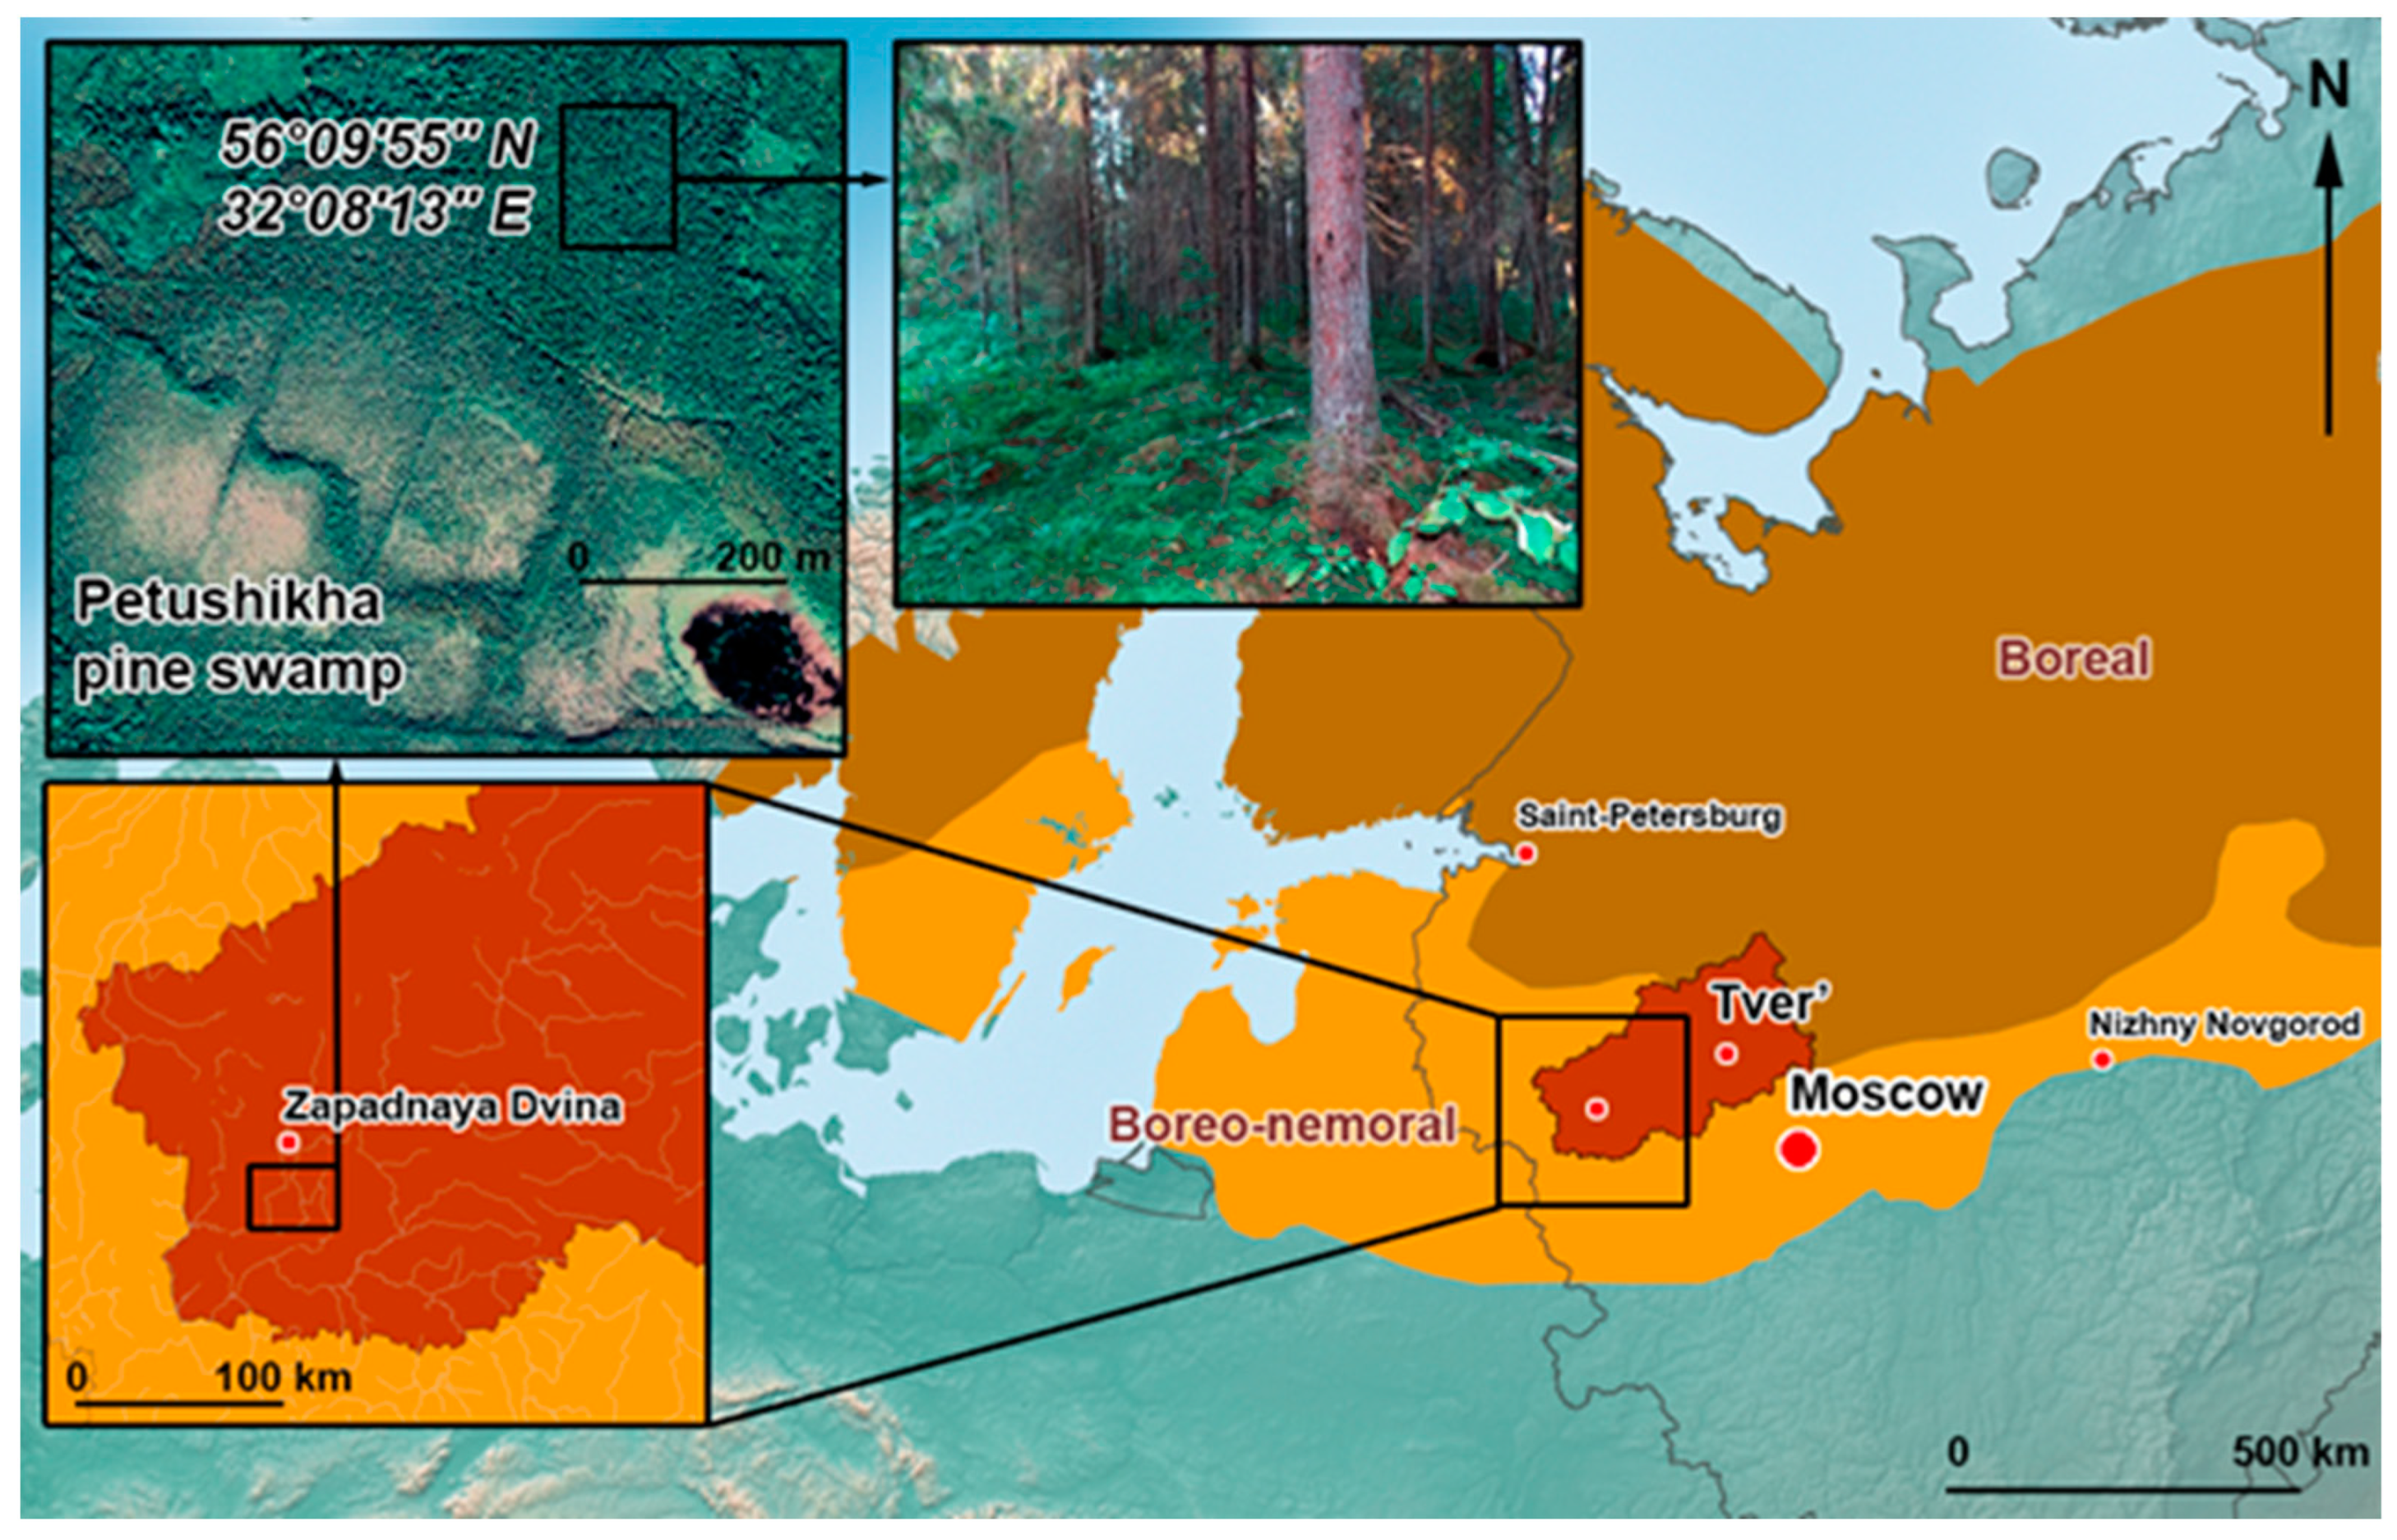
2.1. Study Location

This research was carried out in a pine swamp (56°09′57″ N, 32°08′13″ E) which is part of the large minerotrophic swamp “Petushikha” located in the boreo-nemoral zone of European Russia (Figure 1).
The formation of the “Petushikha” swamp is associated with the swamping and peating of the lake which remained after the cessation of the runoff of glacial melt waters. The filling of the lake with sapropel and the beginning of swamping date to the preboreal period of the Holocene. Throughout the history of its development, this swamp massif was under the influence of a powerful ecological factor—rich and abundant water and mineral nutrition due to alluvial slope waters from the moraine hills adjacent to the swamp [36]. In the direction from the center of the swamp to the peripheral areas, several swamp microlandscapes of the minerotrophic type are distinguished, one of which, with an area of 3.5 ha, is the pine swamp. It occupies a flow-through depression. The water–mineral nutrition is carried out by atmospheric, soil–ground, and alluvial slope (transit) waters. The microrelief is well expressed, most often in the form of near-stem tussocks 25–30 cm high.
The pine swamp where the samples were collected has been a permanent sample area of the West Dvina Peatland-Forest Station of the Institute of Forest Science, Russian Academy of Sciences (Tver region, Russia), since 1978 [37].
The climate of the study area is temperate continental. It is characterized by relatively warm summers, moderately cold winters, stable snow cover, and well-defined transition seasons. The mean annual temperature ranges from 3.0 to 4.4 °C, with an average maximum of 20 °C in July and an average minimum of −15 °C in January. The mean annual precipitation is 550–750 mm, and 80% of the rainfall occurs between May and September. The duration of the frosty period is 140–145 days. Snow cover reaches its maximum thickness (40–45 cm) at the end of February. The depth of soil freezing under the forest canopy is 20–30 cm [36].

2.2. Phytosociological Records

Phytocenosis is the swamp-grass pine forest. Vegetation is represented by four tiers: tree, shrub, grass, and moss. The tree layer is formed by pine (Pinus sylvestris L.), birch (Betula pubescens Ehrh.), spruce (Picea abies (L.) H. Karst.), and partially alder (Alnus glutinosa (L.) Gaertn.). The shrub layer is dominated by mountain ash (Sorbus aucuparia L.), alder buckthorn (Frangula alnus Mill.), red elderberry (Sambucus racemosa L.), guelder rose (Viburnum opulus L.), fly honeysuckle (Lonicera xylosteum L.), and willow (Salix caprea L.; S. cineria L.; S. aurita L.; S. myrsinifolia L.). In the herbaceous layer, the background species are purple moor-grass (Molinia coerulea (L.) Moench.), fibrous tussock-sedge (Carex appropinquata Schum.), touch-me-not balsam (Impatiens noli-tangere L.), water avens (Geum rivale L.), narrow buckler-fern (Dryopteris carthusiana (Vill.) H.P. Fuchs.), marsh hawk’s-beard (Crepis paludosa L.), and swamp horsetail (Equisetum fluviatile L.). The moss layer is represented by individual spots: Pleuroziums chreberi (Brid.) Mitt.; Dicranum polysetum Brid.; D.scorparium Hedw.; Hylocomium splendens (Hedw.) Schimp.; Rhytidiadelpus triquetrus (Hedw.) Warnst.; Plagiomnium affine (Blandow ex Funck); Polytrichum commune Hedw.; and Sphagnum girgensohnii Russow.

2.3. Soil Cover

The soils of the pine swamp under study are fibric histosols (WRB). Hereinafter, for convenience, the term “fen” will be used due to the predominance of minerotrophic conditions in this swamp. The soil-forming rock is mixed-algal sapropel. The thickness of peat deposits, within the boundaries of the microlandscape, varies from 3.0 to 7.0 m.

2.4. Sampling Procedure

Samples from the fen were collected in the third week of September 2021. During sampling, the air temperature was 12 °C, air humidity was 75%, and soil temperature was 4 °C; there was no precipitation. At the time of sampling, the groundwater level was at the mark of 40 cm below the top layer of the surface.
For sampling within the fen under study, we selected three individual points (1—56°09′56″ N, 32°08′13″ E; 2—56°09′56″ N, 32°08′11″ E; 3—56°09′55″ N, 32°08′10″ E). At each sampling point, a column was bored using a stainless-steel peat corer TBG-1 (Russia) with a diameter of 15 cm equipped with nozzles 50 cm long. Peat cores were extracted sequentially from the depths 0–20 cm, 20–30 cm, 30–50 cm, 50–100 cm, 100–150 cm, 150–200 cm, 200–250 cm, 250–300 cm, and 300–365 cm. Peat samples were collected from these depths under sterile conditions. In addition, we collected litter from coniferous and deciduous trees. The peat and litter samples were placed in sterile plastic containers which were loaded into cooler bags and delivered to the laboratory. Molecular genetic analysis of each sample from the selected depth intervals was carried out in triplicate. Before DNA extraction, samples were stored for 5 days at −18 °C. The samples for determining the main characteristics of peat were stored in a refrigerator at +4 °C within a month.

2.5. Sample Characterization

The degree of peat decomposition (DPD) and the botanical composition of peat were determined according to the procedure [38]; pH of KCl solution was measured on an EV-74 ionometer (Factory of Special Instruments and Technological Equipment, Gomel, Belarus) equipped with an ESL-43-07 electrode [39]; the content of total carbon and nitrogen were detected using the method of dry combustion in an oxygen flow with a Vario EL III CHNS analyzer (Elementar, Langenselbold, Germany).

2.6. DNA Isolation, Amplification, and Sequencing of the 16S rRNA Gene

Total genomic DNA from peat samples was extracted using a Power Soil DNA isolation kit (MO BIO Laboratories, Carlsbad, CA, USA) according to the manufacturer’s recommendations and was stored at −20 °C. From 4.8 to 5.5 µg of DNA per sample was isolated.
The purified DNA preparation was used as a template for PCR with a pair of primers to the V3–V4 regions of the 16S rRNA gene: Pro341F и Pro806R [40]. The primers were supplemented with oligonucleotide identifiers for sequencing on MiSeq (Illumina, San Diego, CA, USA). The 16S rRNA gene fragments were amplified using 5 × Taq Red buffer and HS Taq polymerase (Evrogen, Moscow, Russia). The reaction mixture contained 5 µL of each primer (6 µM concentration), 5 µL DNA solution, and 15 µL PCR mix (1 U polymerase, 0.2 mM of each dNTP, and 2.5 mM Mg2+). DNA was amplified using the iCycler thermocycler model from Bio-Rad (Hercules, CA, USA). The PCR reaction conditions for DNA amplification were as recommended by [40]: initial denaturation at 98 °C for 2 min, followed by 35 cycles of annealing beginning at 65 °C and ending at 55 °C for 15 s, and elongation at 68 °C for 30 s. The annealing temperature was lowered by 1 °C every cycle until it reached 55 °C, which was used for the remaining cycles.
The obtained PCR fragments were cleaned via QIA quick columns according to the manufacturer’s protocol. Each PCR fragment was dissolved in 50 μL of TE buffer; the obtained material was sufficient for further analysis. The nucleotide sequences of variable 16S ribosomal RNA gene fragments from metagenomic DNA samples were determined by high-throughput sequencing. High-throughput sequencing was performed using the MiSeq system (Illumina, San Diego, CA, USA) with a MiSeq Reagent Kit v3 (600 cycles) (Illumina), as recommended by the manufacturer.

2.7. Bioinformatics Analysis

The sequencing data were processed using the automated QIIME algorithm [41], including the combination of forward and reverse reads, removal of technical sequences, filtering of sequences with low reliability of individual nucleotides (quality < Q20), and filtering of chimeric sequences. To partition the sequences into operational taxonomic units, an algorithm with an open reference classification threshold of 97% was used. Alignment of reads for the 16S rRNA sequence and distribution of sequences by taxonomic units was performed using the Silva (Bremen, Germany) database (SILVA, https://www.arb-silva.de/aligner/, v. 1.2.11, accessed on 29 September 2021, SILVA reference database release 138.1) [42].

2.8. Statistical Analysis and Functional Characterization

Statistical analysis was carried out using Microsoft Excel 2007 (Microsoft Corp., Redmond, WA, USA) and Rstudio (the vegan package v1.8-8; R Foundation for Statistical Computing, Vienna, Austria) [43]. Alpha diversity of the bacterial communities was estimated using the -alpha_div workflow. A one-way ANOVA test was performed using online ANOVA Calculator (https://goodcalculators.com/one-way-anova-calculator, accessed on 15 October 2023). The difference was considered significant if the p value was less than 0.05.
The functional characteristics of the microorganisms were predicted using the Global Mapper module of the iVikodak (Pune, India) software package (https://web.rniapps.net/iVikodak/global.php, accessed on 18 July 2022) [44] and the Kyoto Encyclopedia of Genes and Genomes (KEGG, Kyoto, Japan) database (https://www.genome.jp/kegg/mapper/color.html, accessed on 18 July 2022) [45]. Heat maps were constructed using the ClustVis (Tartu, Estonia) Internet resource (http://biit.cs.ut.ee/clustvis/, accessed on 8 April 2021).

2.9. Data Availability

The raw data generated from 16S rRNA gene sequencing were deposited in the NCBI Sequence Read Archive (SRA) and are available via the BioProject PRJNA101381.

3. Results

3.1. Characterization of Peat Samples and Isolation of Acrotelm and Catotelm

The soil profile is composed of woody–sedge peat with a degree of peat decomposition (DPD) of 35%–42%, woody peat with a DPD of 45%–52%, and sedge–sphagnum peat with a DPD of 30%. In most of the profile, the pH varied from 5.6 to 5.8 and increased to 6.0 only in the deepest layer. The total carbon content in the studied soil was in the range of 49%–51%; the total nitrogen content was 2%–3% (Table 1).
In 2018–2022, the groundwater level in the studied fen profile seasonally varied, reaching a depth of about 18–50 cm below the top layer of the surface. The boundary between the acrotelm and catotelm coincides with the maximum groundwater level during summer drying (50 cm). Accordingly, in the present study, we took the upper 0–50 cm layer of the profile as the acrotelm, and the 50–365 cm layer as the catotelm.

3.2. Characterization of Prokaryotic Community Diversity

There were from 792 to 7740 reads per peat sample, with an average of about 2312 reads. The read length for sequencing varied from 376 to 450 bp, with an average of about 420 bp.
The one-way ANOVA test revealed a significant effect (p < 0.0005; Ƞ2 = 0.95–0.97) of the factor “Depth of sampling” on the alpha diversity indices (the number of identified OTUs, Shannon index, and Chao1 index) of prokaryotic complexes in the studied fen profile.
The 0–20 cm and 150–200 cm layers were characterized by higher biodiversity according to the Shannon index (6.7 and 7.1, respectively), OTUs (934 and 1461), and Chao1 index (3231 and 4063) than the upper and lower layers. The overall diversity for all indices was minimal in the litter, the 30–50 cm layer, and the deepest layers of the profile (250–300 cm and 300–365 cm). The remaining layers were characterized by average indices: OTUs at the level of 372–582; Chao1 index in the range of 1394–2050; Shannon index in the range of 5.8–6.3 (Table 2).
To verify the relationship between diversity indices (OTUs, Shannon index, and Chao1 index) and peat characteristics (Degree of Peat Decomposition, pH, Total Carbon, Total Nitrogen), we calculated the Spearman’s rank correlation. It should be noted that no significant correlations (p < 0.05) were found between the studied parameters.

3.3. Taxonomic Composition of Prokaryotic Communities at the Bacteria/Archaea Domains

The prokaryotic community at different depths of the studied fen profile was represented mainly by the bacteria domain. The archaea domain did not exceed 10% of all sequences (Table 3).
The proportion of archaea in the litter comprised 2.8%; in the upper 1 m layer, it was 0.2%–1.9%; in the lower 2 m layer, it increased to 3.6%–9.9%, and it decreased to 1.8% in the deepest layer of the fen profile (300–365 cm). The proportion of archaea in the profile reached its maximum values in the layer of 100–150 cm. In all the studied samples, the index of the archaea/bacteria ratio varied from 0.002 to 0.10.

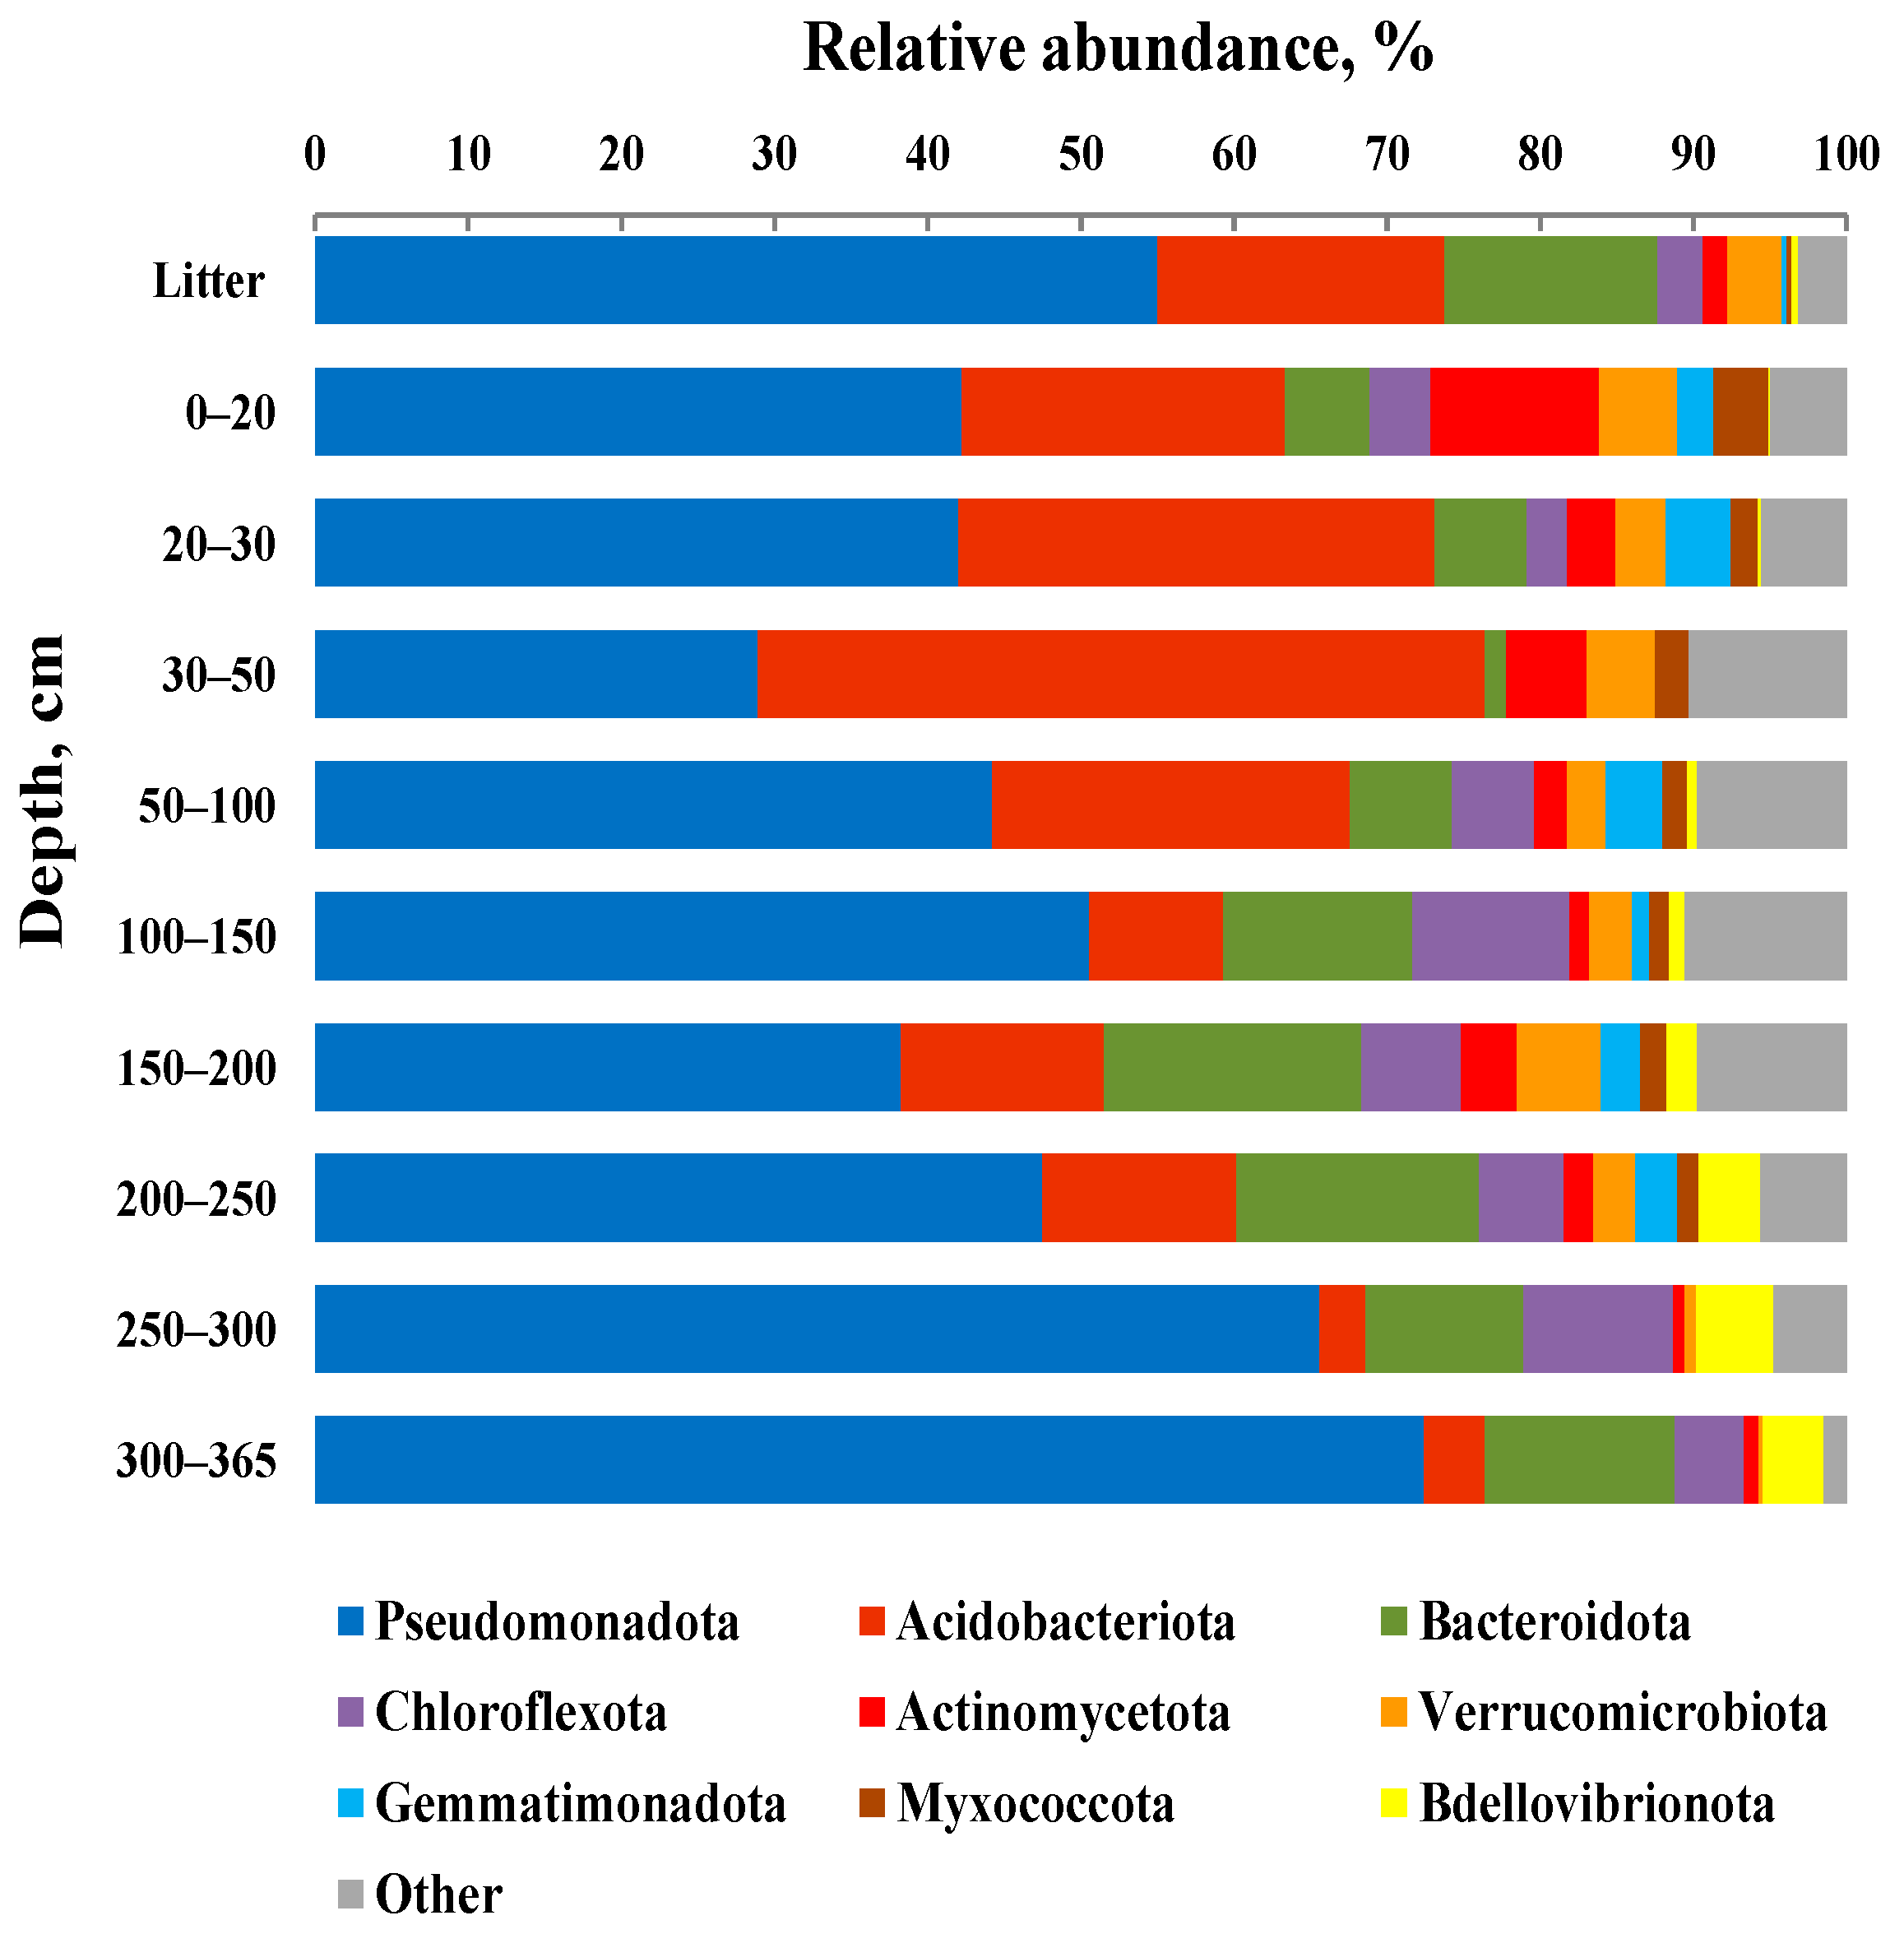
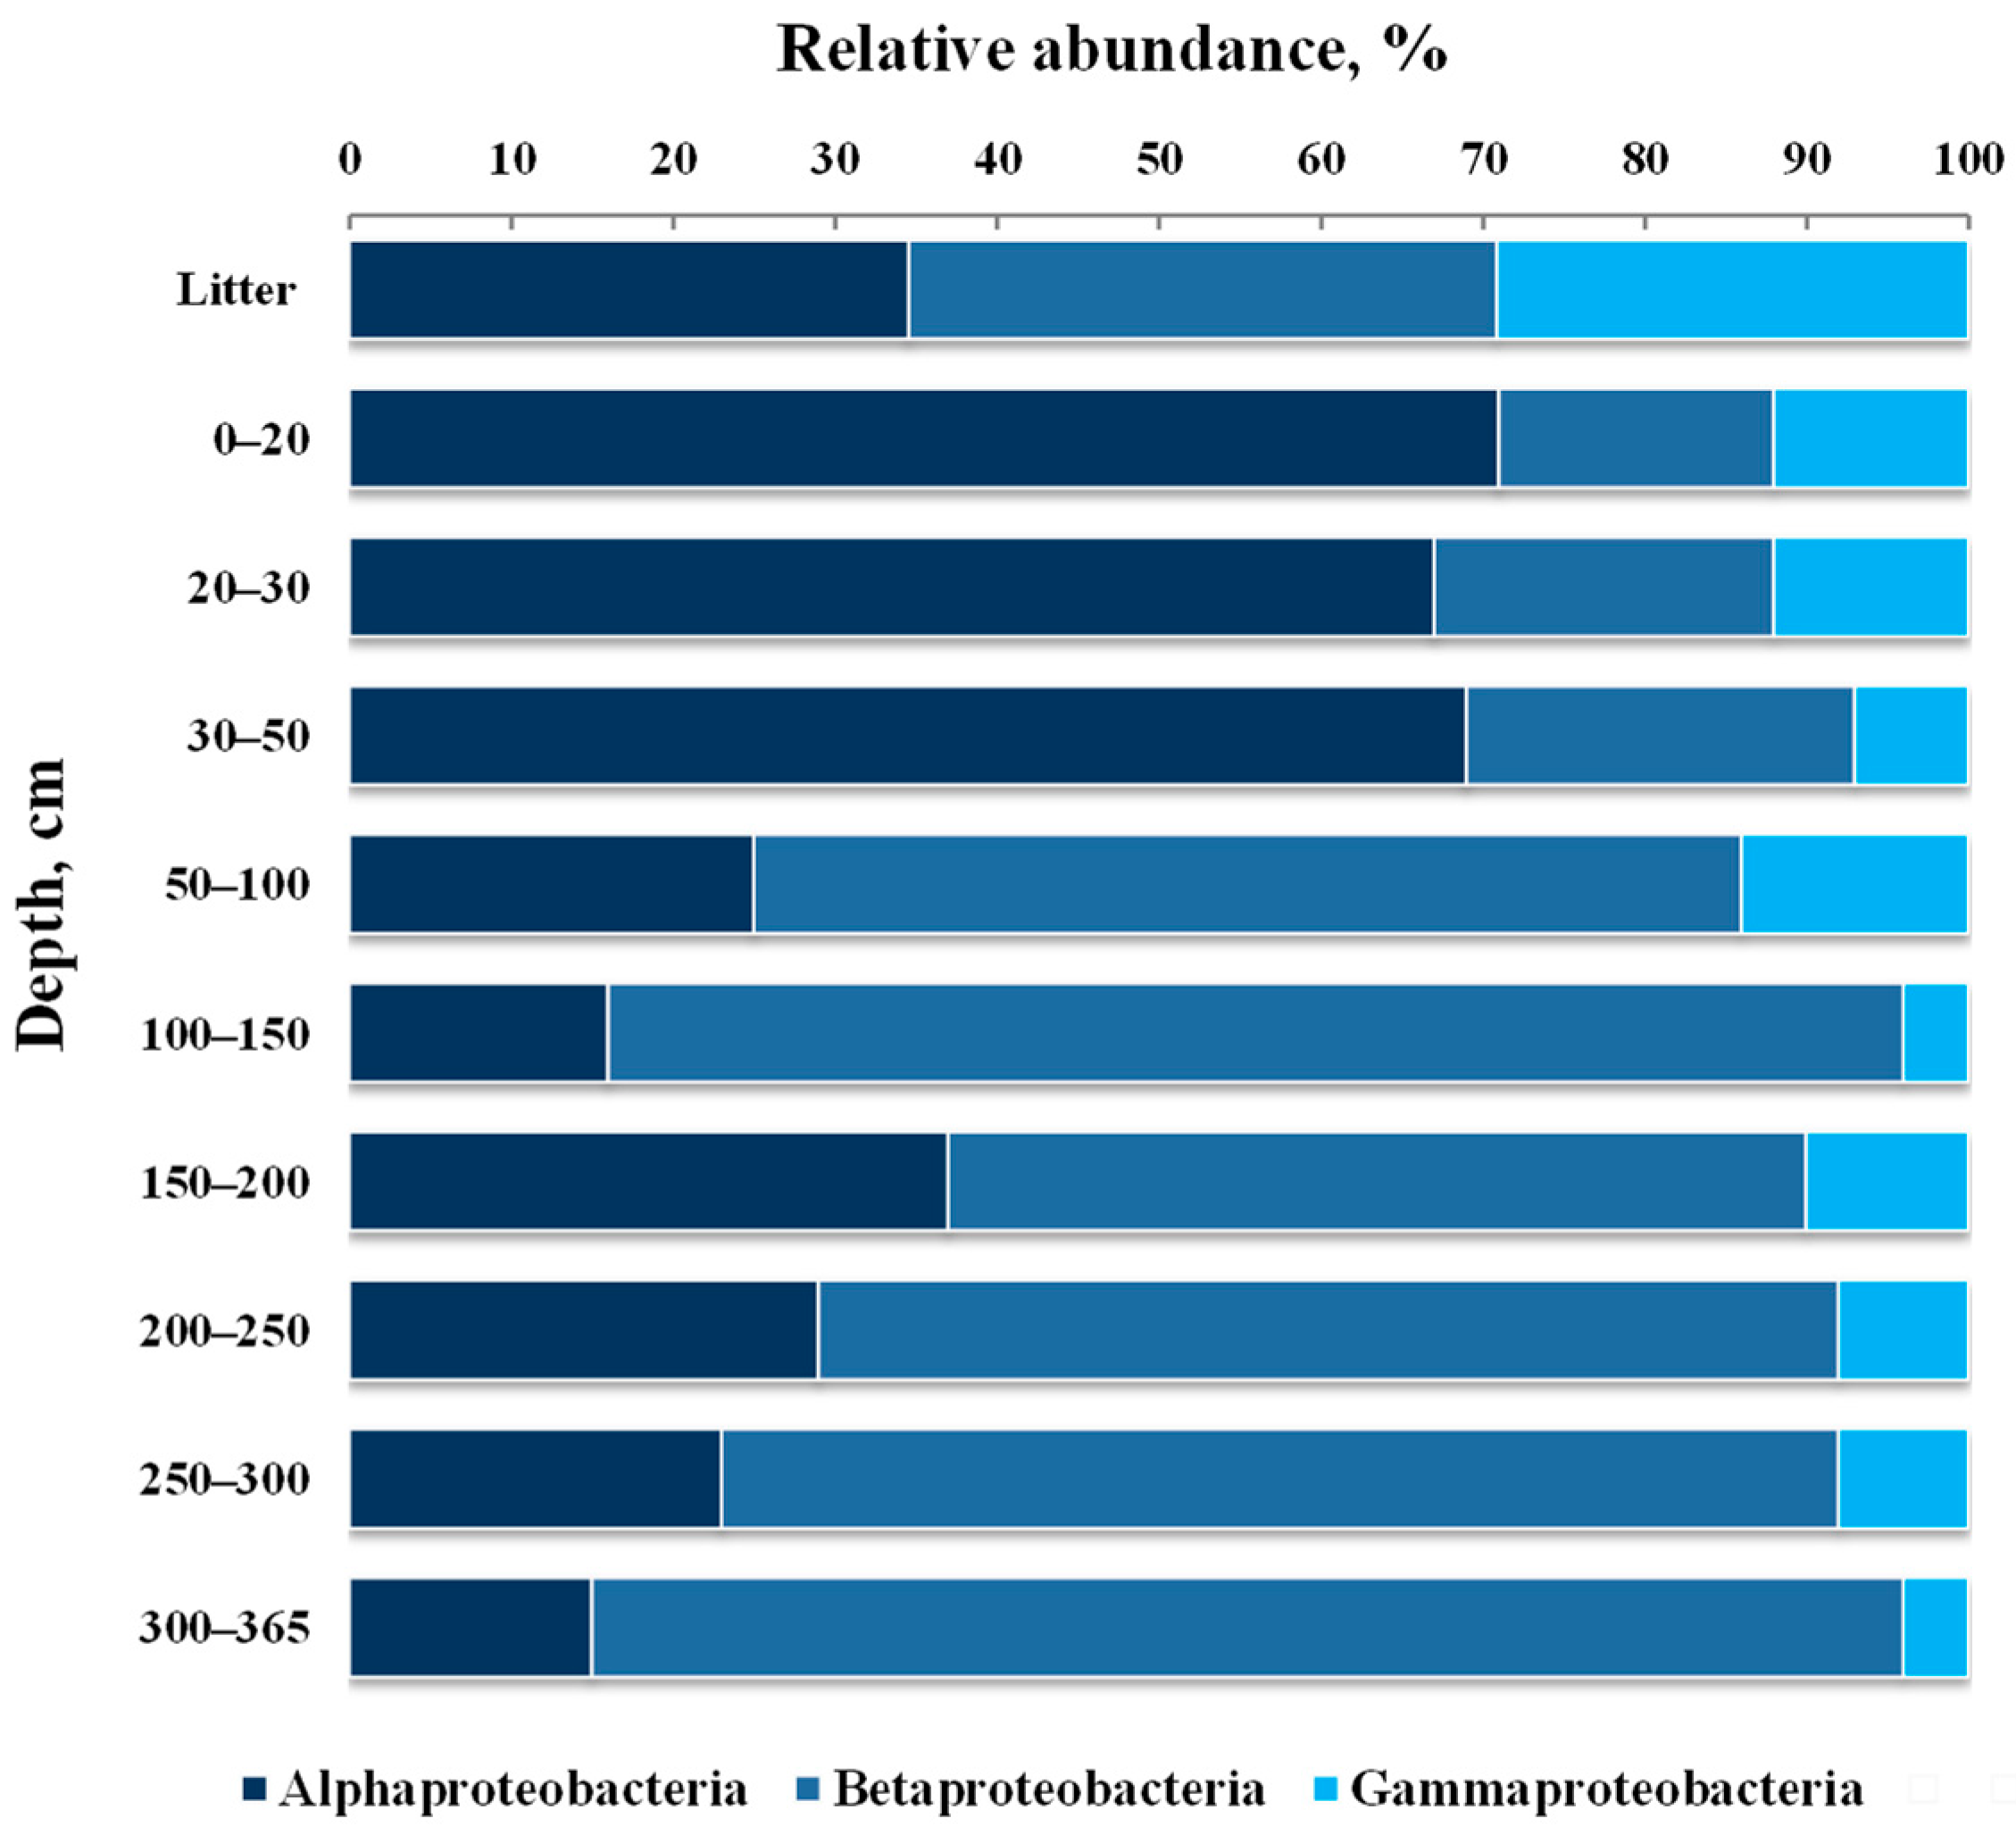
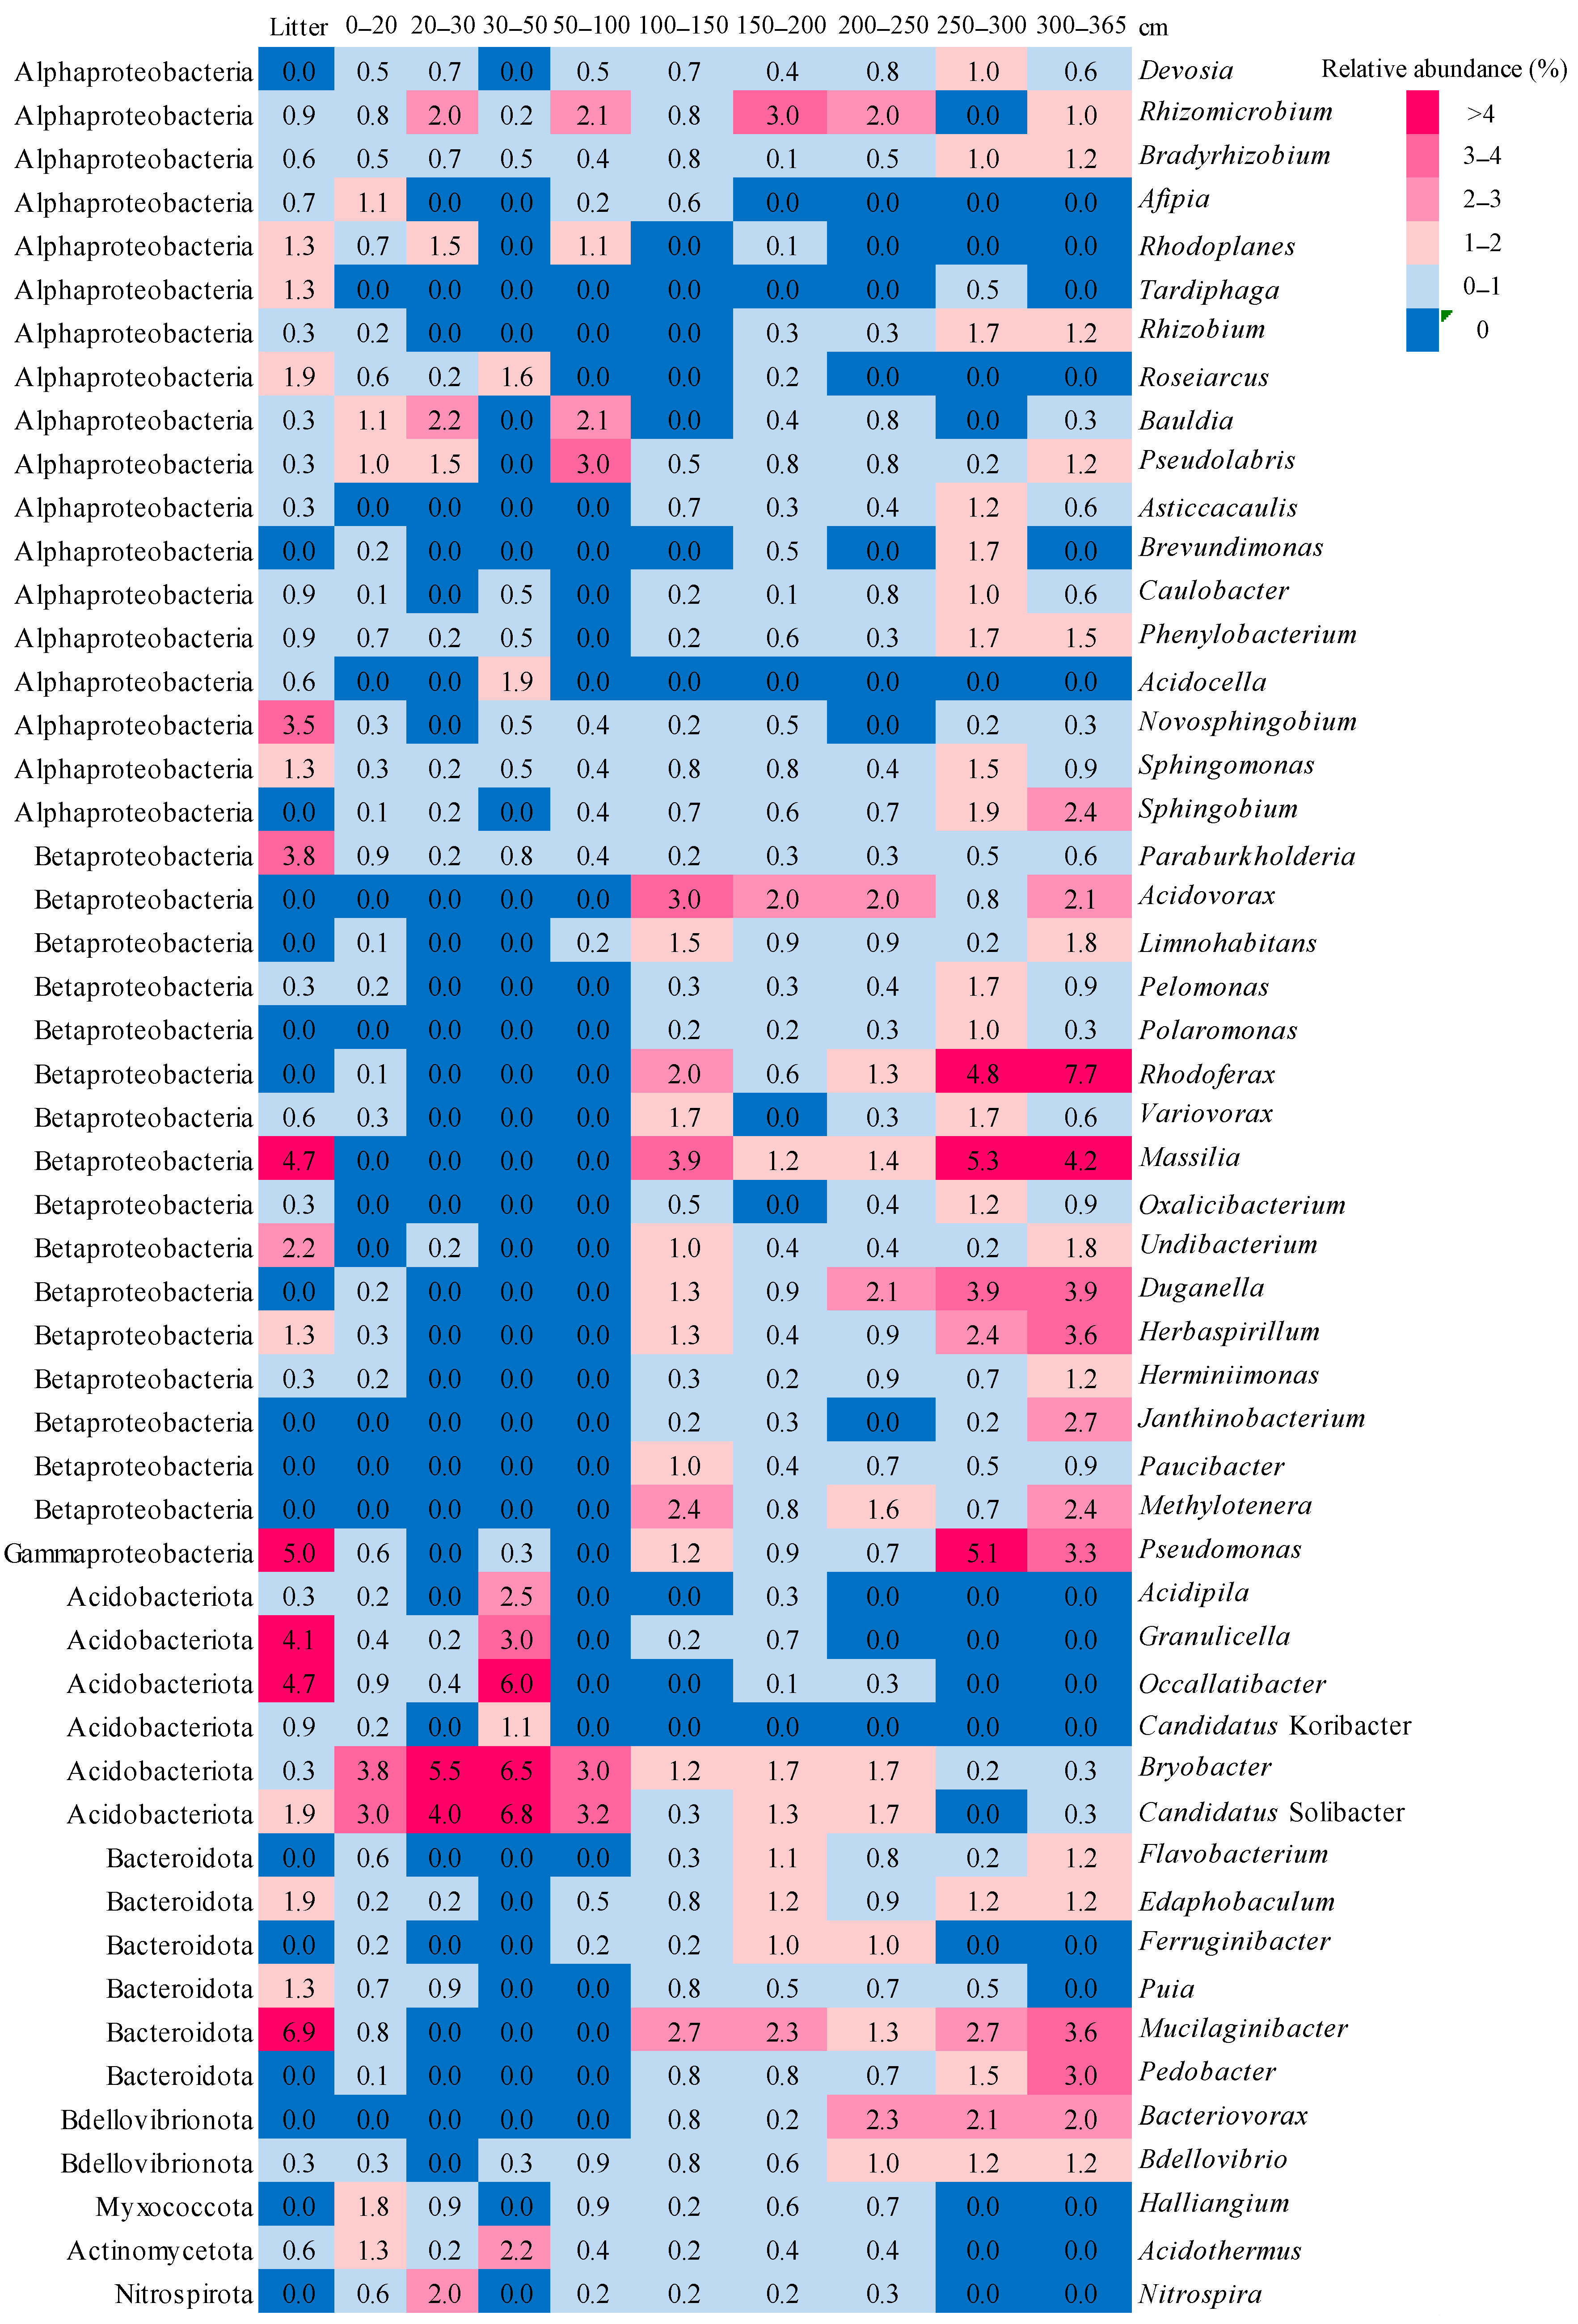
3.4. Taxonomic composition of Bacterial Communities

A total of 28 different bacterial phyla were identified, of which 11 were present at all depths of the studied fen profile (Figure 2). The bacteria domain was primarily represented by three phyla: Pseudomonadota (29%–72% of all analyzed bacteria sequences), Acidobacteriota (3%–47%), and Bacteroidota (1%–17%). In total, these phyla comprised 69 to 89% in different horizons. Other phyla, the percentage of which did not exceed 11%, were represented in different proportions: Chloroflexota (1%–10%), Actinomycetota (1%–11%), Verrucomicrobiota (0.3%–5.5%), Gemmatimonadota (0.2%–4%), Myxococcota (0.3%–4%), and Bdellovibrionota (0.2%–5%). The total percentage of minor phyla, the proportion of which in the bacteria domain did not exceed 3%, varied from 3 to 10% (Figure 2).
The spectrum of minor phyla (other group in Figure 2) was extensive and included representatives of Bacillota, Cyanobacteria, Desulfobacterota, Methylomirabilota, Nitrospirota, Planctomycetota, Patescibacteria, Sva0485, Abditibacteriota, Armatimonadota, Caldisericota, Campylobacterota, and Spirochaetota, as well as the candidate divisions RCP2–54, MBNT15, FCPU426, LCP-89, TA06, and WPS-2.
The predominance of the Pseudomonadota phyla in the bacteria domain was found throughout the profile, except for the layer of 30–50 cm, where dominants were representatives of Acidobacteriota. It should be noted that the proportion of Acidobacteriota was the highest in the upper 1 m layer—21%–48%—in the deep layers, it decreased to 3%–13%. A similar trend was found for Actinomycetota and Myxococcota: the proportions of these phyla were maximal in the upper 50 cm of the profile. The distribution of the phyla Bacteroidota, Chloroflexota, and Bdellovibrionota throughout the profile had a different character. The proportion of these phyla was maximal in the lower layer (100–365 cm) but not in the upper layer of the profile (0–100 cm). While in the lower layer it was 12%–17% for Bacteroidota, 5%–10% for Chloroflexota, and 1%–5% for Bdellovibrionota, in the upper layer it was 1%–7%, 1%–5%, and 0.1%–0.6%, respectively. For the phyla Verrucomicrobiota and Gemmatimonadota, a predominantly uniform distribution throughout the profile was shown. In most of the profile, their proportions fluctuated from 1% to 5% and decreased to minimum values (<1%) only at a depth of 300–365 cm (Figure 2).
Let us analyze the taxonomic structure of the most numerous bacterial phyla identified in the fen profile.
The Pseudomonadota phyla was represented by three classes: Alphaproteobacteria, Betaproteobacteria, and Gammaproteobacteria (Figure 3). Among them, representatives of Alphaproteobacteria (15%–71%) and Betaproteobacteria (17%–81% of the phylum Pseudomonadota) were predominant. The proportion of Gammaproteobacteria in most of the profile was low, from 4% to 12%.
Representatives of Alphaproteobacteria, Betaproteobacteria, and Gammaproteobacteria were identified throughout the entire profile; however, the ratio of two classes, alpha and beta, varied significantly. In the upper 50 cm layer, representatives of Alphaproteobacteria were dominant (61%–71%), whereas in the lower 3 m layer, the dominants were Betaproteobacteria (53%–81%). The proportion of representatives of Gammaproteobacteria, as well as Alphaproteobacteria, was the highest in the upper horizons and amounted to 12%–18%. In the litter, in contrast to the layers of the peat profile, the proportions of the alpha, beta, and gamma classes were characterized by similar values: 35%, 36%, and 29%, respectively.
Among the Alphaproteobacteria, the most numerous in the upper 1 m layer of the studied fen were bacteria of the Xanthobacteraceae family, which comprised 19% to 29% of all identified Alphaproteobacteria; in the lower 3 m layer—bacteria of the Caulobacteraceae (from 18% to 34%) and Sphingomonadaceae families (from 10% to 33%). The fen profile also included representatives of the Acetobacteraceae, Rhodospirillaceae, Beijerinckiaceae, Hyphomicrobiaceae, Methylobacteriaceae, Nitrobacteraceae, Rhizobiaceae, Roseiarcaceae, Hyphomonadaceae, and Erythrobacteraceae families. The proportion of some families reached 16% in some horizons. The litter was dominated by representatives of the Caulobacteraceae (29%) and Acetobacteraceae (20%) families. The spectrum of cultivated Alphaproteobacteria included 18 genera, of which representatives of Rhizomicrobium, Bradyrhizobium, Pseudolabris, Phenylobacterium, and Sphingomonas were predominant in all analyzed substrates. The category of frequently occurring genera included representatives of Devosia, Rhizobium, Bauldia, Asticcacaulis, Caulobacter, Novosphingobium, and Sphingobium, while the category of rarely occurring genera included representatives of Rhodoplanes, Roseiarcus, Afipia, Acidocella, Brevundimonas, and Tardiphaga. The proportion of the total number of sequences of each of the listed genera did not exceed 3.5% (Figure 4).
Betaproteobacteria in the upper 1 m layer were predominantly represented by the Burkholderiaceae and Nitrosomonadacea families, while in the lower layer—by representatives of other families, such as Oxalobacteraceae (the proportion of which in different layers varied from 13% to 42%), Comamonadaceae (from 30% to 49%), Methylophilaceae (9% to 34%), and Rhodocyclaceae (2% to 8%). The litter was dominated by bacteria of the Oxalobacteraceae family, comprising 80% of all Betaproteobacteria sequences. The spectrum of cultivated Betaproteobacteria included 16 genera: Paraburkholderia, Acidovorax, Limnohabitans, Pelomonas, Polaromonas, Rhodoferax, Variovorax, Massilia, Oxalicibacterium, Undibacterium, Duganella, Herbaspirillum, Herminiimonas, Janthinobacterium, Paucibacter, and Methylotenera. Bacteria of these genera were found predominantly in the lower layer of the fen profile (100–365 cm); their frequency of occurrence in the profile corresponded to 50%–70%. Among them, the highest was the proportion of Acidovorax (0.8%–3%), Rhodoferax (0.6%–7.7%), Massilia (1.2%–5.3%), Duganella (0.9%–3.9%), and Herbaspirillum (0.9%–3.6%) (Figure 4).
Gammaproteobacteria in the fen profile were predominantly represented by the Pseudomonadaceae family, the representatives of which comprised from 21 to 95% of all identified proteobacteria of this class. In the deep layers, the presence of representatives of the families Coxiellaceae, Oceanospirillaceae, and Cellvibrionaceae was shown, but their relative abundance did not exceed 5%. Among the cultivated genera, representatives of Pseudomonas, Acidibacter, Alkanibacter, Aquicella, Dokdonella, Dyella, Luteibacter, and Rhodanobacter were detected in the studied substrates. The proportion of each of these genera did not exceed 0.3% of the total number of sequences, except for bacteria of the genus Pseudomonas, the proportion of which was much higher (0.3%–5.1%). The maximum values were found in the litter and in the 250–300 cm layer (Figure 4). It should be noted that the frequency of occurrence of bacteria of this genus in the fen profile was quite high and comprised 80%.
The Acidobacteriota phylum in the fen profile was represented by 16 subdivisions (SDs). Among them, the most predominant were bacteria belonging to the class Acidobacteriia (order Acidobacteriales, family Acidobacteriaceae and order Bryobacterales, family Bryobacteraceae). In total, representatives of the class Acidobacteriia in the litter and upper layer (0–50 cm) accounted for 66%–91% of all acidobacteria, while in the lower layer (50–365 cm) they only accounted for 37–60% due to a decrease in the proportion of bacteria of the order Acidobacteriales (4%–26%). For acidobacteria of the class Vicinamibacteria and SD2, no clear patterns in the distribution were identified; their relative abundance throughout the profile varied from 2 to 10% and from 3% to 18%, respectively. The proportion of SD13 increased along the profile from 1%–7% in the upper 1 m layer to 16%–38% in the lower 3 m layer. Only in the lower layer, acidobacteria of the class Holophagae (3%–7%) and SD18 (3%–9%) were identified. Acidobacteria of other subdivisions and class Blastocatellia were found at selective depths of the profile, and their proportion did not exceed 3%. Among the cultivated genera of acidobacteria, representatives of Acidipila, Granulicella, Occallatibacter, Bryobacter, Candidatus Koribacter, and Candidatus Solibacter were identified in the studied profile. While bacteria of the genera Bryobacter and Candidatus Solibacter were detected throughout the profile, acidobacteria of other genera were found predominantly in its upper part. Of note is a high proportion of some genera (3%–6.8% of the total number of all sequences) found in the litter and the upper 1 m layer of the swamp (Figure 4).
Bacteroides in the fen profile were mainly represented by the families Cytophagaceae, Chitinophagaceae, Flavobacteriaceae, and Sphingobacteriaceae and unclassified KD3-93, env.OPS 17, and CWT CU03-E12. Their total proportion of the phyla Bacteroidota was 79%–97%. The litter was dominated by bacteria KD3-93 (65%) and the families Sphingobacteriaceae (28%), while the 0–30 cm layer was dominated by representatives of the families Chitinophagaceae (35%–41%), Flavobacteriaceae (34%), or Cytophagaceae (35%). In the 100–365 cm layer, bacteria of the families Sphingobacteriaceae (11%–36%), Chitinophagaceae (17%–28%), and env.OPS 17 (15%–27%) were predominant. In addition to bacteria of these families, representatives of Flavobacteriaceae and Cytophagaceae were also identified. However, their proportions were lower than in the upper horizons, comprising 1%–6% and 3%–18%, respectively. A special structure was identified in the 30–50 cm layer which, similar to the litter, was dominated by KD3-93 bacteria (48%); however, the subdominants were bacteria of the Chitinophagaceae family (21%) and CWT CU03-E12 (22%). Among the cultivated bacteroids, representatives of the genus Edaphobaculum were identified throughout the profile, while the genera Flavobacterium, Ferruginibacter, Puia, Mucilaginibacter, and Pedobacter were found mainly in its lower layer. Bacteria of the genera Mucilaginibacter, Edaphobaculum, and Puia were detected in the litter at a high proportion, comprising 6.9%, 1.9%, and 1.3%, respectively. Among bacteria of the cultivated genera, the highest was the proportion of representatives of Mucilaginibacter. In the litter, it was 6.9%, and in the 100–365 cm layer—on average, 2.5% (Figure 4).
The phyla Bdellovibrionota in the fen profile was represented by three families, Bdellovibrionaceae, Bacteriovoracaceae, and Oligoflexia, while the phyla Myxococcota was represented by five families: Polyangiaceae, Sandaracinaceae, Phaselicystidacea, Kofleriaceae, and Myxococcaceae. Among bacteria of the cultivated genera, we identified Bacteriovorax, Bdellovibrio, and Halliangium, the proportion of which in some horizons comprised more than 1% of all sequences. It should be noted that bacteria of the genus Bdellovibrio were detected throughout the profile, Bacteriovorax—only in deep layers—Halliangium—at selective depths (Figure 4).
In general, in the studied substrates (litter and peat), the proportion of representatives of cultivated genera of the predominant phyla (Pseudomonadota, Acidobacteriota, and Bacteroidota) ranged from 18% to 60%. They were abundant in the litter (56%) and at depths of 250–300 and 300–365 cm (51 and 60%, respectively). In other layers of the profile, their proportion did not exceed 36%. The proportion of taxonomically characterized bacteria in the fen profile was much higher and ranged from 57% to 83% (on average, 70% throughout the profile).

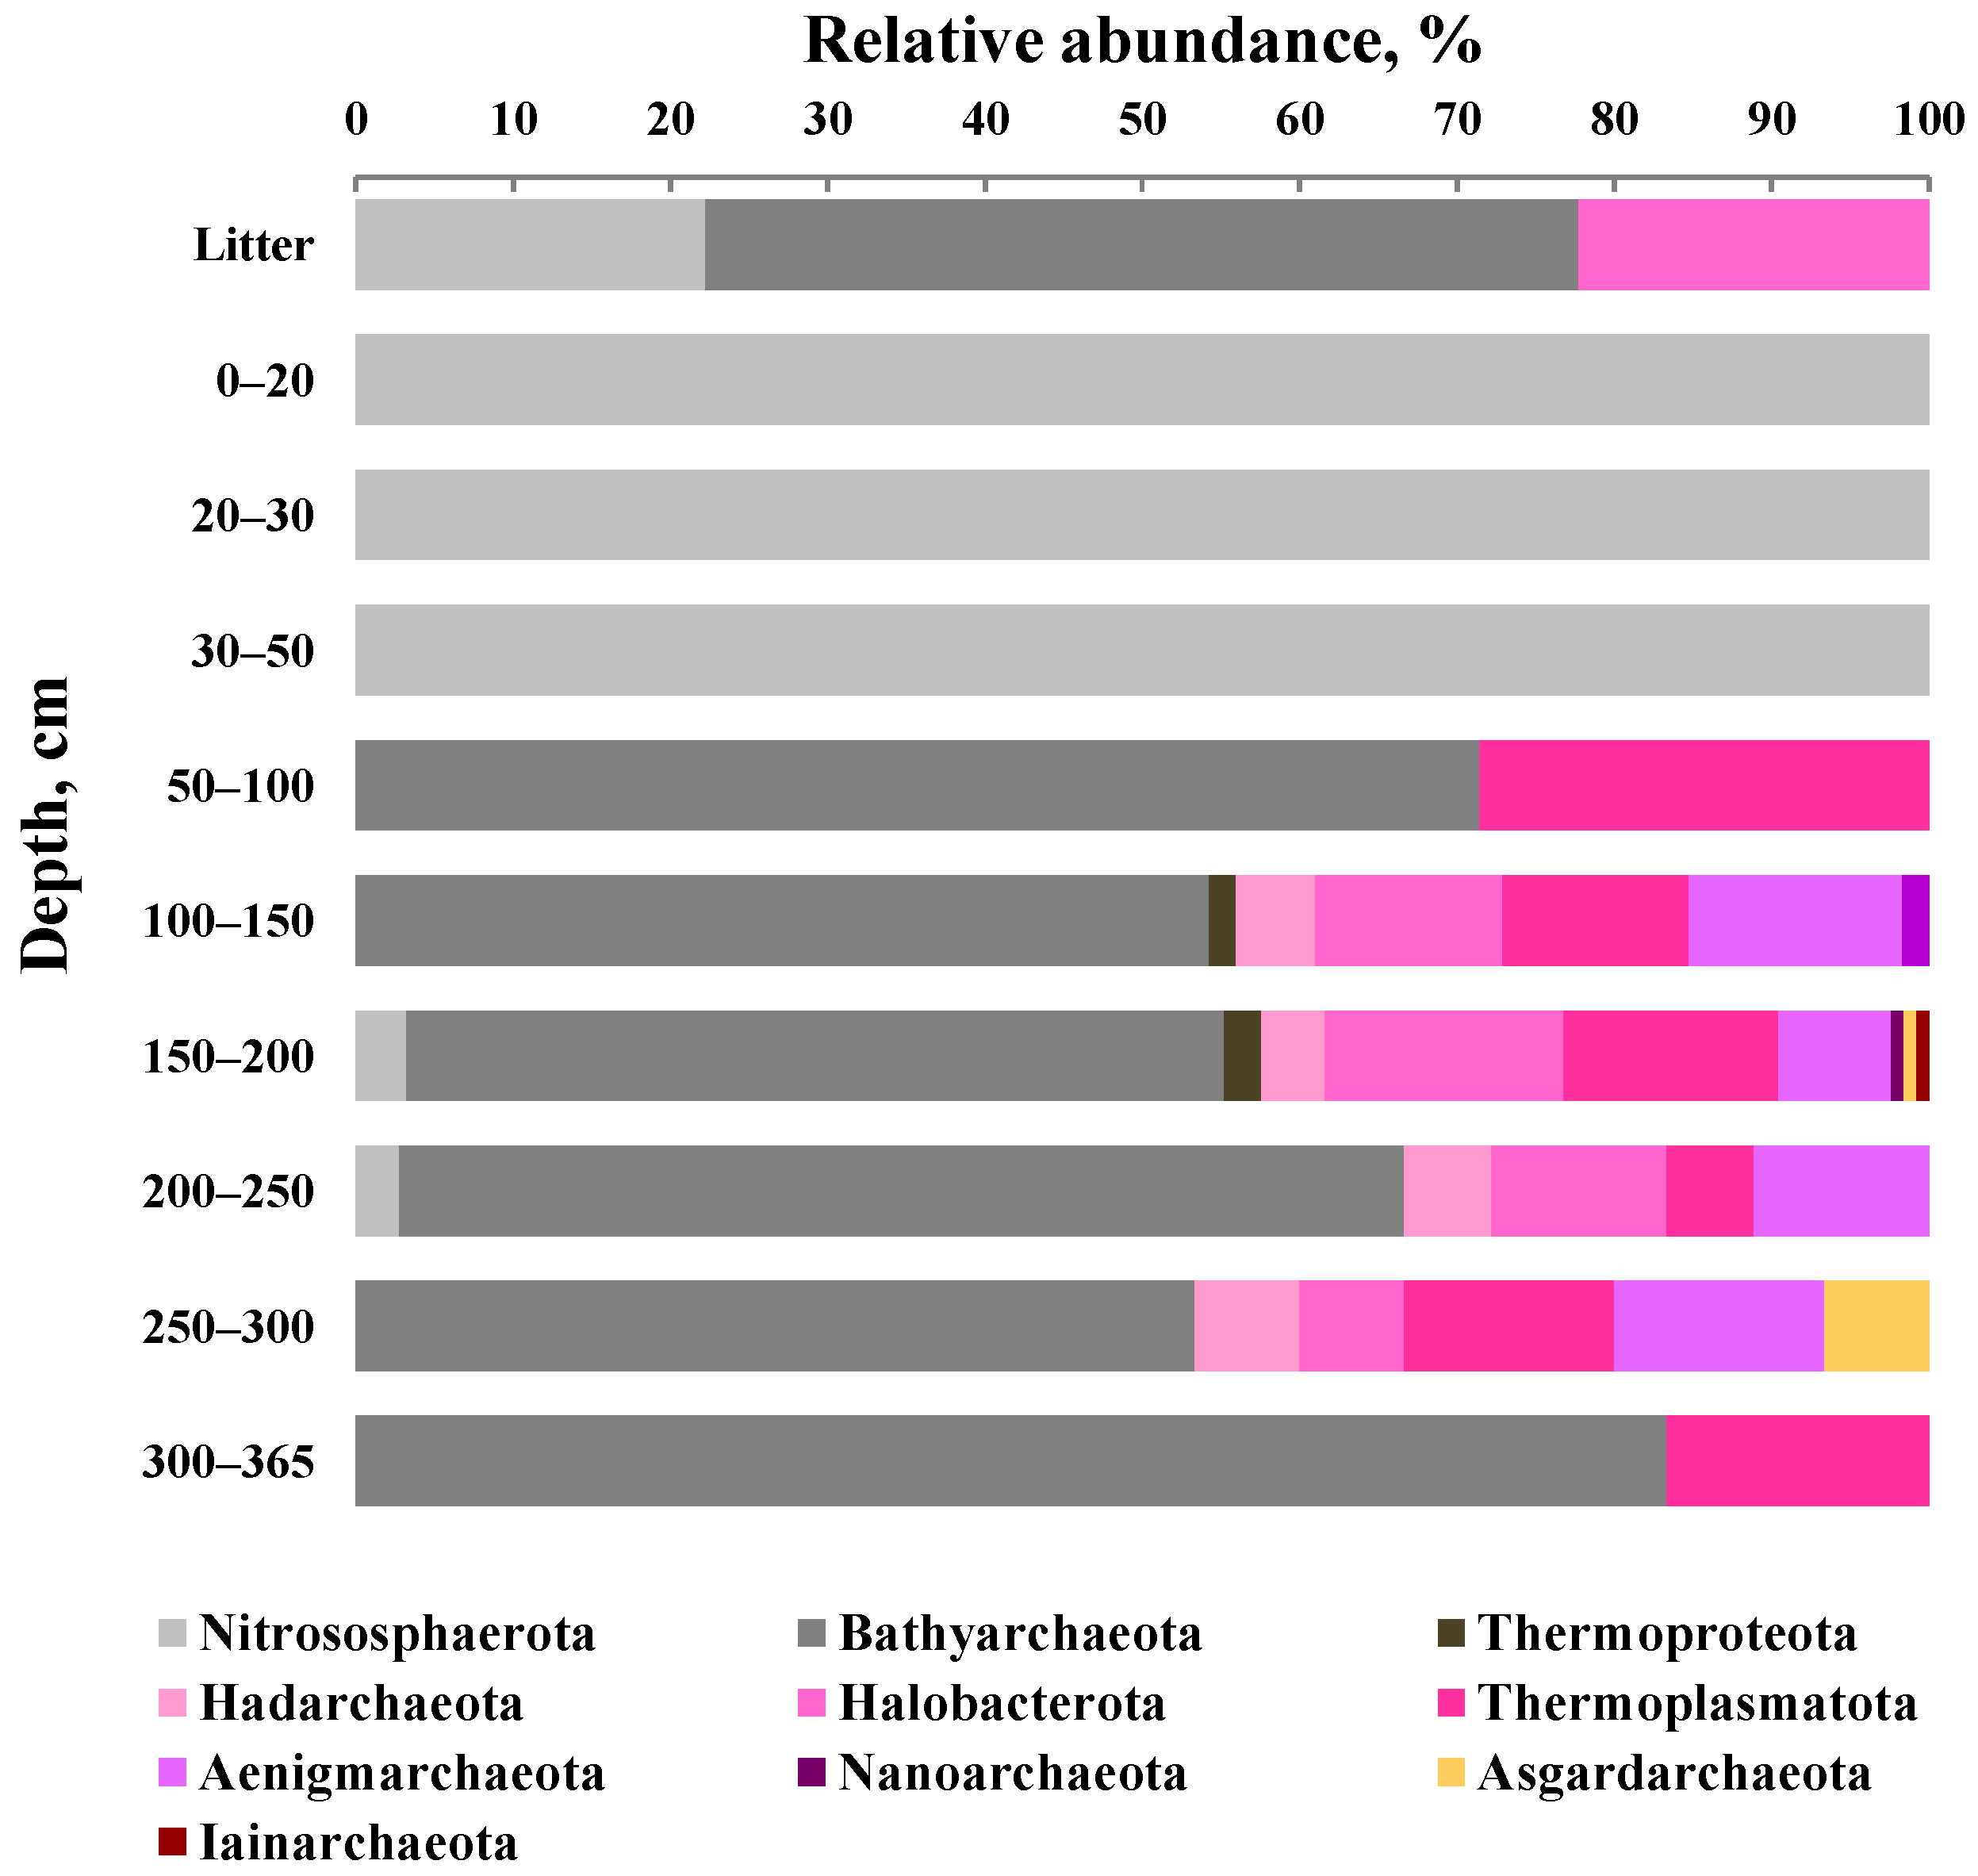
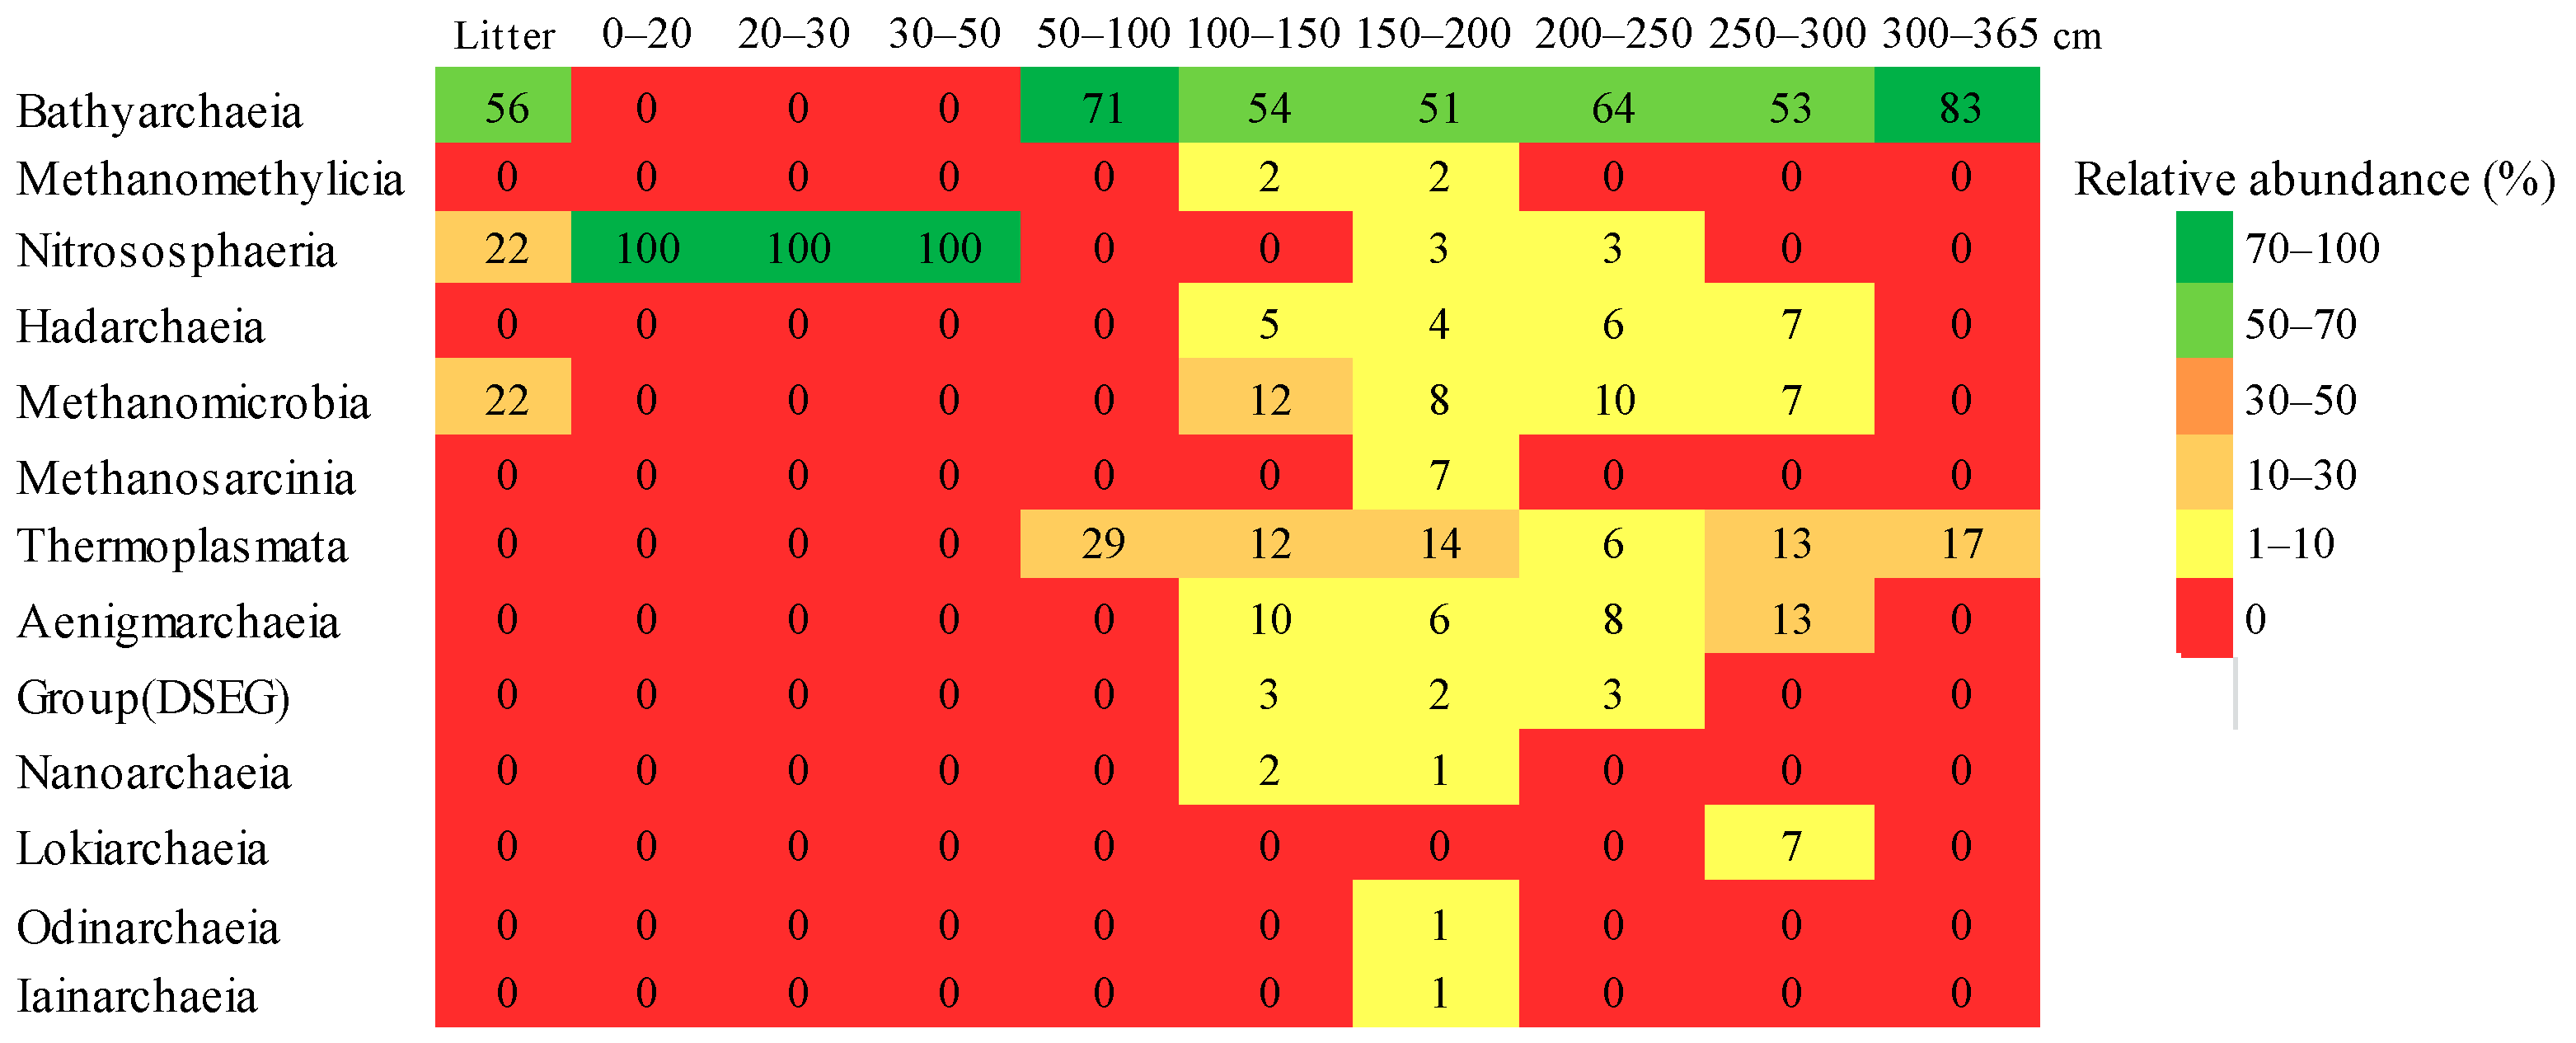
3.5. Taxonomic Composition of Archaeal Communities

The archaea domain in the fen profile was represented by 10 phyla: Nitrososphaerota, Bathyarchaeota, and Thermoproteota (from the superphylum TACK, Proteoarchaeota); Halobacterota, Thermoplasmatota, and Hadarchaeota (from Euryarchaeota); Aenigmarchaeota and Nanoarchaeota (from the superphylum DPANN); and Asgardarchaeota and Iainarchaeota (the candidate divisions) (Figure 5).
The proportion of Proteoarchaeota in the studied profile was from 56 to 100%, the proportion of Euryarchaeota was from 17% to 33%, the proportion of the superphylum DPANN was from 8% to 15%, and the proportion of the candidate divisions was no more than 7%.
In the studied profile, the stratification of the archaeal community at the phyla level was observed. For instance, in the 0–50 cm layer, the monodominance of the phyla Nitrososphaerota was found. The rest of the profile was dominated by representatives of Bathyarchaeota (52%–83%), while Thermoplasmatota (6%–29%), Halobacterota (7%–15%), and Aenigmarchaeota (7%–14%) were subdominants. The group of medium abundance included the phyla Hadarchaeota, comprising 4%–7% of all archaean sequences. The phyla Thermoproteota, Nanoarchaeota, Asgardarchaeota, and Iainarchaeota were identified in one or two layers of the studied profile; their proportion did not exceed 7%. The 100–300 cm layer was characterized by the greatest diversity of archaea that were represented by 6 to 10 phyla. The maximum number of phyla (10) was found in the 150–200 cm layer (Figure 5).
The archaea domain in the fen profile was represented by 13 classes (Figure 6).
Among them, representatives of the Nitrososphaeria and Bathyarchaeia classes were predominant. Members of the class Nitrososphaeria dominated in the upper 50 cm fen profile layer (71%–100% of the archaea domain), Bathyarchaeia dominated in the lower layer (50–365 cm), comprising from 52% to 83%. In the lower layer of the fen profile, archaean classes with an average relative abundance can be distinguished. Such are Thermoplasmata, Methanomicrobia, and Aenigmarchaeia; their proportions were 6%–29%, 7%–12%, and 6%–13%, respectively. The proportion of Hadarchaeia did not exceed 7%, while the proportion of Deep Sea Euryarchaeotic Group (DSEG), Methanomethylicia, Nitrososphaeria, and Nanoarchaeia did not exceed 3%. In some of the studied deep layers, solitary representatives of the classes Lokiarchaeia, Odinarchaeia, Methanosarcinia, and Iainarchaeia were found. In the litter, representatives of three classes, Bathyarchaeia, Nitrososphaeria, and Methanomicrobia, were found, the proportions of which were 56, 22, and 22%, respectively (Figure 6).
Most of the identified archaea belong to uncultivated bacteria; however, representatives of the cultivated genera Candidatus Methanomethylicus, Candidatus Nitrosotenuis, and Candidatus Nitrosotalea from the phyla Thermoproteota and Methanoregula, Methanosaeta, and Candidatus Methanoperedens from the phyla Halobacterota were detected.

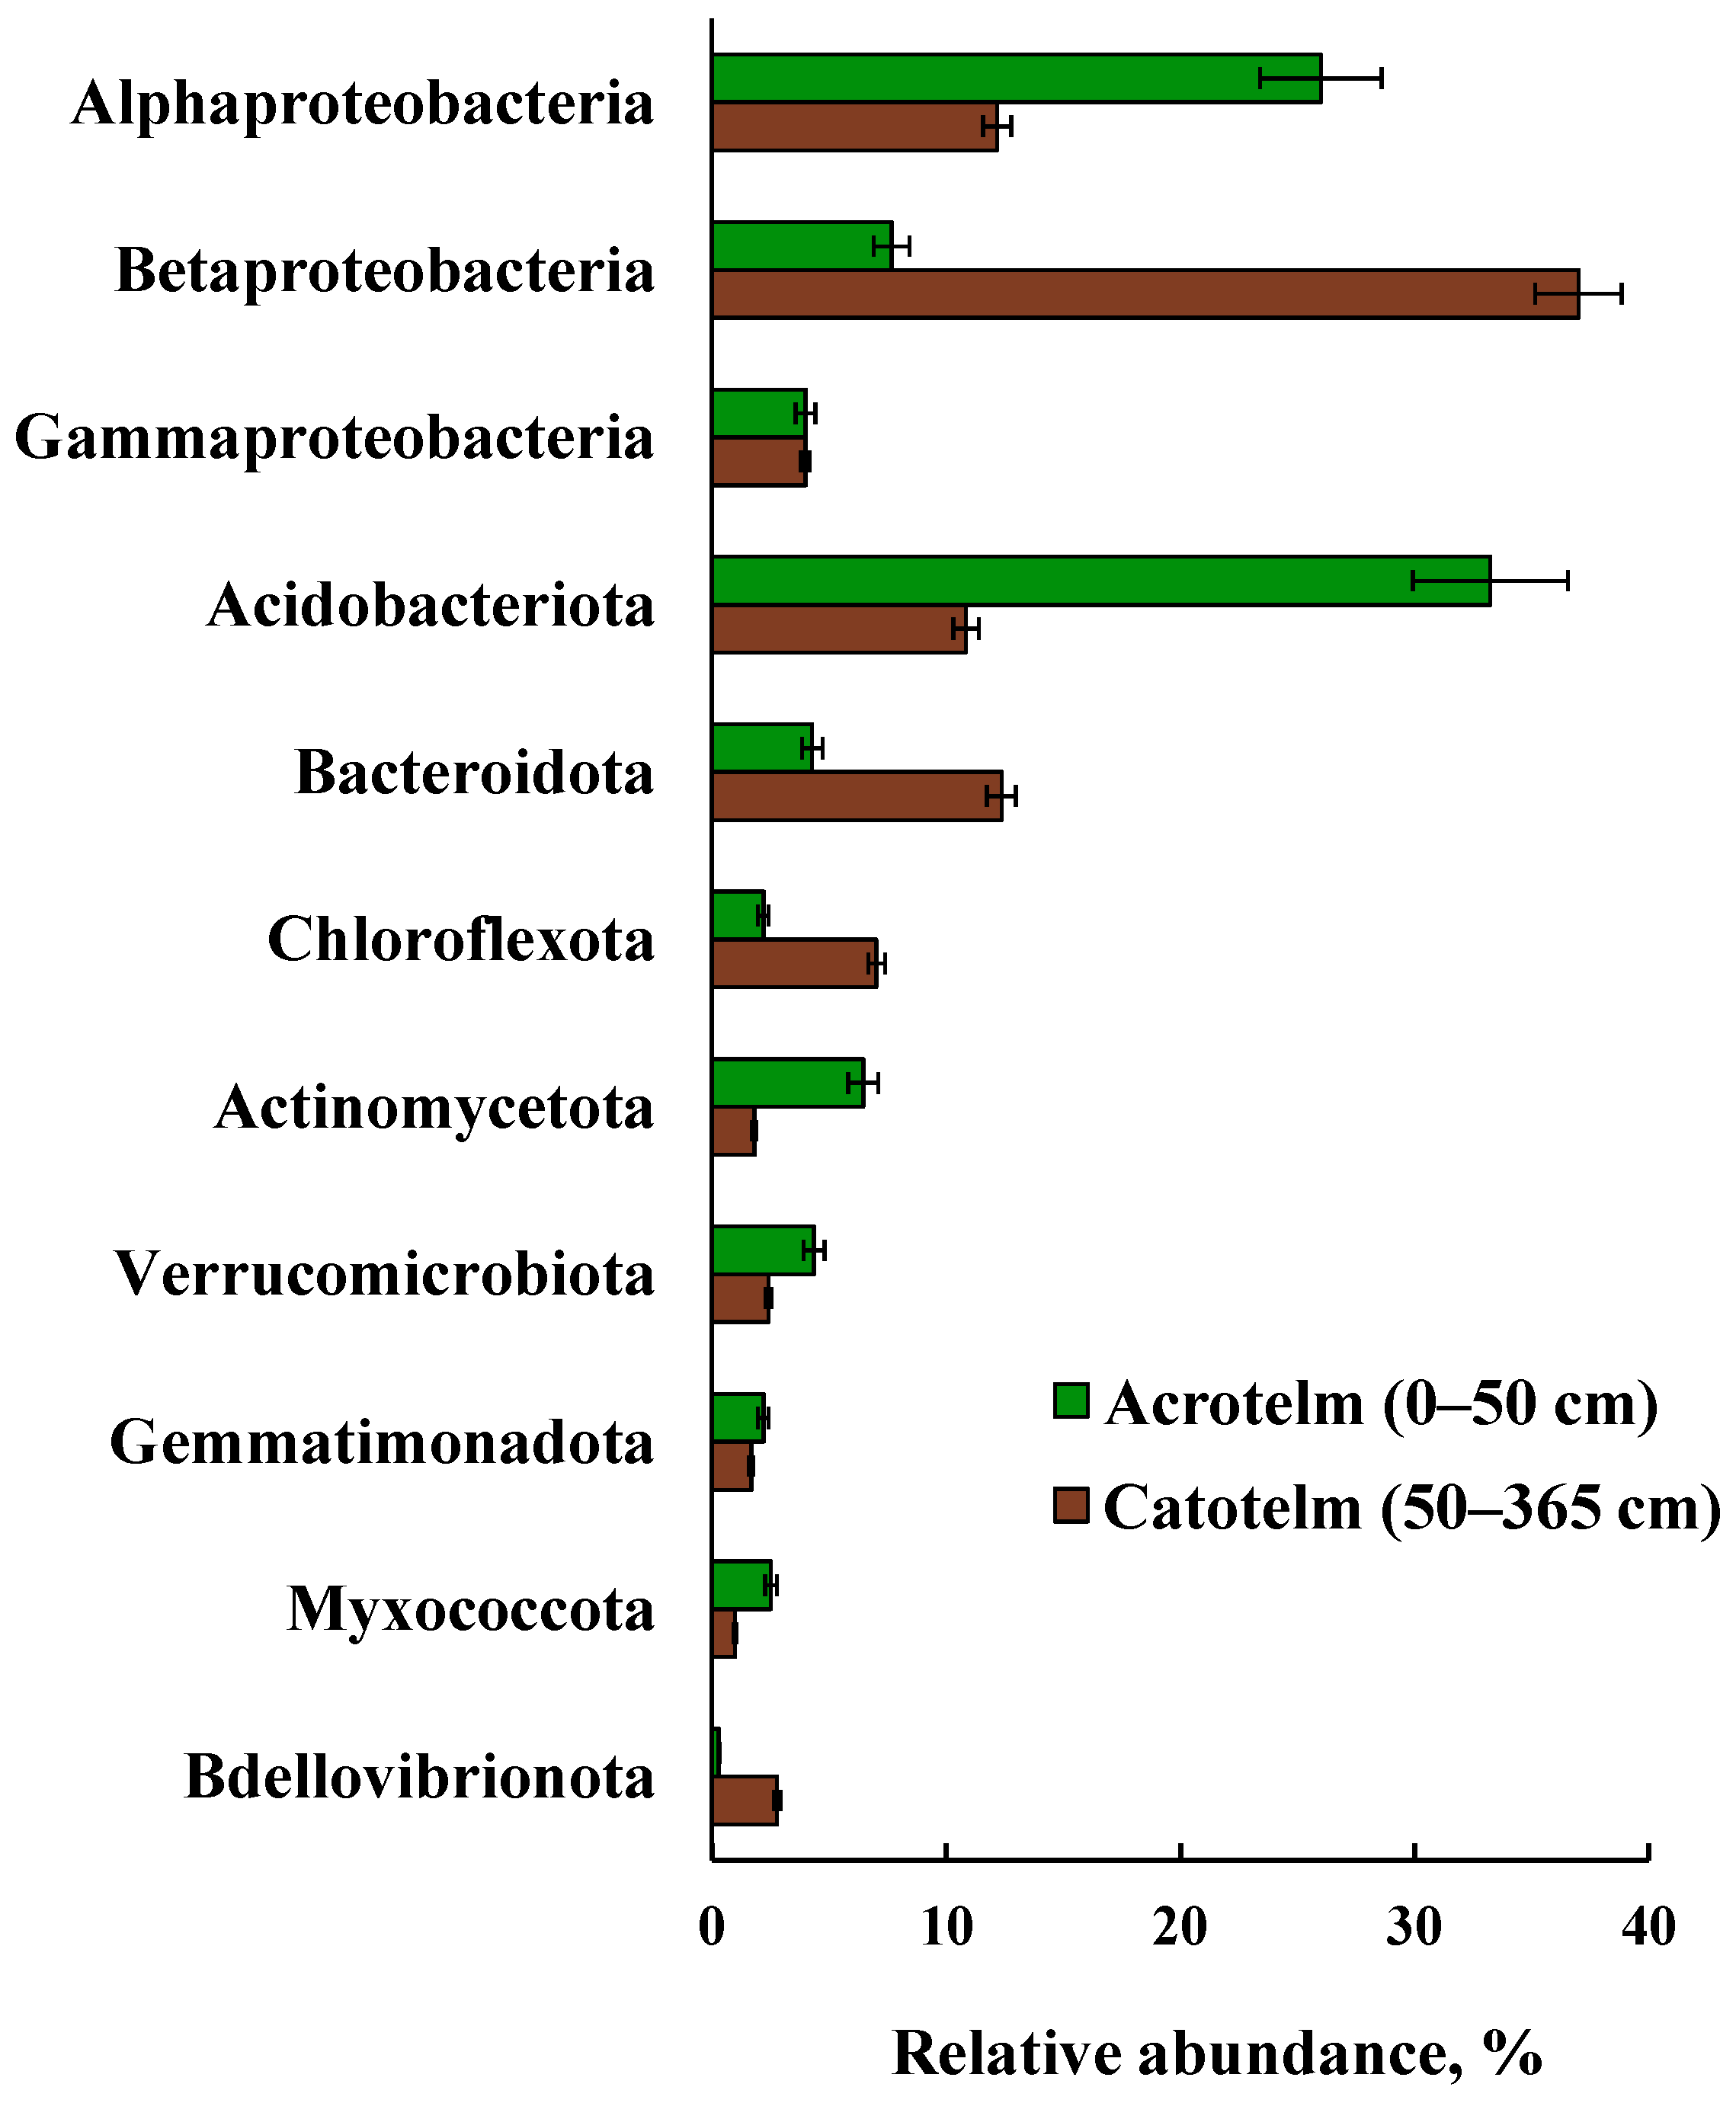
3.6. Taxonomic Composition of Prokaryotic Communities in Acrotelm and Catotelm

The analysis of alpha diversity indices, the number of isolated OTUs, Shannon index, and Chao1 index, did not reveal significant differences in the acrotelm and catotelm. For example, the average value of the Shannon index in the acrotelm was 5.9 ± 0.7; in the catotelm, it was 6.0 ± 0.6. However, both the acrotelm and catotelm have a layer in which the prokaryotic community was characterized by the maximum alpha diversity. In the acrotelm, it is the 0–20 cm layer; in the catotelm, it is the 150–200 cm layer.
A comparative analysis of bacterial communities at the phyla level showed that the top three phyla in the acrotelm included Acidobacteriota, Alphaproteobacteria, and Actinomycetota, while in the catotelm, they included Betaproteobacteria, Bacteroidota, and Chloroflexota (Figure 7).
It should be noted that the differences between the layers were especially pronounced for the phyla Acidobacteriota, Actinomycetota, Bdellovibrionota, Bacteroidota, and Chloroflexota and the class Betaproteobacteria of the phyla Pseudomonadota. The relative content of these lines of phyla in the samples of the acrotelm and catotelm differed by several times. In the acrotelm, for instance, the most prevalent was the proportion of phyla Acidobacteriota and Actinomycetota (by 3–4 times), whereas in catotelm—the proportion of Bdellovibrionota (by 9 times), Bacteroidota and Chloroflexota (by 3 times), and the class Betaproteobacteria (by 5 times) (Figure 7).
A comparative analysis at the family level of the dominant bacteria phyla showed that representatives of Xanthobacteraceae, Burkholderiaceae, Nitrosomonadacea, Flavobacteriaceae, Cytophagaceae, and Chitinophagaceae were predominant (had the largest relative proportions) in the acrotelm, while representatives of Caulobacteraceae, Sphingomonadaceae, Oxalobacteraceae, Comamonadaceae, Methylophilaceae, Sphingobacteriaceae, env. OPS17 (Bacteroidota, Sphingobacteriales), acidobacteria SDs 13 and 18, and the class Holophagae were predominant in the catotelm. Bacteria from other families were characterized by either high or low relative abundance throughout the profile.
A comparative analysis at the level of cultivated bacterial genera showed that out of 52 genera found in the studied fen profile, representatives of 16 genera were identified in almost all layers, 4 genera at selective depths, 6 genera predominantly in the acrotelm, and 26 genera predominantly in the catotelm.
The spectrum of genera identified throughout the profile included representatives of Bradyrhizobium, Sphingomonas, and Paraburkholderia, the frequency of occurrence of which comprised 100%, and representatives of Rhizomicrobium, Pseudolabris, Bauldia, Caulobacter, Phenylobacterium, Novosphingobium, Pseudomonas, Bryobacter, Candidatus Solibacter, Edaphobaculum, Puia, Bdellovibrio, and Acidothermus, the frequency of occurrence of which was 70%–90%.
Association with the acrotelm was noted for representatives of the genera Rhodoplanes, Roseiarcus, Acidipila, Granulicella, Occallatibacter, and Candidatus Koribacter. It should be noted that with exception of the genera Rhodoplanes and Roseiarcus, these are representatives of acidobacteria.
The representatives of almost all genera of Betaproteobacteria (Acidovorax, Limnohabitans, Pelomonas, Polaromonas, Rhodoferax, Variovorax, Massilia, Oxalicibacterium, Undibacterium, Duganella, Herbaspirillum, Herminiimonas, Janthinobacterium, Paucibacter, Methylotenera), four genera of Alphaproteobacteria (Asticcacaulis, Devosia, Rhizobium, Sphingobium), and four genera of bacteroids (Flavobacterium, Ferruginibacter, Mucilaginibacter, Pedobacter), as well as genera of other taxonomic groups (Bacteriovorax, Halliangium, Nitrospira), were identified mainly in the catotelm.
It should be noted that the total proportion of cultivated genera of acidobacteria was the highest in the acrotelm (on average, 15% of all sequences), which is five times greater than in the catotelm (on average, 3%). For the cultivated genera of the beta class proteobacteria and bacteroids, an inverse pattern was found. Their total proportion reached the highest values in the catotelm (on average, 21% and 7%) and the lowest in the acrotelm (on average, 1%).
A comparative analysis of the archaeal communities of the acrotelm and catotelm showed differences both at the level of phyla and classes. The acrotelm was found to contain representatives of only one phyla, Nitrososphaerota. The catotelm was characterized by the maximum diversity of archaea (up to 10 phyla in some of its layers), among which the dominant was Bathyarchaeota, while the subdominants were Thermoplasmatota, Halobacterota, and Aenigmarchaeota. Representatives of the class Nitrososphaeria dominated in the acrotelm; Bathyarchaeia dominated in the catotelm. It should also be noted that the proportion of archaea in the prokaryotic community of the catotelm was six times greater than in the acrotelm.

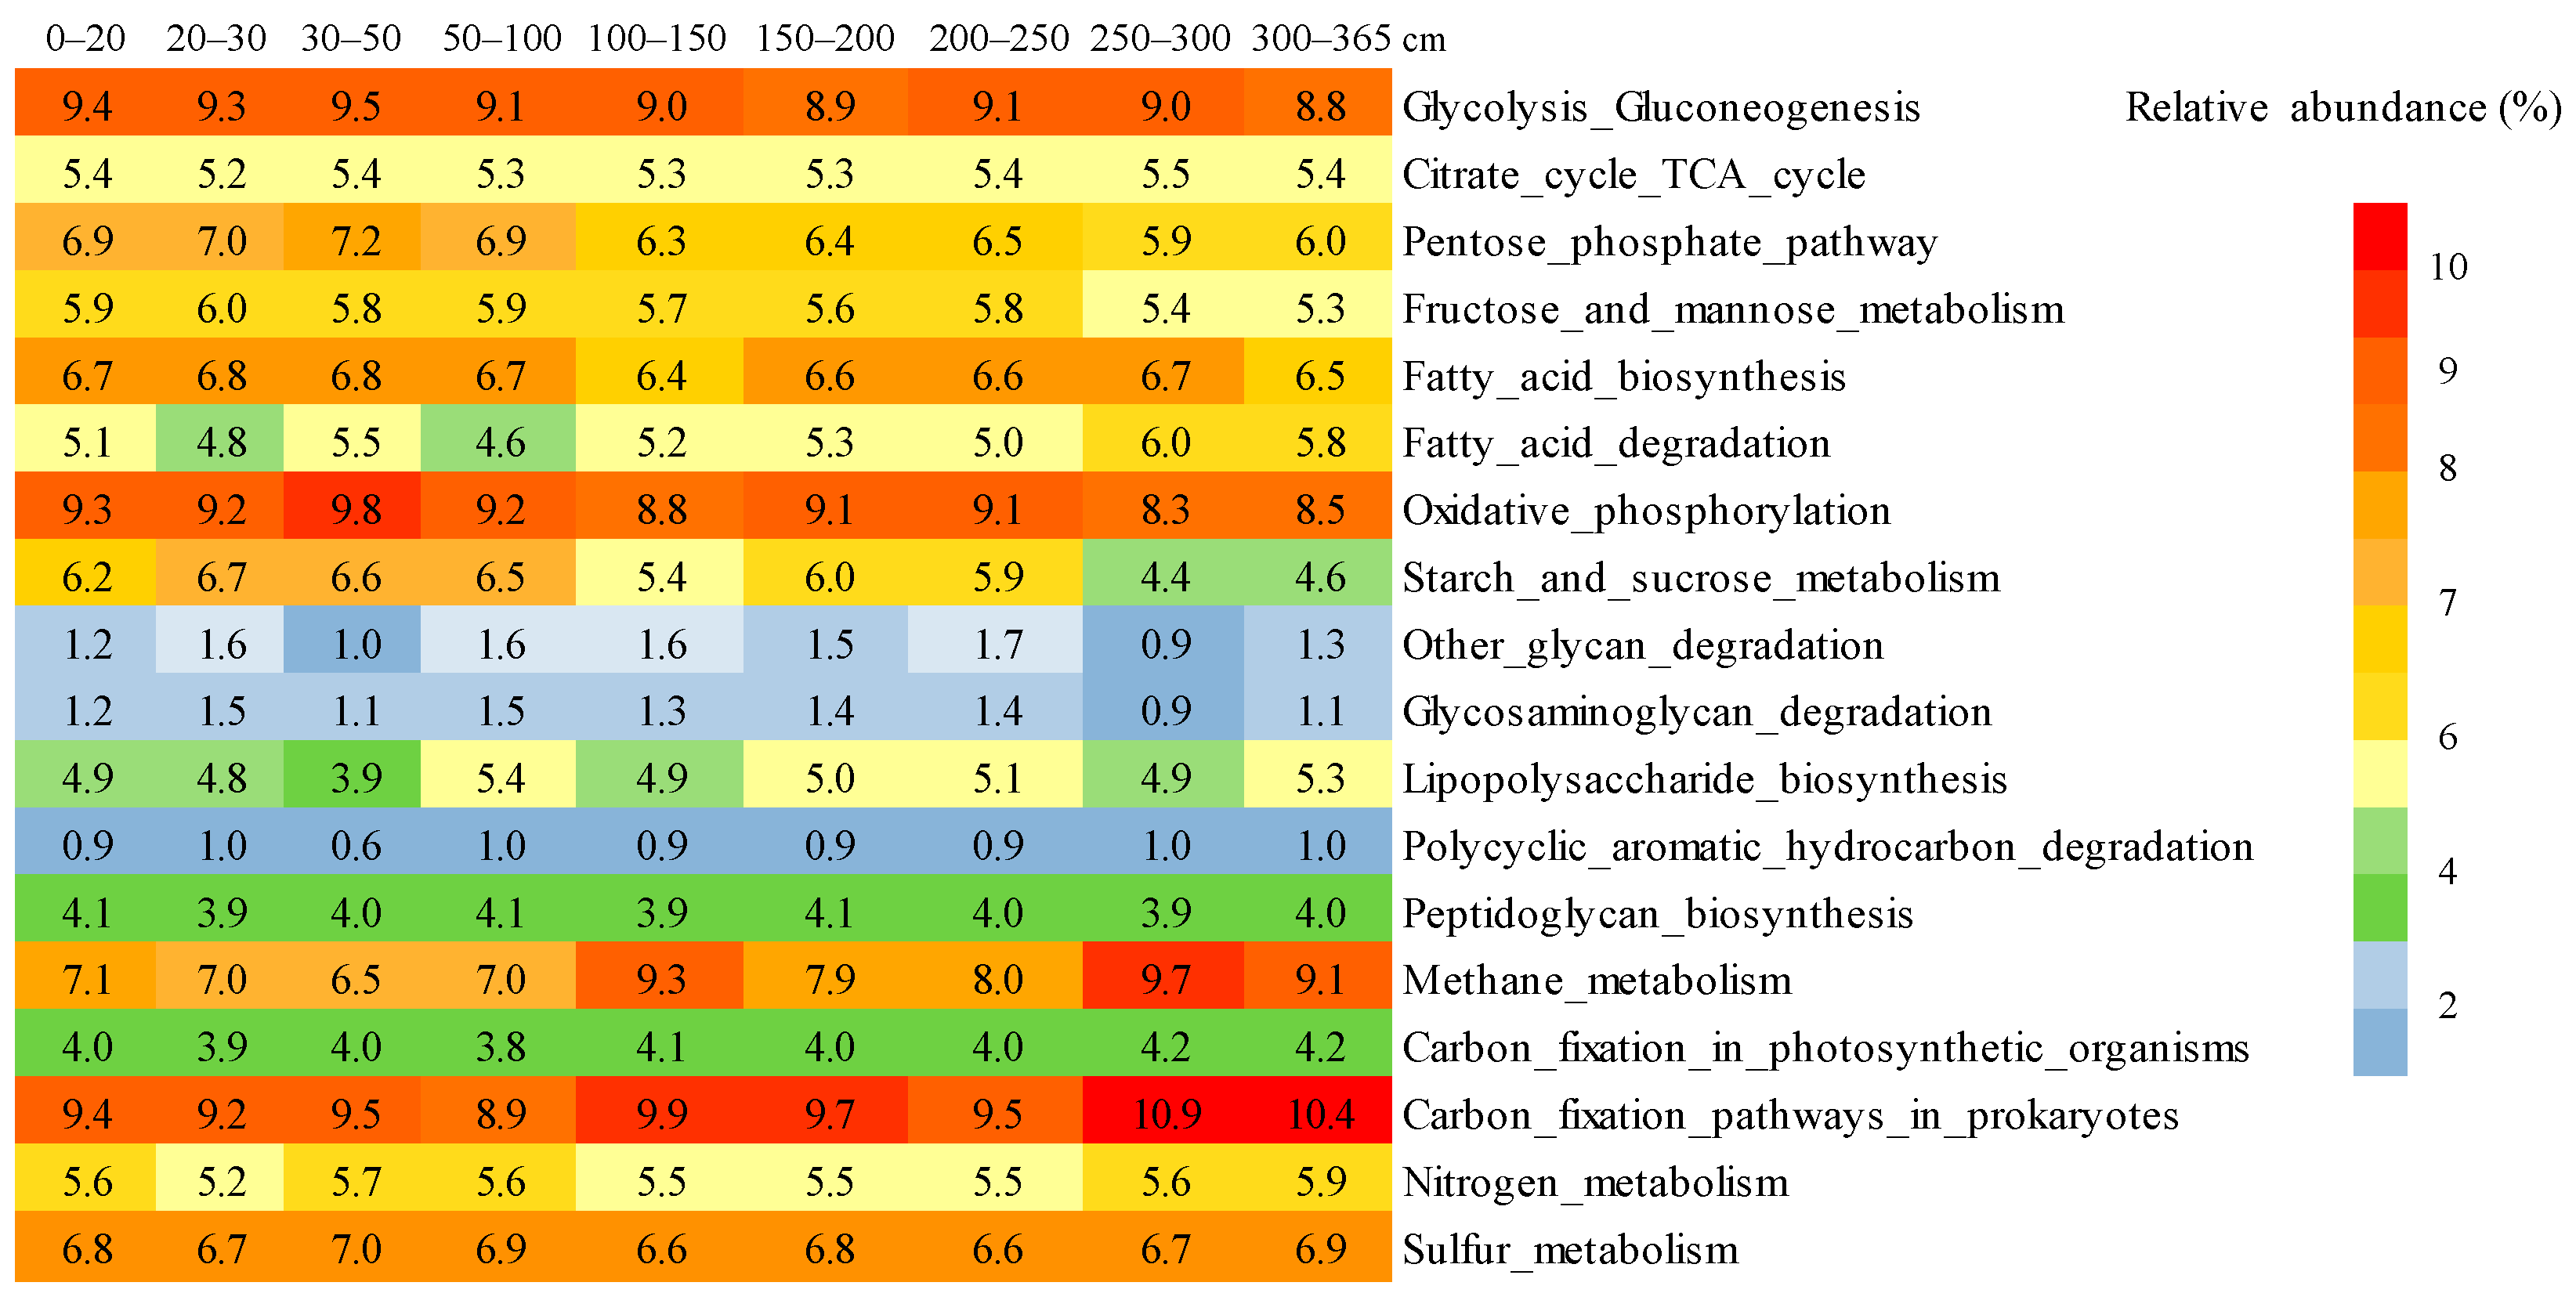
3.7. Potential Functional Characteristics of Prokaryotic Communities from fen Profile Samples

It was found that the most prevalent pathways of carbohydrate metabolism in the studied communities were glycolysis/gluconeogenesis, pathways of energy exchange—carbon fixation, oxidative phosphorylation, and methane metabolism—and pathways of biosynthesis of glycans—biosynthesis of lipopolysaccharides (Figure 8).
In lipid metabolism, the biosynthesis of fatty acids prevailed over their degradation. Polycyclic aromatic hydrocarbon degradation was at a low level. The prokaryotic communities of the fen profile mainly carried out the pathways of glycolysis/gluconeogenesis, oxidative phosphorylation, methane metabolism, and carbon fixation (Figure 8).
It should be noted that the functional profiles of the prokaryotic communities of the acrotelm and catotelm were generally similar, except for methane metabolism, which was primarily carried out by bacteria and archaea of the catotelm. They included, in particular, methylotrophs from the family Methylophilaceae of the class Betaproteobacteria, methanogenic archaea belonging to the orders Methanomicrobiales, Methanosarciniales, and Methanomassiliicoccales, as well as archaea of the order Methanomethyliales involved in methylotrophic methanogenesis.

4. Discussion

Among the contrasting (in terms of water nutrition, vegetation type, pH, availability of nutrients, and chemistry) peatlands, fens (sapric histosols), and bogs (fibric histosols), the priority in studying the phylogenetic structure of microbiomes based on the analysis of the 16S rRNA gene sequences was given to bogs.
The bacterial communities of bogs from different geographical zones were found to be similar in the dominant phyla, Acidobacteria, and different in the spectra of subdominant and minor phyla. Among subdominant phyla, of note are Proteobacteria, Verrucomicrobia, Actinobacteria, Planctomycetes, and Chloroflexi; among minor phyla, of note are Bacteroidetes, Spirochaetes, Firmicutes, Cyanobacteria, and Chlamydiae [16,17,18,19,20,21,22,23].
Initially, the information on the diversity of fen prokaryotic communities appeared in articles in which the communities were compared with those of bogs. In these articles, the researchers did not analyze the entire profile but only selective depths of contrasting peatlands [18,29,30,31]. There were few studies of peatlands that analyzed the microbial communities of the full profile or its components (acrotelm, mesotelm, and catotelm); moreover, as a rule, they were carried out on bogs rather than fens [20,23,32]. An analysis of bacterial communities of complete fen profiles (the thickness of which ranges from 1 to 2 m) is given in [32,33]. In the work [31], the authors presented data on the ratio of phyla of bacteria and archaea in peatlands divided into four classes—rich fens, intermediate fens, poor fens, and bogs. Samples from each peatland were collected at three depths: 10–20 cm, 30–40 cm, and 60–70 cm below the peat surface.
Based on the literature data, it can be concluded that the bacterial communities of fens from different geographical zones turned out to be similar in terms of the dominant phyla, Proteobacteria. As subdominant phyla, various studies mention Acidobacteria [30,32,33], Chloroflexi [29,30,46], Firmicutes [32], and Actinobacteria [31,33,46].
In the fen profile that we studied, the dominant phyla in the bacterial community was also Proteobacteria (Pseudomonadota). Proteobacteria are heterotrophic, universal opportunists which are widely studied not only as ubiquitous organisms that freely (autochthonously) inhabit many environments but also as pathogens and beneficial symbionts of plants and animals [47].
The proteobacteria found in bogs are most often classified as representatives of the alpha and delta classes. The predominance of the alpha class proteobacteria was noted in ombrotrophic peatlands in different geographical locations. They are represented by the families Methylocystaceae, Beijerinckiaceae, Acetobacteraceae, and Xanthobacteraceae [16,20,22]. In the fen profile under study, vertical stratification within Proteobacteria at the class level was identified. For example, the acrotelm was dominated by representatives of the alpha class (mainly Xanthobacteraceae); the catotelm was dominated by representatives of the beta class (mainly Oxalobacteraceae, Comamonadaceae, and Methylophilaceae). The most numerous of the taxonomically classified OTE Alphaproteobacteria were the genera Rhizomicrobium, Bauldia, Pseudolabris, Novosphingobium, and Sphingobium, the proportion of which in individual horizons exceeded 2% of the total sequence number. Bacteria of the genus Rhizomicrobium are facultatively anaerobic budding prostecobacteria; they utilize many sugars, including cellobiose, hydrolyze starch and xylan, form acetate, hydrogen, and ethanol as a result of fermentation, and reduce Fe (III) to Fe (II) [48]. Bacteria of the genus Bauldia are budding Prostecobacteria as well. They utilize mono- and disaccharides and organic acids and are capable of growing on methanol and methanolamine [49]. Bacteria of the genus Pseudolabris utilize acetate, fumarate, and hydroxybenzoate [50], while bacteria of the genera Sphingobium and Novosphingobium utilize aminobutyrate, benzoate, and various polyaromatic compounds, as well as degrade xenobiotics [51,52].
Betaproteobacteria, the dominant proteobacteria in the catotelm of the studied fen profile, were a minor group in some bogs. However, they constituted the second largest group of proteobacteria in the rock underlying bogs (at a depth of 650–700 cm) [20] and were the most widespread class among proteobacteria in bottom sediments [53]. Among the cultivated representatives of Betaproteobacteria in the fen profile under study, bacteria of different genera with various functions were identified. For instance, the ability to degrade cellulose, chitin, and humic substances was found in bacteria of the genus Variovorax [54], the ability to degrade chitin and lignin was found in bacteria of the genus Massilia [55], and the ability to degrade chitin was found in a bacterium of the genus Janthinobacterium [56]. Representatives of the genera Duganella and Undibacterium were able to hydrolyze starch, gelatin, and casein and utilize most sugars [57,58]. Bacteria of the genera Acidovorax [59], Herminiimonas [60], Limnohabitas [61], Oxalicibacterium [62], Polaromonas [63], and Pelomonas [64] assimilated amino acids, organic acids, and their salts; the last two genera also assimilated alcohols. Representatives of the genus Herbaspirillum are nitrogen-fixing rhizobacteria possessing a growth-stimulating effect [65], while representatives of the genus Methylotenera are obligate or facultative methylotrophs [66]. Bacteria of the genus Rhodoferax are facultative photoheterotrophs; they grow on acetate, pyruvate, and other salts of organic acids [67]. One of the species of this genus, Rhodoferax ferrireducens, is not a phototroph, but is involved in the processes of iron oxidation. Bacteria of the genus Paucibacter utilize sugars and amino acids and hydrolyze starch, esculin, and DNA [68].
Acidobacteriota was the second dominant bacterial phyla after Proteobacteria in the bacterial community of the studied fen. Acidobacteriota is an ecologically important phyla with a set of genes involved in various metabolic pathways. It plays a dynamic role in the regulation of biogeochemical cycles, degradation of biopolymers, and secretion of exopolysaccharides [69]. It should be noted that the proportion of this phyla was maximal in the acrotelm microbiome, especially in the 30–50 cm layer (up to 48%). In the catotelm, it decreased by 3–4 times and ranged from 4 to 13%. A similar trend was observed in the profiles of fens on the Sanjiang Plain (China)—a decrease in the proportion of Acidobacteriota by 3–11 times in the catotelm compared to the acrotelm [33]. It should be noted that the fen profile studied by us was characterized by insignificant pH fluctuations (5.6–5.8). Despite this, the relative abundance of Acidobacteriota changed along the profile; in addition, a more detailed analysis (at the level of subdivisions, classes, families, cultivated genera) showed changes in the taxonomic structure of acidobacteria communities. The acrotelm was dominated by acidobacteria of the class Acidobacteriia represented in equal proportions by the orders Acidobacteriales and Bryobacterales that accounted for 66%–91% of all acidobacteria. In the catotelm, the proportion of these families was lower due to a decrease in the proportion of bacteria of the order Acidobacteriales, but the proportions of acidobacteria SD13 (16%–38%) and SD18 (3%–9%) and the class Holophagae (3%–7%) became more significant. It is known that acidobacteria of the class Acidobacteriia are abundant in acidic ombrotrophic peatlands [19,22,70]. In fens (Vologda Oblast, Russia), the communities of acidobacteria were dominated by other classes of acidobacteria—Vicinamibacteria and Blastocatellia [70]. However, in the fen profile studied by us, the abundance of these families was low. The proportion of Vicinamibacteria was 2%–10%, and that of Blastocatellia was 1%–2%. Apparently, the weakly acidic reaction of the peat composing the studied profile facilitates the formation of acidobacteria communities with the dominance of the families characteristic of acidic soils and bogs. Acidobacteria SDs 13 and 18 identified in the catotelm are known to positively correlate with gene families associated with carbon degradation, especially those that are involved in hemicellulose degradation [71]. The detection of the Holophagae class acidobacteria in the catotelm (with predominance of anaerobic conditions) is logical, since these bacteria are obligate aerobes or strict anaerobes. Acidobacteria SD2 detected in the studied profile constitute a significant proportion (up to 30%) in tundra soils [72], including peat soils (20%–23% of all sequences of acidobacteria) [22]. It should be noted that in the fen studied by us the diversity of acidobacteria communities was found to be high: we identified 16 out of 26 existing SDs. Out of the cultivated acidobacteria, representatives of the genera Bryobacter and Candidatus Solibacter were found throughout the profile, that is, both in the acrotelm and in catotelm. Bacteria of the genus Bryobacter are acid-tolerant, aerobic bacteria isolated from sphagnum bog; they utilize sugars, galacturonic and glucuronic acids, and hydrolyze starch, pectin, esculin, casein, and gelatin [73]. Bacteria Candidatus Solibacter initially isolated from Australian soils form a biofilm on polysaccharide matrices between soil particles, improving soil structure; they degrade hemicellulose and pectin and reduce nitrates [74]. Acidobacteria of the genera Acidipila, Granulicella, Occallatibacter, and Candidatus Koribacter were isolated mainly from the acrotelm. Bacteria of the genera Acidipila [75] and Occalatibacter [76] initially isolated from soils were subsequently found in the rhizosphere of plants from the ombrotrophic peatlands [77]. Bacteria of the genus Granulicella were initially isolated from a sphagnum bog [78], while bacteria Candidatus Koribacter were initially isolated from the rhizosphere of rye grass in Australia [74]. Representatives of all the above genera utilize many sugars and polysaccharides (starch, pectin, xylan); bacteria of the genus Occalatibacter are capable of degrading chitin, while bacteria Candidatus Koribacter are capable of degrading chitin and cellulose. It should be noted that Candidatus Koribacter and Candidatus Solibacter were among the top ten genera in terms of abundance in the microbiomes of complete profiles of various fens [33]. In the catotelm of the studied fen profile, acidobacteria were represented mainly by non-culturable forms.
In the studied fen profile, Bacteroidota is another subdominant phyla of Proteobacteria, while Chloroflexota and Actinomycetota belong to the group of medium abundance, and Bacillota (Firmicutes) is a minor phyla. It should be noted that Firmicutes, Bacteroidota, and Actinomycetota are usually found in environments where processes of decomposition of organic matter take place under various climatic conditions [79,80,81]. Representatives of the phyla Firmicutes are mainly responsible for the degradation of lignocellulose and hemicellulose [82], while Bacteroidota are mainly responsible for the decomposition of polymers and complex organic compounds, producing simple molecules that are easily absorbed, transformed, and utilized by other microorganisms [83], Actinomycetota are responsible for the decomposition of complex and some toxic compounds, and Chloroflexota play an important role in the decomposition of carbohydrates and cellular materials [84,85]. It would be logical to identify them as subdominant phyla in bacterial communities of various fens; note that the profile of many fens is composed of well-decomposed peat. We believe that the increased total proportion of Bacteroidota, Chloroflexota, and Actinomycetota (from 12% to 27% of the bacteria domain) indirectly indicates a higher carbon turnover rate in the fen profile studied by us. It should be noted that the proportion of Actinomycetota was more significant in the acrotelm, while the proportion of Bacteroidota and Chloroflexota was more significant in the catotelm. A higher relative abundance of Actinomycetota in the acrotelm of fens was reported in [33]. The preference of representatives of the phyla Chloroflexota for the deep layers of peat and bottom clays of a relict bog, with the largest proportion at a depth of 3.7–4.0 m (up to 35%), was shown in [20].
Intermediate and rich fens, in contrast to bogs and poor fens, have an increased proportion of Bacteroidota [31]. Moreover, Bacteroidota, along with Proteobacteria and Acidobacteriota, was the main phyla in the microbiome of the bottom sediments [53]. In the studied fen profile, Bacteroidota was represented by the families Chitinophagaceae (35%–41%), Flavobacteriaceae (34%), or Cytophagaceae (35%) in the acrotelm and Sphingobacteriaceae (11%–36%), Chitinophagaceae (17%–28%), and env.OPS 17 (15%–27%) in the catotelm. The most numerous bacteroids among taxonomically classified OTUs belonged to the genera Mucilaginibacter and Pedobacter. They were detected mainly in the catotelm. Bacteria of the genus Mucilaginibacter isolated from an acidic peat bog hydrolyzed pectin, laminarin, starch, xylan, and other polysaccharides [86], while bacteria of the genus Pedobacter hydrolyzed starch, casein, esculin, and tween 80 [87].
As for the archaeal communities in the studied fen profile, our study confirmed the pattern described in [31,32]: an increase in their abundance and diversity with depth. Such distribution along the profile is understandable, since many representatives of archaea are the main agents of anaerobic respiration [88]. Out of archaea found in various fens, representatives of Euryarchaeota [29,30,31,32], Crenarchaeota [31,32], and Thaumarchaeota [29] were identified; out of the superphylum DPANN, Nanoarchaeota, Diapherotrites [30], and Parvarchaeota [31] were identified.
The spectrum of archaea in the studied fen profile included both the phyla described in other fens and new ones. Throughout the profile, the most dominant were archaea Proteoarchaeota from the superphylum TACK represented by the phyla Nitrososphaerota (class Nitrososphaeria) in the acrotelm and Bathyarchaeota (class Bathyarchaeia) in the catotelm. Archaea of the Nitrososphaeria family are chemolithoautotrophs and play an important biogeochemical role as nitrifying organisms [89]. Bathyarchaeia sequences have previously been detected in more than half of the archaeal populations in various peatlands [90,91]. Different orders were found to have highly diversified and versatile carbon metabolisms, particularly atypical C1 metabolic pathways, indicating that Bathyarchaeia represent overlooked important methylotrophs [92]. Moreover, representatives of Bathyarchaeota (along with methanogens from the phyla Euryarchaeota, Halobacterota, and Thermoplasmatota found in the peatlands) may be involved in the methane cycle, either in anaerobic methane oxidation and/or methanogenesis, since, according to metagenomic data, at least several organisms from this group contain the essential mcrA gene [93].
Statistical analysis showed that the characteristics of the samples, such as the degree of decomposition of peat, pH value, and content of carbon and nitrogen, did not affect the richness and diversity of the prokaryotic community of the studied fen. There were no significant differences in the functional profiles of prokaryotic communities of different layers. Obviously, the identified trends are the result of the homogeneity of the tested peat characteristics along a vertical depth gradient. The prokaryotic communities of the acrotelm and catotelm were found to be not statistically different, as evidenced by the diversity indices (OTUs, Shannon index, and Chao1 index). However, we noticed a special taxonomic structure of the prokaryotic community identified in the 30–50 cm layer, where the main fluctuations in the groundwater level in the studied fen profile take place. In peat bogs, a layer (from 30 to 75 cm) called mesotelm was also distinguished between the acrotelm and catotelm. It has been shown that the fluctuating water table results in redox oscillations and elevated carbon turnover [94,95]. In peat bogs, mesotelm represents a “hot spot” of microbial diversity and activity [8,23,32,96]. What role does this layer play in fens? Which layer or layers in fens can be called a “hot spot”? To answer these questions, further studies of complete fen profile microbial communities are required. According to our data, such layers may be a layer of 0–20 cm from the acrotelm and a layer of 150–200 cm the from catotelm.

5. Conclusions

In this work, we characterized the diversity and functional potential of the prokaryotic community in the complete profile of a boreo-nemoral minerotrophic pine swamp (European Russia) using high-throughput sequencing of 16S rRNA gene fragments.
It was shown that prokaryotic communities at different depths were predominantly represented by bacteria; archaea accounted for no more than 10%. The bacteria domain included 28 phyla, 11 of which were present at all profile depths. The most numerous were Pseudomonadota, Acidobacteriota, and Bacteroidota. The spectrum of cultivated bacterial genera of the predominant phyla included 52 taxa. The archaea domain was represented by 10 phyla; the most numerous among them were Nitrososphaerota, Bathyarchaeota, and Thermoplasmatota. The prokaryotic communities of the fen profile were mainly involved in glycolysis/gluconeogenesis, oxidative phosphorylation, carbon fixation, and methane metabolism.
The taxonomic differentiation of prokaryotic communities was found to be most clearly manifested in the analysis of the acrotelm and catotelm of the fen profile under study. In the acrotelm, the most prevalent was the proportion of phyla Acidobacteriota and Actinomycetota (by 3–4 times); in the catotelm, the most prevalent was the proportion of Bdellovibrionota (by 9 times), Bacteroidota, and Chloroflexota (by 3 times). As to the phylum Pseudomonadota, representatives of the alpha class (family Xanthobacteraceae) dominated in the acrotelm; representatives of the beta class (Comamonadaceae, Oxalobacteraceae, Methylophilaceae) dominated in the catotelm. In archaeal communities of the acrotelm, we discovered the monodominance of Nitrososphaerota; in the catotelm, we discovered the dominance of Bathyarchaeota. The functional profiles of the acrotelm and catotelm prokaryotic communities were generally similar, except for methane metabolism, which was primarily carried out in the catotelm.
The characterization of prokaryotic fen communities obtained in this study may be required to assess the stability of peatland ecosystems under the influence of natural and anthropogenic factors. A comprehensive study of microbial communities in the catotelm will help elucidate in the future the mechanism of microbially mediated carbon turnover in deep peat layers, which has not yet been fully established.

Author Contributions

Conceptualization, A.V.G. and T.G.D.; methodology, A.V.G., D.S.S. and N.A.M.; software, D.S.S.; validation, A.V.G., T.A.G., D.S.S. and N.A.M.; formal analysis, A.V.G., T.A.G., T.V.G. and D.S.S.; investigation, A.V.G.; resources, N.A.M. and T.V.G.; data curation, A.V.G., T.G.D. and D.S.S.; writing—original draft preparation, A.V.G. and T.G.D.; writing—review and editing, N.A.M., T.A.G., Y.A.D. and T.V.G.; visualization, D.S.S. and Y.A.D.; supervision, A.V.G.; project administration, N.A.M.; funding acquisition, A.V.G., T.A.G., T.V.G. and N.A.M. All authors have read and agreed to the published version of the manuscript.

Funding

This study was funded by the Russian Science Foundation (RSF), grant number 21-14-00076.

Data Availability Statement

Data are contained within the article.

Conflicts of Interest

The authors declare no conflict of interest.

References

  1. Yu, Z.; Loisel, J.; Brosseau, D.P.; Beilman, D.W.; Hunt, S.J. Global peatland dynamics since the Last Glacial Maximum. Geophys. Res. Lett. 2010, 37, 13. [Google Scholar] [CrossRef]
  2. Scharlemann, J.P.; Tanner, E.V.; Hiederer, R.; Kapos, V. Global soil carbon: Understanding and managing the largest terrestrial carbon pool. Carbon Manag. 2014, 5, 81–91. [Google Scholar] [CrossRef]
  3. Jungblut, A.D.; Wood, S.A.; Hawes, I.; Webster-Brown, J.; Harris, C. The Pyramid Trough Wetland: Environmental and biological diversity in a newly created Antarctic protected area. FEMS Microbiol. Ecol. 2012, 82, 356–366. [Google Scholar] [CrossRef]
  4. Vompersky, S.E.; Sirin, A.A.; Tsyganova, O.P.; Valyaeva, N.A.; Maikov, D.A. Peatlands and paludified lands of Russia: Attempt of analyses of spatial distribution and diversity. Izv. Ross. Akad. Nauk Seriya Geogr. 2005, 5, 39–50. (In Russian) [Google Scholar]
  5. Vompersky, S.E.; Sirin, A.A.; Sal’nikov, A.A.; Tsyganova, O.P.; Valyaeva, N.A. Estimation of forest cover extent over peatlands and paludified shallow-peat lands in Russia. Contemp. Probl. Ecol. 2011, 4, 734–741. [Google Scholar] [CrossRef]
  6. Parish, F.; Sirin, A.A.; Charman, D.; Joosten, H.; Minaeva, T.Y.; Silvius, M. Assessment on Peatlands, Biodiversity and Climate Change; Wetlands International: Kuala Lumpur, Wageningen, Malaysia, 2008; p. 179. [Google Scholar]
  7. Dobrovol’skaya, T.G.; Golovchenko, A.V.; Pankratov, T.A.; Lysak, L.V.; Zvyagintsev, D.G. Assessment of the bacterial diversity in soils: Evolution of approaches and methods. Eurasian Soil Sci. 2009, 42, 1138–1147. [Google Scholar] [CrossRef]
  8. Andersen, R.; Chapman, S.J.; Artz, R.R.E. Microbial communities in natural and disturbed peatlands: A review. Soil Biol. Biochem. 2013, 57, 979–994. [Google Scholar] [CrossRef]
  9. Juan-Ovejeroa, R.; Brionesa, M.J.I.; Öpikb, M. Fungal diversity in peatlands and its contribution to carbon cycling. Appl. Soil Ecol. 2020, 146, 103393. [Google Scholar] [CrossRef]
  10. Waksman, S.A.; Stevens, K.R. Contribition to the chemical composition of peats. V. The role of microorganisms in peat formation and decomposition. Soil Sci. 1929, 28, 315–339. [Google Scholar] [CrossRef]
  11. Belikova, N.M. From the results of microbiological analysis of peat (on the decomposition of fiber in peat). Torfyanoye Delo 1929, 10–11, 427–430. (In Russian) [Google Scholar]
  12. Waksman, S.A.; Purvis, E.R. The microbiological population of peat. Soil Sci. 1932, 34, 95–109. [Google Scholar] [CrossRef]
  13. Gilbert, D.; Mitchell, E.A.D. Microbial diversity in Sphagnum peatlands. Dev. Earth Surf. Process. 2006, 9, 287–318. [Google Scholar] [CrossRef]
  14. Aslam, Z.; Yasir, M.; Khaliq, A.; Matsui, K.; Chung, Y.R. Too much bacteria still unculturable. Crop Environ. 2010, 1, 59–60. [Google Scholar]
  15. Rheims, H.; Spröer, C.; Rainey, F.A.; Stackebrandt, E. Molecular biological evidence for the occurrence of uncultured members of the actinomycete line of descent in different environments and geographical locations. Microbiology 1996, 142, 2863–2870. [Google Scholar] [CrossRef] [PubMed]
  16. Dedysh, S.; Pankratov, T.; Belova, S.; Kulichevskaya, I.; Liesack, W. Phylogenetic Analysis and In Situ Identification of Bacteria Community Composition in an Acidic Sphagnum Peat Bog. Appl. Environ. Microbiol. 2006, 72, 2110–2117. [Google Scholar] [CrossRef]
  17. Pankratov, T.A.; Ivanova, A.O.; Dedysh, S.N.; Liesack, W. Bacterial populations and environmental factors controlling cellulose degradation in an acidic Sphagnum peat. Environ. Microbiol. 2011, 13, 1800–1814. [Google Scholar] [CrossRef] [PubMed]
  18. Lin, X.; Green, S.; Tfaily, M.M.; Prakash, O.; Konstantinidis, K.T.; Corbett, J.E.; Chanton, J.P.; Cooper, W.T.; Kostka, J.E. Microbial community structure and activity linked to contrasting biogeochemical gradients in bog and fen environments of the Glacial Lake Agassiz Peatland. Appl. Environ. Microbiol. 2012, 78, 7023–7031. [Google Scholar] [CrossRef]
  19. Serkebaeva, Y.M.; Kim, Y.; Liesack, W.; Dedysh, S.N. Pyrosequencing-based assessment of the bacteria diversity in surface and subsurface peat layers of a northern wetland, with focus on poorly studied phyla and candidate divisions. PLoS ONE 2013, 21, e63994. [Google Scholar] [CrossRef]
  20. Tsitko, I.; Lusa, M.; Lehto, J.; Parviainen, L.; Ikonen, A.T.K.; Lahdenperä, A.M.; Bomberg, M. The Variation of Microbial Communities in a Depth Profile of an Acidic, Nutrient-Poor Boreal Bog in Southwestern Finland. Open J. Ecol. 2014, 4, 832–859. [Google Scholar] [CrossRef]
  21. Kim, H.M.; Jung, J.Y.; Yergeau, E.; Hwang, C.Y.; Hinzman, L.; Nam, S.; Hong, S.G.; Kim, O.S.; Chun, J.; Lee, Y.K. Bacterial community structure and soil properties of a subarctic tundra soil in Council, Alaska. FEMS Microbiol. Ecol. 2014, 89, 465–475. [Google Scholar] [CrossRef]
  22. Danilova, O.V.; Belova, S.E.; Gagarinova, I.V.; Dedysh, S.N. Microbial Community Composition and Methanotroph Diversity of a Subarctic Wetland in Russia. Microbiology 2016, 85, 583–591. [Google Scholar] [CrossRef]
  23. Birnbaum, C.; Wood, J.; Lilleskov, E.; Lamit, L.; Shannon, J.; Brewer, M.; Grover, S. Degradation Reduces Microbial Richness and Alters Microbial Functions in an Australian Peatland. Microb. Ecol. 2022, 85, 875–891. [Google Scholar] [CrossRef]
  24. Dobrovolskaya, T.G.; Golovchenko, A.V.; Zvyagintsev, D.G. Analysis of ecological factors limiting the destruction of high-moor peat. Eurasian Soil Sci. 2014, 47, 182–193. [Google Scholar] [CrossRef]
  25. Golovchenko, A.V.; Tikhonova, E.Y.; Zvyagintsev, D.G. Abundance, biomass, structure, and activity of the microbial complexes of minerotrophic and ombrotrophic peatlands. Microbiology 2007, 76, 630–637. [Google Scholar] [CrossRef]
  26. Dobrovolskaya, T.G.; Golovchenko, A.V.; Kukharenko, O.S. The structure of the microbial communities in low-moor and high-moor peat bogs of Tomsk oblast. Eurasian Soil Sci. 2012, 45, 273–281. [Google Scholar] [CrossRef]
  27. Golovchenko, A.V.; Dmitrienko, Y.D.; Morozov, A.A.; Pozdnyakov, L.A.; Glukhova, T.V.; Inisheva, L.I. Microbial Biomass in Eutrophic Peatlands: Stock, Structure and Activity. Eurasian Soil Sci. 2021, 54, 1068–1077. [Google Scholar] [CrossRef]
  28. Bogdanova, O.Y.; Golovchenko, A.V.; Lysak, L.V.; Glukhova, T.V.; Zvyagintsev, D.G. Viability of bacteria in peatlands. Eurasian Soil Sci. 2014, 47, 297–303. [Google Scholar] [CrossRef]
  29. Concheri, G.; Stevanato, P.; Zaccone, C.; Shotyk, W.; D’Orazio, V.; Miano, T.; Piffanelli, P.; Rizzi, V.; Ferrandi, C.; Squartini, A. Rapid peat accumulation favours the occurrence of both fen and bog microbial communities within a Mediterranean, free-floating peat island. Sci. Rep. 2017, 7, 8511. [Google Scholar] [CrossRef]
  30. Ivanova, A.A.; Beletsky, A.V.; Rakitin, A.L.; Kadnikov, V.V.; Philippov, D.A.; Mardanov, A.V.; Ravin, N.V.; Dedysh, S.N. Closely Located but Totally Distinct: Highly Contrasting Prokaryotic Diversity Patterns in Raised Bogs and Eutrophic Fens. Microorganisms 2020, 8, 484. [Google Scholar] [CrossRef]
  31. Seward, J.; Carson, M.A.; Lamit, L.J. Peatland Microbial Community Composition Is Driven by a Natural Climate Gradient. Microb. Ecol. 2020, 80, 593–602. [Google Scholar] [CrossRef]
  32. Lin, X.; Tfaily, M.M.; Green, S.J.; Steinweg, J.M.; Chanton, P.; Imvittaya, A.; Chanton, J.P.; Cooper, W.; Schadt, C.; Kostka, J.E. Microbial metabolic potential for carbon degradation and nutrient (nitrogen and phosphorus) acquisition in an ombrotrophic peatland. Appl. Environ. Microbiol. 2014, 80, 3531–3540. [Google Scholar] [CrossRef]
  33. Zhou, X.; Zhang, Z.; Tian, L. Microbial communities in peatlands along a chronosequence on the Sanjiang Plain, China. Sci. Rep. 2017, 7, 9567. [Google Scholar] [CrossRef]
  34. Bakhnov, V.K. Soil Formation (A Look into the Past and Present); SO RAN: Novosibirsk, Russia, 2002; p. 117. (In Russian) [Google Scholar]
  35. Hytteborn, H.; Maslov, A.A.; Nazimova, D.I.; Rysin, L.P. Boreal forests of Eurasia. In Ecosystems of the World; Elsevier: Amsterdam, The Netherlands, 2005; pp. 23–99. [Google Scholar]
  36. Vompersky, S.E.; Solovyov, S.A.; Vakurov, A.D. Biogeocenological Study of Swamp Forests in Connection with Experimental Hydromelioration; Nauka: Moscow, Russia, 1982; p. 208. (In Russian) [Google Scholar]
  37. Vompersky, S.E.; Sirin, A.A.; Glukhov, A.I. Formation and Regime of Runoff during Hydroforestry; Nauka: Moscow, Russia, 1988; p. 168. (In Russian) [Google Scholar]
  38. Semensky, E.P. Technical Analysis of Peat; Nedra: Moscow, Russia, 1966; p. 232. (In Russian) [Google Scholar]
  39. Arinushkina, E.V. Manual on Chemical Analysis of Soils; MSU Publishing House: Moscow, Russia, 1970; p. 487. (In Russian) [Google Scholar]
  40. Takahashi, S.; Tomita, J.; Nishioka, K.; Hisada, T.; Nishijima, M. Development of a prokaryotic universal primer for simultaneousanalysis of Bacteria and Archaea using next-generation sequencing. PLoS ONE 2014, 9, e105592. [Google Scholar] [CrossRef]
  41. Caporaso, J.G.; Kuczynski, J.; Stombaugh, J.; Bittinger, K.; Bushman, F.D.; Costello, E.K.; Fierer, N. QIIME allows analysis of high-throughput community sequencing sequencing data. Nat. Methods 2010, 7, 335–336. [Google Scholar] [CrossRef] [PubMed]
  42. Pruesse, E.; Quast, C.; Knittel, K. SILVA: A comprehensive online resource for quality checked and aligned ribosomal RNA sequence data compatible with ARB. Nucleic Acids Res. 2007, 21, 7188–7196. [Google Scholar] [CrossRef] [PubMed]
  43. Oksanen, J.; Kindt, R.; Legendre, P.; O’Hara, B.; Stevens, M.H.H.; Oksanen, M.J.; Suggests, M.A.S.S. The vegan package. Community Ecol. Package 2007, 10, 631–637. [Google Scholar]
  44. Nagpal, S.; Haque, M.M.; Singh, R.; Mande, S.S. iVikodak—A Platform and standard workflow for inferring, analyzing, comparing, and visualizing the functional potential of microbial communities. Front. Microbiol. 2019, 9, 3336. [Google Scholar] [CrossRef] [PubMed]
  45. Kanehisa, M.; Goto, S. KEGG: Kyoto Encyclopedia of Genes and Genomes. Nucleic Acids Res. 2000, 28, 27–30. [Google Scholar] [CrossRef]
  46. Hunger, S.; Gößner, A.S.; Drake, H.L. Anaerobic trophic interactions of contrasting methane-emitting mire soils: Processes versus taxa. FEMS Microbiol. Ecol. 2015, 91, fiv045. [Google Scholar] [CrossRef]
  47. Bergkessel, M.; Delavaine, L. Diversity in starvation survival strategies and outcomes among heterotrophic Proteobacteria. Microb. Physiol. 2021, 31, 146–162. [Google Scholar] [CrossRef]
  48. Ueki, A.; Kodama, Y.; Kaku, N.; Shiromura, T.; Satoh, A.; Watanabe, K.; Ueki, K. Rhizomicrobium palustre Gen. Nov., Sp. Nov., a Facultatively Anaerobic, Fermentative Stalked Bacterium in the Class Alphaproteobacteria Isolated from Rice Plant Roots. J. Gen. Appl. Microbiol. 2010, 56, 193–203. [Google Scholar] [CrossRef]
  49. Yee, B.; Oertli, G.E.; Fuerst, J.A.; Staley, J.T. Reclassification of the polyphyletic genus Prosthecomicrobium to form two novel genera, Vasilyevaea gen. nov. and Bauldia gen. nov. with four new combinations: Vasilyevaea enhydra comb. nov., Vasilyevaea mishustinii comb. nov., Bauldia consociata comb. nov. and Bauldia litoralis comb. nov. Int. J. Syst. Evol. Microbiol. 2010, 60, 2960–2966. [Google Scholar] [CrossRef]
  50. Kämpfer, P.; Young, C.; Arun, A.B.; Shen, F.T.; Jäckel, U.; Rosselló-Mora, R.; Lai, W.A.; Rekha, P.D. Pseudolabrys taiwanensis gen. nov., sp. nov., an alphaproteobacterium isolated from soil. Int. J. Syst. Evol. Microb. 2006, 56, 2469–2472. [Google Scholar] [CrossRef] [PubMed]
  51. Takeuchi, M.; Hamana, K.; Hiraishi, A. Proposal of the genus Sphingomonas sensu stricto and three new genera, Sphingobium, Novosphingobium and Sphingopyxis, on the basis of phylogenetic and chemotaxonomic analyses. Int. J. Syst. Evol. Microbiol. 2001, 51, 1405–1417. [Google Scholar] [CrossRef] [PubMed]
  52. Kämpfer, P.; Young, C.C.; Busse, H.J. Novosphingobium soli sp. nov., isolated from soil. Int. J. Syst. Evol. Microbiol. 2011, 61, 259–263. [Google Scholar] [CrossRef] [PubMed]
  53. Wolińska, A.; Kruczyńska, A.; Grządziel, J.; Gałązka, A.; Marzec-Grządziel, A.; Szałaj, K.; Kuźniar, A. Functional and Seasonal Changes in the Structure of Microbiome Inhabiting Bottom Sediments of a Pond Intended for Ecological King Carp Farming. Biology 2022, 11, 913. [Google Scholar] [CrossRef]
  54. Satola, B.; Wübbeler, J.H.; Steinbüchel, A. Metabolic Characteristics of the Species Variovorax paradoxus. Appl. Microbiol. Biotechnol. 2013, 97, 541–560. [Google Scholar] [CrossRef]
  55. Kampfer, P.; Lodders, N.; Martin, K.; Falsen, E. Revision of the genus Massilia La Scola et al. 2000, with an emended description of the genus and inclusion of all species of the genus Naxibacter as new combinations, and proposal of Massilia consociata sp. nov. Int. J. Syst. Evol. Microbiol. 2011, 61, 1528–1533. [Google Scholar] [CrossRef]
  56. Lincoln, S.P.; Fermor, T.R.; Tindall, B.J. Janthinobacterium agaricidamnosum sp. nov., a soft rot pathogen of Agaricus bisporus. Int. J. Syst. Evol. Microbiol. 2009, 49, 1577–1589. [Google Scholar] [CrossRef]
  57. Zhang, J.; Kim, Y.J.; Hoang, V.A.; Nguyen, N.L. Duganella ginsengisoli sp. nov., isolated from ginseng soil. Int. J. Syst. Evol. Microbiol. 2016, 66, 56–61. [Google Scholar] [CrossRef]
  58. Kämpfer, P.; Rosselló-Mora, R.; Hermansson, M.; Persson, F.; Huber, B.; Falsen, E.; Busse, H.J. Undibacterium pigrum gen. nov., sp. nov., isolated from drinking water. Int. J. Syst. Evol. Microbiol. 2007, 57, 1510–1515. [Google Scholar] [CrossRef] [PubMed]
  59. Willems, A.; Falsen, E.; Pot, B.; Jantzen, E.; Hoste, B.; Vandamme, P.; Gillis, M.; Kersters, K.; De Ley, J. Acidovorax, a New Genus for Pseudomonas facilis, Pseudomonas delafieldii, E. Falsen (EF) Group 13, EF Group 16, and Several Clinical Isolates, with the Species Acidovorax facilis comb. nov., Acidovorax delaJieldii comb. nov., and Acidovorax temperans sp. nov. Int. J. Syst. Bacteriol. 1990, 40, 384–398. [Google Scholar] [CrossRef] [PubMed]
  60. Fernandes, C.; Rainey, F.A.; Nobre, M.F.; Pinhal, I.; Folhas, F.; Da Costa, M.S. Herminiimonas fonticola gen. nov., sp. nov., a Betaproteobacterium isolated from a source of bottled mineral water. Syst. Appl. Microbiol. 2005, 28, 596–603. [Google Scholar] [CrossRef] [PubMed]
  61. Hahn, M.W.; Kasalický, V.; Jezbera, J.; Brandt, U.; Jezberová, J.; Šimek, K. Limnohabitans curvus gen. nov., sp. nov., a planktonic bacterium isolated from a freshwater lake. Int. J. Syst. Bacteriol. 2010, 60, 1358–1365. [Google Scholar] [CrossRef]
  62. Tamer, A.U.; Aragno, M.; Sahin, N. Isolation and characterization of a new type of aerobic, oxalic acid utilizing bacteria, and proposal of Oxalicibacterium flavum gen. nov., sp. nov. Syst. Appl. Microbiol. 2002, 25, 513–519. [Google Scholar] [CrossRef] [PubMed]
  63. Irgens, R.L.; Gosink, J.J.; Staley, J.T. Polaromonas vacuolata gen. nov., sp. nov., a psychrophilic, marine, gas vacuolate bacterium from Antarctica. Int. J. Syst. Bacteriol. 1996, 46, 822–826. [Google Scholar] [CrossRef] [PubMed]
  64. Xie, C.H.; Yokota, A. Reclassification of Alcaligenes latus strains IAM 12599T and IAM 12664 and Pseudomonas saccharophila as Azohydromonas lata gen. nov., comb. Nov., Azohydromonas australica sp. nov. and Pelomonas saccharophila gen. nov., comb. nov., respectively. Int. J. Syst. Evol. Microbiol. 2005, 55, 2419–2425. [Google Scholar] [CrossRef]
  65. Baldani, J.I.; Baldani, V.D.L.; Dobereiner, J. Characterization of Herbaspirillum seropedicae gen. nov., sp. nov., a Root-Associated Nitrogen-Fixing Bacterium. Int. J. Syst. Evol. Microbiol. 1986, 36, 86–93. [Google Scholar] [CrossRef]
  66. Kalyuzhnaya, M.G.; Bowerman, S.; Lara, J.S.; Lidstrom, M.E.; Chistoserdova, L. Methylotenera mobilis gen. nov., sp. nov., an obligately methylamine-utilizing bacterium within the family Methylophilaceae. Int. J. Syst. Evol. Microbiol. 2006, 56, 2819–2823. [Google Scholar] [CrossRef]
  67. Hiraishi, A.; Hoshino, Y.; Satoh, T. Rhodoferax fermentans gen. nov., sp. nov., a phototrophic purple nonsulfur bacterium previously referred to as the Rhodocyclus gelatinosus-like group. Arch. Microbiol. 1991, 155, 330–336. [Google Scholar] [CrossRef]
  68. Pheng, S.; Lee, J.J.; Eom, M.K. Paucibacter oligotrophus sp. nov., isolated from fresh water, and emended description of the genus Paucibacter. Int. J. Syst. Evol. Microbiol. 2017, 67, 2231–2235. [Google Scholar] [CrossRef]
  69. Kalam, S.; Basu, A.; Ahmad, I.; Sayyed, R.Z.; El-Enshasy, H.A.; Dailin, D.J.; Suriani, N.L. Recent understanding of soil Acidobacteria and their ecological significance: A critical review. Front. Microbiol. 2020, 30, 580024. [Google Scholar] [CrossRef]
  70. Dedysh, S.N.; Ivanova, A.A.; Begmatov, S.H.; Beletsky, A.V.; Rakitin, A.L.; Mardanov, A.V.; Philippov, D.A.; Ravin, N.V. Acidobacteria in fens: Phylogenetic diversity and genome analysis of the key representatives. Microbiology 2022, 91, 685–694. [Google Scholar] [CrossRef]
  71. Chaves, M.G.; Silva, G.G.Z.; Rossetto, R.; Edwards, R.A.; Tsai, S.M.; Navarette, A.A. Acidobacteria subgroups and their metabolic potential for carbon degradation in sugarcane soil amended with vinasse and nitrogen fertilizers. Front. Microbiol. 2019, 10, 1680. [Google Scholar] [CrossRef] [PubMed]
  72. Männistö, M.K.; Kurhela, E.; Tiirola, M.; Häggblom, M.M. Acidobacteria dominate the active bacterial communities of Arctic tundra with widely divergent winter-time snow accumulation and soil temperatures. FEMS Microbiol. Ecol. 2013, 84, 47–59. [Google Scholar] [CrossRef] [PubMed]
  73. Kulichevskaya, I.S.; Suzina, N.E.; Liesack, W.; Dedysh, S.N. Bryobacter aggregatus gen. nov., sp. nov., a peat-inhabiting, aerobic chemo-organotroph from subdivision 3 of the Acidobacteria. Int. J. Syst. Evol. Microbiol. 2010, 60, 301–306. [Google Scholar] [CrossRef]
  74. Ward, N.L.; Challacombe, J.F.; Janssen, P.H.; Henrissat, B. Three genomes from the phylum Acidobacteria provide insight into their lifestyles in soils. Appl. Environ. Microbiol. 2009, 75, 2046–2056. [Google Scholar] [CrossRef] [PubMed]
  75. Okamura, K.; Kawai, A.; Yamada, T.; Hiraishi, A. Acidipila rosea gen. nov., sp. nov., an acidophilic chemoorganotrophic bacterium belonging to the phylum Acidobacteria. FEMS Microbiol. Lett. 2011, 317, 138–142. [Google Scholar] [CrossRef]
  76. Foesel, B.U.; Mayer, S.; Luckner, M.; Wanner, G.; Rohde, M.; Overmann, J. Occallatibacter riparius gen. nov., sp. nov. and Occallatibacter avannae sp. nov., acidobacteria isolated from Namibian soils and emended description of the family Acidobacteriaceae. Int. J. Syst. Evol. Microbiol. 2016, 66, 219–229. [Google Scholar] [CrossRef]
  77. Dobrovolskaya, T.G.; Golovchenko, A.V.; Lysak, L.V.; Yurchenko, E.N. Taxonomic Structure of Bacterial Communities of Rhizospheric Soil under Bogs’ Plants. Mosc. Univ. Soil Sci. Bull. 2020, 75, 93–100. [Google Scholar] [CrossRef]
  78. Pankratov, T.; Dedysh, S.N. Granulicella paludicola gen. nov., sp. nov., G. pectinivorans sp. nov., G. aggregans sp. nov. and G. rosea sp. nov., novel acidophilic, polymer-degrading Acidobacteria from Sphagnum peat bogs. Int. J. Syst. Evol. Microbiol. 2010, 60, 2951–2959. [Google Scholar] [CrossRef] [PubMed]
  79. François, T.; Hehemann, J.-H.; Rebuffet, E.; Czjzek, M.; Michel, G. Environmental and Gut Bacteroidetes: The Food Connection. Front. Microbiol. 2011, 2, 93. [Google Scholar]
  80. Kuramae, E.E. Soil characteristics more strongly influence soil bacterial communities than land-use type. FEMS Microbiol Ecol. 2012, 79, 12–24. [Google Scholar] [CrossRef]
  81. Peralta, R.M.; Ahn, C.; Gillevet, P.M. Characterization of soil bacterial community structure and physicochemical properties in created and natural wetlands. Sci. Total Environ. 2012, 443, 725–732. [Google Scholar] [CrossRef]
  82. Gavande, P.V. Functional characterization of thermotolerant microbial consortium for lignocellulolytic enzymes with central role of Firmicutes in rice straw depolymerization. Sci. Rep. 2021, 11, 3032. [Google Scholar] [CrossRef]
  83. Zhang, B.; Xu, X.Y.; Zhu, L. Structure and function of the microbial consortia of activated sludge in typical municipal wastewater treatment plants in winter. Sci. Rep. 2017, 7, 17930. [Google Scholar] [CrossRef] [PubMed]
  84. Hug, L.A.; Castelle, C.J.; Wrighton, K.C.; Thomas, B.C.; Sharon, I.; Frischkorn, K.R.; Banfield, J.F. Community Genomic Analyses Constrain the Distribution of Metabolic Traits across the Chloroflexi Phylum and Indicate Roles in Sediment Carbon Cycling. Microbiome 2013, 1, 1–17. [Google Scholar] [CrossRef]
  85. Nguyen, L.N. Genome sequencing as a new window into the microbial community of membrane bioreactors-A critical review. Sci. Total Environ. 2020, 704, 135279. [Google Scholar] [CrossRef]
  86. Pankratov, T.A.; Tindall, B.J.; Liesack, W.; Dedysh, S.N. Mucilaginibacter paludis gen. nov., sp. nov. and Mucilaginibacter gracilis sp. nov., pectin-, xylan- and laminarin-degrading members of the family Sphingobacteriaceae from acidic Sphagnum peat bog. Int. J. Syst. Evol. Microbiol. 2007, 57, 2349–2354. [Google Scholar] [CrossRef]
  87. Dahal, R.H.; Kim, J. Pedobacter humicola sp. nov., a member of the genus Pedobacter isolated from soil. Int. J. Syst. Evol. Microbiol. 2016, 66, 2205–2211. [Google Scholar] [CrossRef]
  88. Stams, A.J.; Plugge, C.M. Electron transfer in syntrophic communities of anaerobic bacteria and archaea. Nat. Rev. Microbiol. 2009, 7, 568–577. [Google Scholar] [CrossRef]
  89. Walker, C.B.; de la Torre, J.R.; Klotz, M.G.; Urakawa, H.; Pinel, N.; Arp, D.J.; Stahl, D. Nitrosopumilus maritimus genome reveals unique mechanisms for nitrification and autotrophy in globally distributed marine crenarchaea. Proc. Natl. Acad. Sci. USA 2010, 107, 8818–8823. [Google Scholar] [CrossRef]
  90. Hawkins, A.N.; Johnson, K.W.; Bräuer, S.L. Southern Appalachian peatlands support high archaeal diversity. Microb. Ecol. 2014, 67, 587–602. [Google Scholar] [CrossRef] [PubMed]
  91. Xiang, X.; Wang, R.; Wang, H.; Gong, L.; Man, B.; Xu, Y. Distribution of Bathyarchaeota communities across different terrestrial settings and their potential ecological functions. Sci. Rep. 2017, 7, 45028. [Google Scholar] [CrossRef]
  92. Hou, J.; Wang, Y.; Zhu, P.; Yang, N.; Liang, L.; Yu, T.; Niu, M.; Konhauser, K.; Woodcroft, B.; Wang, F. Taxonomic and carbon metabolic diversification of Bathyarchaeia during its coevolution history with early Earth surface environment. Sci. Adv. 2023, 9, eadf5069. [Google Scholar] [CrossRef] [PubMed]
  93. Bräuer, S.L.; Basiliko, N.; Siljanen, H.; Zinder, S. Methanogenic archaea in peatlands. FEMS Microbiol. Lett. 2020, 367, fnaa172. [Google Scholar] [CrossRef]
  94. Clymo, R.S.; Bryant, C.L. Diffusion and mass flow of dissolved carbon dioxide, methane, and dissolved organic carbon in a 7-m deep raised peat bog. Geochim. Cosmochim. Acta 2008, 72, 2048–2066. [Google Scholar] [CrossRef]
  95. Tfaily, M.M.; Cooper, W.T.; Kostka, J.; Chanton, P.R.; Schadt, C.W.; Hanson, P.J.; Iversen, C.M.; Chanton, J.P. Organic matter transformation in the peat column at Marcell Experimental Forest: Humification and vertical stratification. J. Geophys. Res. Biogeosci. 2014, 119, 661–675. [Google Scholar] [CrossRef]
  96. Morris, P.J.; Waddington, J.M.; Benscoter, B.W.; Turetsky, M.R. Conceptual frameworks in peatland ecohydrology: Looking beyond the two-layered (acrotelm–catotelm) model. Ecohydrology 2011, 4, 1–11. [Google Scholar] [CrossRef]
Figure 1. The location of the pine swamp under study in European Russia according to [35].
Forests 14 02313 g001
Figure 2. Taxonomic classification of bacterial 16S rRNA gene fragments in the libraries from fen profile samples at the phylum level. The list includes taxa constituting >3% in each library.
Forests 14 02313 g002
Figure 3. The ratio of classes of the phyla Pseudomonadota in the studied fen profile.
Forests 14 02313 g003
Figure 4. Heatmap of the distribution of 52 most represented cultivated bacterial genera from fen profile samples. The map includes genera the presence of which in at least one out of ten samples exceeds 1%. The numbers in the diagram indicate the percentage of all sequences in the library of 16S rRNA gene fragments (according to SILVA) in each studied sample.
Forests 14 02313 g004
Figure 5. Taxonomic classification of archaeal 16S rRNA gene fragments in the libraries from fen profile samples at the phyla level.
Forests 14 02313 g005
Figure 6. A heatmap showing the clustering of fen profile samples on the relative abundance of archaeal 16S rRNA gene sequences represented at the class level.
Forests 14 02313 g006
Figure 7. Relative proportion of bacterial 16S rRNA gene fragment sequences represented at the phyla level (at the class level for Pseudomonadota) in libraries from acrotelm and catotelm samples of the studied fen profile. The mean values are given for nine acrotelm horizons and eighteen catotelm horizons. Error bars indicate the standard error of means.
Forests 14 02313 g007
Figure 8. A heatmap showing the clustering of fen profile samples on the relative percentage of iVikodak-derived prokaryotic community functional profiles.
Forests 14 02313 g008
Table 1. The characterization of peat samples in the studied fen profile.
Depth of Sampling (cm)Botanical Composition of PeatDegree of Peat
Decomposition (%)
pHTotal Carbon (%)Total Nitrogen (%)
0–20Woody–sedge355.8483
20–30Woody–sedge375.8492
30–50Woody455.6503
50–100Woody455.6492
100–150Woody455.7503
150–200Woody475.7493
200–250Woody525.6493
250–300Woody–sedge425.7493
300–365Sedge–sphagnum306.0512
Table 2. The alpha diversity indices of prokaryotic communities in the studied fen profile.
LibraryNumber of OTUsChao1 IndexShannon Index
L1 (Litter)2104935.2
L2 (0–20 cm)93432316.7
L3 (20–30 cm)37220505.8
L4 (30–50 cm)2435495.3
L5 (50–100 cm)45918106.0
L6 (100–150 cm)44413946.0
L7 (150–200 cm)146140637.1
L8 (200–250 cm)58216476.3
L9 (250–300 cm)2868775.5
L10 (300–365 cm)25110875.4
Table 3. The relative proportion of sequences of the 16S rRNA gene fragments of bacteria and archaea in the libraries from fen profile samples.
Depth (cm)Litter0–1010–3030–5050–100100–150150–200200–250250–300300–365
Bacteria97.299.899.698.198.990.193.995.396.498.2
Archaea2.80.20.41.91.19.96.14.73.61.8
Disclaimer/Publisher’s Note: The statements, opinions and data contained in all publications are solely those of the individual author(s) and contributor(s) and not of MDPI and/or the editor(s). MDPI and/or the editor(s) disclaim responsibility for any injury to people or property resulting from any ideas, methods, instructions or products referred to in the content.

